
Eur Food Res Technol (2004) 219:500–506
DOI 10.1007/s00217-004-0979-1
O R I G I N A L P A P E R
Jun Wang · Yong-Sen Xiong · Yong Yu
Microwave drying characteristics of potato and the effect
of different microwave powers on the dried quality of potato
Received: 20 April 2004 / Revised: 21 June 2004 / Published online: 6 August 2004
Springer-Verlag 2004
Abstract
Little detailed information is available on the
microwave drying characteristics of potato and the use of
different microwave powers to dry food products. Ex-
periments were conducted to study the microwave drying
characteristics and the dried quality of potato. The study
focuses on describing the microwave drying characteris-
tics of potato and discussing the effect of sample thick-
ness, drying power and mass. The results show that if the
power level increases, the mass load decreases and the
thickness of the sample decreases, the dehydration rate
increases and the drying energy consumption decreases.
There are two falling rate periods during microwave
drying of potato: the first falling rate period is for a
moisture content of more then 1.1 (dry basis, DB); the
second falling rate period is for a moisture content of less
than 1.1 (DB). The same water loss will consume more
energy when the moisture content is less than 1.1 (DB). A
two-stage drying process was employed during micro-
wave drying of potato. The microwave power of the first
drying stage differed form that of the second drying stage.
The moisture content of the breakpoint for the conversion
of the first drying stage into the second drying stage is a
moisture content of 1.1 (DB). A quadratic orthogonal
regression experiment was conducted, and the effects of
slice thickness, the first drying load power and the second
drying load power on sensory quality, the rehydration
ratio and the energy consumption rate were established.
The slice thickness, the first drying load power and the
second drying load power linearly affected the three in-
dices. The effect of the product of the second drying load
power and the potato slice thickness on the rehydration
ratio and the energy consumption rate is significant. The
optimum drying parameter combination for the three in-
dices was obtained. The rehydration ratio of the dried
products decreased with an increase of the second drying
load power and the slice thickness. The concave curves of
the sensory quality versus the three factors were shown.
Keywords
Microwave · Drying · Potato · Rehydration ·
Sensory quality · Energy consumption
Introduction
Drying is one of the oldest methods of food preservation
and it is a difficult food processing operation mainly
because of undesirable changes in the quality of water
removal from food products in conventional air drying
which may cause serious damage to the dried product.
The major disadvantages of hot air drying of foods are
low energy efficiency and the long drying time during the
falling rate period. Because of the low thermal conduc-
tivity of food materials in this period, heat transfer to the
inner sections of foods during conventional heating is
limited. The desire to eliminate this problem, to prevent
significant quality loss, and to achieve fast and effective
thermal processing has resulted in the increasing use of
microwaves for food drying. Microwave drying is rapid,
more uniform and more energy-efficient compared with
conventional hot air drying. In this case, the removal of
moisture is accelerated and, furthermore, heat transfer to
the solid is slowed down significantly owing to the ab-
sence of convection. And also because of the concentrated
energy of a microwave system, only 20–35% of the floor
space is required, compared with conventional heating
and drying equipment. However, microwave drying is
known to result in a poor-quality product if not properly
applied [1, 2].
For microwave applications, a two-stage drying pro-
cess involving initial forced-air convective drying, fol-
lowed by microwave finish-drying, has been reported to
give better product quality with considerable savings in
energy and time. Water accounts for the bulk of the di-
electric component of most food systems, especially high-
moisture fruits and vegetables; hence, these products are
J. Wang (
)
) · Y.-S. Xiong · Y. Yu
Department of Agricultural Engineering,
Zhejiang University,
268 Kaixuan Road, 310029 Hangzhou, China
e-mail: jwang@zju.edu.cn
Tel.: +86-571-86971350
Fax: +86-571-86971350

very responsive to microwave applications and will ab-
sorb the microwave energy quickly and efficiently as long
as there is residual moisture. The microwave application
for drying therefore offers a distinct advantage, i.e., en-
ergy absorption proportional to the residual moisture
content. Proteins, lipids and components can also absorb
microwave energy, but are relatively less responsive [3].
A second advantage of the application of microwaves
for drying vegetables is internal heat generation. Drying
causes the moisture to recede inwards from the surface. In
conventional systems, heat that is applied at the surface
has to be carried through a moisture-resistant dryer layer
for the evaporation of water at the receding water front. In
a microwave drying system, microwaves can easily pen-
etrate the inert dry layers and are absorbed directly by the
moisture at the water front. The quick energy absorption
causes rapid evaporation (boiling) of water, creating an
outward flux of rapidly escaping vapor. In addition to
improving the rate of drying, this outward flux can help to
prevent the collapse (shrinkage) of tissue structure, which
prevails in most conventional air-drying techniques.
Hence better rehydration characteristics may be expected
in microwave-dried products [4].
In recent years, microwave drying has gained popu-
larity as an alternative drying method for a variety of food
products such as fruits, vegetables, snack foods and dairy
products. Several food products have been successfully
dried by the microwave-vacuum application and/or by a
combined microwave-assisted convection process by,
among others, Kim and Bhowmik [5] for plain yogurt,
Yongsawatdigul and Gunasekaran [6] for cranberries, Lin
et al. [7] for carrot slices, Drouzas and Saravacos [8] for
model fruit gels, Al-Duri and McIntyre [4] for skimmed
milk, whole milk, casein powders, butter and fresh pasta,
Bouraout et al. [9] for potato slices, Tulasidas et al. [10]
for grapes, Funebo and Ohlsson [11] for apple and
mushroom, and Ren and Chen [12] for American ginseng
roots.
It has also been suggested that microwave energy
should be applied in the falling rate period or at a low
moisture content for finish-drying [11, 13]. The reason for
this is essentially economic. Owing to high cost, micro-
wave drying cannot compete with conventional air dry-
ing; however, microwaves may be advantageous in the
last stages of air drying, because the least efficient portion
of a conventional drying system is near the end, when two
thirds of the time may be spent removing the last one third
of the moisture content [4].
However, the microwave drying characteristics of
potato and microwave drying conducted using different
input powers have been seldom reported, i.e., little de-
tailed information is available on the use of different
microwave powers to dry food products, such as a two-
stage drying process within the microwave drying pro-
cess.
The objectives of this study were (1) to describe mi-
crowave drying characteristics of potato and to discuss the
influence of microwave power, mass load and slice
thickness on drying characteristics and energy consump-
tion, (2) to determine the effect of the first drying power,
the second drying power and the potato slice thickness on
sensory quality, the rehydration ratio and the energy
consumption rate, and (3) to obtain the optimum micro-
wave drying parameter combination for sensory quality,
the rehydration ratio and the energy consumption rate.
Materials and methods
Material
Ripe potato (Zhe-Agriculture no. 2) with an initial moisture content
of 5.06 kg H
2
O/kg dry solids was obtained from a local super-
market and was stored at 4€0.5 C. Prior to drying, samples were
taken out of storage, hand peeled, and cut into 2.94-, 4-, 7-, 10-,
11.06-mm-thick slices, with an error of €0.1 mm, with a cutting
machine. All the potatoes used for drying were from the same
batch. The initial moisture content was determined using a vacuum
oven for 70 C, 3 kPa, a heating time of 12 h (GB/T8858-88,
Chinese National Standard).
Drying equipment
The drying apparatus used consisted of a laboratory microwave
oven (WEG-800A, Jinan, China), which operated at 2,450 MHz.
The energy emission was microprocessor-controlled from 10 to
1,000 W in 10-W increments. Outlets were provided on the upper-
left side of the oven to allow the introduction of temperature sen-
sors, while another inlet was provided at the top right of the oven to
allow the introduction of a flow of air and a thermocouple. The
dimensions of the microwave cavity were 345340225 mm. The
microwave oven was operated by a control terminal, which could
control both the microwave power level and the emission time (1 s–
100 h).
Drying indices
Dehydration rate
The dehydration rate was the value of the dehydration (dry basis,
DB) within the drying time, and it was expressed as follows:
Dehydration rate
¼
dehydrated moisture content
measured timeinterval
:
Rehydration ratio
The dried samples were ground manually and were immediately
loaded (about 10 g each) into small aluminum sample dishes.
Distilled water (500 ml) was transferred into a glass jar and a tripod
was also placed in the jar. The dishes were placed on the tripod in
the jar and this was then tightly closed and kept at 20 C for
equilibration. The dishes were weighed periodically until equilib-
rium was reached. The rehydration ratio was used to express the
rehydration of the dried potato [14, 15, 16]:
Rehydration ratio
¼
mass after rehydration
mass before rehydration
:
Sensory quality
A panel of five trained judges evaluated the quality characteristics
of all the dried potatoes. The overall quality of the intact dried
potatoes was evaluated on a scale by the sensory quality including
visual color, uniformity of appearance and blebs (Table 1).
501
Energy consumption rate
Energy consumption rate
¼
energyconsumed
dehydrated moisture content
:
The energy consumption rate was expressed as ratio of the
energy consumed (kilowatt hours) to the amount of water lost
(kilograms).
Drying procedure
The factors investigated in microwave drying were the microwave
power intensity (100, 160 and 240 W) at constant sample thickness,
and the sample load. One dish, containing the sample, was placed at
the center of a turntable fitted inside (bottom) the microwave cavity
during treatment for even absorption of microwave energy. The
turntable was necessary to achieve the optimum oven performance
and to reduce the levels of the microwaves reflected onto the
magnetron. The drying was performed according to a preset power
and time schedule. Moisture loss was recorded at 5-min intervals
during drying and was measured by taking out and weighing the
dish on a digital balance (JY10001, 1,000 g, €0.01 g). To remove
water vapor an outlet fan was set up in the microwave oven. An
outlet air velocity of 1 m/s was used for the experiment. When the
material reached a constant weight, the equilibrium moisture con-
tent was assumed to have been reached. Attention was paid to
ensure that the sample was not charred. Experiments were con-
ducted in triplicate.
Experimental design
To investigate the effect of changing the microwave power on the
quality of dried potato, the drying process was divided into a two-
stage drying process during microwave drying. The microwave
power of the first drying stage differed form that of the second
drying stage. The moisture content of the breakpoint where the first
drying stage was converted into the second drying stage was 1.1
(DB, the inflexion points where the high dehydration rate trans-
formed into the low dehydration rate are shown in Figs. 1, 2, 3, 4, 5
and 6).
Table 1
Evaluated scale for
sensory quality (Y
2
, full scale
31). Total: Y
2
=4l
1
+3l
2
+2l
3
Attribute
Evaluated value
Significance
Visual color (l
1
)
Yellow (4), slightly yellow (3), snuff color (2),
brown (1)
4
Uniformity of appearance (l
2
)
Uniform (3), slightly uniform (2), not uniform (1)
3
Bleb appearance (l
3
)
None (3), smaller (2), bigger (1)
2
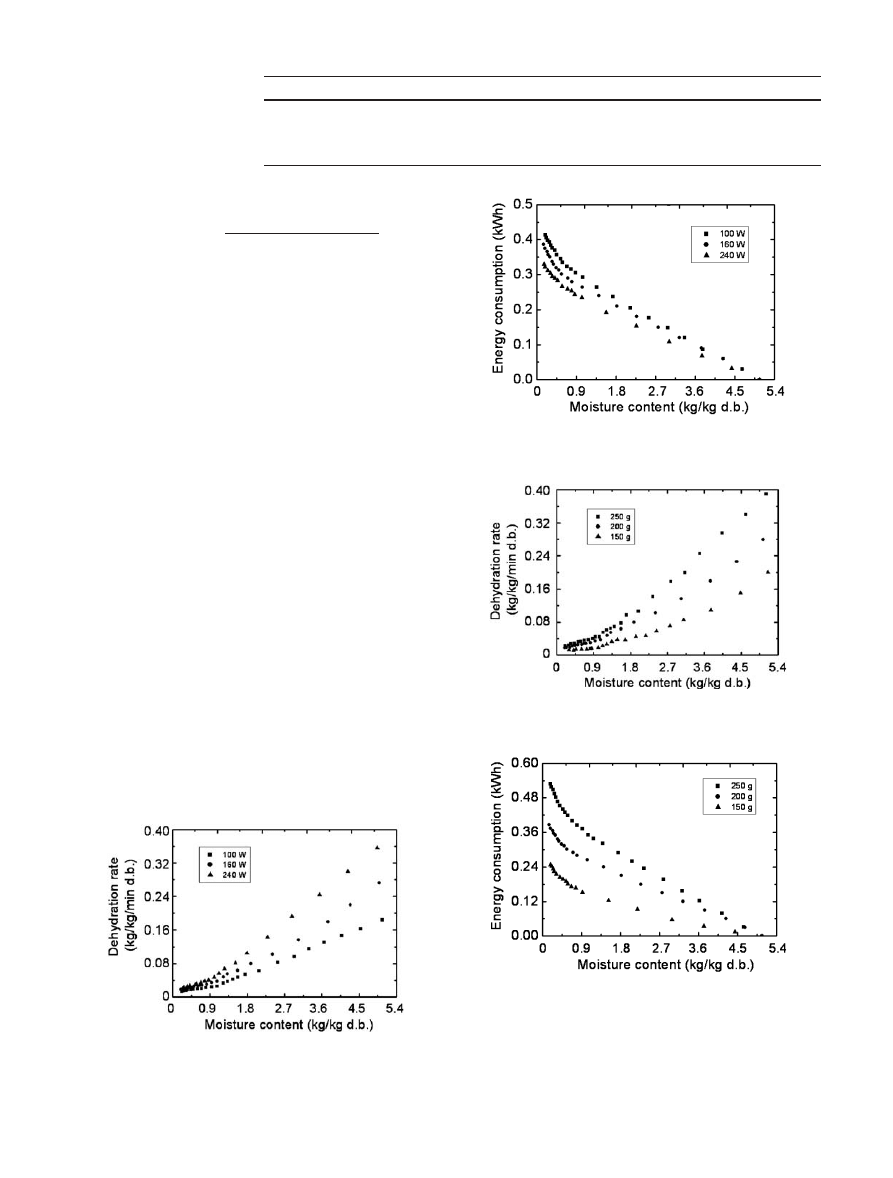
Fig. 1
Dehydration rate versus moisture content for different
power inputs (mass 200 g, sample thickness 7 mm)
Fig. 2
Energy consumption versus moisture content for different
power inputs (mass 200 g, sample thickness 7 mm)
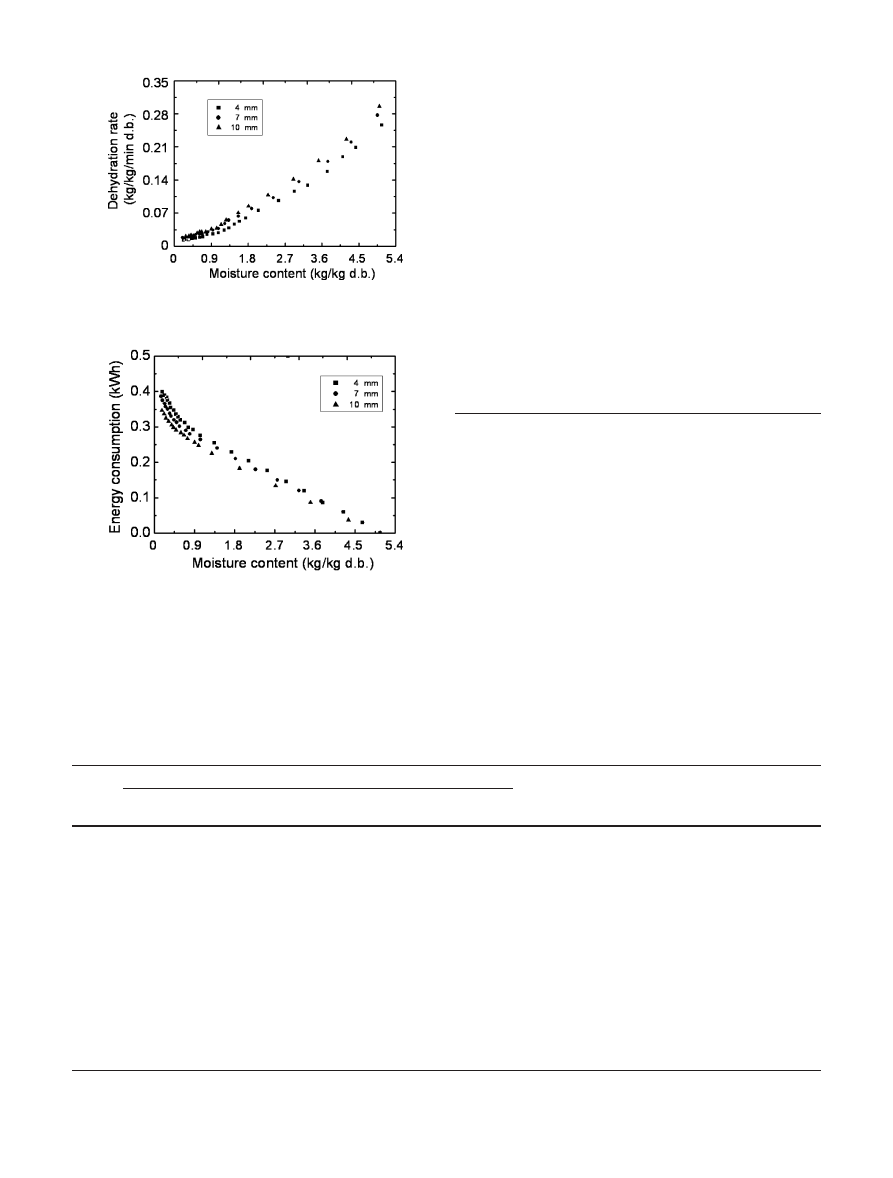
Fig. 3
Dehydration rate versus moisture content for different mass
loads (power 160 W, sample thickness 7 mm)
Fig. 4
Energy consumption versus moisture content for different
mass loads (power 160 W, sample thickness 7 mm)
502
The quadratic orthogonal regression design (QORD) was em-
ployed in this study [17]. The QORD consisted of a three-factored
factorial with five levels. The factors were the first drying load
power (the influences of mass load and drying power were con-
sidered together, 0.88–3.32 kW/kg), the second drying load-power
(0.88–3.32 kW/kg), and the potato slice thickness (2.94–
11.06 mm). The matrix for the QORD optimization experiment is
summarized in Table 2. The QORD has eight experimental points
in a cube (run nos. 1–8), six star points with an axial distance of
1.353 (run nos. 9–14) and three replications at the central point of
the design (run nos. 15–17) for experimental error determination. A
full second-order polynomial model of the type shown in Eq. (1)
was used to evaluate the drying indices (response variable, Y) as a
function of dependent variables (actual level, Z); namely the first
drying load power (denoted by subscript 1), the second drying load
power (denoted by subscript 2), the potato slice thickness (denoted
by subscript 3) and their interactions.
Y
¼ b
0
þ B
1
Z
1
þ B
2
Z
2
þ B
3
Z
3
þ b
11
Z
2
1
þ b
33
Z
2
3
þ b
12
Z
1
Z
2
þ B
13
Z
1
Z
3
þ bZ
2
Z
3
:
ð1Þ
The analysis of the variance for the treatment of the main ef-
fects was conducted using the SAS software [18]. Multiple com-
parison of the means was made using Duncan’s multiple range test.
All statistical significance was determined at the 10% significance
level (p<0.1).
Results and discussion
Dehydration characteristic
Effect of microwave power
The effect of changing the power input in the microwave
oven on the dehydration characteristics for a load of 200 g
and a potato thickness of 7 mm is shown in Fig. 1. It can
be seen that dehydration rate increases with high power
levels at the same moisture content. The results indicated
that mass transfer within the sample is rapid during the
higher microwave power heating because more heat is
generated within the sample [7]. A constant rate period
was not observed in drying of the potato samples; hence,
the entire drying process for the samples occurred in the
range of the falling rate period in this study. However,
there are two falling rate periods when using microwave
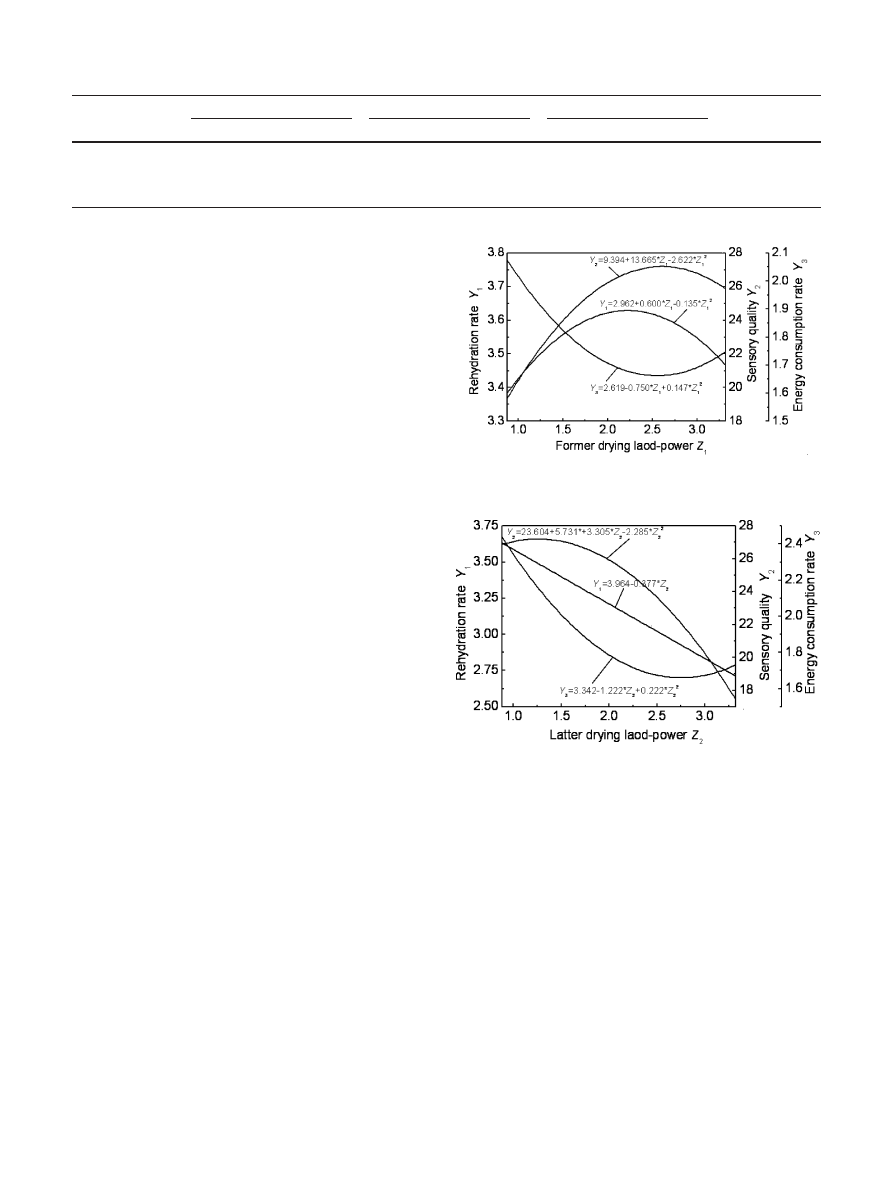
Fig. 5
Dehydration rate versus moisture content for different
sample thicknesses (power 160 W, mass 200 g)
Fig. 6
Energy consumption versus moisture content for different
sample thicknesses (power 160 W, mass 200 g)
Table 2
Selected factors and their levels for the first factorial design with the quadratic orthogonal regression design
Run
Standardized (coded) levels
Sensory
quality
Rehydration
ratio
Energy consumption
rate
First drying load
power
Second drying load
power
First drying time
1
1
1
1
16
2.42
1.746
2
1
1
1
17
2.53
1.816
3
1
1
1
23
3.34
2.105
4
1
1
1
24
3.42
2.233
5
1
1
1
13
2.85
1.902
6
1
1
1
14
2.98
1.995
7
1
-1
1
19
3.2
2.577
8
1
-1
1
17
3.33
2.655
9
1.353
0
0
19
3.34
2.42
10
1.353
0
0
27
2.48
1.868
11
0
1.353
0
30
3.54
2.744
12
0
1.353
0
17
2.64
1.767
13
0
0
1.353
23
3.39
1.951
14
0
0
1.353
23
3.02
1.807
15
0
0
0
24
3.12
1.85
16
0
0
0
23
3.1
1.821
17
0
0
0
23
3.11
1.845
503

drying of potato: the first falling rate period for a moisture
content of more than 1.1 (DB); the second falling rate
period for a moisture content of less than 1.1. This is in
agreement with the report that the drying of bananas takes
place in the falling rate period [19]. The moisture content
of 1.1 (DB) reflects the moisture content of the inflexion
point where the high dehydration rate transformed into the
low dehydration rate. The initial acceleration of drying
may be caused by an opening of the physical structure
allowing rapid evaporation and transport of water [13].
When considering the influence of the internal struc-
tural changes on potato drying, it must be considered that
there are three possible ways for the movement of water
in and out of cells [20]: transmembrane transport (through
plasma lemma membrane boundaries), symplastic trans-
port (via cytoplasmic strands or plasmodesmatas) and
the cell wall pathway. Tyree [21] reported the cell wall
pathway to be the preferred pathway for small nonionic
species like water and Molz and Ikenberry [22] concluded
that a significant portion of the water flux traversing a
plant tissue could occur in the cell wall. During the first
drying period, the moisture content is greater in potato,
and the movement of water is mostly by the transmem-
brane transport route and the cell wall pathway. The de-
hydration rate is higher, but deceased rapidly with mois-
ture content. In the second drying phase, the moisture
content is lower in potato, and the movement of water is
mostly by the symplastic transport route and the dehy-
dration rate is lower.
Efforts were made to study the effect of the power
input on energy consumption. The relationship between
energy consumption and moisture content is shown in
Fig. 2. Unexpectedly, the energy consumption is different
for the three power inputs when the same amount of
moisture is lost. The lower microwave drying power
consumes more energy. One of the many reasons might
be that the drying time is longer under lower power and
this results in an increase in the energy consumption.
The same water loss will consume more energy and the
steepest curve is when the moisture content is less than
1.1 (DB) (Fig. 2). In the second falling rate period, the
moisture content is lower in potato, the movement of
water is mostly by the symplastic transport route and
more energy is consumed when the same amount of water
is lost. The moisture content of 1.1 reflects the moisture
content at the inflexion point where the first falling rate
period transformed into the second falling rate period.
Effect of mass load
The effect of changing the mass load in the microwave
oven on the dehydration characteristic for a power input
of 160 W and a potato thickness of 7 mm is shown in
Fig. 3. It can be seen that dehydration rate increases with
a smaller mass load at the same microwave power, and
two falling rate periods were found: the first falling rate
period for a moisture content of more than 1.1; the second
falling rate period for a moisture content of less than 1.1.
The energy consumption changes with moisture con-
tent, as shown in Fig. 4. The energy consumption in-
creases with decreasing moisture content. The energy
consumption increases with the greater mass load because
more water is lost. When the moisture content is more
than 1.1 (DB), the energy consumption increases lineally
and the curves of the energy consumption are steeper for a
moisture content of less than 1.1.
Effect of thickness
Efforts were made to study the effect of the sample
thickness (4, 7, 10 mm) on drying at constant input power
(160 W) and mass load 200 g (Fig. 5). In contrast to hot
air drying, the thicker sample dried more rapidly than the
thinner one. This is because of sudden and volumetric
heating generating high pressure inside the potatoes, re-
sulting in boiling and bubbling of the samples [6, 18, 23].
Owing to that fact, the 10- and 7-mm-thick samples
spread on the bottom of the dishes as a thin layer, a large
drying surface area formed and, hence, drying accelerated
(data not shown). Only the thin sample (4 mm) main-
tained its shape without spreading and it took more time
to dry this sample compared with the others.
Similarly, there are two falling rate periods for dif-
ferent thicknesses: the first falling rate period is for a
moisture content of more than 1.1 (DB; the second falling
rate period is for a moisture content of less than 1.1 (DB).
The moisture content versus electrical energy con-
sumption curves for microwave drying of potato slices for
a load of 200 g and 160 W are shown in Fig. 6. It can be
seen that the electrical energy consumption curves of the
three potato samples of different thickness were different.
The thin sample used more energy than the thick sample.
This is because the rehydration ratio is low and the drying
time is long for the thin sample.
Similarly, the moisture lost will consume more energy
and the steeper curve represents when the moisture con-
tent is less than 1.1 (DB). Compared with the first drying
stage, more energy was consumed during the second
drying stage for a moisture content of less than 1.1.
Models of the influence of the main factors on the drying
indices
Equation of influence
To investigate the effect of changing the microwave
drying power on the dried product quality, drying was
conducted using a two-stage drying process involving an
initial power input followed by a changed power input,
and the effects of the first drying load power, the second
drying load power and the potato slice thickness on sen-
sory quality, the rehydration ratio and the energy con-
sumption rate were investigated using response surface
analysis. Regression models were generated and the pa-
rameters that were not significant were dropped from the
504
regression equation. Regression analysis showed that the
effects of the experimental variables on the three indices
were significant. The significance level, p<0.05, indicates
the suitability of the second-order polynomial to predict
the three indices. Equations (2), (3) and (4) were em-
ployed in this study.
For the rehydration ratio, Eq. (2) was used (p=0.047):
Y
1
¼ 3:040 þ 0:751Z
1
þ 0:027Z
2
0:022Z
3
0:170Z
1
Z
2
0:135Z
2
1
:
ð2Þ
For sensory quality, Eq. (3) was used (p=0.0294):
Y
2
¼ 5:769 þ 13:6652Z
1
þ 5:7312Z
2
þ 3:36Z
3
2:622Z
2
1
2:285Z
2
2
0:236Z
2
3
:
ð3Þ
For the energy consumption rate, Eq. (4) was used
(p=0.029):
Y
3
¼ 5:072 0:9844Z
1
þ 1:439Z
2
0:016Z
3
0:085Z
1
Z
2
þ 0:147Z
2
1
þ 0:222Z
2
2
:
ð4Þ
In the three equations, the effect of the three factors on
the three indices is significant. The effect of the product
of the second drying load power and the potato slice
thickness on the rehydration ratio and the energy con-
sumption rate is significant.
Objection optimizing calculation
In order to investigate the optimum drying parameter
combination, it was necessary that the three indices were
optimized for the maximum value or the minimum value.
Optimization was done by employing canonical anal-
ysis [17], where the levels of the variables (within the
experimental range) were determined to obtain the max-
imum sensory quality and rehydration ratio and the
minimum energy consumption rate. The optimum drying
parameter combination was obtained by using the SAS
software. The results of the calculation are shown in
Table 3.
For the three indices, the optimum drying parameter
combination is different. The first drying load power is
slightly higher for sensory quality than for the other in-
dices. The second drying load power should be lower for
the rehydration ratio and higher for the energy con-
sumption rate. The potato slice should be thick for the
energy consumption rate and thin for the rehydration ra-
tio.
Effect of each factor on the drying indices
To analyze the effect of each factor on the three indices,
by substituting the two other optimum parameters into
Eqs. (2), (3) and (4), the effects of each factor on the three
indices were obtained and are shown in Figs. 7, 8 and 9.
The effect of the first drying load power on the three
indices is shown in Fig. 7 and the curves are quadratic
polynomials. It is seen that rehydration ratio and the
sensory quality are greatest at the first drying load powers
of 2.23 and 2.606 kW/kg, respectively. The energy con-
sumption rate was lowest at 2.551 kW/kg.
The effect of the second drying load power on the
three drying indices is shown in Fig. 8. The rehydration
ratio decreases with an increase of the drying load power.
The sensory quality is highest for a drying load power of
Table 3
The optimum parameter combination for the three drying indices
Indices
First drying load power
Second drying load power
Potato slice thickness
Optimum values
of the indices
Coded value
Actual value
Coded value
Actual value
Coded value
Actual value
Sensory quality
0.562
2.606
0.940
1.254
0
7
27.197
Rehydration ratio
0.145
2.23
1.353
0.88
1.353
2.94
3.632
Energy consump-
tion rate
0.501
2.551
0.721
2.749
1.353
11.06
1.663
Fig. 7
Effect of the first drying load power on the three indices
Fig. 8
Effect of the second drying load power on the three indices
505
1.254 kW/kg. The energy consumption is lowest for a
drying load power of 2.749 kW/kg.
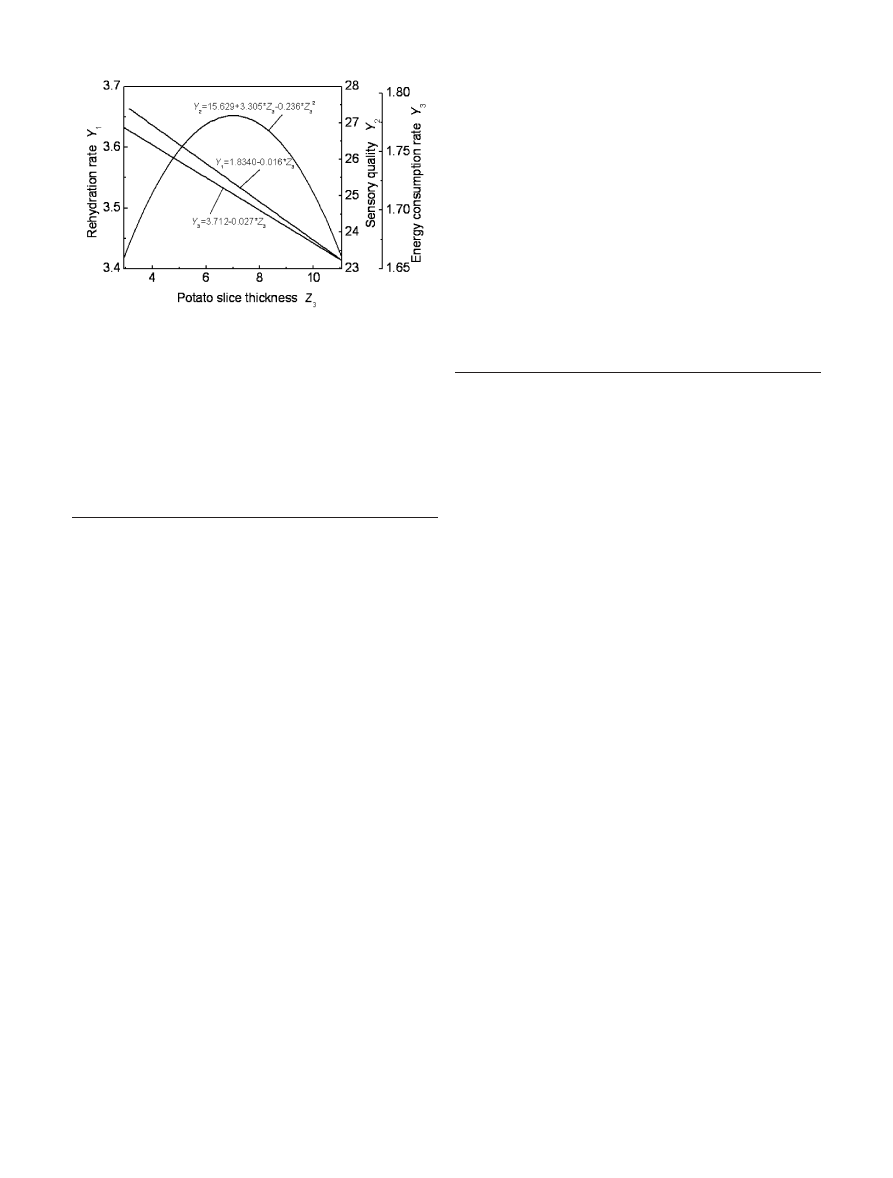
The effect of the potato slice thickness on the three
indices is shown in Fig. 9. The dehydration ratio and the
energy consumption decrease with the increase of the first
drying time. The sensory quality is highest for a drying
load power of 1.254 kW/kg.
Conclusions
1. As the microwave power level increased, the mass
load decreased and the thickness of the sample in-
creased, the dehydration rate increased and the drying
energy consumption decreased.
2. There are two falling rate periods when using micro-
wave drying of potato: the first falling rate period for a
moisture content of more than 1.1 (DB); the second
falling rate period for a moisture content of less than
1.1 (DB). The same water loss will consume more
energy and the steepest curve resulted when the
moisture content was less than 1.1 (DB).
3. Slice thickness, the first drying load power and the
second drying load-power linearly affected sensory
quality, the rehydration ratio and the energy con-
sumption rate. The effect of the product of the first
drying load-power and the potato slice thickness on the
rehydration ratio and the energy consumption rate is
significant. The optimum drying parameter combina-
tion for the three indices was obtained.
4. For the three indices, the optimum drying parameter
combination is different. The first drying load power is
slightly higher for sensory quality than for the other
indices. The second drying load power should be lower
for the rehydration ratio and higher for the energy
consumption rate. The potato slices should be thick for
the energy consumption rate and thin for the rehy-
dration ratio.
5. The rehydration ratio of the dried products decreased
with an increase of the second drying load-power and
the slice thickness. The curves of sensory quality
versus the three factors were concave.
Acknowledgement
The authors acknowledge the Chinese Spe-
cialized Research Fund for the Doctorate of High Education
through project 20020335052.
References
1. Yongsawatdigul J, Gunasekaran S (1996) J Food Process Pre-
serv 20:121–143
2. Drouzasm AE, Dchubert H (1996) J Food Eng 28:203–209
3. Mudgett TE, Westphal WB (1989) J Microwave Power 24:33–
37
4. Al-Duri B, McIntyre S (1992) J Food Eng 15:139–155
5. Kim SS, Bhowmik SR (1995) J Food Eng 24:137–148
6. Yongsawatdigul J, Gunasekaran S (1996) J Food Process Pre-
serv 20:145-156
7. Lin TM, Durance TD, Scaman CH (1998) Food Res Int 4:111–
117
8. Drouzas AE, Saravacos GD (1999) J Food Eng 39:117–122
9. Bouraout M, Richard P, Durance T (1994) J Food Process Eng
17:353–363
10. Tulasidas TN, Raghavan GSV, Norris ER (1996) J Food Pro-
cess Eng 19:15–25
11. Funebo T, Ohlsson T (1998) J Food Eng 38:353–367
12. Ren G, Chen F (1998) J Food Eng 35:433–443
13. Kostaropoulos AE, Saravacos GD (1995) Journal of Food Sci
60:344–347
14. Jayaraman KS, Das Gupta DK (1990) Int Journal Food Sci
Technol 25:47–60
15. Farkas BE, Singh RP (1991) J Food Sci 56:611–615
16. Lewicki PP (1998) J Food Eng 36:81–87
17. Khuri AI, Cornell JA (1989) Response surfaces: designs and
analyses. Dekker, New York, pp 19-69
18. SAS Institute (1999) SAS system release 6.12. Cary C27513
USA
19. Maskan M (2000) J Food Eng 44:71-78
20. Wang J, Chao Y (2002) J Food Eng 52:83–88
21. Tyree MT (1970) J Theor Biol 26:181–214
22. Molz FJ, Ikenberry E (1974) Am Plant Sci 38:699–704
23. Wang J, Zhang JP, Wang JP, Xu NZ (1999) Drying Technol
19:1241–1245
Fig. 9
Effect of thickness on the three indices
506
Wyszukiwarka
Podobne podstrony:
The thin layer drying characteristics of hazelnuts during roasting
Microwave drying characteristics of spinach
Convective air drying characteristics of thin layer carrots
Drying, shrinkage and rehydration characteristics of kiwifruits during hot air and microwave drying
Characterization of microwave vacuum drying and hot air drying of mint leaves (Mentha cordifolia Opi
Drying kinetics and rehydration characteristics of microwave vacuum and convective hot air dried mus
Energy Consumption and Colour Characteristics of Nettle Leaves during Microwave, Vacuum and Convecti
Drying characteristics and drying quality of carrot using a two stage microwave process
Drying kinetics and drying shrinkage of garlic subjected to vacuum microwave dehydration (Figiel)
Effects of the Great?pression on the U S and the World
71 1021 1029 Effect of Electron Beam Treatment on the Structure and the Properties of Hard
Drying kinetics and drying shrinkage of garlic subjected to vacuum microwave dehydration (Figiel)
Detection and Molecular Characterization of 9000 Year Old Mycobacterium tuberculosis from a Neolithi
Raifee, Kassaian, Dastjerdi The Application of Humorous Song in EFL Classroom and its Effect onn Li
Bondeson; Aristotle on Responsibility for Ones Character and the Possibility of Character Change
2001 In vitro fermentation characteristics of native and processed cereal grains and potato
Bell locality and the nonlocal character of nature
więcej podobnych podstron