

European Commission
Directorate-General for Economic and Financial Affairs
Interim Forecast
February 2012
Press conference of 23 February 2012


OVERVIEW
Interim forecast, February 2012
1
The EU is set to experience stagnating GDP this year, and the euro area will
undergo a mild recession. Several factors weigh on the outlook for the EU
economy more heavily than forecast last autumn. In particular, the growth
momentum seen at the end of 2011 has weakened more than previously
expected, while the global economy has softened. Moreover, negative
feedback loops between weak sovereign debtors, fragile financial markets
and a slowing real economy do not yet appear to have been broken. Financial
markets, however, are displaying signs of stabilisation, and some soft and
hard indicators point to a more positive outlook. Member States have adopted
additional measures to pursue necessary fiscal consolidation as the sovereign-
debt crisis in some euro-area Member States lingers on, although this is likely
to weigh on growth perspectives in the short run.
The temporary weakening of global demand expected in the autumn forecast
is ongoing, though with substantial differences across regions. Among the
advanced economies, the US has recently shown signs of moderately stronger
growth than forecast in the autumn, as the labour market improved and
consumption rebounded. In Japan, by contrast, the economy has ended 2011
on a weak note, although the perspective of moderate growth in 2012 remains
intact. Many emerging market economies have been affected by the crisis in
Europe through weaker exports and reduced capital inflows. Moreover, oil
prices have not continued the measured decline expected in the autumn, but
have rebounded by 13% in euro terms since the autumn forecast. Overall, and
broadly in line with the autumn forecast, global GDP and world trade growth,
having weakened since spring 2011, are expected to recover only gradually in
2012.
Financial market indicators have shown signs of stabilisation since the
autumn, with some easing of pressures on sovereign yields, although spreads
remain at high levels for some Member States. While credit conditions for
the private sector have been tightening, the latest measures taken by the ECB,
in particular the provision of ample liquidity with a maturity of three years
and the broadening of eligible collateral, have eased banks' funding stress and
appear to have improved risk sentiment in financial markets more broadly.
Looking at the euro area and the EU as a whole, evidence of a continued
credit deceleration is building up, but the risk of an outright credit crunch in
the euro area as a whole has decreased. Despite the recent tightening of credit
conditions, credit supply is not expected to be a major constraint on
investment and consumption as long as credit demand also remains weak.
However, credit supply conditions and credit growth differ strongly across
Member States. Finally, despite initial concerns, bank recapitalisation is
progressing. The European Banking Authority expects that banks will reach
the target capital ratio set for end-June 2012 with only limited recourse to
deleveraging.
The loss of economic momentum towards the end of 2011 was stronger than
anticipated. After a weak third quarter, the economy contracted in the fourth
quarter – by 0.3% in the EU and the euro area according to Eurostat's flash
estimate. Domestic demand was lacklustre in the third quarter of 2011 and –
as shown by the continued fall in confidence in the autumn and available hard
indicators – probably contributed substantially to the contraction in the
fourth. Most recent readings of confidence indicators, however, have
stabilised or even rebounded. Together with the improvement in financial
The economic
situation has further
deteriorated around
the turn of the year,
but some signs of
stabilisation have
appeared lately.
Support from the
global economy has
waned as expected in
autumn.
Financial markets
have stabilised, but
the situation remains
vulnerable.
The EU economy is
expected to have
started the year in
technical recession,
with a return to
recovery in the
second half of 2012.

Interim forecast, February 2012
2
markets, and significant recent policy action at both EU and Member-State
level, this suggests that the drag on private investment and consumption from
the uncertainty related to the sovereign-debt crisis should fade little by little.
Global trade is also expected to recover gradually. Overall, some further
contraction is forecast for early 2012 in both the EU and the euro area, and a
return to the kind of modest recovery that is typical for the aftermath of
financial crises is expected only from the second half of the year.
GDP growth for 2012 is now expected to be zero for the EU and -0.3% for
the euro area. This is a downward revision compared to the autumn 2011
forecast of 0.6 percentage point and 0.8 percentage point, respectively. The
quarterly profile has been lowered for all quarters, most strongly around the
turn of the year, in view of the weaker-than-expected flash estimate by
Eurostat for the fourth quarter of 2011. A recovery is still forecast for the
second half of the year, but is expected to be more modest and to occur later
than forecast in the autumn. This reflects a more gradual return of business
and consumer confidence, and therefore investment and consumption, as well
as additional fiscal consolidation in a number of Member States.
Although growth differentials remain accentuated, the broad basis of
downward revisions suggests that there is no clear core/periphery pattern in
the euro area. While the autumn forecast foresaw negative annual GDP
growth in 2012 only for Greece and Portugal, this is now forecast also for
Belgium, Spain, Italy, Cyprus, the Netherlands, Slovenia and Hungary.
However, growth differentials are set to remain substantial. The largest
downward revisions to annual growth (of one percentage point or more) were
made for Estonia, Spain, Greece, Italy, and the Netherlands. By contrast, the
forecasts were kept unchanged or revised only by little (less than ¼
percentage point) for Germany, France, Austria, Slovakia, Denmark, Poland
and the UK.
Energy inflation has started to decrease only recently, but crude oil prices
expressed in euro have actually increased since the autumn. At the same time,
core inflation has stabilised at about 2¼ % in the EU and 2% in the euro area.
Indirect tax increases have further contributed to headline inflation, by up to
½ percentage point in the EU and ¼ percentage point in the euro area in
recent months. As a result, headline HICP inflation has decreased more
gradually than earlier forecast. It stood at 3% in the EU in December 2011
and, according to Eurostat's flash estimate, at 2.7% in January 2012 in the
euro area. In view of trends in commodity futures and the expected
weakening of GDP, inflation is expected to continue its slow decline over the
coming quarters. For 2012 as a whole, HICP inflation is now forecast to fall
to 2.3% in the EU and 2.1% in the euro area.
Some of the risks identified in the autumn forecast have materialised.
Nonetheless the balance of risks to GDP growth remains tilted to the
downside amid still-high uncertainty. This interim forecast continues to rely
on the assumption that adequate policy measures are decided and
implemented at the EU and Member-State level to overcome the sovereign-
debt crisis. This assumption underpins the forecast of a gradual return of
confidence and a recovery in investment and consumption in the second half
of 2012, which is however set to occur later and be more modest than
assumed in the autumn. Moreover, the financial market situation remains
fragile. If the sovereign-debt crisis were to rebound massively, with a broad
surge in risk premia and spillovers across countries, severe credit rationing
and a collapse of domestic demand could ensue. Such an outcome would
The 2012 GDP forecast
for the EU and the
euro area is revised
down.
Growth differentials
across Member States
remain pronounced.
Inflation has remained
more persistent than
forecast, but is
expected to ease
gradually.
Risks while remaining
tilted to the downside,
have become more
balanced lately.

Interim forecast, February 2012
3
most likely trigger a deep and prolonged recession, not sparing even those
countries which have shown more resilience so far.
As usual, this forecast assumes no change in fiscal policy beyond measures
that are at present known with sufficient certainty. If additional fiscal
tightening is decided – which appears to be needed in some Member States
which still do not have a 2012 budget or need to correct the excessive deficit
in 2012 – this could raise confidence and ease financial market pressure.
Nonetheless, in the short run, GDP growth would probably be negatively
affected. Upside risks to GDP include a stronger-than-expected rebound of
confidence following decisive EU level decisions to tackle the sovereign-debt
crisis, building on the recent agreement on the Greek adjustment programme.
Another upside risk is a more resilient global demand, which could, for
instance, stem from the decreased dependency of emerging markets on
advanced economies or a stabilisation in US housing markets.
The main risk for markedly lower inflation relates to a sharper-than-expected
contraction of GDP, which would also depress underlying price dynamics.
On the upside, oil prices could surge in the case of supply disruptions, in
particular in the case of an intensification of geopolitical tensions; stronger
demand from emerging markets could also drive commodity prices higher.
Similarly, inflation could increase on the back of unanticipated increases in
indirect taxes.
Risks to inflation
appear broadly
balanced.
1.
EU ECONOMY: A MILD RECESSION WITH SIGNS
OF STABILISATION
Interim forecast, February 2012
4
The global economy has decelerated…
The overall picture of the global economy has been
mixed in 2011 and economic growth has been
uneven across regions. The fragile recovery from
the global crisis that had started in 2009 has been
negatively affected by sharp commodity price
increases, natural disasters in Asia, and increased
uncertainties about the resolution of the sovereign-
debt crisis in the euro area. Elevated inflation
pressures in emerging economies led to tightening
of domestic policies, and this weighed further on
global growth dynamics.
In the third quarter of 2011, global growth
accelerated, led by Japan’s post-disaster recovery
and an improvement in the US economic activity.
The advanced estimate for the fourth quarter points
to a continuing growth momentum in the US
driven to a large extent by inventory rebuilding
and consumption financed from savings.
Nevertheless, world growth is expected to have
slowed down again towards the end of the year,
despite the better-than-expected performance of
the US economy. Preliminary estimates of GDP
growth in Japan in the last quarter of 2011
surprised on the downside on the back of weak
public investment and negative trade repercussions
following floods in Thailand. While so far China
has proved to be resilient to the slackening global
economy, growing at a robust 8.9% in the last
quarter of 2011, most emerging market economies
continue to be affected, notably through the trade
and financial channels.
… and is expected to move out of the soft
patch only gradually.
Looking ahead, leading indicators of global
activity, such as the global manufacturing PMI,
point to a moderate expansion in the short term.
Against this background, the global economy
(excl. EU) is expected to grow by 4¼% in 2012,
almost the same rate as forecast in autumn.
However, the overall figure masks large regional
differences. Compared to autumn, a more upbeat
US outlook combined with an unchanged forecast
for China, counterbalances downward revisions
elsewhere, particularly in Japan, Latin America
and the MENA region.
-20
-15
-10
-5
0
5
10
15
20
25
05
06
07
08
09
10
11
12
30
35
40
45
50
55
60
65
70
75
World trade volume, CPB data (lhs)
Global PMI manufacturing output (rhs)
y-o-y%
3-month moving average
Graph 1.1: World trade and Global
PMI manufacturing output
Commodity prices are trending down but still
remain high from a historical perspective. Energy
prices, most notably crude oil, have held up in
recent months, despite a global slowdown in
demand growth, reflecting geopolitical tensions
and the risk of supply disruptions. Nevertheless
global inflation concerns have receded recently.
Across both, advanced and emerging economies,
inflation is set to decelerate on the back of
moderating commodity prices, subdued economic
growth and base effects from commodity price
increases in early 2011.
Risks to the global growth outlook remain
elevated. More pronounced contagion from the
sovereign-debt crisis in the euro area to the rest of
the global economy and stronger spillovers
between the financial and real sector remain the
largest downside risks. Moreover, an aggravation
of geopolitical tensions in oil-exporting regions
could lead to higher oil prices. On the upside,
global growth dynamics may prove to be stronger
than currently envisaged in the forecast, in
particular if the US economy were to rebound
sooner (on account of a faster recovery in the
housing market, stronger job creation and
corporate investment).
Interim forecast, February 2012
5
Financial markets have calmed but remain
vulnerable
Financial market stress has ebbed off in recent
months. Financing cost indicators point to a
gradual improvement, while volatility indicators
suggest a return of risk appetite among market
participants. Improvements have been widespread
across financial market segments. Nonetheless, the
financial market situation remains fragile. Yields
on many euro-area sovereigns remain too high for
comfort, and the risk of a sudden aggravation of
the sovereign-debt crisis, with spillovers across the
euro area, but also to global financial markets is
still very present. The sovereign-debt crisis in the
euro area continues to be the main source of
instability in the global financial system. Adverse
feedback loops between vulnerable sovereign
debtors and weak banking systems are still active,
and there is evidence of tightening credit
conditions for the private non-financial sector.
Breaking such negative feedback loops requires
consistent policy decisions in the coming weeks.
0
10
20
30
40
50
60
70
Jan-07
Jan-08
Jan-09
Jan-10
Jan-11
Jan-12
3.0
3.5
4.0
4.5
5.0
5.5
6.0
Vstoxx
Corporate CFCI (rhs)
Household CFCI (rhs)
Graph 1.2: Volatility and Composite Financing Cost
Indices (CFCIs)
index index
Note: The CFCI is a synthetic measure of the nomial external
financing cost for the euro-area corporate sector and households.
Stabilisation in sovereign-debt markets but
further measures are required
Although decreasing in several countries,
sovereign yield spreads remain high by historical
standards. Shortly after the autumn 2011 forecast,
the euro-area sovereign-debt crisis intensified on
concerns that slowing economic growth would
undermine public debt sustainability, that the
benefits of the fiscal consolidation efforts risked
being wiped out by the further rising debt-
servicing costs, and that some sovereigns (and
banks) would struggle to refinance the challenging
volume of maturing debt. However, since mid-
November sovereign-debt spreads have come
down somewhat, supported by policy measures as
well as successful sovereign-bond auctions.
Stronger credibility of policy in vulnerable
countries and the increasing perception that a
consistent strategy to tackle the sovereign-debt
crisis was emerging at the EU level helped to
stabilise the markets. Consequently, the market
reaction to sovereign credit-rating downgrades
since December has been muted.
Despite banking sector weakness…
Tensions in sovereign-debt markets have strong
contagion effects into the EU banking system.
Banks' funding costs and debt spreads in secondary
markets remain high. Difficult bank funding
conditions have been a key driver behind credit
supply tightening in recent months (see Box 1.1).
New liquidity measures introduced by the ECB in
December 2011 and February 2012 have provided
a relief, as banks now have access to longer
maturity funding from the ECB and can use a
wider range of eligible collateral. Euro-area
interbank markets continue to be dysfunctional,
though market conditions have started to ease
gradually after the announcement of the ECB's
additional liquidity measures in early December.
The Euribor-OIS spread, an indicator of the
willingness of banks to lend to each other, has
decreased from a peak of 100 basis points early
December, but at around 75 basis points it remains
high.
… a credit crunch has been avoided
Looking forward, the risk of a full-blown credit
crunch has decreased. The process of deleveraging
is ongoing in the banking sector, but there is no
clear-cut evidence that it has become excessive or
disorderly. The transmission from central bank
liquidity to additional loans to the private sector
remains impaired, and credit supply conditions
have tightened. However, demand for credit has
also fallen, so that credit supply conditions are – at
the current juncture and considering the EU and
euro-area aggregates – unlikely to constrain credit
growth until demand picks up more strongly.
Moreover, premiums on corporate bonds have
come down somewhat, and the strong liquidity of
the non-financial corporate sector should sustain it
through a period of more difficult financing
conditions. Differences in credit conditions across
countries have, however, increased, with far more
severe credit supply constraints in some Member
States where bank balance sheets are under
particular stress.

Interim forecast, February 2012
6
Box 1.1: Substantial slowdown in credit growth amid very large cross-country divergences
Credit expansion in the EU and the euro area is
bound to remain anaemic in 2012, despite – inter
alia – the substantial relief provided by the ECB
longer-term refinancing operations. However,
currently decelerating bank lending growth is not
expected to turn into a fully-fledged credit crunch
in the EU or the euro area.
Towards the end of 2011, private sector credit
growth decelerated noticeably, but was subject to
large cross-country differences. Credit growth has
been declining strongly in Italy, and to a smaller
but still noticeable extent in France. In Ireland, the
extensive credit contraction seems to be receding,
while a milder credit contraction has continued in
Greece and is intensifying in Spain and Portugal. In
the Netherlands and Germany, credit growth turned
positive in the course of 2012, but has recently
shown signs of decelerating again. But credit
growth in Belgium, after having turned positive in
the summer of 2011, turned negative again in
December 2011. Recent trends in Central and
Eastern Europe do not follow a single pattern
either. Credit growth has been accelerating in
Romania in recent quarters, but receding in Poland
and the Czech Republic, while in Hungary, the
credit contraction is deepening. Annual credit
growth in Bulgaria remains at low but stable levels
(Table 1).
The overall slowdown in credit growth resulted
both from weakening demand and tightening credit
conditions, as highlighted by the ECB Bank
Lending Surveys of October 2011 and January
2012. In particular, the sovereign-debt crisis has
reduced banks' access to funding markets. Financial
institutions are under unabated pressure to adjust
balance sheets and secure liquidity provision, while
funding costs remain at elevated levels (see page 5
in section 1). In the euro area, funding stress
appears to be most severe in Italy, Spain and
France, as indicated by the large take-up of the 3-
year longer-term refinancing operations by Italian,
Spanish and French banks in December 2011.
Reflecting the spillover from tensions in the euro
area, bank lending conditions in Emerging Europe
substantially weakened in the last quarter of 2011,
with deteriorating refinancing conditions reported
as the most important factor behind the worsening
situation.
(1)
(1)
Institute of International Finance (IIF), Emerging
Markets Bank Lending Conditions Survey – 2011Q4,
January 2012
Table 1:
Bank lending to the non-financial private sector
(y-o-y %)
Dec-10
Jun-11
Nov-11
Dec-11
EA
2.2
2.1
1.7
1.2
BE
-2.0
-2.5
0.6
-1.7
DE
-0.1
-0.2
2.3
2.3
EE
-5.4
-4.8
-5.6
-4.3
IE
-20.2
-13.2
-11.0
-7.5
EL
3.0
-3.7
-4.5
-3.4
ES
0.8
-1.1
-2.8
-3.0
FR
6.0
6.9
4.5
3.7
IT
8.1
4.7
2.6
1.4
CY
6.7
6.3
7.0
7.6
LU
3.3
6.3
1.3
2.0
MT
4.3
1.0
3.1
3.1
NL
-2.9
6.6
5.8
3.8
AT
2.7
1.9
2.3
2.4
PT
0.2
-1.8
-2.8
-3.5
SI
2.5
0.3
-0.9
-2.5
SK
5.0
9.5
7.2
8.5
FI
5.4
6.3
7.9
8.3
BG
1.1
2.3
2.3
:
CZ
9.2
11.3
3.8
:
DK
1.3
-2.0
-1.7
:
LV
-8.4
-9.3
-6.2
:
LT
-6.5
-5.6
-3.4
:
HU
0.5
0.3
-6.3
:
PL
11.9
12.9
3.0
:
RO
4.2
4.6
6.2
:
SE
21.9
10.2
6.0
:
UK
4.6
-12.6
-7.2
:
Source: ECB
While the stress in bank funding markets may have
prompted banks to cut back lending to the real
economy, the additional liquidity injected by the
ECB in December, the expected additional liquidity
at the end of February, as well as some other policy
measures (e.g. the broadened collateral base)
should provide sufficient resources for banks to
expand lending. Meanwhile, the European Banking
Authority (EBA) assessed earlier this month that
the imposed and ongoing strengthening of the
capital ratios of banks would be met primarily
through direct capital measures (capital raising,
retained earnings and conversion of hybrids to
common equity) while deleveraging actions would
only count for a quarter of the amount of
measures.
( 2 )
Nevertheless, the transformation of
central bank liquidity into loans to the private
sector via the bank lending or balance-sheet
channel is not straightforward in the current
environment, as possible bank capital shortages and
high sovereign refinancing needs superimpose the
expansionary monetary impulse. Moreover, cross-
(2)
See the EBA's press release: "The EBA’s Board of
Supervisors makes its first aggregate assessment of
banks’ capital plans, 9 February 2012."
(Continued on the next page)
Interim forecast, February 2012
7
Graph 1.3: Corporate spreads over euro-area
sovereign benchmark bonds (5-year maturity)
0
100
200
300
400
500
07
08
09
10
11
12
AAA
AA
A
BBB
bps.
European economic situation has worsened
In 2011 as a whole, real GDP is estimated to have
grown by 1.5% in the EU and 1.4% in the euro
area, broadly in line with the autumn 2011
forecast. However, the loss of momentum in the
EU economy towards the end of 2011 turned out to
be stronger than expected in the autumn. Sharply
deteriorating confidence, the sovereign-debt crisis
and a weaker global economy have all weighed on
growth. In the third quarter of 2011, GDP in the
EU and the euro area grew by 0.3% and 0.1%
respectively, compared to the previous quarter. In
the final quarter, according to Eurostat's Flash
estimate of 15 February, GDP contracted by 0.3%
from the previous quarter in both the EU and euro
area. The contraction was particularly strong in
Portugal (-1.3% q-o-q), Lithuania (-0.9%), Estonia
(-0.8%), Italy (-0.7%) and the Netherlands
(-0.7%).
-3.0
-2.5
-2.0
-1.5
-1.0
-0.5
0.0
0.5
1.0
1.5
07 08 09 10 11 12
EU
euro area
forecast
q-o-q%
Graph 1.4: Quarterly GDP growth, EU and euro
area
A mild, technical recession
The lower carry-over from 2011 will weigh on the
outlook for this year. Growth is expected to
stagnate in 2012 in the EU, and the euro-area
economy should experience a mild recession: For
2012, GDP growth is now forecast at 0.0% in the
EU and -0.3% in the euro area. This is a downward
revision of 0.6 pp. and 0.8 pp. respectively
compared to the autumn 2011 forecast. The
quarterly GDP profile for 2012 has been revised
down for all quarters and a technical recession,
defined as two consecutive quarters of negative
growth, is now expected in both regions in the last
quarter of 2011 and the first quarter of 2012. Only
after some quarters of zero or negative GDP
growth is a gradual and feeble return of growth
projected in the second half of 2012. The
projection of a sluggish recovery towards the end
of the year reflects the pattern of subdued growth
that is typical in the aftermath of financial crises.
Box (continued)
border retrenchment is likely to continue, adding to
possible credit constraints in some Member States.
Finally, the much tighter credit conditions applied
by banks to long-term loans are an immediate
reflex of the particular stress on funding markets
for longer maturities, but are also driven by
regulatory requirements. This implies that non-
financial corporations face a higher interest-rate
risk for the financing of long-term investments.
Looking forward, a number of factors suggest that
weakening credit growth will not develop into a
fully-fledged credit crunch despite the ongoing
moderate credit deceleration. (i) Credit growth is
still positive or even accelerating in most countries.
(ii) The contraction of credit volumes in other
Member States corresponds to declining credit
demand following slowing economic activity in the
last months of 2011, resulting from high
uncertainty about future business projects and
deleveraging of the corporate and household sector.
Warned by the 2008-09 experience of tight
liquidity conditions, the corporate sector has been
hoarding cash and freezing investment. Fitch
( 1 )
estimates that the vast majority of European
corporates is well placed to finance themselves out
of existing resources in 2012-13, without the need
to tap the markets.
(1)
Fitch Ratings, EMEA Corporate Credit View,
December 2011
Interim forecast, February 2012
8
Still, this growth profile is based on the
assumption that the uncertainty related to the
sovereign-debt crisis will gradually fade.
The weaker growth prospects for 2012 compared
to the autumn 2011 forecast can be explained by
several factors. First, the carry-over into 2012
turned out to be lower than expected in the autumn
forecast, mainly as a result of lower growth in the
last quarter of 2011. Second, the additional fiscal
consolidation that has been decided since the
autumn forecast in a number of Member States,
while necessary, will weigh on growth in 2012.
Third, although the policy assumption of the
autumn forecast, according to which policy
measures to combat the sovereign-debt crisis
would prove effective and lead to a gradual return
of growth, is still valid, the timing has been
delayed. On the upside, compared to the autumn
forecast, the ECB's additional liquidity measures
have contributed to the stabilisation of market
sentiment and reduced pressure on short- and
medium-term funding for banks.
60
70
80
90
100
110
120
05
06
07
08
09
10
11
12
20
30
40
50
60
70
Economic Sentiment Indicator (lhs)
PMI composite (rhs)
Graph 1.5: Economic Sentiment Indicator
and PMI composite index, EU
level
level
Confidence, while remaining very low, points
to some stabilisation
Since the autumn 2011 forecast, survey
developments have continued to trend down and
began to improve only recently. The Economic
Sentiment Indicator (ESI) in the EU and the euro
area showed a moderation of the sharp downward
trend during the fourth quarter of last year. In
January 2012, it rose for the first time since May
2011 for the EU (since February 2011 for the euro
area). The indicator remains, however,
significantly below its long-term average in both
regions. The euro-area composite PMI readings
have been slightly more positive, showing a
gradual increase in the index since November. In
January, the index stood above the threshold of 50
points, signalling a marginal increase in economic
activity in the euro area.
Despite this recent improvement, the
Commission's business and consumer survey
indicators still point to contraction. An Economic
Climate Tracer can be constructed depicting the
level and change of a (smoothened and
standardised) business cycle indicator (Graph
1.6).
(1)
This tracer displays the position of an
economy in the business cycle and its dynamics.
For both the EU and the euro area, based on
January data, the climate tracer remains in the
contraction area. Among the largest Member
States, it is now in the contraction area in all
countries except Germany which remains in the
downswing area and is moving in the direction of
expansion.
-3.5
-2.5
-1.5
-0.5
0.5
1.5
2.5
-0.4
-0.2
0
0.2
0.4
downswing
upswing
contraction
Jan-00
expansion
m-o-m change
le
ve
l
Jan-12
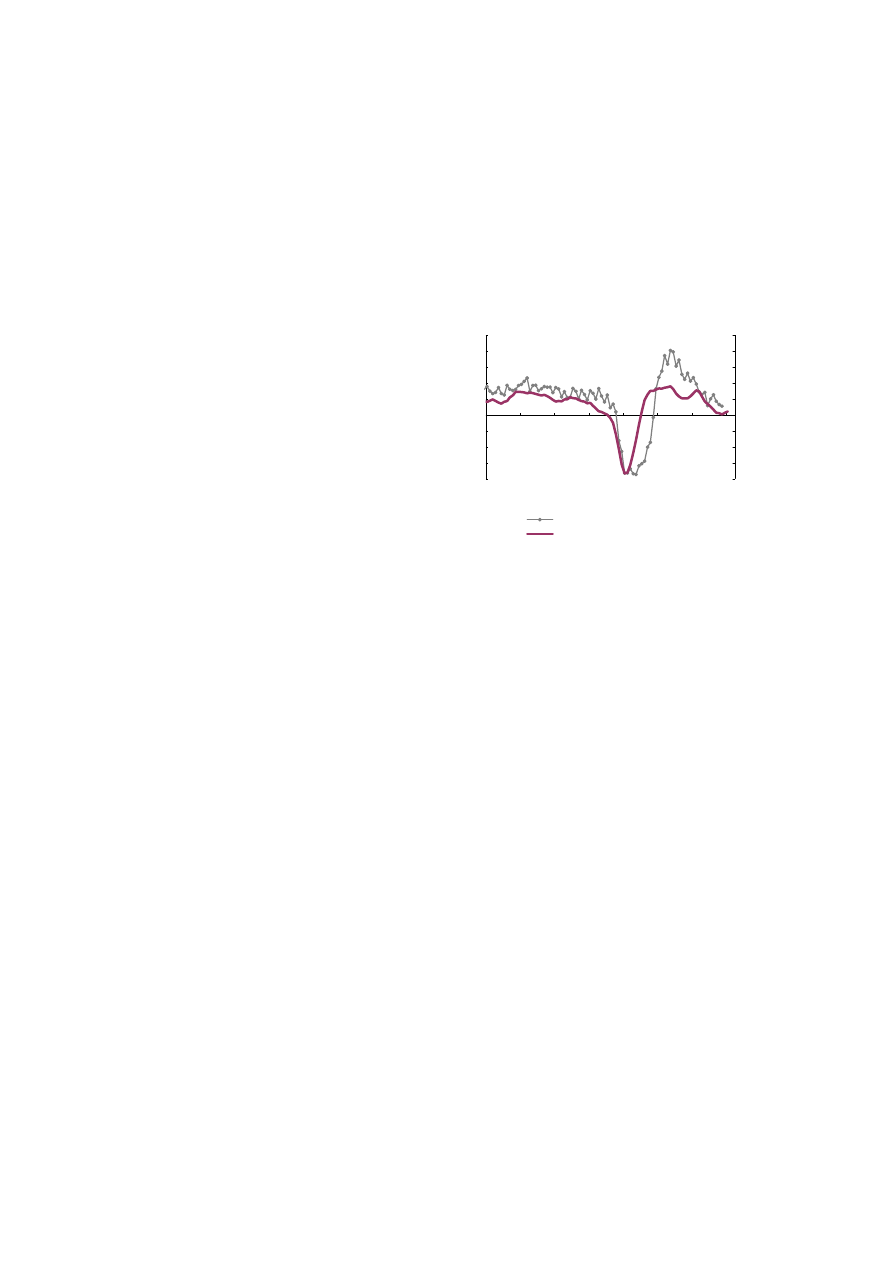
Graph 1.6: Economic Climate Tracer, EU
While recent developments in survey data suggest
that the expected slowdown should be mild and
temporary, the turnaround of the trend still needs
to be confirmed in the coming months.
Broad-based downswing
The expected slowdown in 2012 should be broad-
based and affect all GDP components. Exports
seem to have been the main driver of growth in
2011 in most EU countries and are now back to
their pre-crisis levels. However, with global trade
expansion slowing down, its contribution to GDP
growth will most probably diminish in 2012.
(1)
The business cycle indicator is created from the weighted
average of the five principle components from the survey
series conducted in industry, services, construction and
retail trade and among consumers.
Interim forecast, February 2012
9
The relatively strong EU export recovery in
2010-11 did not translate into a rebound in private
investments. Gross fixed capital formation was
rather disappointing in 2011. After a strong
performance in the first quarter of 2011,
investment growth was anaemic in the two
following quarters, in line with declining
confidence. Looking forward, several factors will
contribute to unfavourable developments. The
weaker prospects for trade and domestic demand
for 2012 will reduce firms' incentives to invest.
Furthermore the net tightening of credit standards
for loans to enterprises and their declining profit
share (Graph 1.7) are set to weigh on the
propensity to invest beyond depreciation.
-12
-8
-4
0
4
8
05
06
07
08
09
10
11
EU
euro area
Graph 1.7: Profit growth, EU and euro area
y-o-y%
Note: Profits defined as gross operating surplus and gross mixed
incomes at current prices.
Domestic consumption is set to remain modest,
too. After a decline of 0.4% in the EU (-0.5% in
the euro area) in the second quarter of 2011,
household consumption rebounded slightly in the
following quarter. However, weak labour markets,
subdued consumer confidence, ongoing private-
sector deleveraging in many Member States and
the negative impact of fiscal consolidation
measures on disposable income are all depressing
the outlook for consumption.
Intra-EU divergence persists
The downward revision for GDP growth in 2012 is
broad-based across Member States but the
magnitude of revision is very different from one
country to another. While a slowdown in 2012 is
expected in all EU Member States, growth
differences are expected to remain pronounced.
The sovereign-debt crisis affects in particular those
Member States with vulnerable public finances
(often compounded by a weak banking sector and
low growth), while deleveraging needs stemming
from the preceding boom and bust continue to
weigh on domestic demand. Differences in
openness to international trade and in
competitiveness positions will also contribute to
growth divergence.
While some countries will suffer significant
recessions in 2012, other countries will experience
a slowdown with growth remaining in positive
territory. In fact, GDP growth rates in 2012 are
forecast to range from significant contractions in
Greece (-4.3%) and Portugal (-3.3%) to some
rapidly growing New Member States, like Poland
(2.5%) and Lithuania (2.3%). Divergence in
country growth perspectives are also reflected in a
number of indicators such as: unemployment rates,
credit tightening, financing costs, fiscal
consolidation needs and confidence.
Labour markets deteriorating
In the third quarter of 2011, employment growth
turned negative for the first time since spring 2010,
with a decrease of 0.1% in the EU and the euro
area respectively. Although this decline was small,
it shows that the favourable employment dynamics
in some Member States no longer offset the
deterioration in countries facing substantial
structural adjustments. The unemployment rate
stood at 10.4% in the euro area and 9.9% in the EU
in December 2011. Labour shedding in the
construction sector has continued unabated,
whereas employment in the manufacturing sector
decreased only slightly in the EU and stagnated in
the euro area.
The largest increases in the unemployment rate in
December 2011 were recorded in countries with
macroeconomic adjustment needs stemming from
a burst housing bubble and/or unsustainable public
finances coupled with a lack of structural reforms.
Greece, Portugal and Spain account for 95% of the
rise in unemployment in the EU since late 2010.
Additionally, Spain and Greece have seen their
youth unemployment rates surge (from already
high pre-crisis levels) to close to 50%. But high
levels of youth unemployment are also common in
several other countries, with the total of eleven
Member States significantly exceeding the EU
average jobless rate for the 15-24 year olds of
22.1% (as of December 2011). By contrast, the
labour market situation still appears to be more
benign in countries with less adjustment needs. As
a consequence, the large dispersion of
unemployment rates among Member States is
expected to prevail in 2012.
Interim forecast, February 2012
10
Looking ahead, the deteriorated economic outlook
is expected to leave its mark on the labour market,
as the winding-down of imbalances continues, also
in response to weak demand. Forward-looking
labour market indicators suggest a further
worsening of the labour market situation. Readings
of Commission surveys of employment
expectations in the EU industry and services
sectors experienced their trough last autumn,
whereas consumers' unemployment fears for the
next twelve months have decreased (Graph 1.8).
The labour market prospects in the near future are
also underpinned by deteriorating PMI composite
employment indices for the EU and the euro area.
Given that employment developments tend to
follow output fluctuations with a time lag of two to
four quarters, the expected weak GDP upturn in
the second half of the year is unlikely to lift
employment prospects during 2012. With the EU
economy set to stagnate and a mild recession
unfolding in the euro area at the current juncture,
the labour market situation is likely to worsen over
the forecast horizon.
-10
-5
0
5
10
15
Jan-11
Apr-11
Jul-11
Oct-11
Jan-12
15
20
25
30
35
40
Employment exp. in industry sector, next 3-months (lhs)
Employment exp. in services sector, next 3-months (lhs)
Consumers' unempl. exp., next 12-months (inverted, rhs)
Graph 1.8: Employment expectations,
Business and Consumer Surveys, EU
level
level
Inflation still high despite weakening economic
environment…
In 2011, consumer-price inflation was shaped to a
large extent by rising energy prices and changes in
indirect taxation in many Member States. While in
the second half of last year the oil price started to
decrease in USD terms (by 7%), it increased in
EUR terms (by 4%). The net effect of the oil-price
increase and higher indirect taxes (adding up to ½
pp. to HICP), as well as lagged effects of oil-price
increases from the first half of 2011, have resulted
in inflation in the EU and the euro area that has
been more persistent than expected in the autumn
forecast.
Euro-area headline HICP inflation rose to 2.9% in
the fourth quarter of 2011, ¼ pp. higher than
forecast in autumn, bringing up the 2011 rate to
2.7%. In the EU, headline inflation was 3.2% in
the fourth quarter (0.4 pp. higher than in the
autumn forecast) and 3.1% for 2011 as a whole
(compared with 3.0% in the autumn forecast).
0
1
2
3
4
5
07
08
09
10
11
%
HICP
HICP-CT*
Core inflation
* HICP-CT = inflation at constant taxes. The difference between
HICP and HICP-CT growth rates points to the theoretical impact
of changes in indirect taxes (e.g. VAT and excise duties) on overall
HICP inflation, assuming an instantaneous pass-through of tax
rate changes on the price paid by the consumer.
Graph 1.9: Headline, core and constant-tax* inflation,
EU
In 2011, core inflation (i.e. all items excluding
energy and unprocessed food) reached 2.1% in the
EU (1.7% in the euro area), up by about ¾ pp.
from the previous year in both areas.
… but with weak labour market conditions …
Although the labour market situation is currently
highly differentiated across EU Member,
conditions generally stayed weak in 2011 and have
not exerted any pressures on inflation.
Nevertheless, in the course of 2011, the growth of
nominal compensation per employee accelerated
and outpaced the productivity gains, prompting a
moderate increase in nominal unit labour costs.
… and well-anchored expectations …
Price pressures on the producers' side have been
easing since the spring of 2011, mainly reflecting
lower pressures from energy input prices.
Industrial producer price inflation fell below 5% in
the EU and the euro area at the end of 2011 and the
most substantial decrease in the course of the year
was observed for intermediary goods, i.e. at the
earlier stages of the production chain.
However, survey indicators of price developments
(both PMI and ESI components), which signal
future producer-price developments, edged up
slightly at the turn of the year, suggesting an end to
the downward trend. This is in line with
Interim forecast, February 2012
11
manufacturers' expectations of stabilising
economic activity in the short term as the PMIs
suggest. Consumers' inflation expectations eased
slightly in January, though they remain at an
elevated level as, on the whole, they tend to be
highly correlated with the observed (currently
relatively high) inflation rates. By contrast,
market-based inflation expectations for the
medium- to long term point to a substantial easing
of inflation going forward, with inflation rates
significantly below the ECB's official target.
However, in times of continued financial-market
turbulences, these indicators should be interpreted
with caution.
-25
0
25
50
75
100
07
08
09
10
11
12
level
-10
-6
-2
2
6
10
%
PMI manufacturing input prices
PMI manufacturing output prices
ESI consumer inflation expectations
PPI industry excl. construction (rhs)
Graph 1.10: Producer-price inflation (PPI) and survey
inflation expectations, euro area
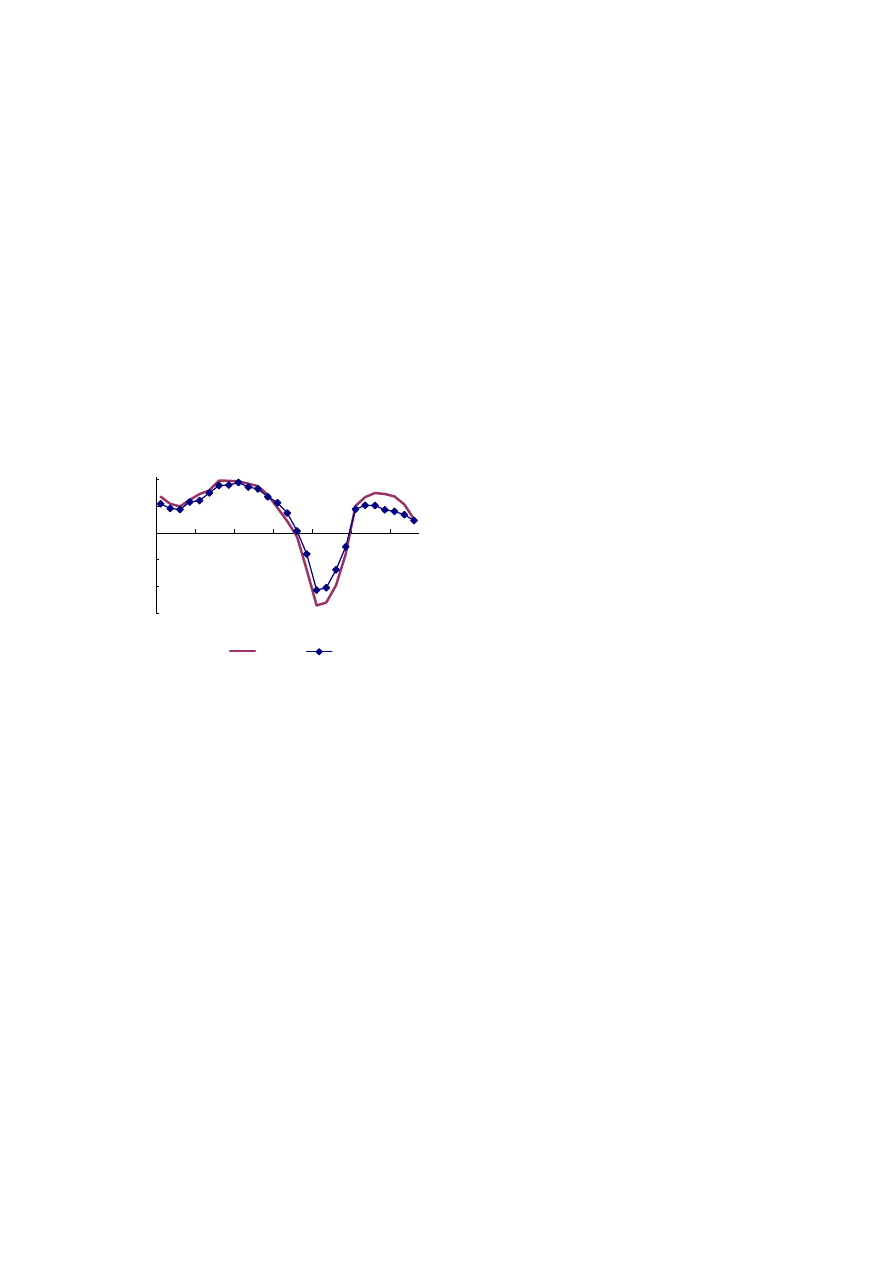
Graph 1.11: HICP inflation forecast, EU and euro
area
-0.5
0.5
1.5
2.5
3.5
4.5
07 08 09 10 11 12
EU
euro area
forecast
y-o-y%
… the outlook is for a gradual decrease …
Looking ahead, the headline inflation rate for 2012
is revised up both in the EU and the euro area (0.3
pp. and 0.4 pp. respectively compared to the
autumn forecast) and is expected to reach 2.3%
and 2.1% respectively. On a quarterly basis,
inflation at the aggregate level is expected to have
peaked in the last quarter of 2011 and is set to
gradually return to about 2% towards the end of
the year. This profile follows from the interaction
of three main elements: the fading pass-through
and negative base effects from last year's increases
in energy prices combined with increases in
indirect taxation and administered prices in many
Member States, new tax measures to be introduced
in 2012 and the overall feeble economic
environment.
… though with increased dispersion among
Member States
The revisions to the inflation forecast are
equivocal across Member States, in line with
divergent patterns in economic activity. For many
euro-area countries that are implementing
additional fiscal consolidation measures in the
form of increasing direct and indirect taxes,
inflation for 2012 has been revised up between ½
and 1 pp. Outside the euro area, revisions to the
autumn 2011 forecasts have mostly been minor,
with the exceptions of Poland, Hungary, Romania
and Sweden, mainly on account of exchange rate
movements and base effects. On the whole, the
dispersion of inflation rates in the euro area is set
to increase this year.
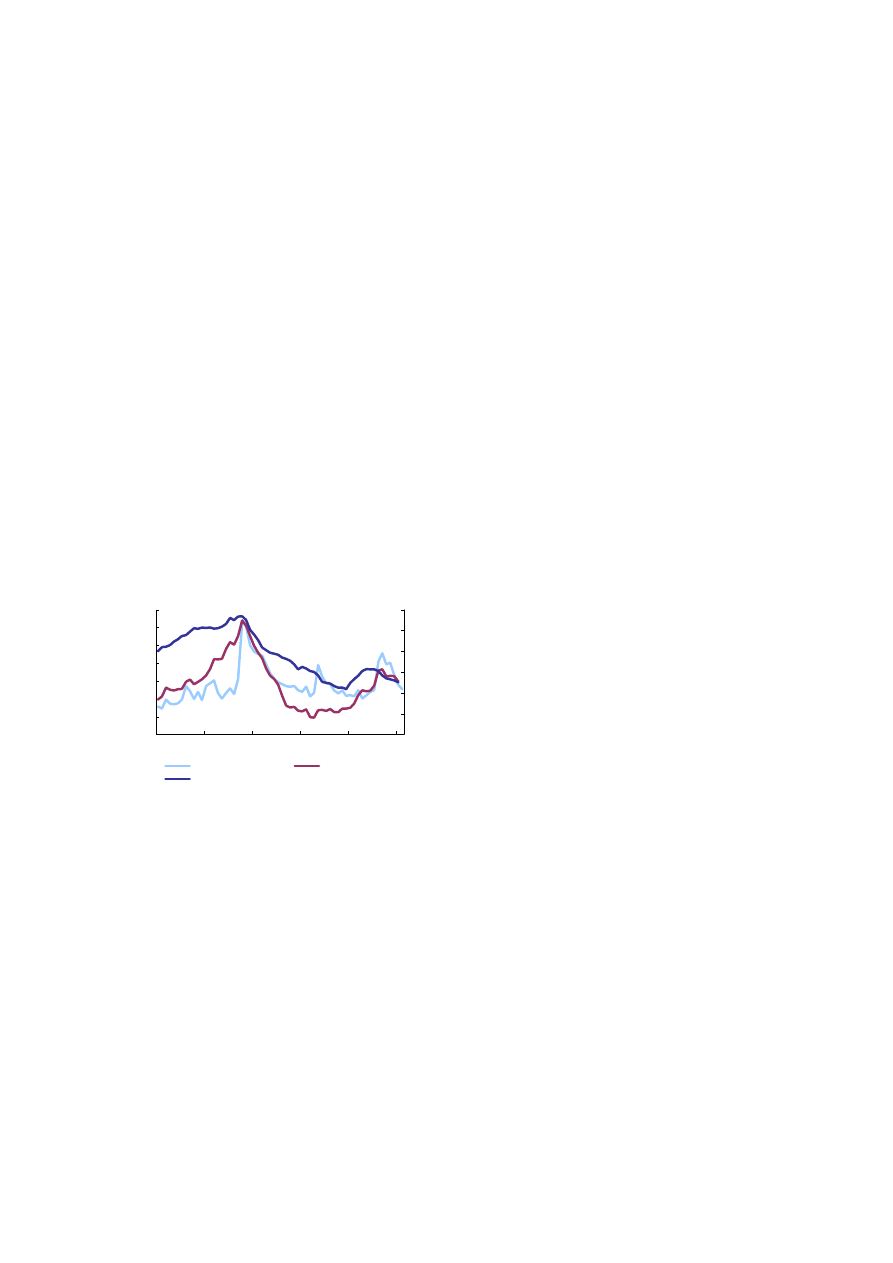
-4
0
4
8
12
07
08
09
10
11
12
Highest national HICP inflation rate (%)
Euro-area HICP inflation rate (%)
Lowest national HICP inflation rate (%)
%
forecast
Graph 1.12: Inflation dispersion of
EA Member States - HICP inflation rates
The outlook for public finances broadly
unchanged
Turning to public finances, the available
information suggests that, despite a downward
revision of economic growth in 2012, the
budgetary outcome for the EU and the euro area as
a whole will be broadly in line with the results of
the autumn forecast. The overall unchanged
outlook for public finances is mainly due to
additional consolidation measures taken in some
Member States since the cut-off date of the autumn

Interim forecast, February 2012
12
forecast, which offset the negative budgetary
impact from the slower economic activity and
fiscal slippage in some countries. A full
assessment of prospects for public finances and the
labour market will be carried out in the
Commission's upcoming spring forecast.
Uncertainty keeps risks at high levels
Against the background of sovereign- and
financial-market stress, the growth forecasts for
the EU and the euro area remain subject to
exceptionally high uncertainty. Despite some
favourable developments in recent weeks that
made the risks to growth more balanced, the
downside risks remain substantial. By contrast the
risks to the inflation outlook are broadly balanced.
Downside risks to the growth forecast are closely
related to the euro-area sovereign-debt crisis,
measures to solve it, adverse feedback loops
between the financial and the real sector and the
underlying assumptions about the external
environment.
− The major downside risk is that the euro-area
debt crisis intensifies. This could, for instance,
happen if, by contrast to the main policy
assumptions, measures are not adopted and/or
implemented quickly enough. An
intensification of the crisis would trigger an
abruptly changing market sentiment, more
contagion, and tensions in the financial sector
of the EU and beyond. This would endanger
financial stability, complicate corporates'
financing (credit crunch) and depress
confidence of investors and consumers. The
fallout would not be restricted to a sharp
decline in economic activity in the EU.
Economic and financial spillovers beyond
Europe could amplify the negative impact.
− Additional fiscal measures, not taken on board
due to the no-policy-change assumption (cf.
Box 2), may lower economic growth in the
short term more than currently envisaged.
− Weaker-than-expected global economic growth
would weigh on trade and thus, via
merchandise exports, on the growth outlook of
EU Member States. Economic growth in non-
EU advanced economies is surrounded by risks
emanating from the debt crisis in euro-area
Member States. The larger the loss in global
growth momentum would be, the more
protectionist pressures might arise, constituting
further downside risks to the growth outlook
for the EU.
− An escalation of geopolitical tensions could
push oil prices to unprecedented heights, which
would weigh heavily on the EU economy.
Credible threats to the accessibility of oil
supplies from the Middle East could increase
risk premia. The growth slowdown following
the sharp price increases in the first half of
2011 may give an indication on how substantial
the impact could be.
Upside risks to the growth forecast relate to the
assessment of measures already taken and the
external environment of the EU economy.
− The policy measures already taken and the next
moves to solve the euro-area debt crisis may
have a faster and more sustained impact than
currently expected. A recovery in financial
markets, structural reforms and determined
fiscal consolidation could lead to an earlier
return of confidence than assumed, allowing
the EU economy to re-accelerate earlier and
stronger than forecast.
− Stronger-than-expected global economic
growth, particularly in emerging market
economies, may pull economic growth in
advanced economies.
Overall, the balance of risks to the economic
growth outlook is tilted to the downside. Downside
risks to growth will diminish further if decisive
policy actions at EU and Member State level
reduce uncertainty.
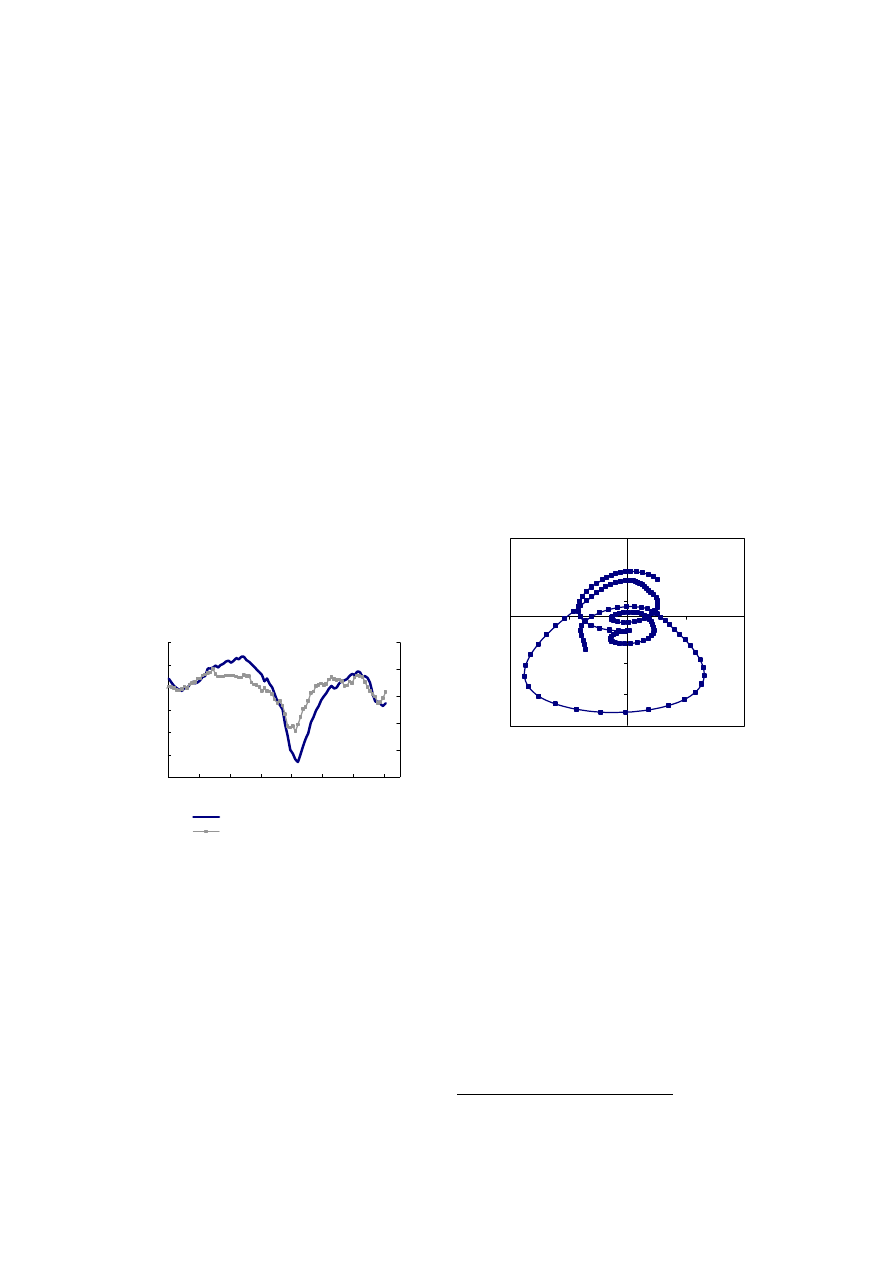
Graph 1.13: Euro-area GDP forecasts - uncertainty
linked to the balance of risks
-5
-4
-3
-2
-1
0
1
2
3
4
5
06
07
08
09
10
11
12
%
upper 90%
upper 70%
upper 40%
lower 40%
lower 70%
lower 90%
actual
central scenario
The uncertainty surrounding the growth outlook
for the euro area is visualised in the fan chart (see

Interim forecast, February 2012
13
Graph 1.13) that displays the probabilities
associated with various outcomes for euro-area
economic growth in 2012. While the darkest area
indicates the most likely development, the shaded
areas represent the different probabilities of future
economic growth within the growth ranges
depicted on the y-axis. As the balance of risks to
economic growth is assessed as tilted to the
downside, the fan chart is skewed towards the
bottom.
Risks to the inflation outlook are broadly balanced
in the EU as a whole and in the euro area.
Downside risks to the inflation outlook are
associated with a weaker-than-expected growth
performance of the EU economy. In particular,
further declining economic activity would reduce
cost, wage and price pressures. Upside risks to the
inflation outlook are related to policy measures,
commodity prices, and monetary factors. More
increases in indirect taxes and administered prices
may be decided than currently envisaged in the
forecast. Supply disruptions, may push commodity
prices beyond what is currently assumed. Finally,
the long-time build-up of liquidity could
eventually result in stronger-than-expected price
increases once economic activity re-accelerates.
2. BELGIUM
Interim forecast, February 2012
14
After the strong recovery in 2010 and the first half
of 2011, the Belgian economy slowed down
considerably in the second part of 2011. GDP
declined by 0.1% and by 0.2% q-o-q in the third
and fourth quarters respectively. Together with the
downward revision of growth in the second quarter
of 2011 (from 0.5% to 0.3%) this led to an
estimated GDP growth of 1.9% for the whole year
(instead of the 2.2% projected in the autumn
forecast) and to a lower carry-over to 2012 (0.2 pp.
versus -0.1 pp.).
-0.4
-0.2
0.0
0.2
0.4
0.6
0.8
1.0
10Q1
10Q3
11Q1
11Q3
12Q1
12Q3
-2
-1
0
1
2
3
4
5
GDP growth (q-o-q%, lhs)
HICP (quarterly y-o-y%, rhs)
Graph 2.1: Belgium - GDP growth and inflation
forecast
In addition to the impact of the global downturn on
business and consumer confidence, the collapse of
Dexia in October 2011 and the additional amount
of guarantees committed by the Belgian
government, gave rise to renewed concerns about
the health of the banking sector and the impact on
lending (conditions) to households and companies.
Credit provision by Belgian banks has been
slowing down since the second half of 2011, in
particular for households.
The factors that led to the contraction of economic
activity in the second half of 2011 are expected to
remain in place at the beginning of 2012; therefore
the outlook for the current year is more negative
than expected at the time of the autumn forecast
and real GDP is projected to decline by 0.1% over
the whole year. A very modest (export-led)
recovery should however start in the third quarter
and would become more pronounced in the fourth
quarter of the year.
After having increased slightly in December,
consumer confidence fell back in January. At the
start of 2012, consumers expected the general
economic situation to get worse over the current
year, while fears of an increase in unemployment
have also been revived.
Private investment is expected to slow down
considerably, with capacity utilisation having
fallen back below its long-term average. Demand
for mortgages is also expected to decline in the
first quarter of 2012, affecting construction
investment.
Finally, the consolidation measures included in the
budget for 2012 and complemented by additional
measures in early January, which were not
included in the autumn forecast, are likely to have
a limited but negative impact on growth this year.
The contribution of net trade to growth is set to
remain weak in 2012 (-0.2 compared to 0.0 in the
autumn forecast). While exports were still
booming during the first quarter of 2011, they fell
in the course of the year due to the deterioration in
growth of foreign markets. Exports are expected to
resume in the course of 2012, but the unfavourable
starting point would limit their increase in 2012 as
a whole.
Inflation has been revised upward compared to the
autumn forecast, from 2% to 2.7%. The impact of
the consolidation measures in the 2012 budget, in
particular the increased VAT rates on tobacco,
pay-tv and some professional services such as
notarial services, is estimated at 0.2%. Other
elements contributing to the higher inflation
forecast are the increased telecommunication
tariffs and the less pronounced slowdown in
energy prices compared to the assumption in the
autumn. The higher-than-expected level of oil
prices for 2012 has an important weight on
inflation in Belgium as the economy is rather
energy intensive.

3. BULGARIA
Interim forecast, February 2012
15
The Bulgarian economy has revived relatively
slowly over 2010-11, with real GDP in the fourth
quarter of 2011 still about 3% below its peak value
recorded in 2008. The GDP flash estimate for the
fourth quarter of 2011 indicates growth of 0.4%
q-o-q and 1.5% y-o-y. For 2011 as a whole, annual
growth is expected to reach 1.8%. The growth
momentum from 2011 has had a marginally
positive carry-over to 2012. As in other EU
Member States that are catching up, the growth
pattern in the initial recovery has been largely
driven by strong exports of both goods and
services, while domestic demand has remained
stagnant, reflecting a rapid adjustment and an
unwinding of imbalances in the private sector.
The strong rebound in exports has been levelling
off over 2011, and monthly industrial production
indicators, as well as industry confidence readings
point to markedly lower export growth going
forward. Nevertheless, in spite of the weaker
outlook in the euro area, Bulgaria is not expected
to fall back into a recession. Annual growth has,
however, been revised down (by 0.9 pp. less than
projected in the autumn forecast) and is now
forecast to reach 1.4% in 2012. GDP growth is
expected to remain rather low in the first half of
2012, but to accelerate gradually thereafter in line
with economic activity picking up in the EU as a
whole.
Following the rapid rebound in exports over the
past two years, domestic demand is expected to
pick up with a lag and become a main driver of
growth in 2012, especially since domestic
economic fundamentals have improved amid the
rapid adjustment process. Private-sector
imbalances have unwound very quickly, as
indicated by the current account swinging into a
surplus, while the ratio of private sector debt to
GDP has started to decline and the dependency of
the financial sector on external financing is
decreasing. In spite of vulnerabilities, the financial
sector has remained stable and has provided for
modest growth in private sector credit in 2011. The
economy also benefits from relatively strong
public finances, which do not face major
adjustment needs in the longer term.
The gradual revival in private consumption is
expected to continue. While economic confidence
readings declined over the final quarter of 2011,
sentiment recovered in January 2012 and is
somewhat stronger than the EU average.
Following a markedly strong and protracted period
of labour shedding, the labour market appears to
be stabilising in 2012. Even with weak
employment performance, household income has
been supported by relatively strong growth in
average wages, probably driven by catching-up
effects from low levels and structural changes in
the labour market.
Investment is expected to be upheld by public
sector projects. After a notably slow start in EU
structural funds intake over the previous years, it is
planned to increase absorption significantly in
2012. However, this is countered by weak private
investment activity, given the relatively high debt
stock of the corporate sector, which entails further
deleveraging of corporate balance sheets.
HICP inflation slowed considerably over the
course of 2011 and amounted to 3.4% in 2011 on
average, 0.3 pp. less than expected in the autumn
forecast. Inflation is expected to moderate to 3%
on average in 2012, supporting growth in real
purchasing power of consumers.
The forecast baseline scenario is subject to
significant risks. A prolonged stress in financial
markets could further delay the recovery in
consumption and investment. Uncertainty
regarding the consumption behaviour of
households remains one of the major risks to the
outlook, both on the upside and on the downside.
Should households lessen their currently high
precautionary savings rate, this could underpin
stronger consumption growth.
0.0
0.4
0.8
1.2
1.6
2.0
10Q1
10Q3
11Q1
11Q3
12Q1
12Q3
0
1
2
3
4
5
GDP growth (q-o-q%, lhs)
HICP (quarterly y-o-y%, rhs)
Graph 3.1: Bulgaria - GDP growth
and inflation
forecast
4. CZECH
REPUBLIC
Interim forecast, February 2012
16
The soft patch foreseen in the autumn 2011
forecast materialised when real GDP fell by 0.1%
q-o-q in the third quarter of 2011 and 0.3% in the
fourth quarter, according to preliminary estimates
by the Czech Statistical Office. Industrial
production slowed to 2% y-o-y in December 2011
compared to 5.4% in November and 11.9%
reported a year ago. The largest decline in
manufacturing output was recorded in computers
and electronic products (which represent about 4%
of total Czech production) while other industries,
including motor vehicles, machinery and
equipment (about 11% of total production) still
showed double-digit growth at the end of the year,
although decelerating compared to the first half of
2011.
The slowdown affected all components of
domestic demand; government consumption
expenditure is estimated to have contracted most
markedly. By contrast, net exports supported
growth, particularly in the second half of the year
as the growth rate of exports outpaced that of
imports, which were held back by weak domestic
demand. The year-end decrease in imports was,
however, somewhat cushioned by the effect of pre-
stocking on beverages and tobacco due to the
anticipated rise in the lower VAT rate and excise
taxes in January 2012.
GDP growth is projected to stall during 2012.
Consumer confidence survey data suggest an
ongoing decrease in household consumption
expenditure at the beginning of 2012, which
reflects worsening labour market conditions and
wage restraint at the level of the central
government. Increases in the VAT rate on food
and selected services should dampen consumer
demand. Investment is expected to recover only in
the second half of 2012, reflecting continued
uncertainty about export prospects and depressed
profit margins. In a setting of generally subdued
domestic demand, weak-but-still-growing net
exports are likely to be the main factor supporting
economic activity.
Against this backdrop, and also owing to a
methodological revision to the quarterly profile of
GDP components data, the current estimate of flat
real GDP in 2012 growth is considerably lower
than in the autumn forecast.
The harmonised index of consumer prices
increased by 2.1% in 2011 and is projected to pick-
up further to 3.0% in 2012. The increase is
expected to be driven predominantly by the hike in
the lower VAT rate and persistently high oil
prices, compounded by a slightly weaker exchange
rate than was assumed in the autumn forecast.
Domestic demand pressures should remain very
limited. The direct effect of the VAT increase on
HICP is estimated at 1.1 pps. While the higher rate
applies only from the beginning of 2012, part of
the adjustment was visible in the price data already
in the last quarter of 2011.
-0.4
-0.2
0.0
0.2
0.4
0.6
0.8
1.0
10Q1
10Q3
11Q1
11Q3
12Q1
12Q3
-2
-1
0
1
2
3
4
5
GDP growth (q-o-q%, lhs)
HICP (quarterly y-o-y%, rhs)
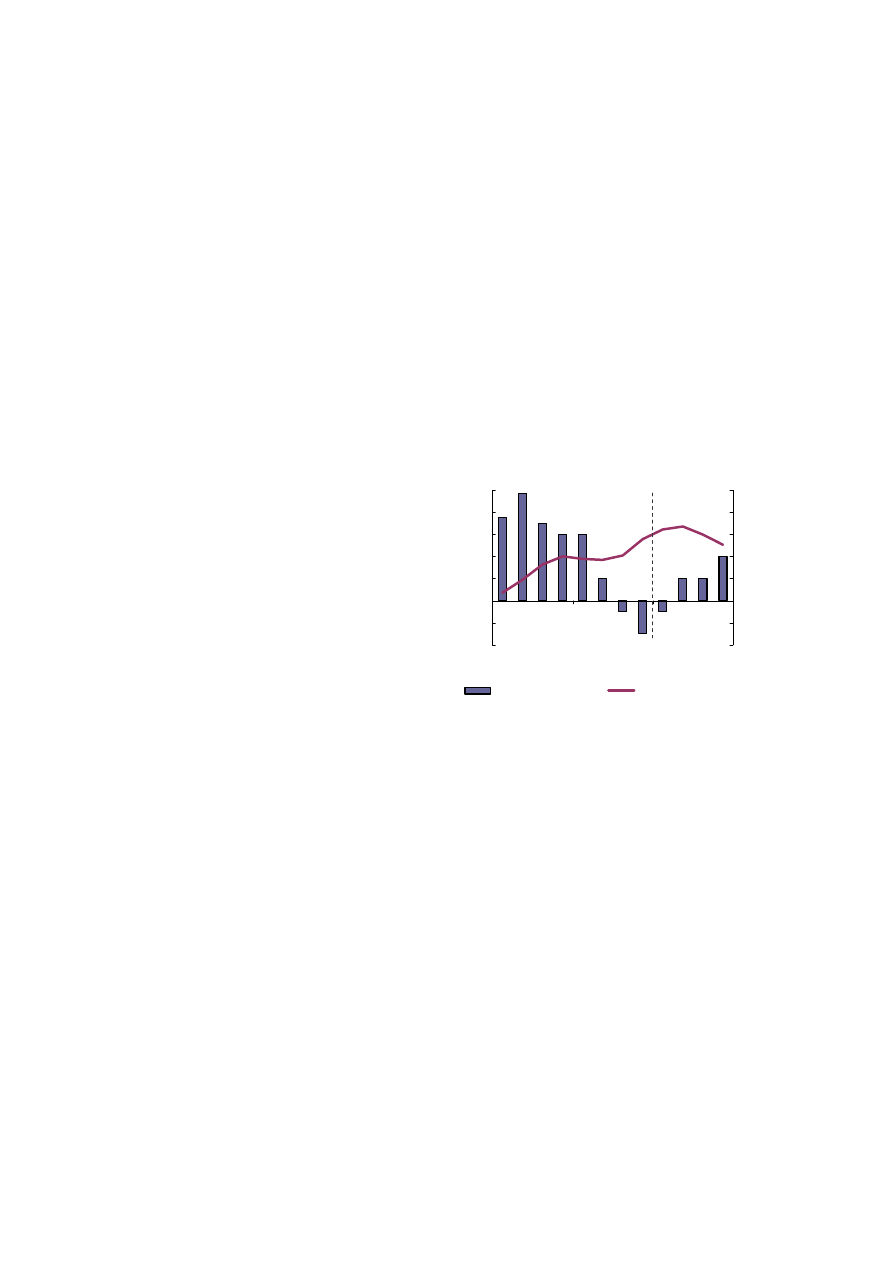
Graph 4.1: Czech Republic - GDP growth and inflation
forecast
5. DENMARK
Interim forecast, February 2012
17
Following the rebound in 2010, and despite solid
exports, the overall performance of the Danish
economy was subdued in 2011 owing in particular
to low confidence among households and firms in
the light of the ongoing sovereign-debt crisis. With
lower than initially anticipated domestic demand in
the third quarter, annual real GDP growth is not
projected to exceed 1% in 2011, i.e. corresponding
to a 0.2 pp. downward revision compared with the
autumn 2011 forecast. Nevertheless, the
improvement of indicators such as industrial
production, car sales and exports in the course of
the fourth quarter 2011 suggests that Denmark is
likely to have avoided a technical recession
towards the turn of the year.
In 2012, real GDP is expected to grow slowly at
around 1%, driven by domestic demand. The
downward revision as compared with the autumn
2011 forecast (1.4%) mainly reflects a weaker
external environment. Private consumption is
expected to accelerate in the course of 2012 as
contributions to the voluntary early retirement
pension (VERP) scheme are to be reimbursed
following the adoption of the retirement reform by
Parliament. However, it is envisaged that a fragile
housing market and a stagnating labour market
will continue to weigh on consumer spending.
Moreover, households are likely to continue with
the needed balance sheet deleveraging and to
maintain precautionary savings at a relatively high
level during the current period of elevated
economic uncertainty.
At the current juncture, low interest rates due to
the safe-haven status of Danish government and
mortgage bonds underpin the Danish housing
market. Nevertheless, indicators such as the
number of houses for sale and the long selling
periods bear witness to a frail market, with house
prices expected to continue to fall in 2012.
Overall investment growth is projected to have
bottomed out in 2011. However, credit conditions
are expected to remain tight and gross fixed capital
formation continues to be driven largely by public
initiatives in 2012, in line with the government's
"kick-start" stimulus package and supported
further by large-scale infrastructure projects (e.g.
extension of the Copenhagen Metro and the
railway network).
Exports proved resilient in 2011, thanks to high
growth rates at the beginning of the year, i.e. prior
to the slow-down in world trade. Thus in 2012,
export growth is projected to be significantly lower
due to a less favourable external environment, in
particular the subdued growth outlook for
Germany and Sweden, Denmark's main trading
partners. The large share of non-cyclical goods –
such as food and pharmaceuticals – in Danish
exports should, on the other hand, sustain export
growth.
Furthermore, with an almost steady unemployment
rate and private employment not expected to pick
up soon, current wage negotiations in the private
sector are expected to yield moderate wage
increases in the subsequent two-year period and
thereby some gains in cost competitiveness. Import
growth should remain strong, however, due to the
strength of domestic demand.
-0.8
-0.4
0.0
0.4
0.8
1.2
1.6
10Q1
10Q3
11Q1
11Q3
12Q1
12Q3
-2
-1
0
1
2
3
4
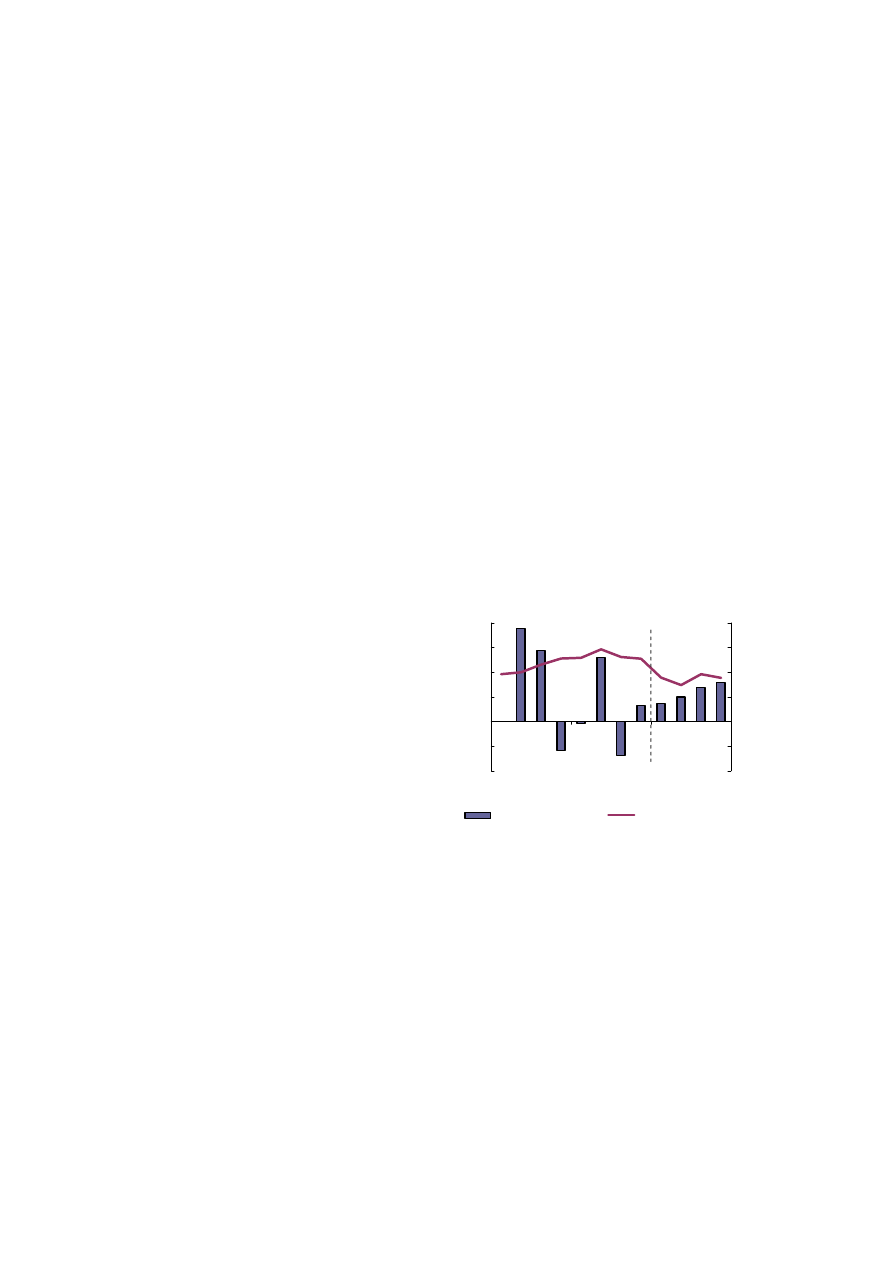
GDP growth (q-o-q%, lhs)
HICP (quarterly y-o-y%, rhs)
Graph 5.1: Denmark - GDP growth and inflation
forecast
While real wages fell in 2011, they may pick up
slightly this year as the inflation rate is projected to
drop by almost 1 pp. from 2.7% in 2011 to 1.8% in
2012. Due to the oil-price hike at the beginning of
2011, the energy contribution to inflation remained
relatively large throughout the year but this effect
will peter out in 2012. Services and processed food
should be the main contributors to inflation. In
addition, a rise in taxes on cigarettes and air
pollution, as part of the government's 2012 budget
law, will add around ¼ pp. to inflation, just as the
earlier introduction of a tax on saturated fat in the
fourth quarter of 2011 will continue to contribute
to inflation this year.

6. GERMANY
Interim forecast, February 2012
18
The upswing of the German economy continued in
2011, with real GDP estimated to have increased
by 3.0% (after 3.7% in 2010). The expansion was
mainly driven by domestic demand, which is
expected to have contributed 2.1 pps. to growth.
Private consumption saw its largest increase in five
years, supported by a benign labour market, as
employment reached its highest level in 20 years.
Gross fixed capital formation continued to expand
markedly, reflecting both continued investment in
machinery and equipment and the strongest
increase in construction since the mid-1990s.
While exports remained dynamic, imports were
also robust on the back of strong domestic
demand, which is estimated to have resulted in a
growth contribution of net exports of 0.8 pp. (after
1.5 pps. in 2010).
However, the growth momentum slowed
noticeably in the course of the year as the crisis
deepened. Uncertainty took its toll on the
sentiment of economic agents, while export
prospects weakened and new orders – both for
domestic business and from abroad – declined
considerably in the second half of 2011. Following
a gain of 0.6% q-o-q in the third quarter, real GDP
contracted by 0.2% q-o-q in the last quarter of the
year. According to preliminary indications, exports
declined amid the weak international environment,
as did private consumption following the solid
expansion of the previous quarter. Gross fixed
capital formation increased, with buoyant
construction activity likely to have been supported
by the mild weather at the end of the year.
Available indicators for the first quarter of 2012
signal an improvement in sentiment among both
firms and households. This suggests that the
growth momentum has experienced a temporary
interruption rather than signalling an entry into
recession. A slight edging-up of GDP in the first
quarter, followed by an acceleration of growth in
the course of the year, thus continues to be the
central scenario for the German economy,
although risks remain particularly pronounced at
the current juncture.
Domestic demand is expected to continue to drive
the expansion. Private consumption should be
further underpinned by the resilient labour market,
where available working-time flexibility is likely
to be used to absorb the effects of a temporary
slowdown in activity, as well as by healthy wage
growth amid slowing inflationary pressures. Gross
fixed capital formation is likely to expand
considerably more slowly than last year, with some
plans for investment in machinery and equipment
likely being put on hold amid the current
uncertainty. However, this effect should be
dampened by the fact that capacity utilisation,
although diminishing, remains high, as well as by
still-favourable financing conditions. While the
end of temporary stimulus measures should lead to
downward pressure on public investment, private
housing investment should remain relatively
dynamic, possibly benefitting from the increase in
the perceived risk of investment alternatives.
Export prospects have worsened somewhat
compared to the autumn forecast, given the weaker
outlook for Germany's trading partners in the EU,
which account for around 60% of the country's
goods exports. Given still-lively imports on the
back of robust domestic demand, net external trade
should exert a considerable drag on GDP growth
this year.
Overall, real GDP is expected to gain 0.6% this
year. The downward revision relative to the
autumn forecast is fully explained by the lower
carry-over from 2011 following the weaker-than-
expected outcome in the last quarter of the year.
HICP inflation was slightly higher than expected
in the last quarter of 2011, driven by higher energy
prices. The inflation rate is now projected to
average 1.9% in 2012, reflecting more elevated oil
prices than anticipated in autumn. Core inflation
should also remain contained reflecting slower
activity than last year.
-0.5
0.0
0.5
1.0
1.5
10Q1
10Q3
11Q1
11Q3
12Q1
12Q3
-1
0
1
2
3
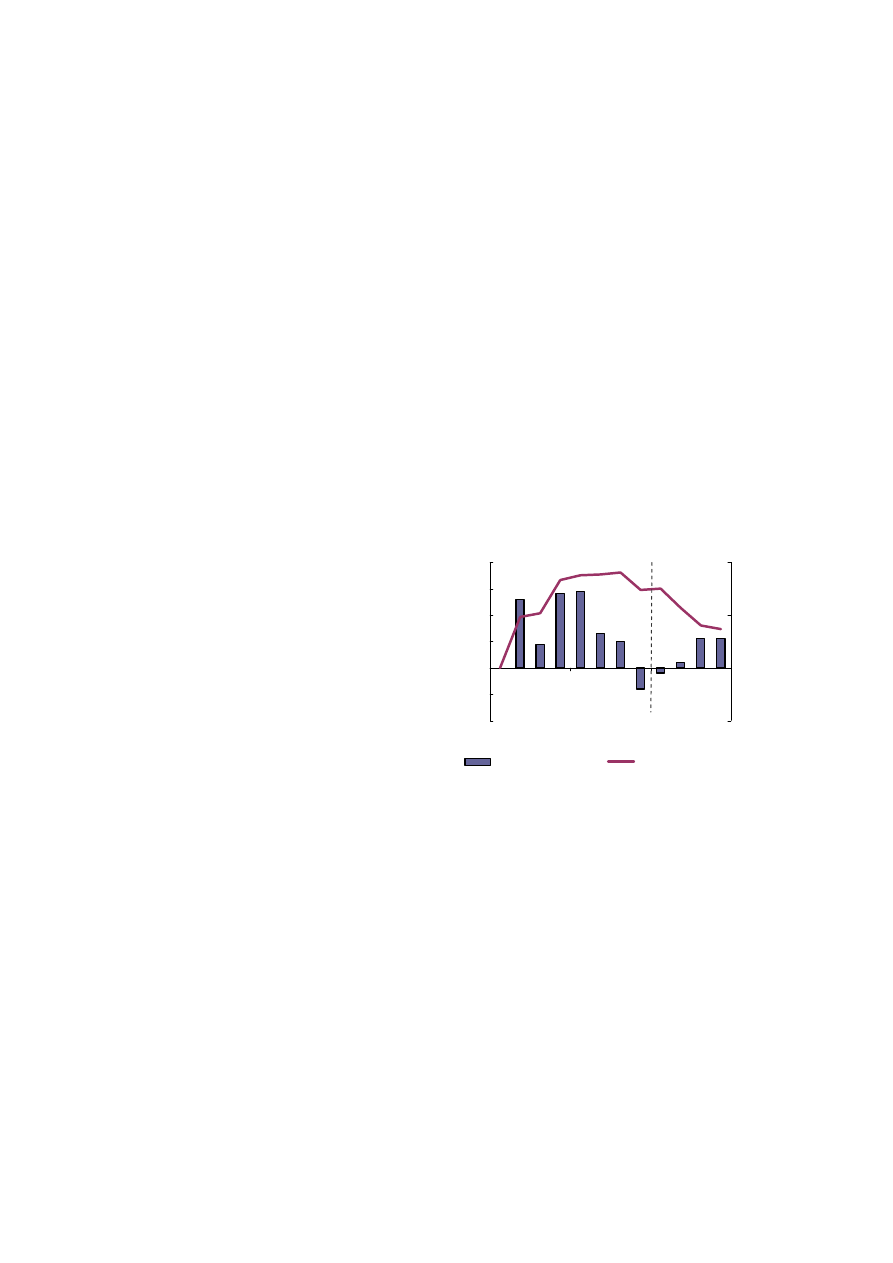
GDP growth (q-o-q%, lhs)
HICP (quarterly y-o-y%, rhs)
Graph 6.1: Germany - GDP growth and inflation
forecast
7. ESTONIA
Interim forecast, February 2012
19
According to the flash estimate from Statistics
Estonia, annual economic growth in Estonia
reached 7.5% in 2011, i.e. 0.5 pp. lower than
projected in the autumn forecast. Domestic
demand was stronger than expected and export
performance remarkable. However, in the last
months of the year Estonia was not immune to the
deteriorating confidence seen in many Member
States. As a result, GDP shrank by 0.8% q-o-q in
the last quarter of 2011. The contraction, however,
was mostly limited to the export-oriented
electronics sector, which had been one of the main
growth drivers in the initial phase of the recovery.
More recently, manufacturing production seems to
have stabilised at somewhat below its recent peak
level.
The 2012 outlook for the Estonian economy has
significantly deteriorated, driven by falling
confidence and weaker external demand around
the turn of the year. As a result, GDP growth
expectations for 2012 have been revised
downwards, from 3.2% in autumn to 1.2% in the
present forecast.
Despite remarkable productivity adjustments in the
recent recession, exports are expected to remain
weak in the first half of 2012. Export performance
and growth will largely depend on the pace of the
global recovery.
Domestic demand was mainly driven by strong
fixed investment, which rose by 23% in the first
three quarters of 2011 compared to first three
quarters of previous year, mostly due to corporate
spending targeted at increasing productivity.
However, public investment surprised positively in
the second half of the year. Given the lower
utilisation of production capacity in January 2012
compared to the previous October (68% compared
to 74%) reflecting the economic deceleration, new
corporate investment projects are likely to be put
on hold for a while. Nevertheless, strong public
investment is expected to largely offset the
slowdown in corporate investment. The robust
infrastructure investment already planned reflects
carbon-credit-trade contracts aimed at increasing
energy efficiency, but also higher absorption of EU
structural funds.
Reflecting a relatively improved labour market
situation and an increased disposable income,
private consumption is expected to grow
moderately this year.
Average annual HICP inflation reached 5.1% in
2011, spurred by higher international food and oil
prices since spring 2010. However, the
contribution of non-energy industrial goods to
inflation remained low, alleviating the risk of
competitiveness losses. The impact of the euro
changeover on 1 January 2011 appeared limited.
Looking forward, lower commodity prices since
mid-2011 should contribute to further inflation
moderation in 2012. Given lower output growth
and the slower decline in unemployment in 2012,
second-round effects from earlier commodity price
increases and upward pressure on wages due to
skills mismatches should also be moderate.
-2
-1
0
1
2
3
4
10Q1
10Q3
11Q1
11Q3
12Q1
12Q3
-3
0
3
6
GDP growth (q-o-q%, lhs)
HICP (quarterly y-o-y%, rhs)
Graph 7.1: Estonia - GDP growth and inflation
forecast
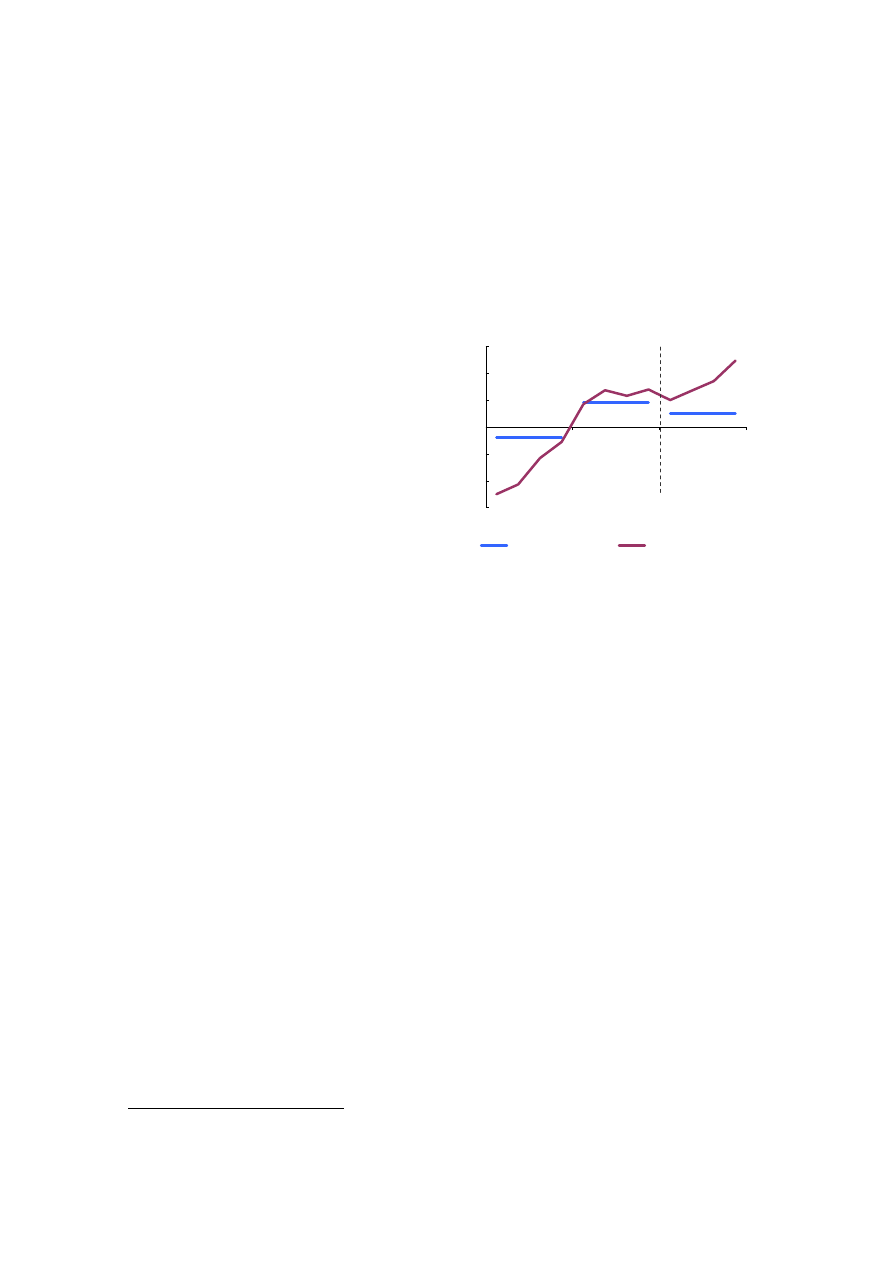
8. IRELAND
Interim forecast, February 2012
20
Ireland's economy is estimated to have returned to
modest growth of 0.9% in 2011, after a sharp 10%
contraction in output between 2008 and 2010.
Following stronger-than-expected growth in the
first half of the year (1.8% and 1.4% q-o-q in the
first and second quarters respectively), third-
quarter data were weaker than anticipated (with
GDP contracting by 1.9% q-o-q), especially in
terms of domestic demand, while exports held up
rather well.
(2)
Indeed, for 2011 as whole, growth is
estimated to have been entirely export-led. Net
exports contributed an estimated 3.6 pps. to GDP
in 2011, as external demand benefited from
competitiveness improvements, while domestic
demand continued to contract due to fiscal
consolidation, falling employment and household
balance sheet repair.
A small current-account surplus of 0.4% of GDP is
expected on the basis of net export growth.
Employment continued to contract, by 2.2%,
although the unemployment rate stabilised through
the year at 14.3%, as participation declined and net
outward migration continued.
Due to weaker projected outlook for the euro area,
Irish export growth is expected to slowdown in
2012, although the unchanged outlook for the UK
and US economies (large trading partners for
Ireland) will provide some support. Net exports are
expected to contribute positively to growth, as
domestic demand contracts for a fifth successive
year. Overall, GDP is forecast to grow by a modest
0.5% in 2012. Private consumption is set to decline
once again as households continue to adjust their
balance sheets and the continuing reduction in
construction activity will see investment activity
decline once again
The current account is expected to move more into
surplus as domestic demand continues to contract.
Employment is set to fall once again as the public
service and financial sector shrink, with the
unemployment rate rising, with lowered
participation and some further net outward
migration mitigating in part the impact of the fall
in employment.
Inflation turned positive in 2011, largely on the
back of imported energy pressures, but remained
(2)
Given Ireland's small and very open economy, quarterly
figures are particularly volatile and subject to revision.
Thus they should be interpreted with caution.
low at 1.2%. It is expected to rise slightly to 1.6%
in 2012, with upward pressure coming from the
depreciation vis-à-vis sterling, and the effect of the
2 pps. increase in VAT as well as a number of
administered price increases throughout 2012.
-3
-2
-1
0
1
2
3
10Q1
10Q3
11Q1
11Q3
12Q1
12Q3
GDP growth (y-o-y%)
HICP (quarterly y-o-y%)
Graph 8.1: Ireland - GDP growth and
inflation
2011
2012
2010
forecast
Risks to the growth outlook remain tilted to the
downside. If downside risks to the euro area
materialise, it could have an impact on demand for
Irish exports. The continuing need for household
balance sheet repair could weigh on consumption
more heavily than projected. The low interest rate
environment may, on the other hand, assist the
household sector in this regard without impacting
unduly on already-low domestic demand.
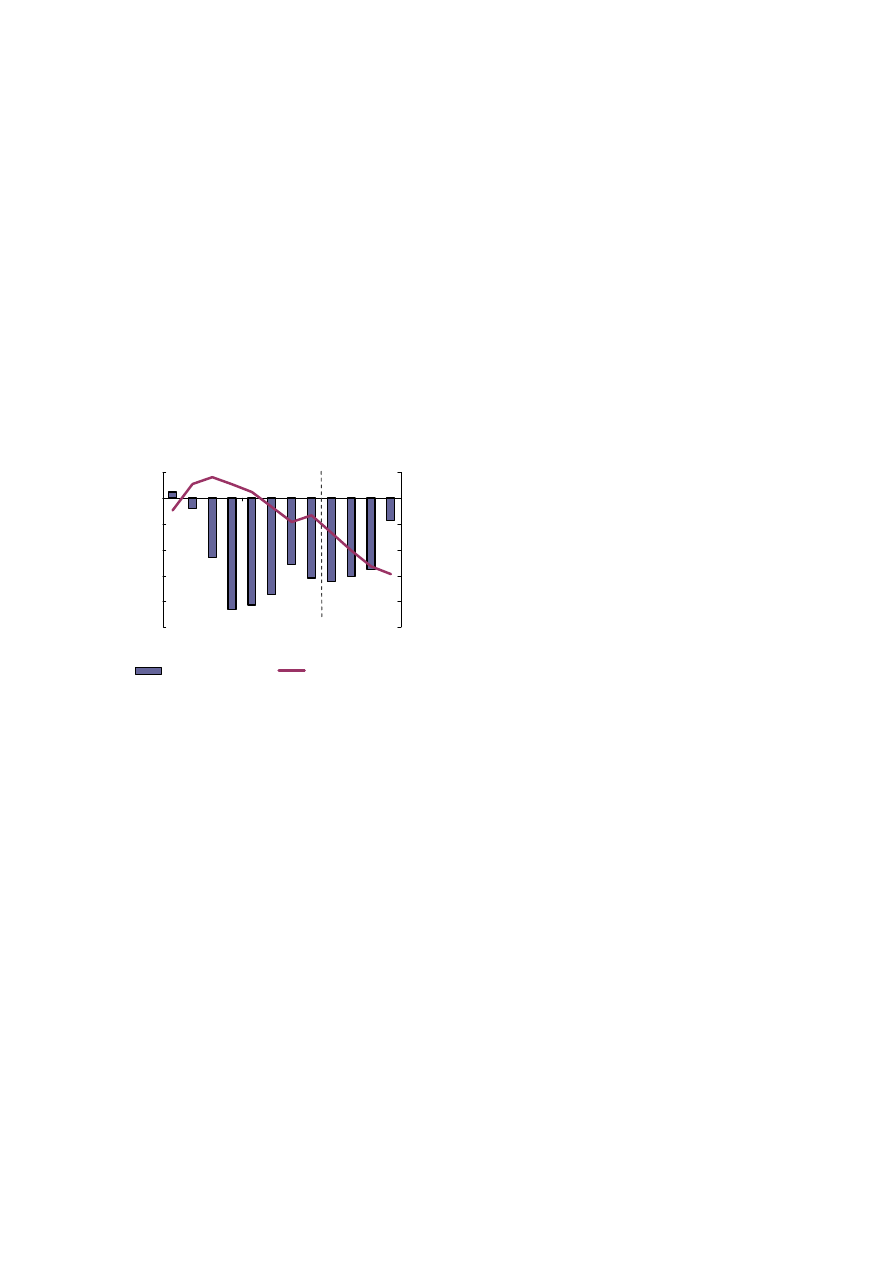
9. GREECE
Interim forecast, February 2012
21
In 2011, economic activity was much weaker than
anticipated in the autumn forecast. Recent flash
data for the last quarter of 2011 by ELSTAT reveal
that real GDP fell by 6.8% for the year as a whole.
The fall in domestic demand was driven by income
losses, tight access to credit for the private sector
and the ongoing adjustment in the labour market.
Exports of goods and services rose by an estimated
3.9% in real terms, although from a low base
(exports of services and goods represent about
24% of GDP in Greece), and decelerating from
4.2% in 2010.
-10
-8
-6
-4
-2
0
2
10Q1
10Q3
11Q1
11Q3
12Q1
12Q3
-6
-4
-2
0
2
4
6
GDP growth (q-o-q%, lhs)
HICP (quarterly y-o-y%, rhs)
Graph 9.1: Greece - GDP growth and inflation
forecast
The labour market is undergoing a painful
adjustment process. According to the Labour Force
Survey, in January to November 2011 the average
unemployment rate was 17.2%; for the year as a
whole employment is estimated to have contracted
by 4.8%. The increase in unemployment is
expected to continue in 2012.
Minimum wages in the private sector, and other
wages regulated by the National General
Collective Agreement will be reduced by around
22%. Unit labour costs for the business economy
are expected to fall by 15% over the next three
years. While the decision by the Government to
reduce minimum wages and the expected
emulation effect on other wages are intended to
improve competitiveness and absorb youth and
low-skilled workers, they are expected to hamper
domestic demand, which in the short term may
procure negative feedback loops into employment.
In a medium-term perspective, other structural
reforms are also expected to create more
favourable conditions for employment.
In 2012, real output is expected to shrink further,
by 4.3% – markedly lower than forecast in the
autumn and with substantial downside risks –
mirrored by very low consumer and business
confidence. Apart from the weakening external
demand, domestic demand is set to contract given
the expected acceleration of the labour market
adjustment, with wage cuts in the private sector.
Overall exports are set to be even less dynamic
than in the previous three years, despite the
competitiveness-enhancing reductions in labour
costs of Greek enterprises. On the other hand,
imports will continue to be affected by weak
domestic demand, so that the external sector will
again make a positive contribution to GDP.
Headline HICP inflation averaged 3.1% in 2011,
down from 4.7% in 2010. It rose by 2.2% in
January 2012. The slow reduction in prices is
mainly attributed to oil prices and tax measures
implemented under the adjustment programme.
Constant-tax inflation in 2011 was 1.2% in 2011.
However, for an economy in deep recession, the
inflation rate reveals deep inflexibility in product
and services markets. In 2012 the price rise trend is
expected to be reversed, resulting in slight
deflation of 0.5%. The main driving force stems
from anticipated falls in disposable income and
consumer spending due to wage cuts in the private
sector.
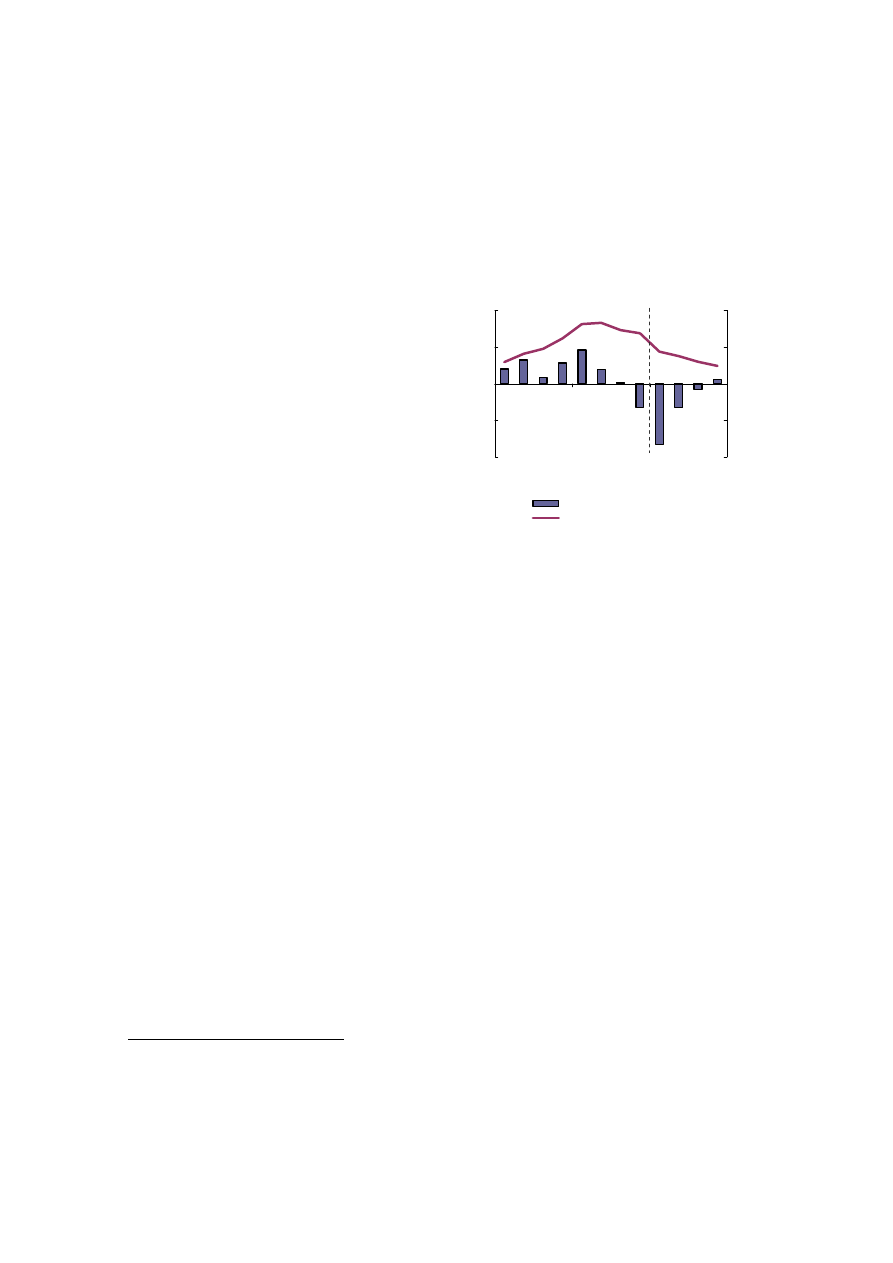
10. SPAIN
Interim forecast, February 2012
22
The Spanish economy lost momentum in the
second half of 2011. Real GDP growth stagnated
in the third quarter and declined by 0.3% q-o-q in
the last quarter. This deceleration was driven by a
weaker external environment, intensification of the
sovereign-debt crisis with negative spillovers to
the Spanish financial sector and to credit
conditions, lower public expenditures, and a
larger-than-expected deterioration in the labour
market. For 2011, real GDP growth is still
expected to have reached 0.7%, in line with the
Commission services' autumn forecast.
High private sector imbalances accumulated
during the housing boom and record-high
unemployment continue to weigh on the outlook
for the Spanish economy. The weaker outlook for
the euro area and still-high uncertainty, especially
in relation to the sovereign-debt crisis, are
expected to have an adverse effect on growth in
2012. As a result, real GDP is expected to contract
by around 1% this year, not taking into
consideration additional fiscal consolidation
measures still to be adopted
(3)
.Taking into account
additional fiscal measures in the forthcoming
budget may significantly change the picture both
for real GDP growth and for its individual
components. Real GDP growth is expected to
contract most significantly in the first half of the
year, especially in the first quarter, followed by
some improvement in the second half with growth
rates close to zero in the last quarter.
Private consumption is expected to be significantly
weaker this year, driven by persistently high
unemployment, large household debt, and a
binding credit constraint. Public consumption is
also expected to shrink, as Spain continues with its
fiscal consolidation programme and implements
the additional measures announced at the end of
December. Investment is expected to remain
subdued in an environment of high corporate
indebtedness (especially for construction and real
estate companies), excess capacity and difficult
access to credit. While domestic demand thus
remains a major drag on economic growth, net
(3)
Due to the general elections in November 2011, the
adoption of the draft budget for 2012 was postponed until
end-March. As this forecast is based on a no-policy-change
assumption, it takes into account only the temporary
extension of the 2011 budget together with the emergency
fiscal measures taken by the Spanish government on 30
December 2011 (including a hike in direct taxes and certain
expenditure cuts).
exports continue to provide some support thanks to
relatively resilient exports and the weaker imports
implied by the subdued domestic demand.
-0.8
-0.4
0.0
0.4
0.8
10Q1
10Q3
11Q1
11Q3
12Q1
12Q3
-4
-2
0
2
4
GDP growth (q-o-q%, lhs)
HICP (quarterly y-o-y%, rhs)
Graph 10.1: Spain - GDP growth and inflation
forecast
HICP inflation is forecast to decelerate
significantly, from around 3% in 2011 to 1.3% in
2012. This is mostly driven by the fading out of
transitory factors that fuelled inflation in 2011 (i.e.
electricity price and indirect taxes hikes) and by
very weak internal demand. Moderating wage
growth has also resulted in lower unit labour costs,
contributing to a further easing of inflationary
pressures. As a result, the inflation differential
with the euro area is expected to be negative,
leading to some improvement in Spanish price
competitiveness.
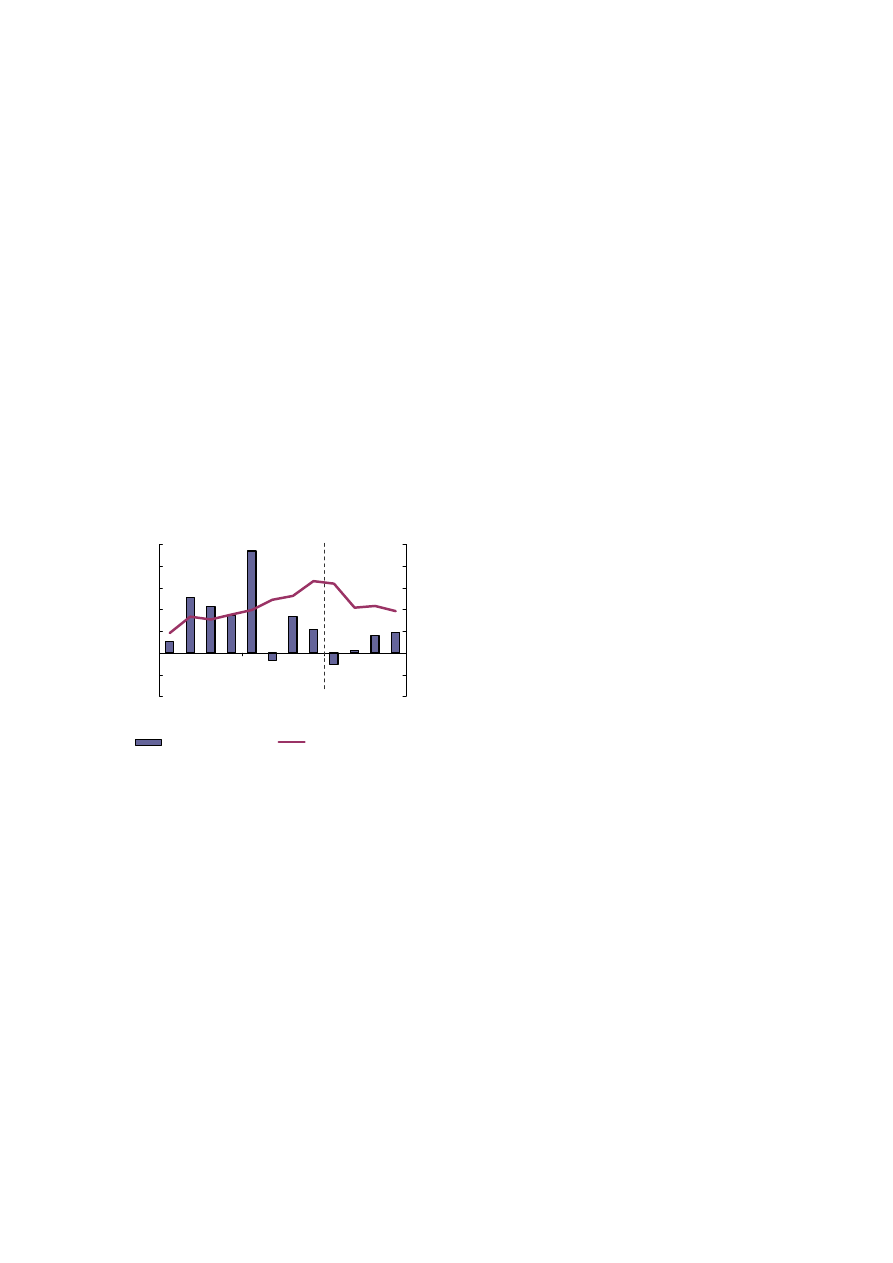
11. FRANCE
Interim forecast, February 2012
23
At 1.7%, estimated overall GDP growth in France
for 2011 is in line with the autumn 2011 forecast,
although the growth pattern was very uneven
throughout the year.
After strong growth in the first quarter of 2011
(0.9%) and a slight contraction in the second
quarter (–0.1%), GDP grew by 0.3% in the third
quarter. Household consumption resumed as the
influence of some temporary developments
(including the aftermath of the phasing out of the
car-scrapping premium and low energy
consumption due to mild weather) that had
affected the second quarter receded. At the same
time, investment proved weaker than expected on
amid decreasing confidence fuelled in particular by
tensions on the financial markets.
-0.4
-0.2
0.0
0.2
0.4
0.6
0.8
1.0
10Q1
10Q3
11Q1
11Q3
12Q1
12Q3
0.0
0.5
1.0
1.5
2.0
2.5
3.0
3.5
GDP growth (q-o-q%, lhs)
HICP (quarterly y-o-y%, rhs)
Graph 11.1: France - GDP growth and inflation
forecast
In the last quarter of 2011, GDP growth proved
much more resilient than had been forecast in the
autumn. While increasing unemployment acted as
a drag on household consumption, investment
rebounded to 0.9%. This was in particular due to a
strong increase in car purchases by companies,
possibly in anticipation of the higher taxes on
polluting vehicles which comes into force at the
beginning of 2012. This acceleration in investment
is therefore expected to be temporary. Net exports
were strong but were offset by declining
inventories.
The stronger-than-expected growth in the last
quarter of 2011 translates into a higher carry-over
for 2012. Nonetheless, GDP is expected to
increase by only 0.4% for 2012 as a whole, below
the 0.6% projected in the autumn forecast.
Declining confidence throughout the euro area,
rising unemployment and the impact of the fiscal
consolidation measures included in the November
fiscal package, which was announced after the cut-
off date of the autumn forecast, and in the
supplementary budget for 2012, are expected to
bring economic growth to a standstill during the
first half of this year. Growth is forecast to resume
again in the second half, on the back of a gradual
pick-up in domestic demand.
Turning to the components of domestic demand,
higher unemployment is expected to weigh on
disposable income of households, in particular in a
context of increasing inflation. Consumers'
assessment of their own financial situation reached
a historical low in December suggesting low
consumption growth in the first semester.
Confidence indicators in both manufacturing
industry and services have decreased sharply since
the summer. The demand for loans has also
receded while credit conditions have tightened
somewhat. As one-off effects observed in the last
quarter of 2011 dissipate, a temporary contraction
of investment is expected in the first quarter. Net
trade which contributed positively to growth in the
last three quarter of 2011, would slow down due to
the weakening of global activity, but would have
an overall positive contribution to growth in 2012.
Downward risks remain significant, linked in
particular to the general economic development in
the euro area.
HICP inflation has been revised up, to 2.2%, in
2012, 0.7 pp. above the autumn forecast. Energy
prices, which had been expected to slow down
markedly, have instead remained on an upward
path in 2011, with a strong impact on HICP. The
increase in the reduced rate of VAT for specific
categories of goods and services in January 2012,
together with the announced increase in the
general rate from 19.6% to 21.2% in October, is
expected to contribute to inflation. The adverse
conditions in the labour market, which are
expected to weigh on wage negotiations, should by
contrast reduce inflationary pressures.

12. ITALY
Interim forecast, February 2012
24
The Italian economy entered recession again in the
second half of 2011. The acute tensions recorded
in the Italian and euro-area sovereign-debt markets
in the final months of 2011, along with the ensuing
tighter credit conditions affecting the private
sector, implied a sharp deterioration in economic
agents' confidence and a fall in demand. According
to the flash estimate of the Italian statistical office
(ISTAT), real GDP contracted significantly in the
last quarter of 2011, by 0.7% q-o-q after -0.2% in
the third quarter. Consequently, estimated real
GDP growth for the year 2011 as a whole has been
revised downward, from 0.5% in the autumn
forecast, to only 0.2% (or 0.4% in calendar
adjusted terms).
After incorporating the large GDP decline in the
fourth quarter of 2011, the negative growth
impulse into 2012 is 0.6 pp., much worse than the
-0.1 pp. expected in the autumn 2011 forecast. As
uncertainty remains elevated and thus major
spending plans of consumers and firms are kept on
hold, growth prospects for the first half of 2012
have also worsened relative to the autumn forecast.
Real GDP is now expected to contract by a further
0.7% in the first quarter of 2012 and by 0.2% in
the second quarter. Economic activity is set to
stabilise in the second half of the year, under the
assumption of no further deterioration in financial
market conditions and a stable spread between
Italian and German sovereign bonds at around 370
bps for 10-year maturities. As a result, real GDP is
expected to contract by 1.3% in 2012 as a whole
after the 2010-11 mild recovery. This implies that
following the deep recession recorded in 2008-09,
the level of real GDP in 2012 is projected to be
around 6% lower than in 2007.
Looking at the demand components, very tight
financing conditions and relatively low capacity
utilisation are expected to hold back gross fixed
capital formation. Equipment investment is set to
drop substantially in 2012, while construction
investment is expected to be scaled down at
broadly the same pace as in 2011. Private
consumption is set to fall in 2012, after increasing
marginally in 2011. This is mainly due to the fall
in households' real disposable income, under the
impact of declining employment and the large
fiscal consolidation measures adopted in 2010-11.
The substantial drop in domestic demand is
expected to lead to a fall in imports in 2012. By
contrast, exports are set to continue to expand in
2012 on the back of sustained demand from extra-
EU trade partners. As a result, the positive
contribution of net exports to real GDP growth is
expected to be substantial in 2012, as in 2011.
Thanks to the improved trade balance, the current
account deficit is projected to narrow significantly
in 2012 relative to the 3¼% of GDP deficit
recorded in 2011.
Negative cyclical conditions, along with some
labour hoarding, are expected to lead to stagnant
labour productivity over 2011-12. As a
consequence, unit labour costs are projected to rise
despite the moderate wage increases expected in
the private sector and the wage freeze in the public
sector.
HICP inflation is set to remain at 2.9% in 2012, as
in 2011. Core HICP inflation, i.e. excluding energy
and unprocessed food, is projected to stabilise in
2012. This relatively high inflation – despite
falling domestic demand and moderate pressures
from labour costs – is explained by the further rise
in oil prices and the effects of fiscal consolidation
measures. The standard VAT rate was increased by
1 pp. (to 21%) in September 2011, while excise
duties on energy products were raised with the new
consolidation package adopted in December 2011.
The latter also specified the so-called "safeguard
clause": an additional 2 pps. increase in both the
21% standard VAT rate and the 10% reduced rate
will be effective as from October 2012, unless
equivalent resources are raised through the reform
of the tax and social assistance systems. This
further VAT increase is incorporated in this
forecast.
-0.8
-0.6
-0.4
-0.2
0.0
0.2
0.4
0.6
0.8
10Q1
10Q3
11Q1
11Q3
12Q1
12Q3
-4
-3
-2
-1
0
1
2
3
4
GDP growth (q-o-q%, lhs)
HICP (quarterly y-o-y%, rhs)
Graph 12.1: Italy - GDP growth and inflation
forecast

13. CYPRUS
Interim forecast, February 2012
25
The Cypriot economy grew by a modest 0.5% in
2011. After a good first half year when GDP rose
by 1.5% y-o-y thanks to an exceptionally good
tourist season, economic activity was badly
affected by the accident in July that destroyed the
Vassilikos electricity producing plant, which
accounted for half of the total generating capacity
of Cyprus. Moreover, a worsening external
environment and tightening financial and fiscal
conditions compounded the adverse effect on
economic activity.
Domestic demand, traditionally the main driver of
growth, shrank in 2011. Tightening bank lending
conditions along with a worsening labour market
outlook and weakening confidence weighed on
private consumption. In addition, weak foreign
demand for housing and a restructuring of
corporate balance sheets kept investment on a
correction path for a third year in a row. On the
other hand, the external sector made a positive
contribution to growth. Tourist arrivals and
revenues posted an increase of 10% and 13%
respectively. This was due to political instability in
competing Mediterranean destinations and an
increased flow of arrivals from developing markets
such as Russia. Also, import growth decelerated, in
line with the contraction in domestic demand.
GDP is projected to contract by 0.5% in 2012 due
to weak domestic demand. The downward revision
relative to the autumn 2011 forecast is explained
by the worsening of the external environment and
by the adoption of additional consolidation
measures, not accounted for in the autumn 2011
forecast. Furthermore, the deterioration in financial
markets and the tightening of credit conditions
may raise the cost of financing to the private sector
and limit access to it. Leading indicators point to
weak albeit improving consumer and business
confidence. This suggests that recovery should set
in slowly, during the second half of 2012, with the
improvement of the external environment, the start
of the tourist season and the resumption of
investment projects as uncertainty dissipates.
Housing investment is expected to remain weak,
while other construction investment is likely to
benefit from reconstruction work in the destroyed
Vassilikos power station and from other
infrastructure projects. Moreover, the contribution
of the external sector to growth is set to remain
positive. While slowing global trade and
worsening economic prospects in Cyprus' main
trading partners is likely to weigh on exports of
goods, this is expected to be partly offset by the
healthy performance in business services and
tourism. Imports are set to decline, against a
backdrop of weak domestic demand.
HICP inflation is projected to decline to 2.8% in
2012 from 3.5% in 2011 on the back of easing
commodity prices combined with weakening
domestic demand. Furthermore, the base effect of
increased electricity prices is set to dissipate in the
last quarter of the year. Core inflation is forecast to
remain contained at about 1.8%.
Overall, risks appear to be balanced. On the one
hand, greater spillovers from potential worsening
conditions in Greece, due to the large exposure of
the financial sector, are substantial. Also,
tightening credit conditions, coupled with already-
higher financing costs and the high indebtedness of
private agents, could delay the rebound in
consumption and investment. On the other hand,
external demand may strengthen more than
expected if the announced strategic plans by the
Cyprus government for attracting more tourists and
foreign investors succeed (ex. plans for the
introduction of new destinations, for tourist traffic
growth, and incentive schemes for winter tourism).
Investment, for its part, may be sustained through
various announced construction and infrastructure
projects.
-1.5
-1.0
-0.5
0.0
0.5
1.0
1.5
10Q1
10Q3
11Q1
11Q3
12Q1
12Q3
-6
-4
-2
0
2
4
6
GDP growth (q-o-q%, lhs)
HICP (quarterly y-o-y%, rhs)
Graph 13.1: Cyprus - GDP growth and inflation
forecast

14. LATVIA
Interim forecast, February 2012
26
Latvia's economic growth exceeded expectations
in 2011 despite a slowdown, driven by weaker
external demand, in the last quarter of the year.
According to the flash estimate of the national
statistical office, GDP rose by 5.3% in 2011,
against 4.5% in the autumn forecast. The
annualised seasonally unadjusted rate slowed to
5% in the last quarter of the year from 6.6% in the
previous quarter. Trends in retail trade and
industrial production show a continued slowdown
in early 2012, which could translate into a mild
contraction in the first quarter of the year
compared with the previous quarter.
On the other hand, the Economic Sentiment
Indicator rebounded to 105.3 in January from an
average of 102.6 in the last quarter of 2011,
reaching a new four-year high. Trade volumes and
transport services also remained quite resilient to
the slowdown in Europe since the summer.
Nevertheless, weaker demand from major trading
partners, as well as risks of more cautious
household consumption and corporate investments,
lead to a downward correction to the growth
forecast for Latvia to 2.1% in 2012 from 2.5% in
the Commission autumn forecast.
The GDP breakdown by demand components
confirms the continuous rebalancing of the
economy towards export-oriented industries.
According to data of the national statistical bureau
for January-September 2011, the share of exports
in GDP widened to 60% from 53% for the same
period of the previous year. Despite some
moderation in the last quarter of 2011, the share of
exports most probably continued to rise. Balance
of payments figures indicate a significant rebound
in the service sector that offsets part of the
slowdown in the external trade with goods.
Tourism services made a substantial contribution
to the growth rate in export of services in 2011,
along with strong performances in ports and
railway cargo services linked to transnational
transport channels. However, the rebalancing
toward export industries is likely to weaken
substantially in 2012, as external demand restraints
are expected to result into a balanced growth in the
domestic and export components of GDP.
The harmonised index of consumer prices (HICP)
was in line with expectations, at 4.2% in 2011 as a
whole, including a large contribution from the
increase in VAT rates. The constant-tax index is
estimated at 2.7% in 2011 reflecting significant
price hikes in the energy and food markets. For
2012 as a whole, average inflation is projected to
decelerate to 2.5% as the impact of the tax hikes in
2011 weakens substantially. In comparison with
the autumn forecast, the figure is revised upwards
by 0.1 pp. due to an upward revision of the oil-
price assumptions, only partly offset by subdued
domestic demand. Uncertainties related to prices
of primary energy resources represent a significant
risk to the inflation forecast, as the country is
strongly dependant on energy imports and the use
of energy inputs in relation to GDP is one of the
highest in the EU.
-2
-1
0
1
2
10Q1
10Q3
11Q1
11Q3
12Q1
12Q3
-6
-3
0
3
6
GDP growth (q-o-q%, lhs)
HICP (quarterly y-o-y%, rhs)
Graph 14.1: Latvia - GDP growth and inflation
forecast
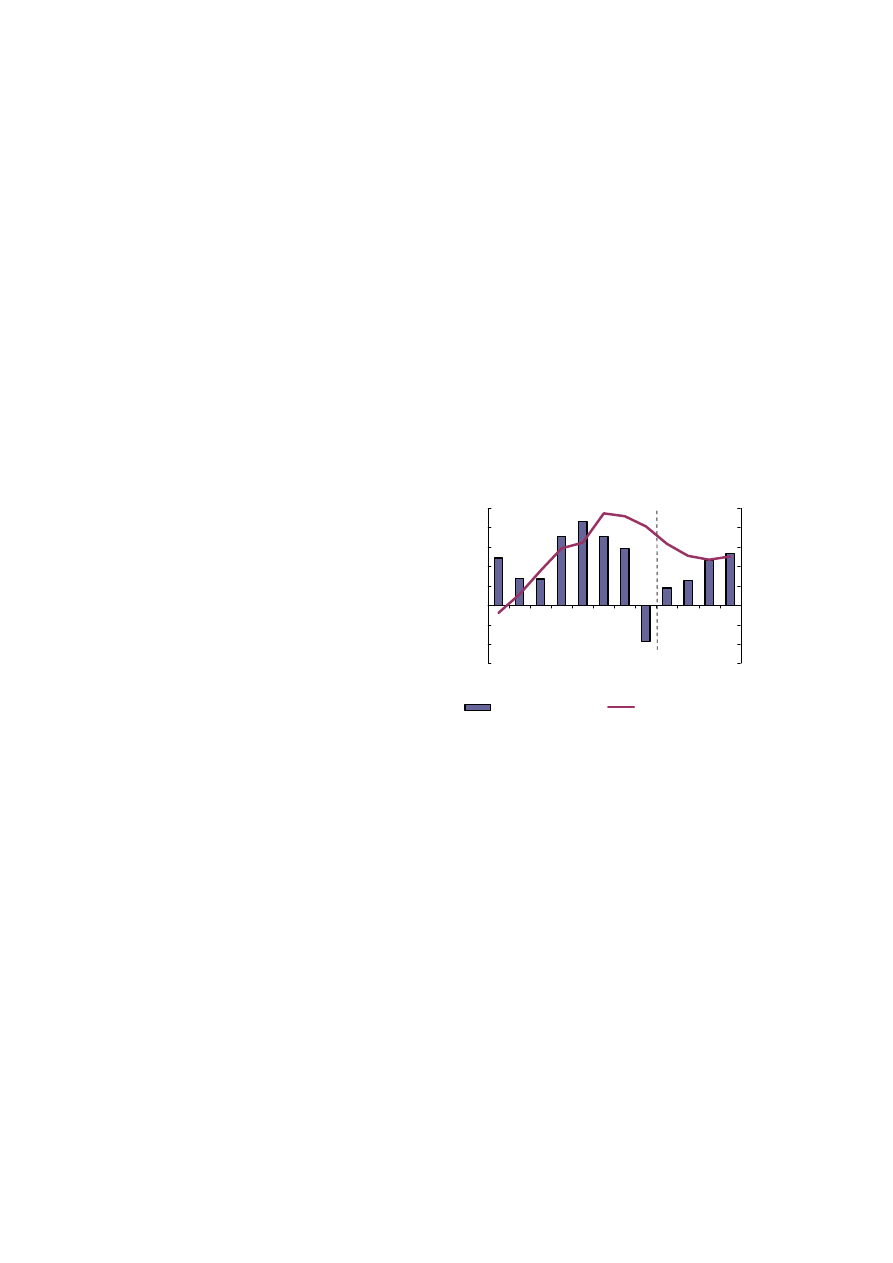
15. LITHUANIA
Interim forecast, February 2012
27
After a strong economic performance in 2011 with
real GDP growing by 5.8%, the worsened global
economic outlook and persistent tensions in the
world financial markets are now expected to slow
Lithuania's economy more markedly than had been
expected at the time of the autumn 2011 forecast.
Economic output is projected to grow by 2.3% in
2012.
The strong growth in 2011 was initially driven by
strong external demand. Substantial nominal wage
declines and productivity improvements helped
improve competitiveness and Lithuania took full
advantage of the growing export markets. Rising
exports boosted corporate profitability and
contributed to improvements on the labour market.
Consequently, private consumption and investment
growth gained momentum, and domestic demand
took over as the main driver of economic growth.
However, at the end of the year, Lithuania started
to feel the repercussions of the slowdown in the
EU. In the last quarter of 2011, real GDP grew by
4.5% y-o-y, down from 7.3% in the third quarter.
Increased uncertainty, as well as the bankruptcy of
the domestic bank Snoras at the end of 2011, have
dampened consumer confidence and business
expectations. These factors are expected to
continue to hold back private consumption and
private investment in 2012. Moreover, the on-
going fiscal consolidation may further curtail
domestic consumption, while public investment
will continue to grow due to the frontloading of
EU co-financed projects. Against this background,
unemployment is likely to remain high, especially
among the youth, and skill mismatches have
appeared in some sectors.
Lithuania's economic performance in 2012 will
depend considerably on developments in its main
export markets (Germany, Poland, Russia and the
other two Baltic countries) and on prospects for the
wider euro area. Robust export performance in
2011 started to wither at the end of the year.
Exports are projected to remain weak in the first
half of 2012, before picking up in the third quarter
in line with the forecast for its trading partners.
This, together with a resumption of growth in
private consumption, will contribute to
accelerating GDP growth in the second half of
2012.
HICP inflation decreased at the end of 2011 to
reach an annual average of 4.1%, after accelerating
in the middle of the year, driven mainly by the
energy and food – although commodity prices
declined towards the end of 2011. Inflation is
forecast to decelerate to 2.6% in 2012, mainly
driven by lower commodity and food prices as
well as weakening domestic demand. Some
domestic factors, such as rising electricity and
heating prices, as well as excise taxes on tobacco
products, will provide limited upward pressure on
inflation. Due to expected moderate wage growth
and still high unemployment, overall domestic
price pressures will remain rather weak.
-1.5
-1.0
-0.5
0.0
0.5
1.0
1.5
2.0
2.5
10Q1
10Q3
11Q1
11Q3
12Q1
12Q3
-3
-2
-1
0
1
2
3
4
5
GDP growth (q-o-q%, lhs)
HICP (quarterly y-o-y%, rhs)
Graph 15.1: Lithuania - GDP growth and inflation
forecast
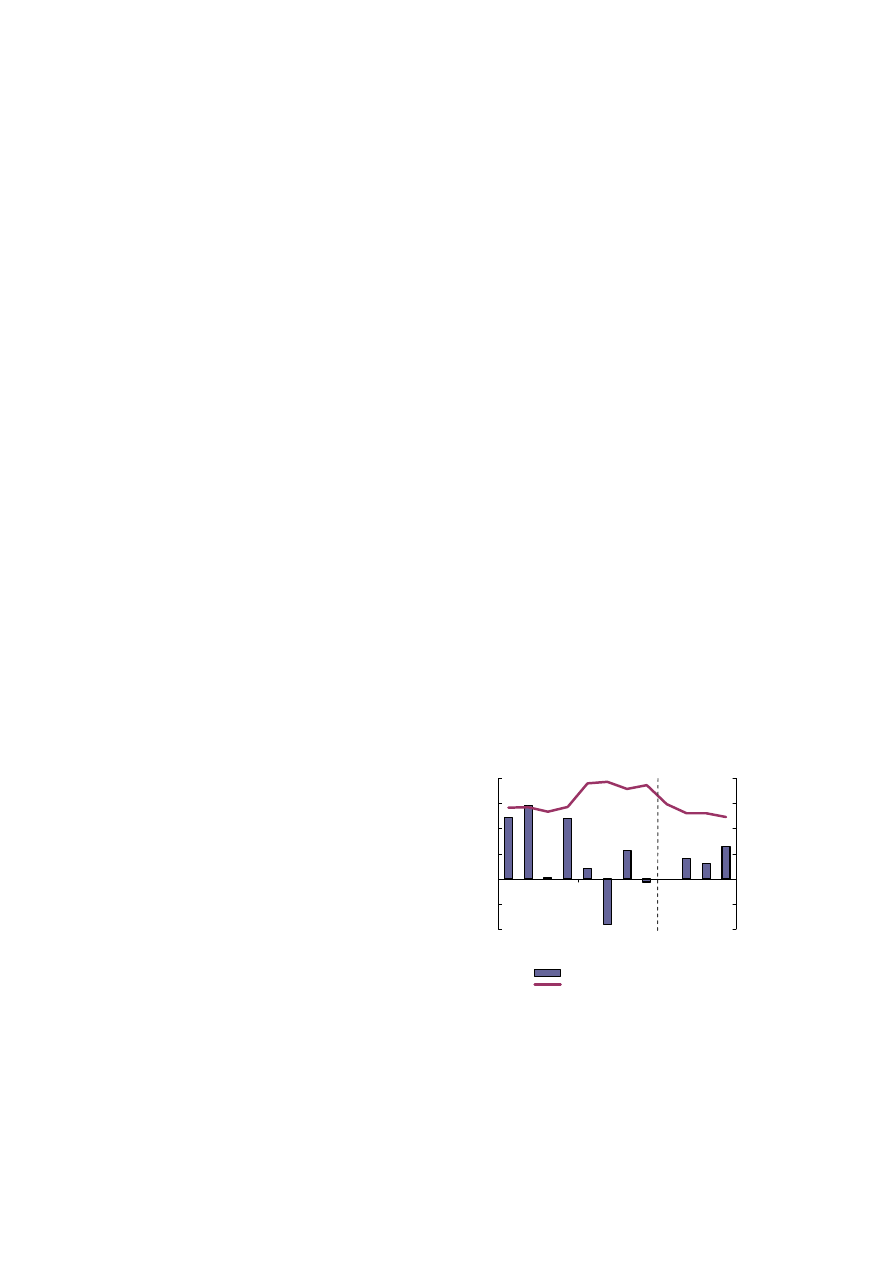
16. LUXEMBOURG
Interim forecast, February 2012
28
GDP growth for 2011 has been revised down to
1.1% from 1.6% projected in the autumn 2011
forecast. A strong downward revision of quarterly
growth in the second quarter of 2011 has only
partially been compensated by a strong third
quarter. As a consequence, the most recent data
show an increase in GDP of only 1.1% over the
first three quarters of 2011, mainly reflecting
developments in domestic demand. The general
weakening of global activity and the sovereign-
debt crisis in the euro area have weighed on
exports, especially on the performance of the
important financial sector. Witnessing the further
deterioration of indicators in the fourth quarter, a
small contraction of 0.1% of the Luxembourg
economy in the last quarter of 2011 cannot be
excluded.
Since December 2011, there have been some signs
of stabilisation. Consumer confidence improved
after a two-year low had been reached in October.
An improving international environment should
contribute to a slow return to recovery during
2012. With the carry-over from 2011 expected to
be close to zero and manufacturing and financial
services contributing little to growth, overall
growth in 2012 is now forecast to be around 0.7%.
This has been revised down from 1.0% projected
in the autumn forecast as the recovery is now only
expected to materialise from the second quarter
and to be less intense. Private consumption, which
is estimated to have been rather weak in 2011, is
expected to accelerate only a little in 2012. On the
other hand, the number of building permits
delivered in 2011 points to a strong performance
by the construction sector in 2012, although the
winter weather may affect figures for the first
quarter of the year.
Job creation in Luxembourg was substantial in the
first half of 2011 but slowed down afterwards. As
a consequence, unemployment rose rapidly
towards the end of the year (it increased from 4.9%
in October to 5.2% in December). This trend is
expected to continue over 2012, steering
unemployment towards a historic high. In 2011,
non-resident employment has grown faster than
resident employment, but the difference is much
smaller than in the ten years preceding the crisis.
On 1 October 2011, all wages in Luxembourg
were automatically increased by 2.5% following
the postponed application of the wage indexation
mechanism, which was originally due in May
2011. At the end of 2011, the government of
Luxembourg also decided to postpone the next
automatic indexation, normally due in March
2012, to October 2012. As a consequence, wage
increases in 2012 induced by the indexation
mechanism will only be 2.5% instead of 4%
without the postponement. Thus, wages per
employee are expected to rise by 3.2%. This would
result in an increase in (nominal) unit labour costs
in 2012, given the small increase in output and
even a negative evolution in terms of added value
per employee.
Inflation (measured by the HICP) reached 3.7% in
2011, up from 2.8% in 2010. It has been driven
upward by rising oil prices and price increases of
other raw materials. Increases in administered
prices contributed as well. Inflation is expected to
slow to 2.7% in 2012. This figure is higher than in
the autumn 2011 forecast due to oil prices
remaining at a high level rather than decreasing
moderately. The postponement of the automatic
indexation of wages will result in a somewhat
lower inflation for services compared to the
autumn forecast. The National Index of Consumer
Prices (NICP), which has a lower weight for oil
products, is expected to fall from 3.4% in 2011 to
2.4% in 2012.
-1.0
-0.5
0.0
0.5
1.0
1.5
2.0
10Q1
10Q3
11Q1
11Q3
12Q1
12Q3
-2
-1
0
1
2
3
4
GDP growth (q-o-q%, lhs)
HICP (quarterly y-o-y%, rhs)
Graph 16.1: Luxembourg - GDP growth and
inflation
forecast
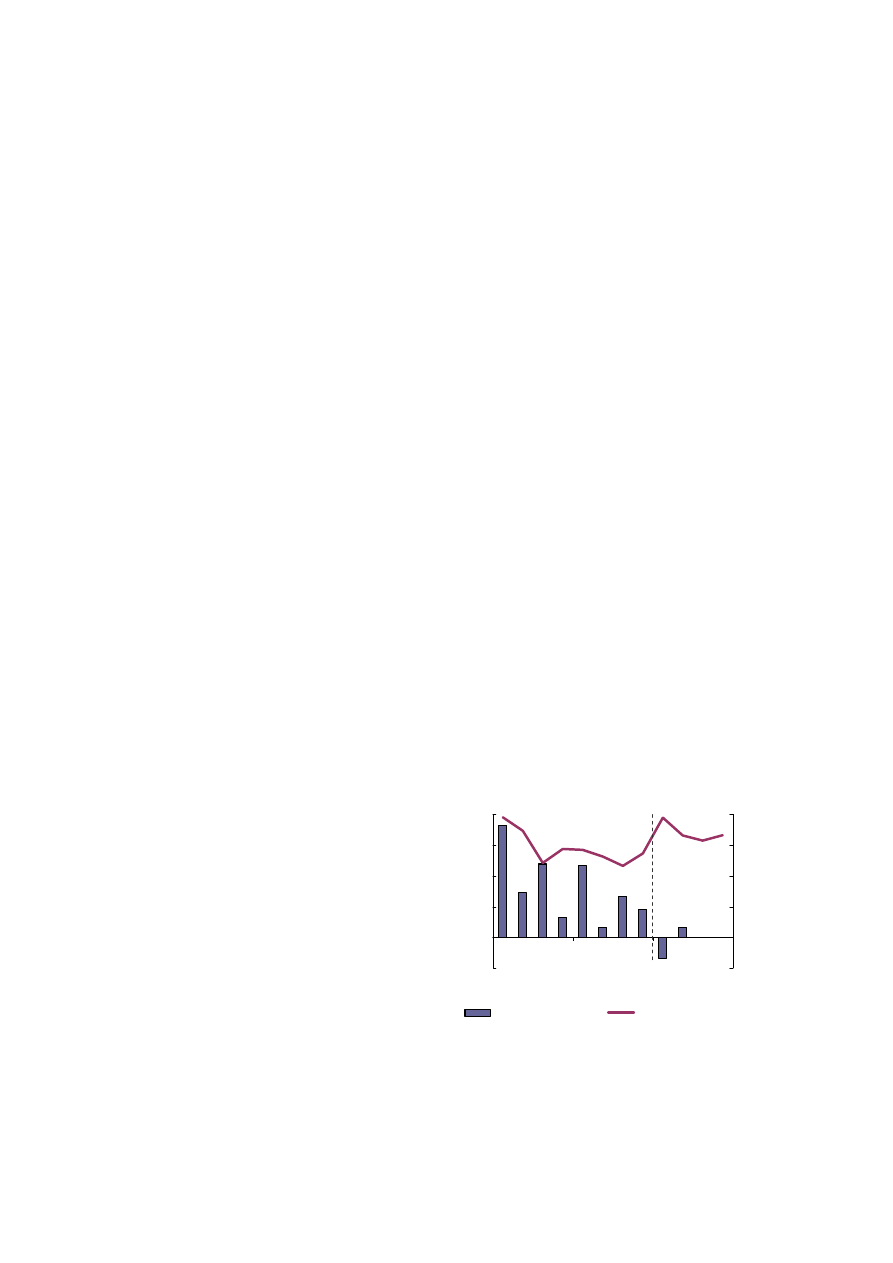
17. HUNGARY
Interim forecast, February 2012
29
Growth in 2011 continued to be driven exclusively
by the external balance, with the export sector
performing well although losing momentum
towards the end of the year against the backdrop of
a weakening external environment. Domestic
demand remained firmly in negative territory,
although the pace of contraction slowed.
Household consumption did not take off in light of
uncertainties, high unemployment and the impact
of the significant exchange rate depreciation
against the Swiss franc on private indebtedness.
The uncertainty of the policy environment, the
weak economic conditions and credit supply
constraints also contributed to the continued
contraction of gross fixed capital formation.
However, the latest available data indicates that the
Hungarian economy proved more resilient in the
second half of 2011 than anticipated at the time of
the autumn forecast. The implications for
economic growth in 2012 are uncertain: the
expansion of agricultural output contributed to
lifting GDP growth in 2011, but as this was against
the background of poor performance in 2010, such
a strong rate of growth is unlikely to be repeated in
2012.
The external environment is worse than that
expected in the autumn forecast, with Hungary's
largest export markets growing at a lower rate.
This has appreciable implications for economic
growth prospects, since Hungary is a very open
economy with exports amounting to 87% of GDP.
The recent bankruptcy of the national airline
carrier, Malév, will also dampen exports of
services and raise imports, although the value the
company added to Hungarian GDP was limited. At
the same time, the Mercedes automobile factory
appears on track to start production in the first half
of 2012, helping Hungary gain market share as
expected in the autumn forecast.
Domestic demand will be affected from the first
quarter by fiscal austerity, which results in part
from the need to correct for the loss of revenues
from the large overall tax cuts, whose impact on
the headline deficit in 2011 was obscured by the
transfer of private pension fund assets to the state
pillar. Employment prospects are also somewhat
more negative than expected in the autumn, with
consequent implications for household
consumption.
On the other hand, on 15 December 2011 the
government and the Banking Association signed
an agreement that improved on the government's
original plan, allowing the early repayment of
foreign-currency denominated mortgages at
discounted rates. This agreement includes four
pillars whose impact is likely to play out over
various channels, including a cash-flow effect for
FX mortgage holders. The overall effect of the
early repayment scheme in combination with the
December agreement is still negative for the
financial sector and thus for credit supply,
although less so than before as the public sector
will now share part of the cost. The wage
compensation schemes that have meanwhile been
specified also imply a smaller-than-expected
burden on enterprises.
Overall, GDP growth is now expected to be near
standstill in 2012, with some improvement after
the first quarter of the year.
The pace of inflation will again rise in 2012 thanks
in large part to increases in indirect taxes
(including VAT, which at 27% is the highest rate
in the EU) and higher-than-assumed oil prices.
Other factors include the reduction in road
maintenance subsidy, which is expected to raise
transport prices due in part to the attendant
increase in road toll fees. The inflation rate is now
projected to average 5.1% in 2012 as a whole.
-0.3
0.0
0.3
0.6
0.9
1.2
10Q1
10Q3
11Q1
11Q3
12Q1
12Q3
-1.5
0.0
1.5
3.0
4.5
6.0
GDP growth (q-o-q%, lhs)
HICP (quarterly y-o-y%, rhs)
Graph 17.1: Hungary - GDP growth and inflation
forecast
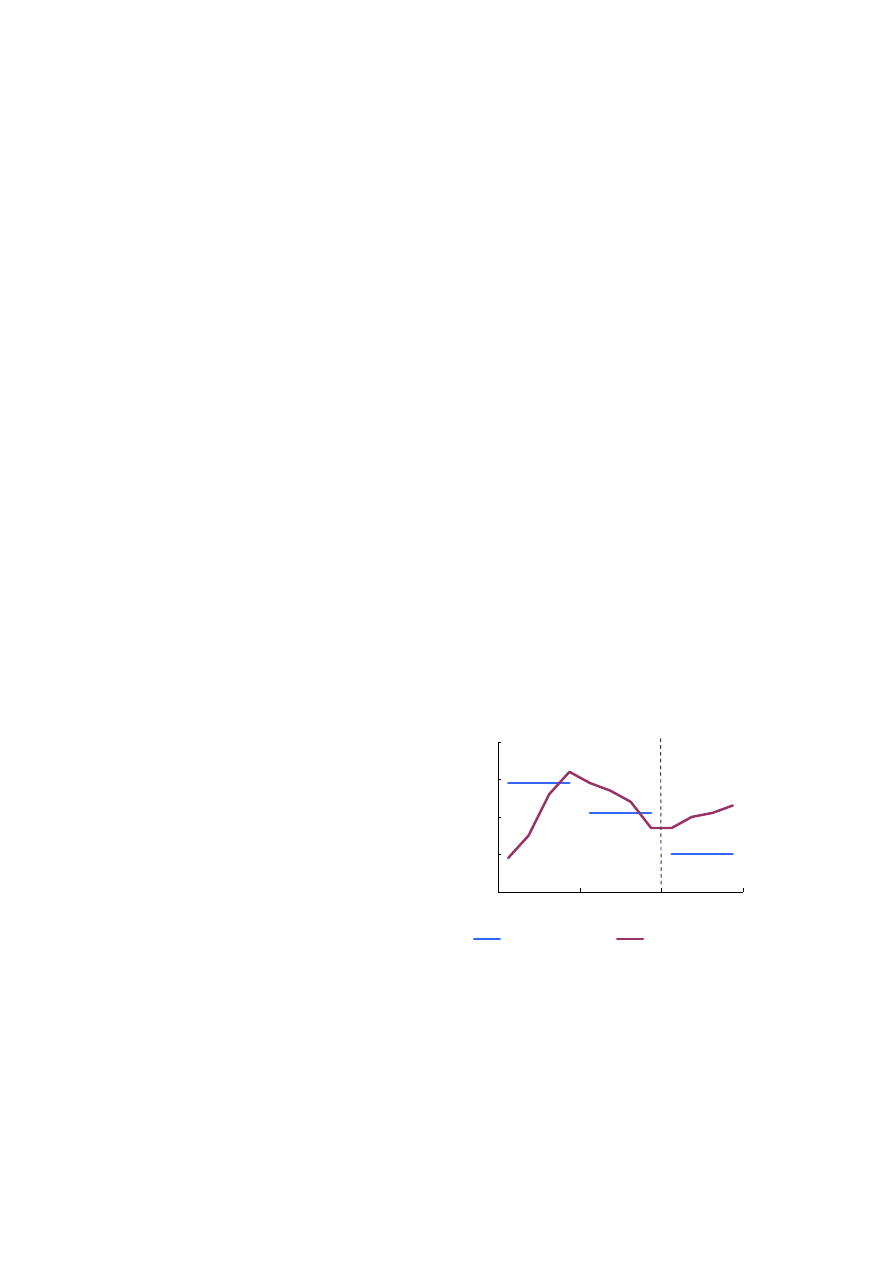
18. MALTA
Interim forecast, February 2012
30
The Maltese economy rebounded relatively
strongly after a mild contraction in real GDP in
2009, and the positive momentum was carried into
2011 as well. Buoyant private consumption,
underpinned by healthy job creation and wage
growth, as well as a strong performance by the
tourist sector, were the main factors behind real
GDP growth in the first half of 2011 and more than
compensated for the relatively surprising weakness
of business investment.
In the second half of 2011, however, the economy
gradually lost steam. Private consumption growth
slowed considerably in the third quarter, while
annual export growth in volume terms turned
negative for the first time since late 2009. The
downward trend is expected to have continued in
the final quarter of 2011, in line with the general
slowdown in the euro area. Real GDP growth for
2011 as a whole is estimated at 2.1%, almost
exclusively driven by net exports; this is
unchanged from the autumn 2011 forecast.
The outlook for 2012 is relatively subdued. The
latest consumer confidence indicators suggest that
private consumption will remain weak.
Households’ disposable income is expected to be
squeezed by a significant deterioration in labour
market conditions after the very strong
employment gains recorded in 2011, while average
wage growth is foreseen to remain below HICP
inflation. Uncertainties about the domestic and
international economic environment, coupled with
cautious lending behaviour by banks, are likely to
continue to dampen business investment, which is
likely to contract for a second consecutive year.
Against this background, domestic demand is
expected to continue to contribute very modestly
towards real GDP growth.
Net exports are again expected to be the main
contributor to growth in 2012, but less
significantly so than in 2011. Malta’s exports, in
particular exports of goods, benefit from a
relatively high share of trade with emerging
markets but are nonetheless affected by the
projected further slowdown of economic activity in
the euro area compared to the autumn forecast,
which would have a negative impact – especially
on tourism exports. Nevertheless, exports are
projected to continue to outpace the expansion of
imports, which are restrained by the weakness of
highly import-intensive domestic demand.
Overall, real GDP growth is forecast to decelerate
to 1.0% in 2012, compared to the 1.3% projected
in the autumn 2011 forecast. The downward
revision primarily reflects the impact of the
projected further slowdown in the euro area.
The forecast is subject to downside risks
emanating from possible negative feedback loops
between the very large banking system and the real
economy in case of a further worsening of the
quality of the credit portfolio, especially in view of
the already elevated share of non-performing loans
and high exposure to the real estate sector. In
addition, the hit through the trade channel could be
larger than anticipated, for instance because of the
heavy reliance of the tourist sector on the euro-area
market.
Annual HICP inflation moderated gradually in the
course of 2011. In 2012, energy inflation is
expected to decelerate significantly given the more
moderate assumed growth in oil prices compared
to 2011, coupled with the government's decision to
keep utility tariffs unchanged for a second
consecutive year. Overall HICP inflation in 2012 is
projected at 2.1%, slightly lower than in 2011 and
in line with the euro area average.
0.0
1.0
2.0
3.0
4.0
10Q1
10Q3
11Q1
11Q3
12Q1
12Q3
GDP growth (y-o-y%)
HICP (quarterly y-o-y%)
Graph 18.1: Malta - GDP growth and inflation
2011
2012
2010
forecast
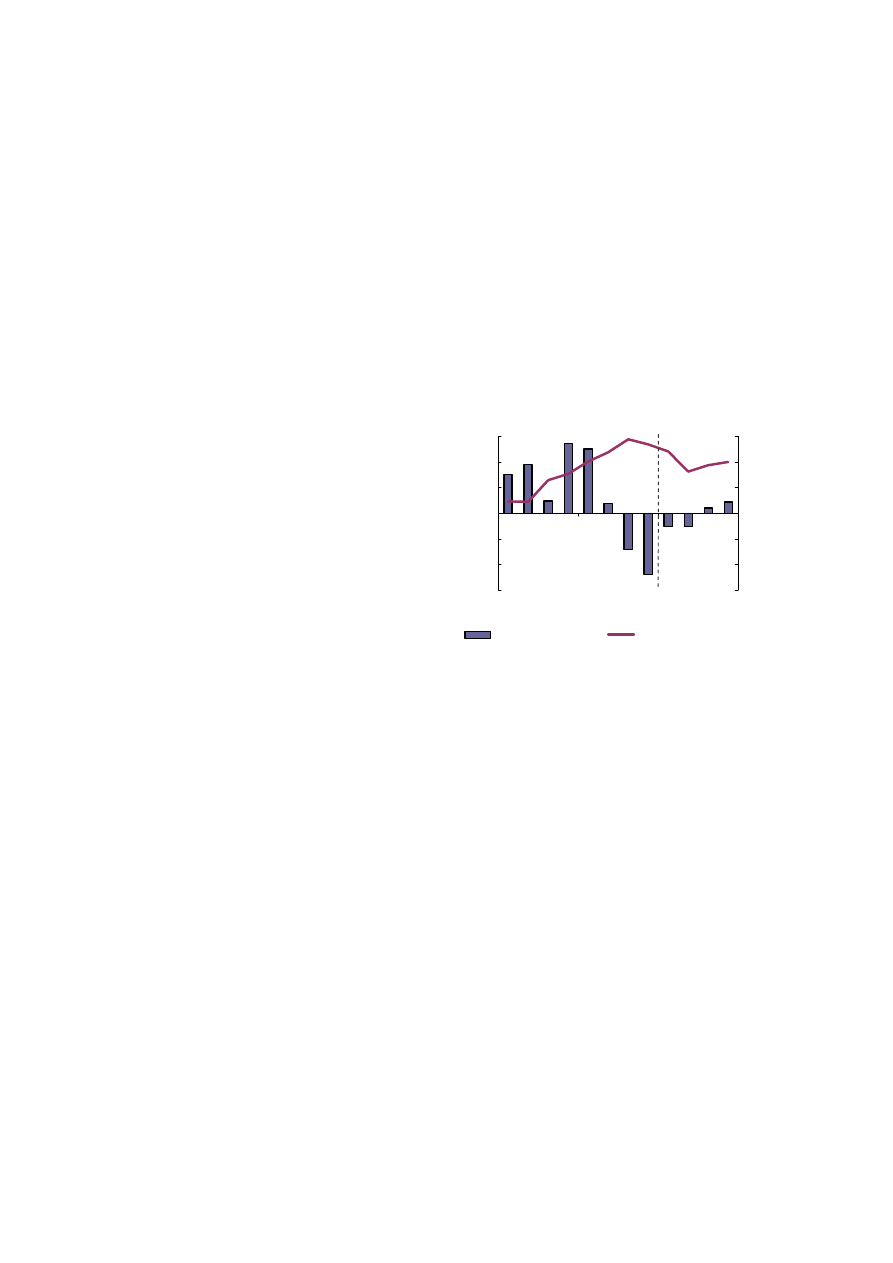
19. THE
NETHERLANDS
Interim forecast, February 2012
31
In the second half of 2011 the Dutch economy
experienced a sharp downturn, recording negative
q-o-q growth of 0.4% in the third quarter and 0.7%
in the fourth quarter, in and implying that the
Netherlands is now in a recession. Both quarterly
growth rates are significantly lower than the
corresponding projections of 0.1% and 0.0% in the
autumn 2011 forecast. This reflects a pronounced
weakening of both internal and external demand.
Consumer confidence, which was already
markedly negative in the summer, deteriorated
further at the end of 2011 and was at its lowest
level since 2003 in January 2012. This was
mirrored by a decrease in consumer spending in
the second half of the year. House prices have
fallen further and the number of transactions,
whilst showing some recovery in December, has
remained low. Producer confidence also stayed
weak. This was reflected in the decrease of 1%
(q-o-q) in industrial production in the
manufacturing sector (excluding energy) in the
fourth quarter of 2011. On the external side, Dutch
exports have been adversely affected by the
slowdown in global trade. Over 2011 as a whole
2011, GDP grew by at 1.2%, compared to an
estimate of 1.8% in the autumn 2011 forecast.
For 2012, the outlook for growth remains subdued.
Real GDP is projected to decrease by 0.9%, a
marked deterioration compared to the autumn 2011
forecast, which projected modest positive growth
of 0.5%. This is predominantly the result of a
considerable negative carry-over, but also due to a
slight downward revision of the quarterly growth
profile projected for 2012. The Dutch economy is
expected to record modest negative growth of
0.2% in both the first and second quarters. For the
remainder of the year, a fragile and subdued
recovery is envisaged, with quarter-on-quarter
growth of 0.1% in the third and fourth quarter.
The growth rate of private consumption – already
negative for four consecutive quarters in 2011 – is
expected to remain negative in 2012, as a result of
government consolidation measures, mainly
affecting households, and negative wealth effects.
The latter mainly emanate from falling prices in
the housing market. On top of this, announced
pension cuts as of 2013, along with the expectation
of additional consolidation measures, may give
rise to anticipatory behaviour by households in the
form of precautionary savings. Investment is likely
to remain weak, on the back of the weak growth
outlook. While net exports are expected to remain
the only component yielding a positive
contribution to growth, they are likely to suffer
from weakening external demand, mainly from the
rest of the euro area. HICP inflation is expected to
decline from 2.5% in 2011 to 2.0% on average in
2012, mainly as a result of subdued domestic
demand.
-0.9
-0.6
-0.3
0.0
0.3
0.6
0.9
10Q1
10Q3
11Q1
11Q3
12Q1
12Q3
-3
-2
-1
0
1
2
3
GDP growth (q-o-q%, lhs)
HICP (quarterly y-o-y%, rhs)
Graph 19.1: The Netherlands - GDP growth and
inflation
forecast
The risks associated with the baseline scenario are
predominantly on the downside. These relate
mainly to the global outlook, while domestic risks
chiefly relate to a sustained and more severe fall in
house prices and a worse-than-expected evolution
of household disposable income.
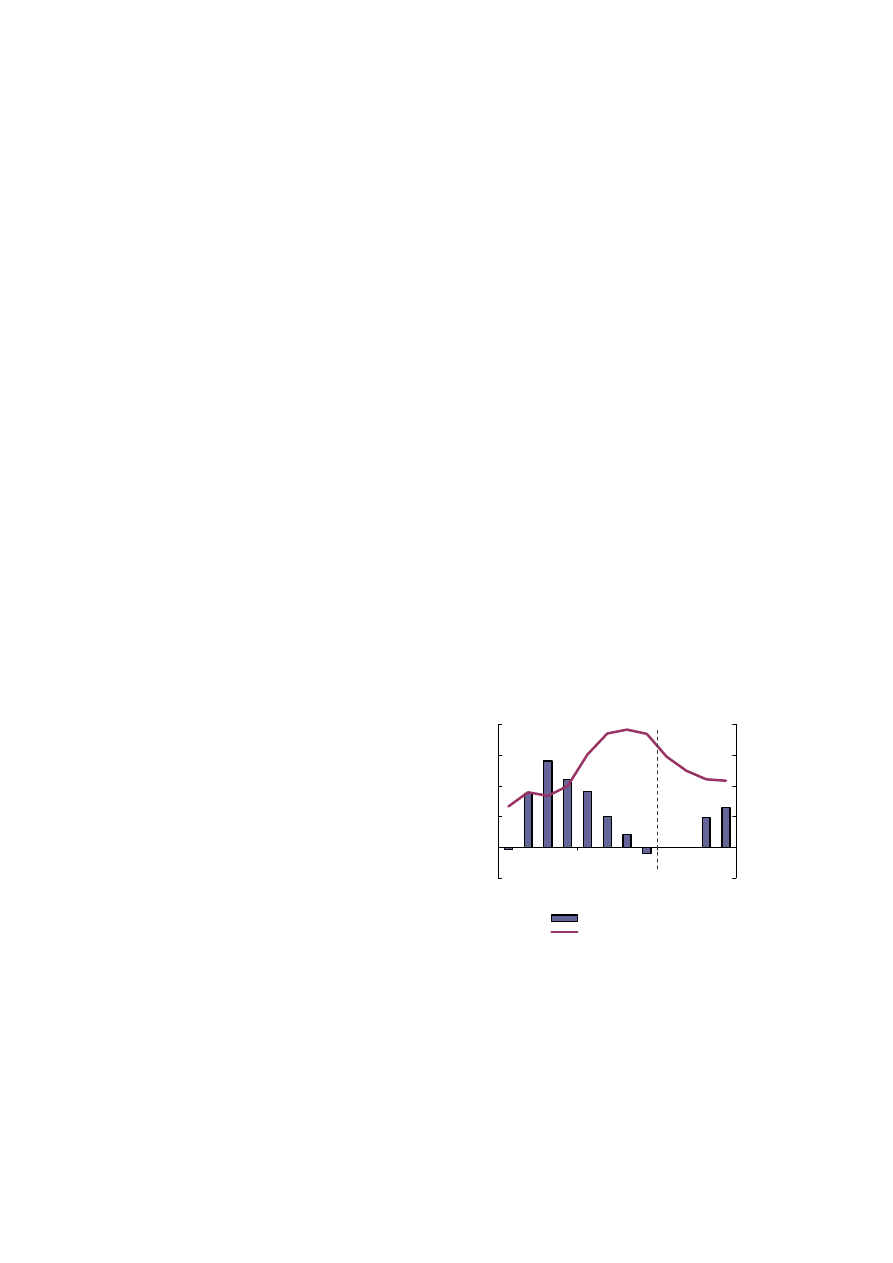
20. AUSTRIA
Interim forecast, February 2012
32
The pace of the economic recovery held up
remarkably well in 2011, with GDP expanding by
3.1% according to the Flash estimate. Quarter-on-
quarter growth remained robust in the first half of
the year, on the back of strong exports, investment
and, not least, public consumption. However, the
carry-over from 2010 accounted for more than half
of the growth for 2011.
Economic activity is set to remain weak in the
coming quarters. Corporations and households
seem to be adopting an attitude of retrenchment
with regard to consumption and investment
outlays, setting the stage for only marginal growth
throughout most of 2012.
Private consumption is likely to stay sluggish amid
collapsing household confidence and stalling
employment growth. The decline in unemployment
came to a halt in the latter months of 2011 when
the rate levelled off at around 4%. The recent wage
negotiations have raised negotiated wages by 2.4%
year on year on average as of January 2012. This
limits the scope for sustaining the pace of
employment gains during 2012. The overall impact
of these counteracting trends on households' real
disposable income is rather uncertain.
Manufacturers' order inflows and backlogs
weakened throughout 2011 as did their
expectations for exports. Indeed, firms have
boosted their competitiveness by a renewal of
capacity and by withholding productivity gains in
the course of 2010 and early 2011. Their capacity
to accommodate demands for wage increases has
strengthened. However the outcomes of recent
wage negotiations may put upward pressure on
unit labour costs as the growth of output and
productivity subside.
Financing conditions may tighten as banks focus
on raising capital buffers and a further clean-up of
balance sheets. Credit expansion, which had
regained momentum since 2010 on the back of the
economic recovery, is likely to tail off in the
course of 2012. Credit demand from both
companies and households has been shrinking of
late, due to the uncertainties related to the
economic outlook in Europe, while the renewed
tightening of credit standards is expected to weigh
additionally on credit activity in the coming
months.
On the whole, the risk balance seems tilted on the
downside. Upside risks are not as pronounced. On
the external side, they stem from upbeat domestic
demand in neighbouring Germany and possible
direct or indirect benefits from still advancing
import demand in emerging markets.
Domestically, solid sentiment in the construction
sector, together with sound corporate and
household balance sheets, bode well for
investment activity.
Driven by higher motor and heating fuel prices, as
well as rising food prices, inflation averaged 3.8%
in April-November 2011, but fell to 3.4% in
December. Core inflation (HICP excluding energy
and unprocessed food) has been affected by
spillovers into prices in services, where the annual
rate of change accelerated to a peak of 3.9% in
August 2011. These effects are projected to
disappear gradually, leading to a moderation of
inflation in 2012. Wage growth is likely to remain
contained, as the pace of economic expansion
decelerates, although the translation of wage
increases negotiated in various sectors into the
effective wage level may well exert upward
pressure on producer and consumer prices.
-0.5
0.0
0.5
1.0
1.5
2.0
10Q1
10Q3
11Q1
11Q3
12Q1
12Q3
-1
0
1
2
3
4
GDP growth (q-o-q%, lhs)
HICP (quarterly y-o-y%, rhs)
Graph 20.1: Austria - GDP growth and inflation
forecast
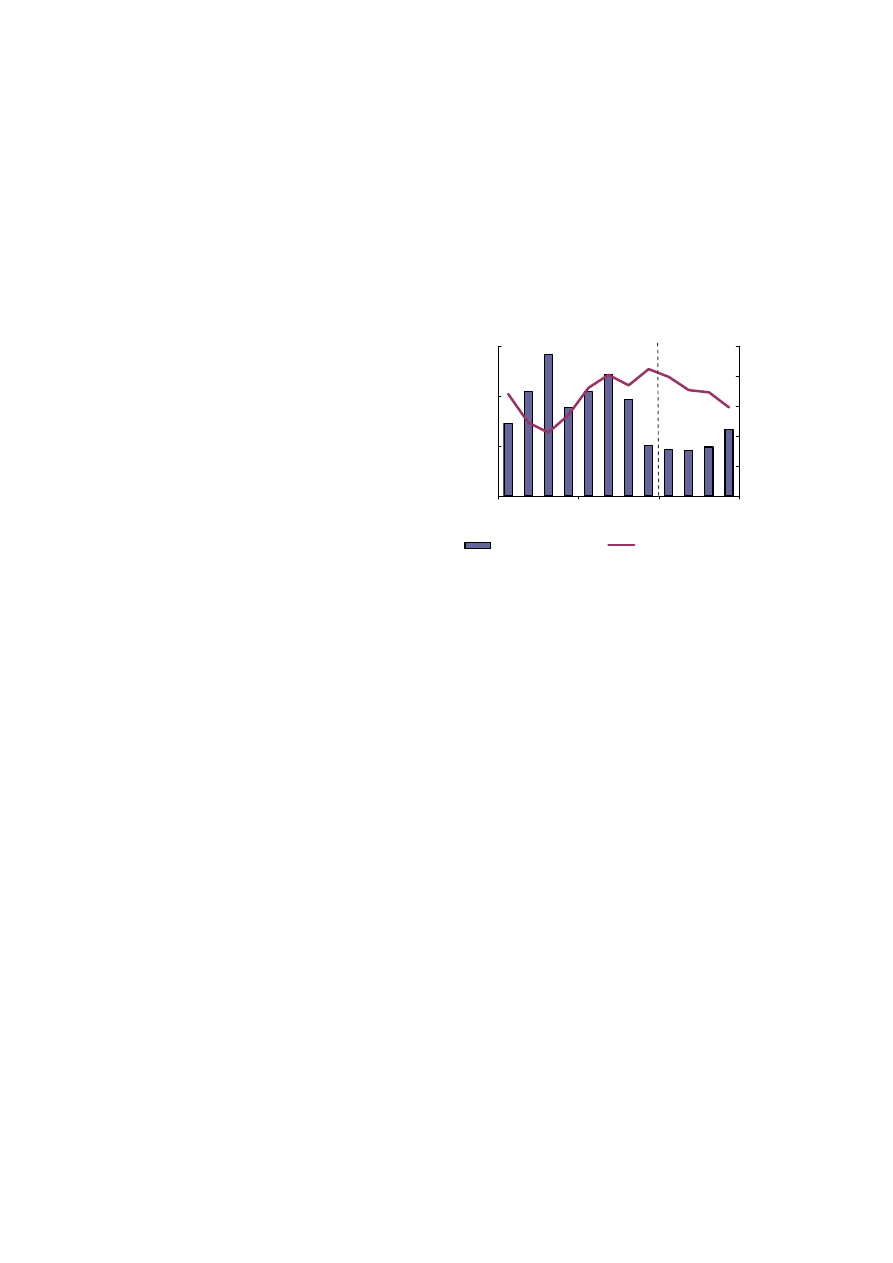
21. POLAND
Interim forecast, February 2012
33
Economic activity decelerated in the last quarter of
2011, with real GDP growth expected at 0.5%
q-o-q, down from 1% q-o-q in the previous
quarter. The slowdown is attributed to lower
private spending as consumer confidence
deteriorated and the labour market worsened amid
the gloomy external outlook.
For 2011 as a whole, real GDP is estimated by the
national authorities to have grown by a healthy
4.3%. Growth was broad-based. Resilient
consumer spending in the first half of the year
benefited from supportive labour market
developments and relatively upbeat consumer
confidence. Public spending, as estimated by
national authorities, shrank, reflecting the
necessary consolidation effort. Better access to
credit and increased profitability in the corporate
sector, amid growing capacity utilisation levels,
resulted in a strong rebound in private investment.
Investment growth was further boosted by
accelerated EU co-financed infrastructure
spending. Moreover, the external trade balance
turned positive fuelled by substantial currency
depreciation in the second half of the year.
Real GDP is projected to increase by 2.5% in
2012, with quarterly real GDP growth stabilising at
around 0.5% q-o-q over the year. Private
consumption growth is likely to be muted, as
consumer confidence and the labour market
situation are set to deteriorate. Moreover, recent
changes in non-tax labour costs and frozen
nominal wages in public administration are likely
to dampen wage growth, with inflation eroding
purchasing power. Public spending is set to grow
only marginally, on the back of stringent
expenditure control.
Investment spending growth is expected to remain
robust, supported by accelerating private
investment. The corporate sector is likely to
continue to increase capacity, financed by
intensifying inflows of foreign capital, retained
earnings and growing corporate credit. Robust
public spending in infrastructure, driven by the
completion of major motorway interconnections
ahead of the Euro 2012 football championship, is
set to support overall growth in gross fixed capital
formation. However, inventory build-up is likely to
become less supportive after a positive
contribution to growth in 2011. The external trade
balance is likely to be a major growth driver, as
Polish enterprises are set to continue to benefit
from a depreciated currency and the favourable
sectoral structure of exports, whereas slowing
domestic demand is expected to dampen imports
growth.
0.0
0.5
1.0
1.5
10Q1
10Q3
11Q1
11Q3
12Q1
12Q3
0
1
2
3
4
5
GDP growth (q-o-q%, lhs)
HICP (quarterly y-o-y%, rhs)
Graph 21.1: Poland - GDP growth and inflation
forecast
Average HICP inflation reached 3.9% y-o-y in
2011, on the back of a VAT rate hike, rising
commodity prices and a depreciating currency.
After a temporary slowdown in the third quarter of
2011 inflation accelerated due to commodity price
developments and reached 4.5% in December
2011. It is expected to steadily fall to around 3% at
the end of 2012, on the back of stabilising fuel and
food prices, inflation-decreasing base effects and
weakening domestic demand. Taking into account
the higher level at the start of the year, average
inflation is, however, projected to reach 3.5% in
2012.
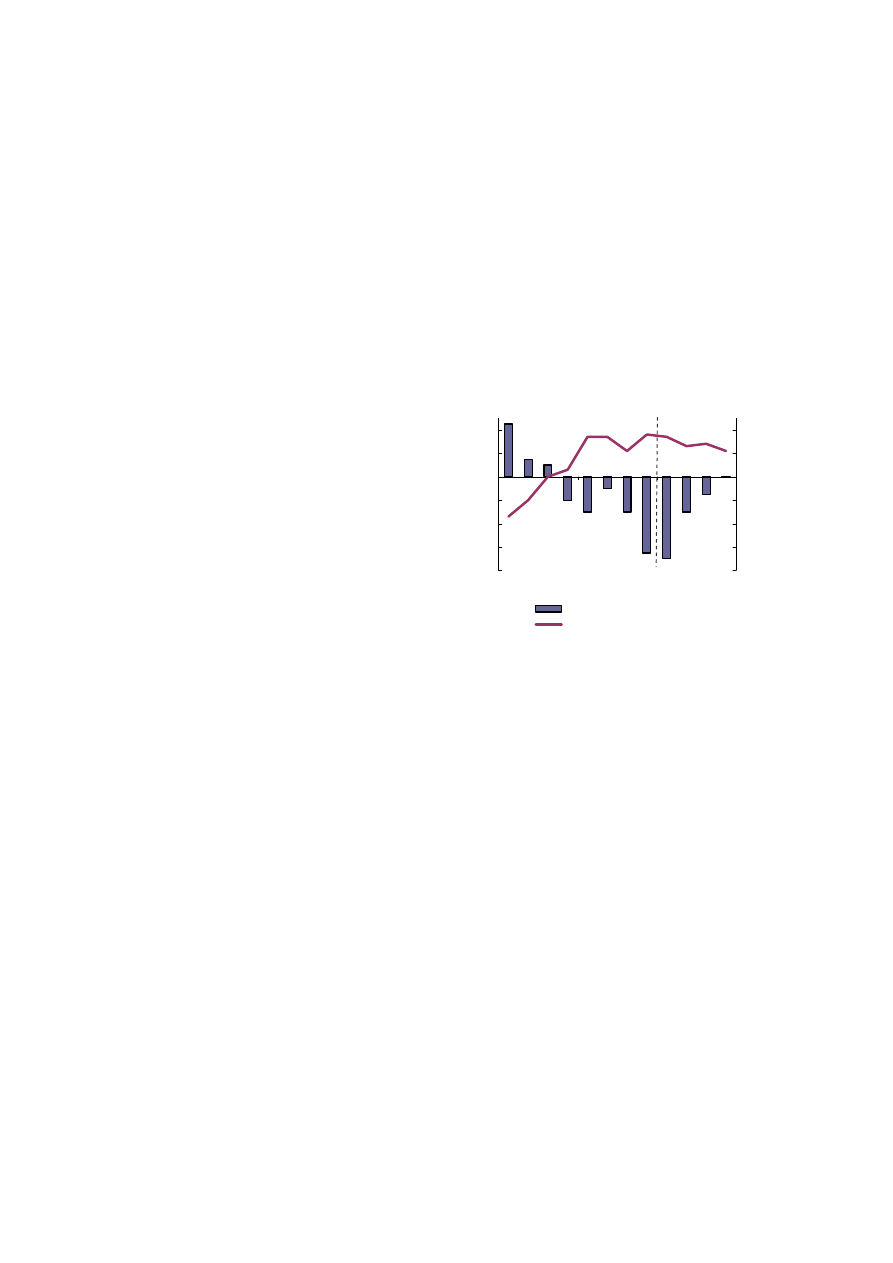
22. PORTUGAL
Interim forecast, February 2012
34
Real GDP contracted by 1.5% in 2011, which is
0.4 pp. less than anticipated in the autumn 2011
forecast. Preliminary data released by the national
statistics institute suggest that the main reasons for
this better-than-expected performance were a
smaller fall in private consumption due to some
consumption smoothing, as households reduced
their savings to compensate for the strong fall in
real disposable income, and more dynamic export
growth. However, the decline in economic activity
accelerated in the final quarter of 2011, with an
estimated fall in real GDP of 1.3% q-o-q,
following a contraction of 0.6% in the third quarter
of 2011. Employment recorded a very strong
decrease in the final quarter of last year, pushing
the unemployment rate up to almost 14%,
markedly higher than in the previous quarter. This
is expected to have taken its toll on private
consumption. Furthermore, trade statistics suggest
that external trade recorded a strong growth
contribution in the final quarter of 2011 due to a
slump in import demand and relatively strong
exports. However, exports decelerated markedly in
December, in line with the deteriorating economic
environment in Europe.
Developments in 2012 will be marked by
additional fiscal consolidation efforts and
accelerated deleveraging in the household and
corporate sectors. Exports are predicted to suffer
from a further deceleration in external demand for
Portuguese products in the first semester.
Moreover, credit and financial market conditions
are projected to remain tight. Meanwhile,
confidence indicators have reached lows across the
board, although consumer and service sector
confidence have recently stabilised somewhat.
Private investment, especially in the construction
sector, is expected to continue its decade-long
decline, due in part to an expected further
tightening of credit supply by banks. Furthermore,
the deterioration of the economic environment in
the euro area should impact on the outlook for
Portuguese exports. While external trade is still
expected to make a significant contribution to
economic growth this year, it is not expected to
offset the negative growth contribution of domestic
demand. As a consequence, real GDP is now
forecast to decline by 3.3% in this year, ¼ pp.
lower than assumed in the autumn 2011 forecast.
HICP inflation was 3.6% in 2011, mainly due to a
series of increases in indirect taxes and
administered prices as well as higher oil prices.
Price developments are also expected to be marked
by fiscal measures in 2012, while wage restraint in
a weak labour market environment should ease
inflationary pressure. In 2012, HICP inflation is
forecast to reach 3.3%. Employment is expected to
shrink further, in line with the ongoing decline in
economic activity, with a concomitant rise in
unemployment.
-1.6
-1.2
-0.8
-0.4
0.0
0.4
0.8
10Q1
10Q3
11Q1
11Q3
12Q1
12Q3
-2
-1
0
1
2
3
4
GDP growth (q-o-q%, lhs)
HICP (quarterly y-o-y%, rhs)
Graph 22.1: Portugal - GDP growth and inflation
forecast
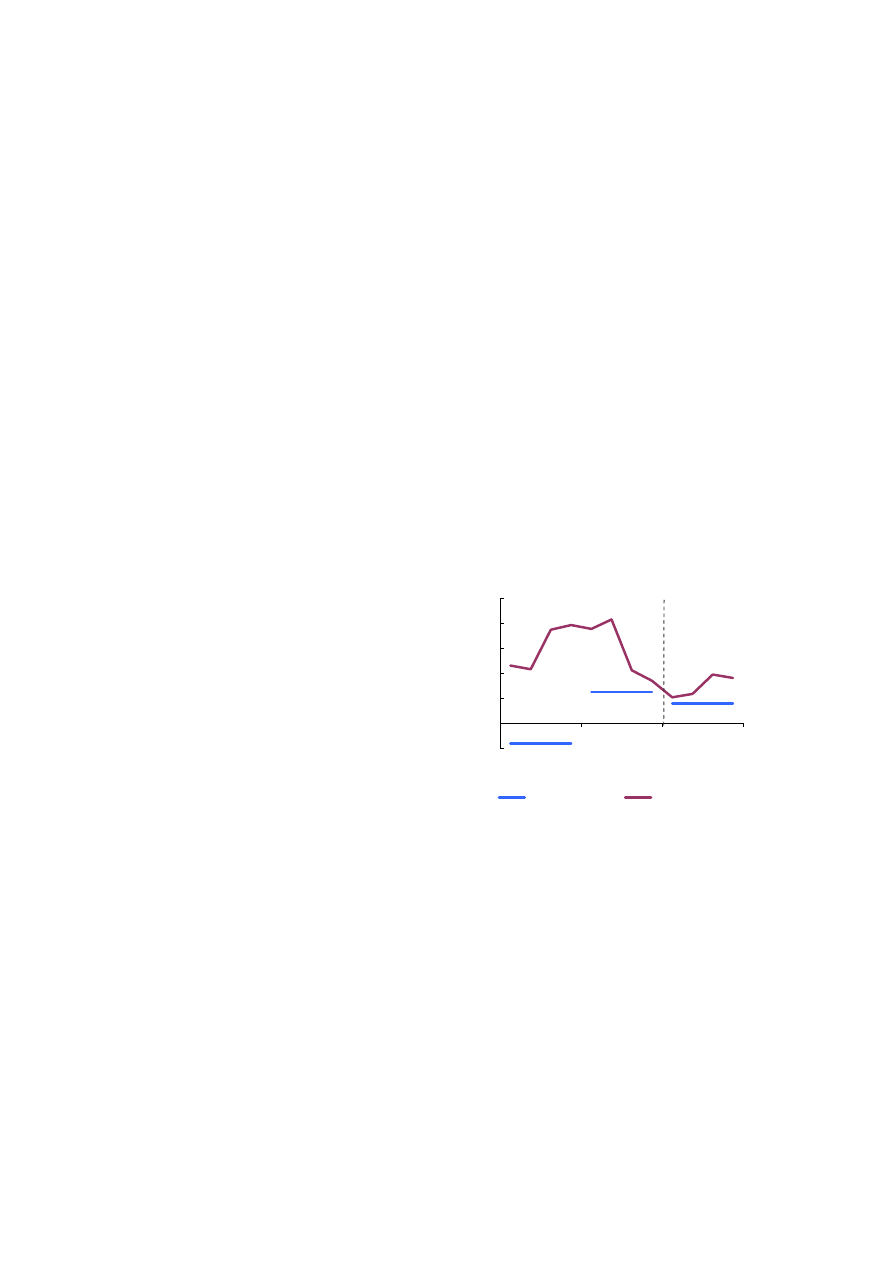
23. ROMANIA
Interim forecast, February 2012
35
After two years of negative readings, growth
resumed in 2011, when real GDP is estimated to
have grown by 2.5%. Growth was mainly driven
by external demand in the first half of 2011 and an
exceptional agricultural harvest in the second half.
The latter is also expected to have positively
affected exports in the third and fourth quarter of
2011. Industrial production growth was strong in
the first half of 2011, responding to external
demand, but has recently weakened on account of
the slowdown in export markets. Construction
output continued to increase in the last quarter of
2011, following from a rebound in the previous
quarter. On the demand side, net exports were the
key driver for growth in the first half of 2011, but
their contribution to growth faded in the second
half of the year. In 2011, private consumption did
not pick up as strongly as initially projected, being
held back by weak household balance sheets.
Following a comprehensive Labour Code reform
implemented in May 2011, the Romanian labour
market improved last year; registered
unemployment is around 5% and the labour force
survey figures stabilised at an unemployment rate
of around 7%. For the first time since the
recession started, in the third quarter of 2011
investments increased by 15.3% (y-o-y) with
increases in all its components.
For 2012, GDP growth has been revised
downwards to 1.6% from 2.1% in the last autumn's
forecast. This revision is mainly due to the
negative effect on growth stemming from
continuing uncertainties in the financial markets
and the euro-area sovereign-debt developments.
Romania's exports to the rest of the EU (70% of
the country's exports) will be less dynamic and
should provide less support to growth. Domestic
demand is projected to be the main driver of
growth in 2012. Although consumers are expected
to continue their balance-sheets adjustment in the
first half of 2012, the forecast improvement in
employment and lower inflation should support
income and thus contribute to a revival of private
consumption in the second half of 2012.
Government consumption is not expected to
contribute much to growth in 2012, as it is
constrained by the continued fiscal consolidation.
However, public investment, supported by an
anticipated improvement in the absorption of EU
funds, is expected to play a key role in 2012.
Private investment is likely to be weaker than
anticipated on account of increased domestic and
global uncertainty and therefore some investments
planned for early 2012 are likely to be delayed to
the second half of 2012 or 2013.
Risks to the 2012 growth forecast are tilted to the
downside. Downside risks include: (i) possible
continuing uncertainties in financial markets and
sovereign-debt developments in the euro-area
periphery that would weigh on Romania's growth;
(ii) possible additional needs for repairing
household balance sheets, coupled with tighter
credit standards for lending, which may result in
lower-than-expected private consumption. Upside
risks include: (i) a potentially stronger contribution
of investment than foreseen in the baseline in case
of a significant improvement in the absorption of
EU funds in 2012; and (ii) a potentially stronger
contribution of domestic demand linked to possible
pre-electoral fiscal slippages.
-2.0
0.0
2.0
4.0
6.0
8.0
10.0
10Q1
10Q3
11Q1
11Q3
12Q1
12Q3
GDP growth (y-o-y%)
HICP (quarterly y-o-y%)
Graph 23.1: Romania - GDP growth and inflation
2011
2012
2010
forecast
Inflation, which has been running high for a
prolonged period (and was still above 8% in the
second quarter of 2011), came down sharply in
summer 2011 because of easing food prices and
base effects linked to the VAT hike in 2010. End-
year inflation was very close to the NBR's target
range of 3.0% ±1 pp. Inflation is expected to
further decline in the first half of 2012, before
increasing again in the second half, but still staying
within the NBR's target range. Over the medium
term, risks to the inflation outlook appear skewed
to the upside due to the need to deregulate energy
markets and further hikes in other administered
prices.

24. SLOVENIA
Interim forecast, February 2012
36
The international slowdown is hitting Slovenia
through the trade channel – as it did in 2009 – but
this time against a backdrop of already depressed
domestic demand. A prolonged, shallow recession
is in fact probably already in progress. The real
GDP growth outturn in the third quarter of 2011
was slightly negative and a steeper decline is
expected in the fourth quarter. Positive, but still
subdued, growth is forecast to return only from the
second quarter of 2012 onwards.
Real GDP growth for 2011 and 2012 as a whole
has been revised downwards compared to the
autumn 2011 forecast due to four factors: i) the
unexpected negative outturn for real GDP growth
in the third quarter of 2011; ii) substantial
downward revisions to the outturns of previous
quarters; iii) the worsened external environment;
and finally iv) a flatter profile of construction
investment.
Domestic demand was very weak in 2011, as
squeezed household incomes and precautionary
savings kept real consumption flat while the
continued correction in construction caused gross
fixed capital formation to fall precipitously.
Against this backdrop, many domestically-oriented
companies struggled to service debts and there
were notable corporate bankruptcies, particularly
in the construction sector. As a result, banks were
hit by substantial further losses on their loan
portfolios and credit growth remained negative. As
in 2010, however, the drag on economic activity
from domestic demand was more than offset by net
exports and inventory accumulation; as a result,
real GDP is estimated to have expanded by 0.3%.
A weak labour market is expected for 2012,
resulting in shrinking real private consumption, but
the overall drag from domestic demand is likely to
lessen as conditions in the construction sector are
expected to gradually stabilise. However,
Slovenia's trade linkages leave it exposed to the
worsening external environment, particularly as
regards the sharp slowdown in key euro area
trading partners. Export growth is thus expected to
slow substantially. With lacklustre external
demand compounding the pre-existing weak
domestic demand, firms and banks are expected to
pare back their investment plans. Overall, the lift
from net exports would fail to exceed even the
diminished drag from domestic demand in 2012,
leading to a marginal contraction in real GDP of
0.1%. These trends imply the return of an external
surplus in 2012.
-1.6
-1.2
-0.8
-0.4
0.0
0.4
0.8
1.2
1.6
10Q1
10Q3
11Q1
11Q3
12Q1
12Q3
-8
-4
0
4
8
GDP growth (q-o-q%, lhs)
HICP (quarterly y-o-y%, rhs)
Graph 24.1: Slovenia - GDP growth and inflation
forecast
HICP inflation is forecast to remain below the
euro-area average, reaching 1.6% in 2012. On the
one hand, weak domestic demand is expected to
keep the prices of services in check. On the other
hand, commodity price inflation is expected to
ease. In this regard, Slovenia's excise duty policy
delays and smoothes the inflationary impact of
world oil price movements.
The real GDP growth forecast is subject to several
downside risks. A greater-than-anticipated trade
shock could cancel out the positive contribution to
growth from net exports. An intensification of
negative feedback loops between deleveraging
banks and the credit-constrained real economy
could bring further bankruptcies and a more severe
retrenchment of investment. A sharp fall in house
prices, which cannot be excluded given the
absence of significant adjustment to date, would
have wide-ranging effects that are difficult to
assess ex ante. Finally, gross fixed capital
formation could shrink still further if the correction
in construction investment leads to significant
undershooting.
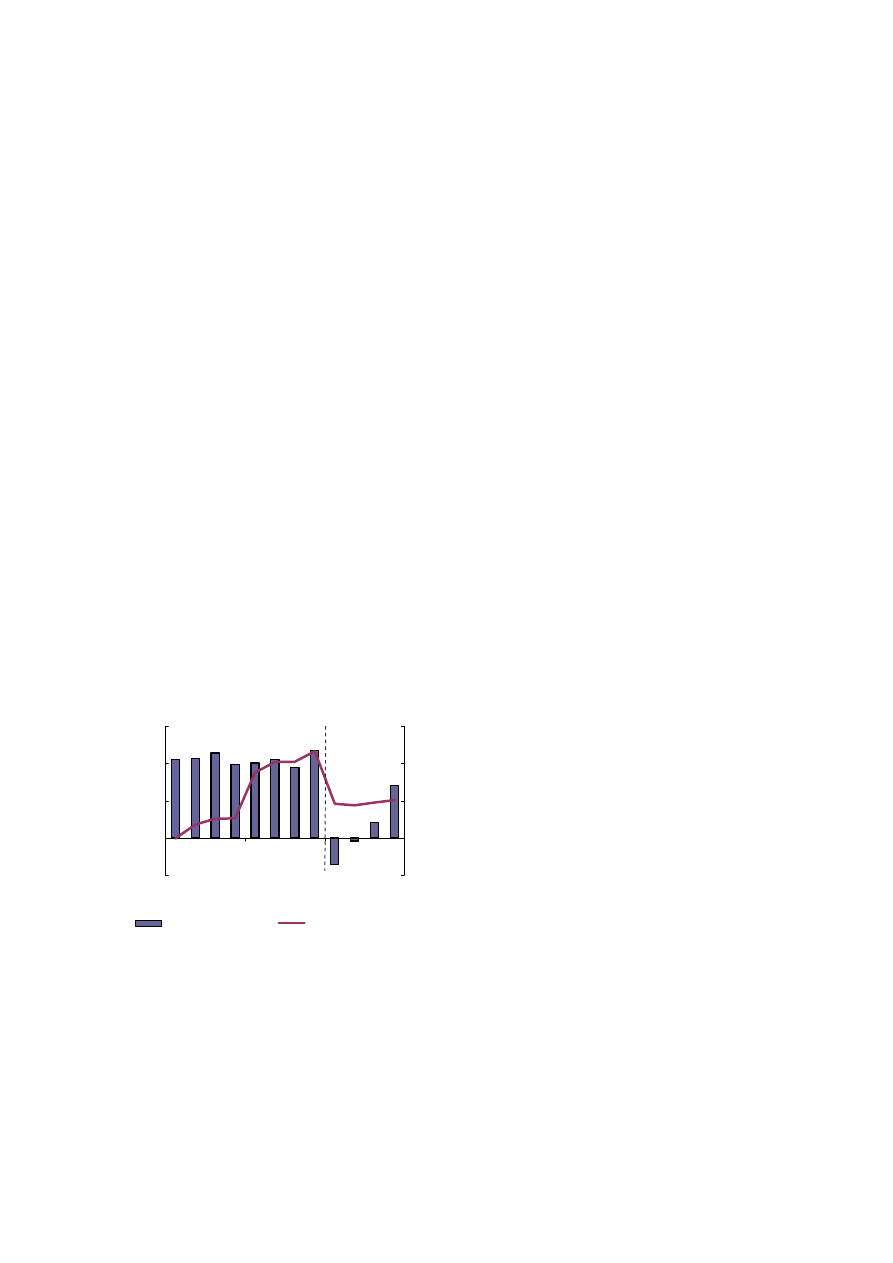
25. SLOVAKIA
Interim forecast, February 2012
37
After rebounding in 2010, the Slovak economy
continued to grow in 2011. The flash estimate for
GDP suggests a strong fourth quarter, with q-o-q
real growth at 0.9%, slightly higher than expected
in the autumn forecast and leading to growth of
about 3.3% y-o-y. Driven by growth in exports in
durable manufacturing goods, economic activity
strengthened throughout the year, despite the clear
signs of distress in global financial markets that
emerged during the summer.
However, recent high-frequency indicators on
industrial production, construction and new orders
point to a slowdown at the turn of the year, mostly
in response to signs of deterioration in the regional
economic outlook. With nearly four-fifths of total
exports directed towards the single European
market and with growth largely dependent on
external demand, the outlook for 2012 largely
reflects the economic prospects of Slovakia's main
trading partners. Given the weaker outlook for the
euro area, real GDP growth is expected to slow to
1.2% in 2012. This takes into account a sizeable
carry-over effect from the previous year and a
gradual pick-up in economic activity towards the
end of 2012.
-0.4
0.0
0.4
0.8
1.2
10Q1
10Q3
11Q1
11Q3
12Q1
12Q3
-2
0
2
4
6
GDP growth (q-o-q%, lhs)
HICP (quarterly y-o-y%, rhs)
Graph 25.1: Slovakia - GDP growth and inflation
forecast
Despite positive employment data, especially in
the earlier part of the year, real disposable income
of households failed to pick-up in 2011 due to
moderate nominal wage growth, a strong rebound
in consumer prices and the effects of a significant
consolidation effort largely based on a sizeable
reduction in the public sector wage bill, on
broadening of the base for the personal income tax
and social contributions and a 1 pp. increase in the
VAT standard rate. Accordingly, private
consumption stagnated in 2011 for a third
consecutive year and is expected to remain weak in
2012, given low and still deteriorating consumer
confidence. Reflecting uncertainty concerning the
economic environment, business confidence
indicators point to cautious decisions on private
investment projects, many of which are expected
to be put on hold in 2012.
After two years of historically low inflation below
1%, HICP inflation spiked at 4.1% in 2011 on the
back of a steep increase in energy and commodity
prices, adjustments in regulated prices and
increases in some excises and indirect taxes,
notably the VAT standard rate. In 2012, overall
HICP inflation is forecast to slow to 1.9% also
reflecting a significant base effect and weak wage
pressures in the context of a sluggish labour
market.
Apart from risks stemming from the external
environment, a sharper-than-expected deterioration
of the labour market during the slowdown
represents a negative risk to the forecast. An
eventual resumption in major investment projects
in transport infrastructure represents a positive
domestic risk.
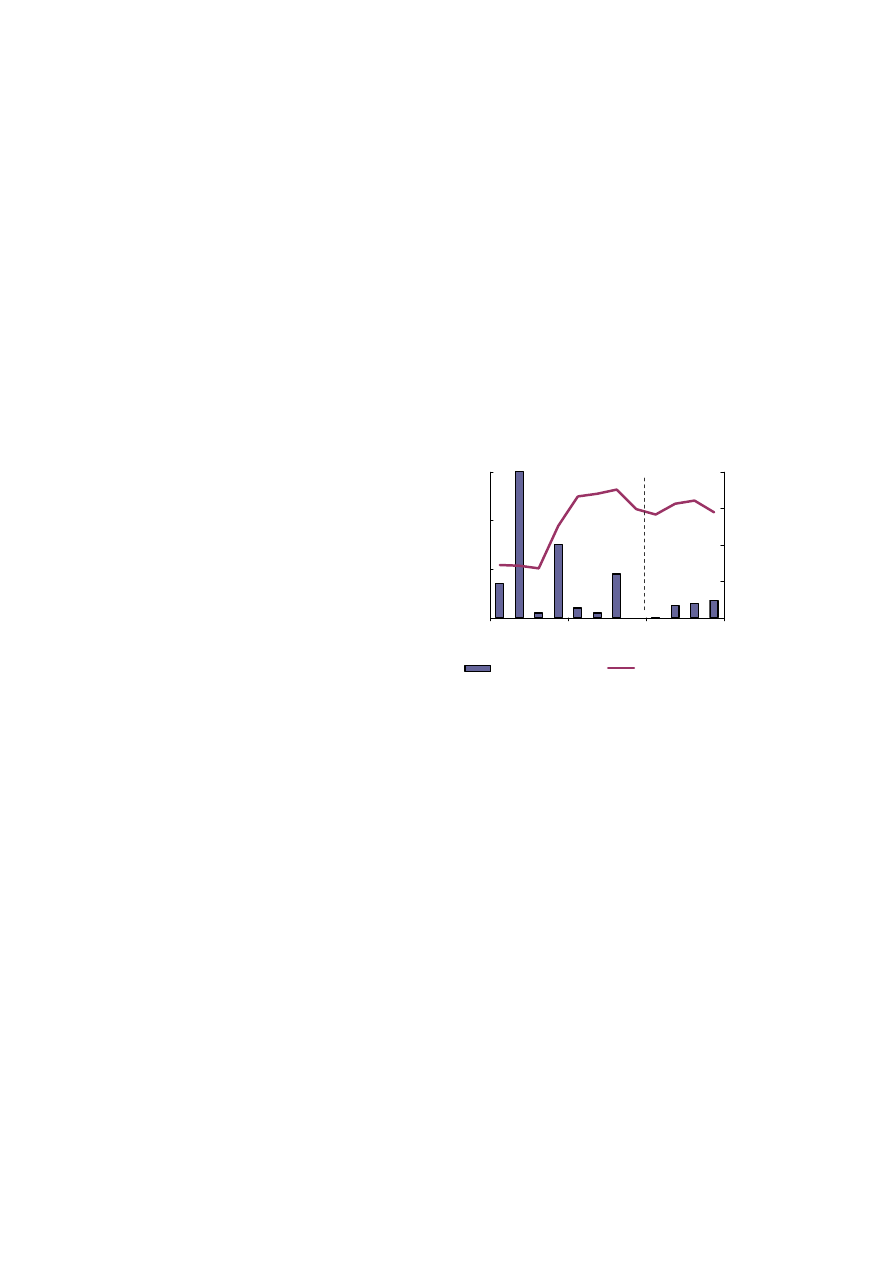
26. FINLAND
Interim forecast, February 2012
38
Following a strong recovery in 2010, with GDP
expanding by 3.7%, the Finnish economy
continued to grow in the first three quarters of
2011. However, according to the latest Statistics
Finland data, economic activity appears to have
slowed down significantly in the in the last quarter
of 2011. Whereas growth was still projected at
3.1% in the autumn 2011 forecast, latest
developments have led to a downward revision to
2.7% for 2011 as a whole. While growth dynamics
for 2012 were already expected to lessen in the
autumn to about 1.4%, the worsening outlook
implies markedly weaker, but still positive, growth
at 0.8%.
The slowdown in growth comes mainly from a
decline in net exports on the back of the global
economic slowdown as well as diminishing export
capacity linked to on-going structural changes
within some of the main Finnish industries. The
observed decrease in exports in 2011 is set to
continue into 2012 due to the expected slowdown
in growth of the main trading partners.
In contrast, domestic demand has held up rather
well in 2011 and is expected to support economic
activity in 2012 also. Private consumption
expenditure was strong in 2011. The volume of
retail trade sales was up 2.3% on the previous year.
Consumption is expected to contribute positively
to growth in 2012 also, as employment remains at
an elevated level and wage growth, which is
settled by multiannual collective agreements, is set
to remain relatively robust.
This is not to say that Finland will also escape the
effects of the downturn in terms of private
consumption. While unemployment continued to
decline in 2011, some worsening has to be
expected in 2012. Also, consumer confidence fell
rapidly over the course of 2011, possibly
indicating lower demand in the future.
While investment is also expected to deteriorate,
on balance, it is likely to retain a positive impact
on growth. It could be upheld by replacement
investment needs after low levels encountered in
2009 and 2010.
Inflation decreased, in line with expectations, in
the fourth quarter of 2011. However, in early 2012
increases in indirect taxes were introduced and
they are set to contribute to somewhat higher
inflation in the beginning of 2012. However, as the
base effects from the commodity price rises in
2011 come into play, HICP inflation is
nevertheless forecast to decline from the peak of
3.3% in 2011 to 2.5% in 2012.
Taking into account the high share of investment
and intermediate goods in Finnish exports, the
economy faces further downside risks if the lack of
confidence in global markets results in a
significant reduction of global investments,
reducing the demand for Finnish exports.
0
1
2
3
10Q1
10Q3
11Q1
11Q3
12Q1
12Q3
0
1
2
3
4
GDP growth (q-o-q%, lhs)
HICP (quarterly y-o-y%, rhs)
Graph 26.1: Finland - GDP growth and inflation
forecast
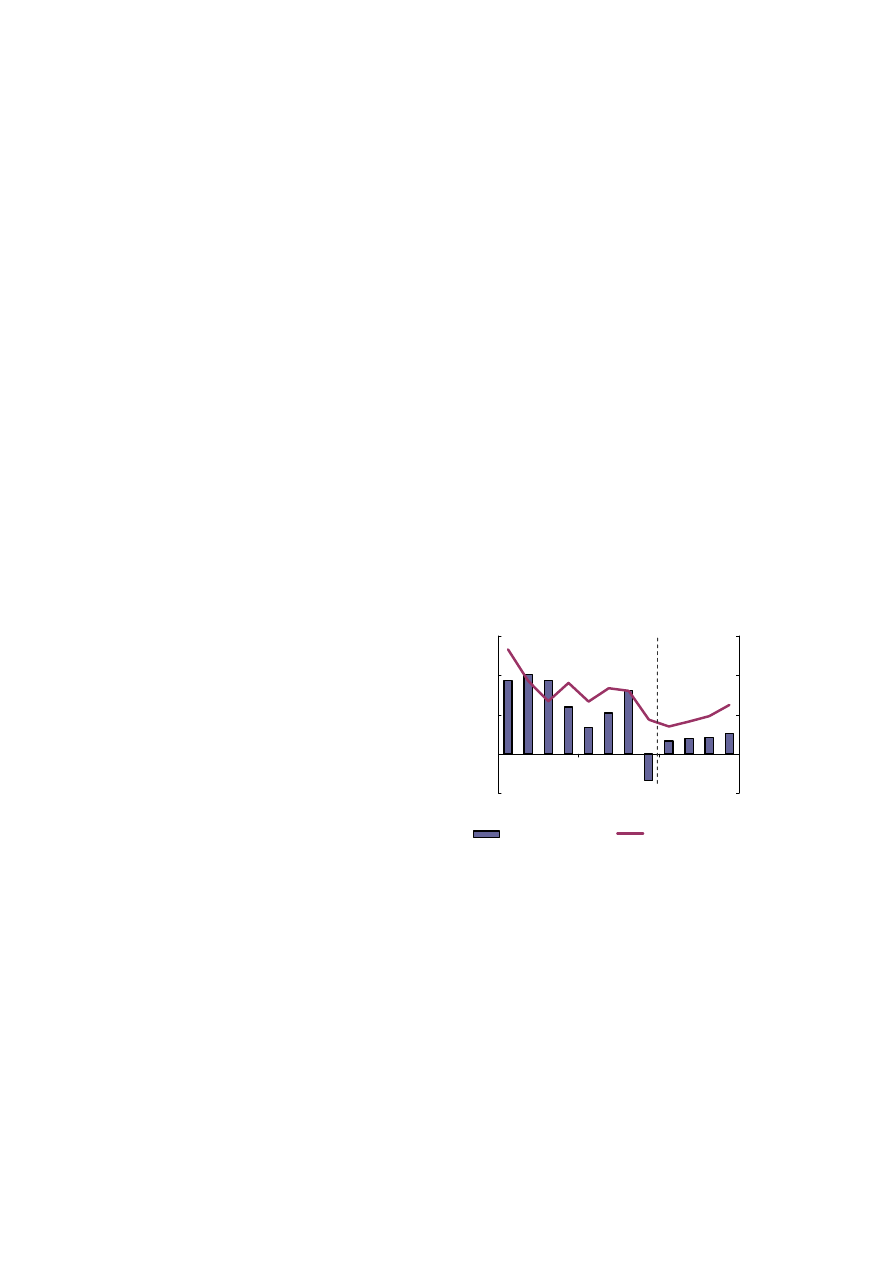
27. SWEDEN
Interim forecast, February 2012
39
The Swedish economy recovered strongly from the
2008/09 recession with annual real GDP growth
reaching 5.6% in 2010 and quarterly rates of 1%
on average in the first three quarters of 2011.
Growth in the third quarter, however, was held up
by a large contribution from net trade, which
weakened significantly in the final months of
2011. Retail sales continued to be very subdued,
making the annual retail growth rate of 0.8% in
2011 the worst since 1996. Industrial production
fell by 1.1% in the fourth quarter and services
production ended the year with stagnation.
Business confidence continued to fall and finished
the year clearly below its long-term average.
Overall, GDP is estimated to have contracted in
the fourth quarter, yielding an estimated annual
growth rate of 4.2% in 2011.
Although some of the negative momentum from
the end of 2011 is expected to spill over into early
2012, a few indicators point to a return to positive
economic growth already in early 2012. Consumer
confidence rebounded noticeably in January as did
the main index on the Stockholm stock exchange.
Business surveys indicate that manufacturing
companies expect new orders to pick up in the first
quarter of 2012. With inflation expected to be low,
the wage agreements signed last autumn should
also provide some real income gains this year.
However, the recovery is expected to be subdued
and relatively fragile. With low capacity
utilization, slow demand growth and a stronger
krona, corporate investment plans have been put
on hold and companies are revising down hiring
plans. This is expected to lead to only very limited
employment growth in 2012. Together with a
weakening housing market and only limited
support from fiscal and monetary policy,
household consumption is expected to remain
sluggish throughout 2012. Overall, GDP growth is
forecast to reach only 0.7% in 2012, with domestic
demand providing a positive GDP growth
contribution and net trade having a neutral impact.
A particular risk relates to household consumption.
On the one hand, should consumer confidence
continue to improve, households could reduce the
currently high household saving rate, which would
boost demand. On the other hand, a softening
housing market and high household indebtedness
could lead households to focus on deleveraging,
with adverse effects on consumption.
HICP inflation is expected to decrease from 1.4%
in 2011 to 0.9% in 2012. This slowdown is mainly
due to a stable commodity prices outlook and
strong carry-over effects from the last quarter of
2011, when actual inflation dropped much more
than expected across most categories of the
consumer basket. Although the ongoing wage
bargaining round has so far resulted in moderate
wage increases (corresponding to 2.4% growth
over a year), the expected productivity dip in 2012
is likely to raise unit labour costs significantly.
Underlying inflation is expected to remain subdued
throughout 2012, however, with low demand and
capacity utilisation restraining the inflationary
impact of higher unit labour costs. In the second
half of the year, as the recovery gains some
traction and employment growth resumes, cost
pressures are expected to re-emerge and inflation
to pick up gradually. The continuation of the krona
appreciation from late 2011 represents a downside
risk to the inflation forecast.
-1
0
1
2
3
10Q1
10Q3
11Q1
11Q3
12Q1
12Q3
-1
0
1
2
3
GDP growth (q-o-q%)
HICP (quarterly y-o-y%)
Graph 27.1: Sweden - GDP growth and inflation
forecast
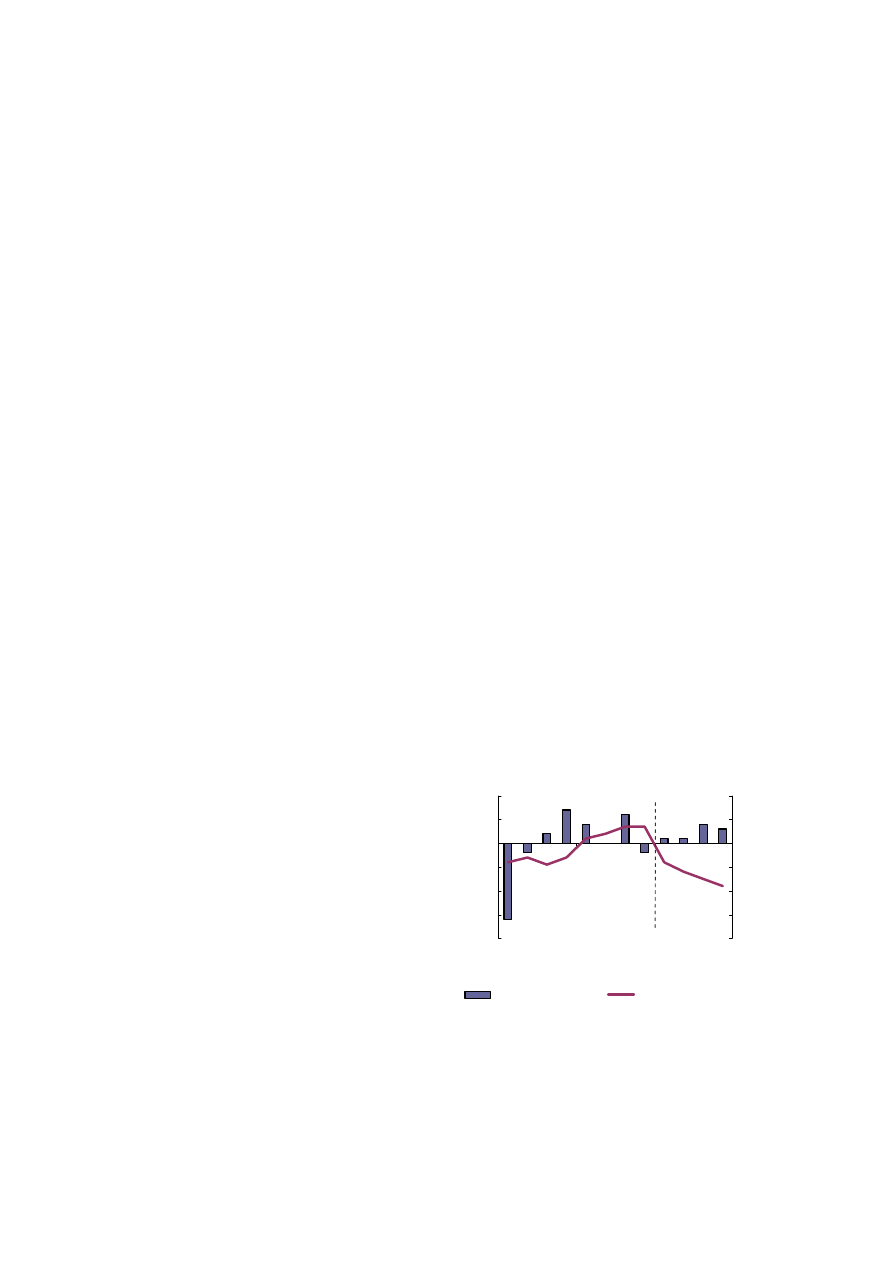
28. THE
UNITED
KINGDOM
Interim forecast, February 2012
40
Annual UK GDP growth for 2011 is estimated to
have been 0.9%, slightly higher than the
Commission's autumn forecast of 0.7%. In 2011,
growth was largely driven by external demand as
domestic disposable income was squeezed by a
combination of high inflation, tax rises and low
nominal wage growth. After remaining relatively
stable through 2010, the unemployment rate rose
throughout 2011, from 7.7% in the first quarter to
8.4% in the fourth quarter – the highest level since
1995.
Following stronger-than-expected growth of 0.6%
in the third quarter, the UK economy contracted by
0.2% in the final quarter of 2011. The contraction
observed in the fourth quarter was driven by the
industrial (-1.2%) and construction (-0.5%)
sectors. The activity level in the services sector
remained unchanged. Economic confidence
indicators also saw a broad-based fall in late 2011,
linked in part to concern about developments in
external markets.
However since the beginning of 2012, UK
coincident and leading indicators have improved
significantly. Rising unemployment will hold back
private consumption growth, especially early in the
year, and nominal wage growth is likely to remain
subdued. A sustained fall in inflation should
however lessen the squeeze on real disposable
incomes and allow private consumption to stabilise
in the second half of the year. Tight credit
conditions are also expected to constrain internal
demand. Nonetheless, investment is expected to
start increasing in the second half of 2012, from a
low base.
Thus, the UK economy may narrowly avoid
recession and quarterly GDP growth is projected at
0.1% in each of the first two quarters of 2012.
Later, a modest pick-up in growth is forecast,
aided by the London Olympics, to give annual
GDP growth of 0.6% in 2012, unchanged from the
Commission's autumn forecast.
External demand is again expected to be the
strongest driver of GDP growth in 2012. The main
downside risk to the forecast is weaker growth in
the UK's main export markets, particularly the
euro area, as well as further negative effects on
confidence from a protraction of the European
sovereign-debt crisis.
Inflation is expected to fall rapidly in 2012 to
2.7%, after having reached a peak of 5.2% y-o-y in
September 2011 – the highest value since the
introduction of the HICP in 1997.
The latest figures show a drop to 3.6% in January
which should continue during the first quarter, as
the January 2011 2.5 pp. VAT rate rise drops out
of the calculations. The pass-through of the VAT
increase was incomplete and gradual last year. As
such, the VAT rise should continue to drop out of
the calculations over the course of the first quarter.
Inflation expectations of both business and
households are significantly lower than in 2011.
The fall in inflation should be sustained throughout
the year due to subdued internal demand and price
stability in energy, oil and other categories. The
large upward pressure that energy prices placed on
inflation in 2011 has now subsided. Electricity and
gas prices are expected to fall in the second half of
2012, with price cuts in the pipeline for most
utility companies. Additionally, the modest
appreciation of sterling in trade-weighted terms
should help contain import prices.
These aspects were already broadly factored into
the autumn forecast; hence the 2012 forecast has
only been revised slightly down by 0.2 pp. to
2.7%.
-2.0
-1.5
-1.0
-0.5
0.0
0.5
1.0
10Q1
10Q3
11Q1
11Q3
12Q1
12Q3
0
1
2
3
4
5
6
GDP growth (q-o-q%, lhs)
HICP (quarterly y-o-y%, rhs)
Graph 28.1: United Kingdom - GDP growth
and inflation
forecast

ANNEX
Interim forecast, February 2012
41
TABLE 1: Gross domestic product, volume (percentage change on preceding year, 1992-2012)
15.02.2012
5-year
February
2012
Autumn 2011
averages
forecast
forecast
1992-96
1997-01
2002-06
2006
2007
2008
2009
2010
2011
2012
2011
2012
Belgium
1.5
2.7
2.0
2.7
2.9
1.0
-2.8
2.3
1.9
-0.1
2.2
0.9
Germany
1.2
2.0
1.0
3.7
3.3
1.1
-5.1
3.7
3.0
0.6
2.9
0.8
Estonia
:
7.6
7.9
10.1
7.5
-3.7
-14.3
2.3
7.5
1.2
8.0
3.2
Ireland
6.5
8.5
5.0
5.3
5.2
-3.0
-7.0
-0.4
0.9
0.5
1.1
1.1
Greece
1.1
3.8
4.3
5.5
3.0
-0.2
-3.2
-3.5
-6.8
-4.4
-5.5
-2.8
Spain
1.5
4.4
3.3
4.1
3.5
0.9
-3.7
-0.1
0.7
-1.0
0.7
0.7
France
1.2
2.9
1.7
2.5
2.3
-0.1
-2.7
1.5
1.7
0.4
1.6
0.6
Italy
1.2
2.1
1.0
2.2
1.7
-1.2
-5.1
1.5
0.2
-1.3
0.5
0.1
Cyprus
5.5
4.2
3.2
4.1
5.1
3.6
-1.9
1.1
0.5
-0.5
0.3
0.0
Luxembourg
2.6
6.3
4.1
5.0
6.6
0.8
-5.3
2.7
1.1
0.7
1.6
1.0
Malta
5.0
3.4
1.8
2.8
4.3
4.3
-2.6
2.9
2.1
1.0
2.1
1.3
Netherlands
2.5
3.7
1.6
3.4
3.9
1.8
-3.5
1.7
1.2
-0.9
1.8
0.5
Austria
1.9
2.8
2.2
3.7
3.7
1.4
-3.8
2.3
3.1
0.7
2.9
0.9
Portugal
2.0
3.9
0.7
1.4
2.4
0.0
-2.9
1.4
-1.5
-3.3
-1.9
-3.0
Slovenia
2.0
4.2
4.2
5.8
6.9
3.6
-8.0
1.4
0.3
-0.1
1.1
1.0
Slovakia
:
2.7
5.9
8.3
10.5
5.9
-4.9
4.2
3.3
1.2
2.9
1.1
Finland
1.3
4.5
3.1
4.4
5.3
0.3
-8.4
3.7
2.7
0.8
3.1
1.4
Euro area
1.5
2.8
1.8
3.3
3.0
0.4
-4.3
1.9
1.4
-0.3
1.5
0.5
Bulgaria
-2.8
2.5
6.0
6.5
6.4
6.2
-5.5
0.2
1.8
1.4
2.2
2.3
Czech Republic
2.4
1.6
4.9
7.0
5.7
3.1
-4.7
2.7
1.7
0.0
1.8
0.7
Denmark
2.6
2.4
1.8
3.4
1.6
-0.8
-5.8
1.3
1.0
1.1
1.2
1.4
Latvia
-8.8
6.0
9.0
11.2
9.6
-3.3
-17.7
-0.3
5.3
2.1
4.5
2.5
Lithuania
-8.3
4.8
8.0
7.8
9.8
2.9
-14.8
1.4
5.8
2.3
6.1
3.4
Hungary
0.4
3.7
4.2
3.9
0.1
0.9
-6.8
1.3
1.7
-0.1
1.4
0.5
Poland
4.9
4.4
4.1
6.2
6.8
5.1
1.6
3.9
4.3
2.5
4.0
2.5
Romania
1.3
-0.1
6.2
7.9
6.3
7.3
-6.6
-1.6
2.5
1.6
1.7
2.1
Sweden
1.2
3.4
3.3
4.3
3.3
-0.6
-5.2
5.6
4.2
0.7
4.0
1.4
United Kingdom
2.5
3.7
2.8
2.6
3.5
-1.1
-4.4
2.1
0.9
0.6
0.7
0.6
EU
1.3
3.0
2.1
3.3
3.2
0.3
-4.3
2.0
1.5
0.0
1.6
0.6
TABLE 2: Profiles (qoq) of quarterly GDP, volume (percentage change from previous quarter, 2010-12)
2010/1
2010/2
2010/3
2010/4
2011/1
2011/2
2011/3
2011/4
2012/1
2012/2
2012/3
2012/4
Belgium
0.1
1.1
0.4
0.5
0.9
0.3
-0.1
-0.2
-0.1
0.0
0.1
0.3
Germany
0.5
1.9
0.8
0.5
1.3
0.3
0.6
-0.2
0.1
0.2
0.5
0.4
Estonia
0.0
2.6
0.9
2.8
2.9
1.3
1.0
-0.8
-0.2
0.2
1.1
1.1
Ireland
1.5
-0.5
0.4
-1.4
1.8
1.4
-1.9
:
:
:
:
:
Greece
:
:
:
:
:
:
:
:
:
:
:
:
Spain
0.2
0.3
0.1
0.2
0.4
0.2
0.0
-0.3
-0.7
-0.3
-0.1
0.0
France
0.1
0.5
0.4
0.3
0.9
-0.1
0.3
0.2
-0.1
0.0
0.2
0.2
Italy
0.8
0.4
0.3
0.0
0.1
0.3
-0.2
-0.7
-0.7
-0.2
0.0
0.0
Cyprus
1.0
0.4
1.1
0.1
-0.1
0.3
-0.8
0.0
-0.7
-0.6
0.6
0.8
Luxembourg
1.2
1.5
0.0
1.2
0.2
-0.9
0.6
-0.1
0.0
0.4
0.3
0.6
Malta
1.0
-0.1
0.3
2.0
-0.3
0.4
0.3
:
:
:
:
:
Netherlands
0.4
0.6
0.1
0.8
0.7
0.1
-0.4
-0.7
-0.2
-0.2
0.1
0.1
Austria
0.1
0.8
1.4
1.1
0.9
0.5
0.2
-0.1
0.0
0.0
0.5
0.6
Portugal
0.9
0.3
0.2
-0.4
-0.6
-0.2
-0.6
-1.3
-1.4
-0.6
-0.3
0.0
Slovenia
0.2
1.2
0.5
0.3
-0.1
0.0
-0.2
-0.8
-0.1
0.4
0.6
0.5
Slovakia
0.8
0.9
0.9
0.8
0.8
0.8
0.8
0.9
-0.3
0.0
0.2
0.6
Finland
0.7
3.0
0.1
1.5
0.2
0.1
0.9
0.0
0.0
0.3
0.3
0.4
Euro area
0.4
0.9
0.4
0.3
0.8
0.2
0.1
-0.3
-0.3
0.0
0.2
0.2
Bulgaria
0.9
1.6
0.7
0.5
0.5
0.3
0.3
0.4
0.0
0.4
1.3
0.9
Czech Republic
0.7
1.0
0.7
0.6
0.6
0.2
-0.1
-0.3
-0.1
0.2
0.2
0.4
Denmark
0.0
1.5
1.1
-0.5
0.0
1.0
-0.5
0.3
0.3
0.4
0.6
0.6
Latvia
1.1
0.1
0.8
1.3
1.0
1.9
1.4
0.8
-0.3
0.3
0.6
0.7
Lithuania
1.2
0.7
0.7
1.8
2.1
1.8
1.5
-0.9
0.4
0.6
1.1
1.3
Hungary
1.1
0.4
0.7
0.3
0.7
0.1
0.4
0.3
-0.2
0.1
0.0
0.0
Poland
0.7
1.0
1.4
0.9
1.0
1.2
1.0
0.5
0.5
0.5
0.5
0.7
Romania
:
:
:
:
:
:
:
:
:
:
:
:
Sweden
1.9
2.0
1.9
1.2
0.7
1.0
1.6
-0.7
0.3
0.4
0.4
0.5
United Kingdom
0.4
1.1
0.7
-0.5
0.4
0.0
0.6
-0.2
0.1
0.1
0.4
0.3
EU
0.4
1.0
0.5
0.2
0.7
0.2
0.3
-0.3
-0.1
0.1
0.3
0.3

Interim forecast, February 2012
42
TABLE 3: Profiles (yoy) of quarterly GDP, volume (percentage change from corresponding quarter in previous year, 2010-12)
15.02.2012
2010/1
2010/2
2010/3
2010/4
2011/1
2011/2
2011/3
2011/4
2012/1
2012/2
2012/3
2012/4
Belgium
1.9
2.9
2.1
2.1
2.9
2.1
1.6
0.9
-0.1
-0.4
-0.1
0.4
Germany
2.4
4.1
4.0
3.8
4.6
2.9
2.7
2.0
0.8
0.8
0.6
1.3
Estonia
-4.2
2.4
4.7
6.5
9.5
8.0
8.2
4.4
1.3
0.2
0.3
2.2
Ireland
-1.0
-0.8
0.1
0.0
0.2
2.1
-0.2
:
:
:
:
:
Greece
:
:
:
:
:
:
:
:
:
:
:
:
Spain
-1.3
0.0
0.4
0.7
0.9
0.8
0.8
0.3
-0.8
-1.2
-1.3
-0.9
France
1.0
1.5
1.6
1.4
2.2
1.6
1.5
1.4
0.3
0.4
0.3
0.3
Italy
1.0
1.6
1.5
1.6
1.0
0.8
0.3
-0.5
-1.3
-1.8
-1.6
-0.9
Cyprus
-1.0
0.8
2.3
2.5
1.5
1.4
-0.5
-0.5
-1.2
-2.0
-0.6
0.1
Luxembourg
0.6
4.3
2.0
3.9
2.9
0.5
1.1
-0.2
-0.4
0.9
0.6
1.3
Malta
3.7
2.8
2.1
3.1
1.8
2.4
2.4
:
:
:
:
:
Netherlands
0.5
2.4
1.7
2.0
2.3
1.8
1.3
-0.3
-1.2
-1.4
-1.0
-0.1
Austria
0.7
2.4
3.2
3.4
4.3
3.9
2.7
1.5
0.6
0.1
0.4
1.1
Portugal
1.7
1.6
1.3
1.0
-0.5
-1.0
-1.8
-2.7
-3.5
-3.9
-3.6
-2.3
Slovenia
-0.3
1.5
1.6
2.2
1.9
0.7
-0.1
-1.1
-1.2
-0.8
0.1
1.4
Slovakia
5.0
4.5
4.1
3.4
3.4
3.4
3.2
3.3
2.2
1.4
0.8
0.4
Finland
0.9
4.8
3.4
5.4
4.9
1.9
2.7
1.2
1.0
1.2
0.6
0.9
Euro area
1.0
2.1
2.1
2.0
2.4
1.6
1.3
0.7
-0.3
-0.5
-0.4
0.1
Bulgaria
-1.9
-0.4
0.0
3.7
3.3
2.0
1.6
1.5
1.0
1.1
2.1
2.6
Czech Republic
0.9
3.0
3.3
3.0
2.8
2.0
1.2
0.5
-0.3
-0.3
0.0
0.7
Denmark
-1.5
1.6
3.0
2.2
2.2
1.7
0.0
0.8
1.0
0.4
1.5
1.9
Latvia
-5.8
-4.6
3.2
3.3
3.2
5.1
5.7
5.3
3.8
2.2
1.4
1.3
Lithuania
-1.1
0.9
1.2
4.4
5.4
6.5
7.3
4.5
2.8
1.7
1.3
3.6
Hungary
-0.8
0.8
2.5
2.5
2.1
1.7
1.5
1.5
0.7
0.6
0.3
0.0
Poland
3.2
3.7
4.8
4.1
4.5
4.6
4.2
3.8
3.2
2.4
1.9
2.1
Romania
:
:
:
:
:
:
:
:
:
:
:
:
Sweden
2.9
4.5
6.8
7.1
5.8
4.8
4.6
2.6
2.3
1.6
0.5
1.7
United Kingdom
1.2
2.5
3.0
1.7
1.7
0.6
0.5
0.8
0.5
0.7
0.4
0.9
EU
1.0
2.2
2.4
2.2
2.4
1.7
1.4
0.9
0.1
-0.1
-0.1
0.4
TABLE 4: Harmonised index of consumer prices (national index if not available), (percentage change on preceding year, 1992-2012)
5-year
February
2012
Autumn 2011
averages
forecast
forecast
1992-96
1997-01
2002-06
2006
2007
2008
2009
2010
2011
2012
2011
2012
Belgium
2.2
1.7
2.0
2.3
1.8
4.5
0.0
2.3
3.5
2.7
3.5
2.0
Germany
3.1
1.2
1.6
1.8
2.3
2.8
0.2
1.2
2.5
1.9
2.4
1.7
Estonia
120.7
6.1
3.3
4.4
6.7
10.6
0.2
2.7
5.1
3.1
5.2
3.3
Ireland
2.2
3.0
3.2
2.7
2.9
3.1
-1.7
-1.6
1.2
1.6
1.1
0.7
Greece
11.6
3.7
3.4
3.3
3.0
4.2
1.3
4.7
3.1
-0.5
3.0
0.8
Spain
4.7
2.4
3.3
3.6
2.8
4.1
-0.2
2.0
3.1
1.3
3.0
1.1
France
2.0
1.2
2.1
1.9
1.6
3.2
0.1
1.7
2.3
2.2
2.2
1.5
Italy
4.6
2.1
2.4
2.2
2.0
3.5
0.8
1.6
2.9
2.9
2.7
2.0
Cyprus
4.3
2.7
2.6
2.2
2.2
4.4
0.2
2.6
3.5
2.8
3.4
2.8
Luxembourg
1.8
1.9
2.9
3.0
2.7
4.1
0.0
2.8
3.7
2.7
3.6
2.1
Malta
3.3
3.1
2.5
2.6
0.7
4.7
1.8
2.0
2.4
2.1
2.6
2.2
Netherlands
2.5
2.6
2.1
1.7
1.6
2.2
1.0
0.9
2.5
2.0
2.5
1.9
Austria
2.9
1.3
1.7
1.7
2.2
3.2
0.4
1.7
3.6
2.4
3.4
2.2
Portugal
5.6
2.7
2.9
3.0
2.4
2.7
-0.9
1.4
3.6
3.3
3.5
3.0
Slovenia
:
8.0
4.3
2.5
3.8
5.5
0.9
2.1
2.1
1.6
1.9
1.3
Slovakia
:
8.5
5.3
4.3
1.9
3.9
0.9
0.7
4.1
1.9
4.0
1.7
Finland
1.5
1.9
1.1
1.3
1.6
3.9
1.6
1.7
3.3
3.0
3.2
2.6
Euro area
3.8
1.7
2.2
2.2
2.1
3.3
0.3
1.6
2.7
2.1
2.6
1.7
Bulgaria
87.7
:
5.5
7.4
7.6
12.0
2.5
3.0
3.4
3.0
3.6
3.1
Czech Republic
:
5.6
1.5
2.1
3.0
6.3
0.6
1.2
2.1
3.0
1.8
2.7
Denmark
1.9
2.1
1.8
1.9
1.7
3.6
1.1
2.2
2.7
1.8
2.6
1.7
Latvia
70.3
3.9
4.9
6.6
10.1
15.3
3.3
-1.2
4.2
2.5
4.2
2.4
Lithuania
179.8
3.9
1.4
3.8
5.8
11.1
4.2
1.2
4.1
2.6
4.0
2.7
Hungary
23.2
12.3
4.8
4.0
7.9
6.0
4.0
4.7
3.9
5.1
4.0
4.5
Poland
31.4
9.8
1.9
1.3
2.6
4.2
4.0
2.7
3.9
3.5
3.7
2.7
Romania
116.9
63.2
12.9
6.6
4.9
7.9
5.6
6.1
5.8
3.0
5.9
3.4
Sweden
2.4
1.5
1.5
1.5
1.7
3.3
1.9
1.9
1.4
0.9
1.5
1.3
United Kingdom
2.8
1.3
1.7
2.3
2.3
3.6
2.2
3.3
4.5
2.7
4.3
2.9
EU
25.8
4.3
2.3
2.3
2.4
3.7
1.0
2.1
3.1
2.3
3.0
2.0

Interim forecast, February 2012
43
TABLE 5: Profiles of quarterly harmonised index of consumer prices (percentage change on corresponding quarter in previous year, 2010-12)
15.02.2012
2010/1
2010/2
2010/3
2010/4
2011/1
2011/2
2011/3
2011/4
2012/1
2012/2
2012/3
2012/4
Belgium
1.2
2.4
2.6
3.2
3.6
3.3
3.6
3.4
3.2
2.8
2.4
2.1
Germany
0.8
1.0
1.2
1.6
2.2
2.5
2.6
2.6
2.2
1.9
1.9
1.6
Estonia
0.0
2.9
3.1
5.0
5.2
5.3
5.4
4.4
4.5
3.4
2.4
2.2
Ireland
-2.4
-2.1
-1.2
-0.6
0.8
1.3
1.1
1.4
1.0
1.3
1.7
2.5
Greece
3.0
5.1
5.6
5.1
4.5
3.3
2.1
2.6
1.3
-0.1
-1.3
-1.9
Spain
1.3
2.3
2.0
2.6
3.3
3.3
2.9
2.8
1.7
1.5
1.2
1.0
France
1.5
1.8
1.8
1.9
2.0
2.2
2.3
2.7
2.6
2.0
2.1
2.0
Italy
1.3
1.6
1.7
2.0
2.3
2.9
2.7
3.7
3.3
2.8
2.4
3.1
Cyprus
2.5
2.2
3.3
2.3
3.1
4.1
2.9
3.8
3.6
3.5
2.3
2.0
Luxembourg
2.8
2.8
2.7
2.9
3.8
3.9
3.6
3.7
3.0
2.6
2.6
2.5
Malta
0.9
1.5
2.6
3.2
2.9
2.7
2.4
1.7
1.7
2.0
2.1
2.3
Netherlands
0.5
0.4
1.3
1.5
2.0
2.4
2.9
2.7
2.4
1.6
1.9
2.0
Austria
1.3
1.8
1.7
2.0
3.0
3.7
3.8
3.7
2.9
2.5
2.2
2.2
Portugal
0.3
1.0
2.0
2.3
3.7
3.7
3.1
3.8
3.7
3.3
3.4
3.1
Slovenia
1.7
2.4
2.3
2.0
2.3
2.0
1.5
2.6
2.1
1.7
1.4
1.3
Slovakia
0.0
0.7
1.0
1.1
3.5
4.1
4.1
4.7
1.8
1.8
1.9
2.0
Finland
1.5
1.4
1.4
2.5
3.4
3.4
3.5
3.0
2.8
3.1
3.2
2.9
Euro area
1.1
1.6
1.7
2.0
2.5
2.8
2.7
2.9
2.5
2.1
1.9
1.9
Bulgaria
2.0
2.9
3.3
4.0
4.5
3.4
3.1
2.5
2.8
3.3
3.0
3.0
Czech Republic
0.4
1.0
1.6
2.0
1.9
1.8
2.1
2.8
3.2
3.4
3.0
2.5
Denmark
1.9
2.0
2.3
2.5
2.6
2.9
2.6
2.5
1.8
1.5
1.9
1.8
Latvia
-3.9
-2.3
-0.3
1.7
3.8
4.6
4.4
4.1
3.1
2.5
2.2
2.0
Lithuania
-0.4
0.5
1.8
2.9
3.2
4.7
4.6
4.0
3.1
2.5
2.3
2.5
Hungary
5.8
5.2
3.6
4.3
4.3
3.9
3.5
4.1
5.8
5.0
4.7
5.0
Poland
3.4
2.5
2.1
2.7
3.6
4.0
3.7
4.2
4.0
3.5
3.5
3.0
Romania
4.6
4.3
7.5
7.8
7.5
8.3
4.2
3.4
2.1
2.4
3.9
3.6
Sweden
2.7
1.9
1.3
1.8
1.3
1.7
1.6
0.9
0.7
0.8
1.0
1.2
United Kingdom
3.3
3.4
3.1
3.4
4.1
4.4
4.7
4.7
3.2
2.8
2.5
2.2
EU
1.7
2.0
2.1
2.5
2.9
3.2
3.1
3.2
2.6
2.2
2.1
2.0

ACKNOWLEDGMENTS
44
This report was prepared in the Directorate-General for Economic and Financial Affairs under the
direction of Marco Buti, Director-General, Servaas Deroose, Deputy Director-General, and Elena Flores,
Director for "Policy strategy and coordination". Executive responsibilities were attached to Reinhard
Felke, Head of Unit for "Forecasts and economic situation", Björn Döhring, Head of Sector "Macro-
economic forecasts and short-term economic developments" and the forecast coordinators Laura
González Cabanillas and Michał Narożny.
The report benefited from contributions by Jean-Luc Annaert, Pasquale D'Apice, Davide Balestra,
Narcissa Balta, Paolo Battaglia, Barbara Bernardi, Piotr Bogumił, Reuben Borg, Chris Bosma, Mateo
Capó Servera, Jakob Christensen, Oliver Dieckmann, Anna Dimitríjevics, Fotini Dionyssopoulou, Björn
Döhring, Christophe Doin, Gatis Eglitis, Polyvios Eliofotou, Shane Enright, Riccardo Ercoli, Leila
Fernandez Stembridge, Malgorzata Galar, Olivia Galgau, Julien Genet, Nikolay Gertchev, Laura
González Cabanillas, Michael Grams, Oskar Grevesmühl, Dalia Grigonyte, Zoltán Gyenes, László
Jankovics, Javier Jareño Morago, Markita Kamerta, Julda Kielyte, Mitja Košmrl, Bozhil Kostov,
Radoslav Krastev, Bettina Kromen, Stefan Kuhnert, Baudouin Lamine, Milan Lisický, Erki Lohmuste,
Davide Lombardo, Natalie Lubenets, Mart Maivali, Janis Malzubris, Anton Mangov, Renata Mata Dona,
Dan Matei, Olivia Mollen, Marco Montanari, Daniel Monteiro, Magdalena Morgese Borys, Manuel
Palazuelos Martínez, Michał Narożny, Christos Paschalides, Presyian Petkov, Nicolas Philiponnet,
Bartosz Przywara, An Renckens, Vito Ernesto Reitano, Monika Sherwood, Michael Sket, Louise Skouby,
Peeter Soidla, Vladimír Solanič, Erik Sonntag, Jacek Szelożyński,
Alina Tanasa, Ingrid Toming, Tsvetan
Tsalinski, Thomas Usher, Henk Van Noten, Rafał Wielądek, Ann-Louise Winther, Samuel Wittaker,
Pavlína Žáková.
Editorial support by Chris Maxwell is gratefully acknowledged. Support on the communication and
publication of this report by Lisbeth Ekelöf, Robert Gangl, Jens Matthiessen, Irena Novakova, Sarka
Novotna and Roman Schönwiesner is gratefully acknowledged. IT support was provided by Marius Bold,
Françoise Demarliere, Rudy Druine and Frédéric Petre.
Forecast assumptions were prepared by Chris Bosma, Sara Tägtström, Przemyslaw Woźniak and
Alexandru Zeana. Coordination and editorial support on the sections on "Member Sates" was provided by
Martin Larch, Head of Unit "Coordination of country-specific policy surveillance", Gerrit Bethuyne, Jörn
Griesse and Karolina Leib. Statistical and layout assistance was provided by Christiaan Muller and
Daniela Porubská.
Secretarial support for the finalisation of this report was provided by Anita Janicka and Els Varblane.
Comments on the report would be gratefully received and should be sent to:
Directorate-General for Economic and Financial Affairs
Unit A4: Forecast and Economic Situation
European Commission
B-1049 Brussels
E-mail:
ecfin-interim-forecast@ec.europa.eu

Interim forecast, February 2012
45
Box 2: Some technical elements behind the forecast
The cut-off date for taking new information into
account in this European Economic Forecast was
15 February.
External assumptions
This forecast is based on a set of external
assumptions, reflecting market expectations at the
time of the forecast. To shield the assumptions
from possible volatility during any given trading
day, averages from a 10-day reference period
(between 1 and 14 February) were used for
exchange and interest rates, and for oil prices.
Exchange and interest rates
The technical assumption as regards exchange rates
was standardised using fixed nominal exchange
rates for all currencies. This technical assumption
leads to an implied average USD/EUR rate of 1.32
in 2012. The average JPY/EUR rate is 101.0 in
2012.
Interest-rate assumptions are market-based.
Short-term interest rates for the euro area are
derived from futures contracts. Long-term interest
rates for the euro area, as well as short- and
long-term interest rates for other Member States are
calculated using implicit forward swap rates,
corrected for the current spread between the
interest rate and swap rate. In cases where no
market instrument is available, the fixed spread
vis-à-vis the euro-area interest rate is taken for both
short- and long-term rates. As a result, short-term
interest rates are expected to be 0.8% on average in
2012 in the euro area. Long-term euro-area interest
rates are assumed to be 2.0% on average in 2012.
Commodity prices
Commodity price assumptions are also based on
market conditions. According to futures markets,
prices for Brent oil are projected to be on average
113.1 USD/bl. in 2012. This would correspond to
an oil price of 86.0 EUR/bl. in 2012.
No-policy-change assumption
Although no public-finance variables are included
in this interim forecast, additional fiscal measures
could have a bearing on GDP growth or inflation in
the short- to medium term. Therefore the 'no-
policy-change' assumption is used, whereby the
GDP and inflation forecasts for 2012 take into
consideration only the measures adopted or
presented to national parliaments as well as other
measures known in sufficient detail.
Calendar effects on GDP growth
The number of working days may differ from one
year to another. The Commission's annual GDP
forecasts are not adjusted for the number of
working days, but quarterly forecasts are.
However, the working-day effect in the EU and the
euro area is estimated to be limited over the
forecast horizon, implying that adjusted and
unadjusted growth rates differ only marginally.
Wyszukiwarka
Podobne podstrony:
2012 02 23 interim forecast eni Nieznany (2)
2012 02 23 czesc 2
2012 02 23 czesc 1 1
2012 02 23 Fiskus dopnie swego mimo ucieczki podatnika
2012 02 23 Ile powninien zarabiać prezes
2012 02 23 Służbowo można jeździć nawet do domu
2012 02 23 OC Korzystne zmiany dla klientów
2012 02 27, ćwiczenie 1 0001
2012 02 27, ćwiczenie 2
2012 01 23 KPP Stalowa Wola sprawozdanie za 2011rid 27626
2003 02 23
02 (23)
2012 02 27, ćwiczenie 2 0001
2012 06 23 Lubuskie Klasa O
Załącznik nr 1 do zapytania, Przegrane 2012, Rok 2012, mail 23.08 Konstantynów 2 tablice
PRZEKRA J TEOWY 2012 03 23 id 3 Nieznany
2010 02 23
więcej podobnych podstron