
CHANGING RACE

CRITICAL AMERICA
Richard Delgado and Jean Stefancic
General Editors
White by Law: The Legal Construction of Race
Ian F. Haney López
Cultivating Intelligence: Power, Law, and the Politics of Teaching
Louise Harmon and Deborah W. Post
Privilege Revealed: How Invisible Preference Undermines America
Stephanie M. Wildman with Margalynne Armstrong,
Adrienne D. Davis, and Trina Grillo
Does the Law Morally Bind the Poor? or What Good’s the Constitution
When You Can’t Afford a Loaf of Bread?
R. George Wright
Hybrid: Bisexuals, Multiracials, and Other Misfits under
American Law
Ruth Colker
Critical Race Feminism: A Reader
Edited by Adrien Katherine Wing
Immigrants Out! The New Nativism and the Anti-Immigrant
Impulse in the United States
Edited by Juan F. Perea
Taxing America
Edited by Karen B. Brown and Mary Louise Fellows
Notes of a Racial Caste Baby: Color Blindness and the End of
Affirmative Action
Bryan K. Fair
Please Don’t Wish Me a Merry Christmas: A Critical History of
the Separation of Church and State
Stephen M. Feldman
To Be an American: Cultural Pluralism and the Rhetoric
of Assimilation
Bill Ong Hing

Negrophobia and Reasonable Racism: The Hidden Costs of Being
Black in America
Jody David Armour
Black and Brown in America: The Case for Cooperation
Bill Piatt
Black Rage Confronts the Law
Paul Harris
Selling Words: Free Speech in a Commercial Culture
R. George Wright
The Color of Crime: Racial Hoaxes, White Fear, Black Protectionism,
Police Harassment, and Other Macroaggressions
Katheryn K. Russell
The Smart Culture: Society, Intelligence, and Law
Robert L. Hayman, Jr.
Was Blind, But Now I See: White Race Consciousness
and the Law
Barbara J. Flagg
The Gender Line: Men, Women, and the Law
Nancy Levit
Heretics in the Temple: Americans Who Reject the Nation’s
Legal Faith
David Ray Papke
The Empire Strikes Back: Outsiders and the Struggle over
Legal Education
Arthur Austin
Interracial Justice: Conflict and Reconciliation in
Post–Civil Rights America
Eric K. Yamamoto
Black Men on Race, Gender, and Sexuality: A Critical Reader
Edited by Devon W. Carbado
When Sorry Isn’t Enough: The Controversy over Apologies and
Reparations for Human Injustice
Edited by Roy L. Brooks

Disoriented: Asian Americans, Law, and the Nation State
Robert S. Chang
Rape and the Culture of the Courtroom
Andrew E. Taslitz
The Passions of Law
Edited by Susan A. Bandes
Global Critical Race Feminism: An International Reader
Edited by Adrien Katherine Wing
Law and Religion: Critical Essays
Edited by Stephen M. Feldman
Changing Race: Latinos, the Census, and the History of
Ethnicity in the United States
Clara E. Rodríguez

C L A R A E . RO D R Í G U E Z
CHANGING RACE
Latinos, the Census, and the History of
Ethnicity in the United States
a
New York University Press •
New York and London

N E W YO R K U N I V E R S I T Y P R E S S
New York and London
© 2000 by Clara E. Rodríguez
All rights reserved
Library of Congress Cataloging-in-Publication Data
Rodríguez, Clara E., 1944–
Changing race : Latinos, the census, and the history of ethnicity /
Clara E. Rodríguez.
p. cm. — (Critical America)
Includes bibliographical references and index.
ISBN 0-8147-7547-0 (pbk. : alk. paper) — ISBN 0-8147-7546-2 (cloth : alk. paper)
1. Hispanic Americans—Census. 2. Hispanic Americans—Race identity.
3. Hispanic Americans—Ethnic identity. 4. Categorization (Psychology).
5. Race—Social aspects—United States. 6. Ethnology—United States.
7. United States—Census. 8. United States—Race relations. I. Title. II. Series.
E184.S75 R64 2000
305.8'00973—dc21
00-008629
New York University Press books are printed on acid-free paper,
and their binding materials are chosen for strength and durability.
Manufactured in the United States of America
10 9 8 7 6 5 4 3 2 1

Contents
Introduction
ix
Acknowledgments
xv
I
The Fluidity of Race
1
Latinos in the U.S. Race Structure
3
2
The Idea of Race
27
3
Stories of Self-Definition
47
II
Historical Constructions
4
Whites and Other Social Races
65
5
The Shifting Color Line
87
6
Race in the Americas
106
III
Race and the Census
7
The “Other Race” Option
129
8
Redefining Race in 2000
153
Appendix A: Data Limitations and the Undercount
177
Appendix B: The Biological Concept of Race in the United States
182
Appendix C: A Technical Oversight or Racial Flux?
187
Appendix D: Free People of Color
193
Notes
199
References
229
Index
265
About the Author
283
vii


Introduction
Ethnicity is a hotly contested subject in the academy; even the term pro-
vokes intense scholarly debate. In addition, academic definitions and
discussions of ethnicity are complex, with different disciplines empha-
sizing different aspects of the phenomenon. Anthropologists and soci-
ologists focus on social and cultural factors and take for granted the
psychodynamics of individuals. Conversely, psychologists place social
phenomena in the background, stressing the importance of individual
cognition and emotions (Leets, Clement, and Giles 1996). Social psy-
chologists argue that all these dimensions must be linked through self-
identification and that culture and the individual must be considered
together.
Unfortunately, much of the scholarly writing on ethnicity is not
theoretically rigorous. A recent analysis of ethnicity in the social sci-
ence literature, reviewing 190 articles and 10,000 citations published
between 1974 and 1992 (Leets, Clement, and Giles 1996), found that
an overwhelming majority (82%) of the articles lacked any coherent
theoretical foundation from which to view ethnicity.
1
Moreover, the
majority were not empirical, and many did not report how they had
measured ethnicity.
Most of the articles (43%) dealt with ethnicity only secondarily and
usually measured ethnicity as a geopolitical category, for example, Hin-
dus in India. Only 22 percent reflected multiple dimensions of ethnicity,
acknowledged overlapping categories, or included objective and sub-
jective components of ethnicity. Some scholars equated ethnicity with
race. Generally, most investigators regarded ethnicity as an objective,
self-evident social reality that needed little, or no further, elaboration.
2
Ethnicity and race, however, have a fluidity and complexity that are
not often acknowledged but nonetheless are evident. When we reflect
on how or why we consider an individual or a group to be “ethnic,” we
think, for example, of language or dialect; common cultural and/or ge-
ographic origin; religion; physical difference from us, such as height,
ix

skin color; food, music, and artistic preferences and creations; political
interests in their country of origin and/or in the United States; institu-
tions that represent and maintain the group; and an internal or external
sense of distinctiveness. Indeed, all these variables surface when we
consider the multifaceted population of Latinos in the United States.
The experience of Latinos in the United States demonstrates that eth-
nicity involves both internal and external components, which are cul-
turally, politically, and subjectively influenced and multileveled (Isajiw
1993:418ff; Leets, Clement, and Giles 1996; van den Berghe 1981:254–
261). Consider the situation of Jews in Europe during World War II and
Latinos in today’s United States. During the war, Jews were regarded as
a “race,” even though they are a religious-ethnic group. On a personal
level, a person might have identified himself or herself as either a de-
vout Jew or a secular person of Jewish ancestry. But on an instrumental
level, this person might also have been a German. And the external
identification of this person during the Nazi regime was both non-Ger-
man and nondesirable. In the United States today, a person may be
Puerto Rican or Mexican on a personal level, Latino on an instrumental
level, and Hispanic to the government. Some people might classify this
person as black, white, or Asian. Others think of Latinos as a brown
race, and still others, as a multiracial ethnic group. This book discusses
this distinction-plus-duality. For simplicity’s sake, and in order to ap-
pear compatible with what appears to be the prevailing language usage
of most publishers, the terms “white” and “black” were not capitalized
in this volume.
This book emphasizes the multidimensional nature of individual
racial identity (Hartman 1994, 1995). Hansen (1995) has provided ex-
amples of a number of these dimensions in the case of African Ameri-
cans: self-definition (do I consider myself black?), perception (am I con-
sidered black by others?), and treatment (am I treated as if I were
black?). He also points out that these three elements are not always con-
gruent. Rand Reed (1994) added a few other related dimensions: What
is the person biologically? Sociologically? When is race determined? At
birth? Death? And by whom? By parents? By an unknown observer?
These different levels coexist, with some more salient than others at dif-
ferent times.
As befits a complex subject, Changing Race draws on empirical research
and methodologies from many scholarly fields. For historical back-
x
I N T RO D U C T I O N

ground, I drew on archival records of state and federal censuses and in-
terpretive writings of the times. For a view into the shifting “official”
definitions of race and ethnicity, I examined the standard reference
works, such as Webster’s Collegiate Dictionary from 1898 to 1994. I also
analyzed secondary sources for insight into the meaning of race and
ethnicity from antiquity to the present. In addition, I investigated works
on race in several Latin American countries. For a more contemporary
analysis, I reviewed the relevant works in this area and also used sev-
eral methodologies. For example, I used in-depth interviews for the
case studies of identity in order to explore areas rarely covered in con-
ventional social science research. According to Carlos Martin, a former
colleague of mine at the Smithsonian Institution’s National Museum of
American History, personal accounts often give an entirely different
and more holistic view of “race” in general and of Latinos in particular.
For patterns of Hispanic racial identification and the reasons for these
patterns, I looked at national 1990 census data. I also used various forms
of statistical analysis and original survey data from earlier works to
provide quantifiable insights into the interplay of “identity” data and
economic status. Finally, I relied on legal writings for the discussion of
the “in-between” identities of several groups caught in the contradic-
tions of racial identity in the United States.
Conceptually, this book is positioned as follows: Academic disci-
plines offer at least four theoretical approaches to ethnicity, including
the assimilationist and the pluralist models, the most common and tra-
ditional approaches in the United States. Assimilationists assume that
ethnicity will be eliminated over time through assimilation, and plural-
ists believe that ethnic groups will change by adapting to or accommo-
dating the host society. Sociobiological theorists assume that biological
underpinnings and variables in social interactions are of prime impor-
tance. And Marxist theorists use a conflict orientation, in which every
thesis produces an antithesis that results in a new synthesis that also
produces a new antithesis, and so on. These (Marxist) conflict theorists
can be subdivided into (1) dependency theorists, who focus on political
economic relations, and (2) postmodern theorists (Leets, Clement, and
Giles 1996). My theoretical stance in regard to identity, ethnicity, and
race most approximates postmodernist theory.
Postmodernist theorists argue that there is not a true and know-
able self. Rather, one’s identity is relative and is constantly negotiated
through relationships and situational contexts. Instead of a core of
I N T RO D U C T I O N
xi

identity, or self, one has a plurality of selves, each of which surfaces
in a particular situation. Thus, an individual is not committed to
only one identity, and similarly, one’s ethnic identity is variable and
subject to the active construction of the individual (Leets, Clement,
and Giles 1996).
In this volume, I stress the centrality of situational influences and the
role of individuals in the active construction of multiple identities. That
is, I see individual identity as relational and situational. But I also main-
tain that many people have a core of identity, or a self, that is made up
of multiple identities—or, in the words of the postmodernists, a plural-
ity of selves. I thus disagree with those scholars who believe that indi-
viduals are not committed to only one true identity. Rather, I maintain
that individuals may have only one true and knowable self but that
their ethnic identity also may be variable and subject to an individual’s
particular construction of it and to the political and economic contexts
in which this person functions.
PURPOSES
In the first chapter, I explain that the concept of race can be construed
in a variety of ways and that the experience of Latinos in the United
States is a good example of the social constructedness of race. I also
describe two situations seldom mentioned but often experienced. The
first is that categories often come between people, and the second is
that people often fall between categories. Examples of the first are
particularly striking in the Native American community. As Forbes
noted, placing Native Americans who have married African Ameri-
cans into the “black” category has resulted in Native Americans’
being divided and losing some of their members (1990:44 ff). In some
cases, even whole tribes were denied federal recognition as Indian
tribes, for example, the Shinnecock Indians of Long Island and the
Ramapo Mountain Indians in New Jersey, New York, and Connecti-
cut. This categorization has also had a significant impact on the lives
of these “red-black” peoples, not just in terms of identity, but also in
terms of more immediate losses of land and treaty-protected rights
and benefits. An example of how people fall between categories was
most recently illustrated in the demands of multiracial individuals
for a census category that would accommodate the many and increas-
xii
I N T RO D U C T I O N

ing numbers of people who argue that they do not fit into any of the
established census groupings.
Although ostensibly removed from their real lives and everyday ac-
tivities, categories and classifications do affect people in the United
States. As this book shows, which and how people are counted has
many ramifications. Moreover, although many believe that census data
do not pertain to identity but, rather, are needed to address past dis-
crimination, we also know that all race data lead to some sort of reifica-
tion, which often affects the way in which peoples and individuals see
themselves and others. That it is important to clarify these issues and
the processes that lead to governmental classification is another reason
that I wrote this book.
A final purpose for writing this book was to shed light on an area
fraught with conflict, emotion, and politics. Race in the United States
is a complicated, political, and emotional subject. As a report by the
U.S. General Accounting Office indicated, “[The] collection of these
types of data is technically complex and publicly controversial”
(1997:1). I hope that a better understanding of what has too often
been used as a divisive and sometimes cruel issue can be addressed
openly, honestly, and humanely. In this way, we can abolish racial hi-
erarchies and become more respectful of one another’s unique and
valued histories.
GOVERNMENT AND DICTIONARY DEFINITIONS
OF RACE
Much of this book’s focus is on official racial labels and categories, both
past and present. I am aware, of course, that government records may
reflect somewhat “arbitrary racial categories imposed by a white official
or by white prejudice” and that this often contradicts other classifica-
tions, for example, familial traditions, that may have greater sociocul-
tural and psychological meanings and that may also provide bonds and
a sense of belonging that government categories do not (Forbes 1990:38,
41, 45). I also know that government categories are not always the best
or most satisfactory measures of group affiliation.
Nonetheless, government definitions or measures of race are the
most geographically comprehensive, most readily available, and most
numerically determinate tools we have. Census categories provide
I N T RO D U C T I O N
xiii

insight into how a society’s ideologies and dominant ideas and beliefs
are reflected in official government classifications. To a degree, they also
represent public consensus on how populations are viewed and
counted. I do recognize, however, that this is only one measure of race,
which has its own inherent difficulties. Moreover, because they exercise
a reflective as well as a regulatory role in society, census categories must
be considered carefully and from new viewpoints. This is what I want
to accomplish in Changing Race.
xiv
I N T RO D U C T I O N

Acknowledgments
As I sat down to write these acknowledgments, I remembered when,
not too long ago, the New York Women’s Agenda presented to me, and
others, its STAR award and I was asked to say a few words. Ron Gault,
a friend who was in the audience, later chided me, saying something
like “God, you thanked everyone in the whole wide world . . . your
mother, your father, all your sisters, your brothers, etc., etc.” And I told
him, “Yeah, they all helped.”
I also thought about my acknowledgments in an earlier book, in
which I quoted Tato Laviera, a celebrated Puerto Rican poet, who once
observed, “With every word I write I give thanks to 50 people.” It is the
same feeling that I have now, that there are so many people to thank.
Writing this book has been long and difficult, and many people helped
me with their consistent and unquestioned support for “whatever it is
you’re doing.” Here I count my family—my children Gelvi and José;
my husband Gel; my mother Clarita; my sisters Minny and Myrna;
my brother Jimmy; my cousin Lena; my nieces and nephew María,
Michelle, and Tony; and my extended family, who are too numerous to
list individually; and, finally, Rosa and Gloria, who also supported me.
Other people helped me more directly, such as my talented editors at
New York University Press: Stephen Magro, Niko Pfund, and Despina
Gimbel, five anonymous reviewers, Fordham University for giving me
some time off to complete the project, the Russell Sage Foundation and
its staff for facilitating my work during the year I spent there as a visit-
ing scholar, all the the authors cited in this work and those not cited but
who contributed to its development, and the following individuals who
contributed in unique and significant ways to its completion: Cristina
Bryan, Katie Courtice, Gregory De Freitas, Richard Delgado, Vanessa
Estrada, Norma Fuentes-Mayorga, Ian Haney-López, Charles Kamasaki,
J. Kehaulani Kauanui, Ray Lohier, Terri Ann Lowenthal, Carlos Martin,
Barbara Mundy, Nadine Naber, Jeff Passel, Olivia Carter-Pokras, Raedyn
Rivera, Eric Rodríguez, Jean Stefancic, and Frank Torres. I thank you all.
xv


PA RT I
THE FLUIDITY OF RACE


1
Latinos in the U.S. Race Structure
A C C O R D I N G TO D E F I N I T I O N S
common in the United States, I am
a light-skinned Latina with European features and hair texture. I was
born and raised in New York City; my first language was Spanish; and
I am today bilingual. I cannot remember when I first realized that the
color of one’s skin, the texture of one’s hair, or the cast of one’s features
determined how one was treated in both my Spanish-language and
English-language worlds. I do know that it was before I understood
that accents, surnames, residence, class, and clothing also determined
how one was treated.
Looking back on my childhood, I recall many instances when the
lighter skin color and European features of some persons were admired
and terms such as pelo malo (bad hair) were commonly used to refer to
“tightly curled” hair. It was much later that I came to see that this Eu-
rocentric bias, which favors European characteristics above all others,
was part of our history and cultures. In both Americas and the
Caribbean, we have inherited and continue to favor this Eurocentrism,
which grew out of our history of indigenous conquest and slavery
(Shohat and Stam 1994).
I also remember a richer, more complex sense of color than the sim-
ple dichotomy of black and white would suggest, a genuine aesthetic
appreciation of people with some color and an equally genuine valua-
tion of people as people, regardless of color. Also, people sometimes
disagreed about an individual’s color and “racial” classification, espe-
cially if the person in question was in the middle range, not just with re-
gard to color, but also with regard to class or political position.
1
As I grew older, I came to see that many of these cues or clues to sta-
tus—skin color, physical features, accents, surnames, residence, and
other class characteristics—changed according to place or situation. For
example, a natural “tan” in my South Bronx neighborhood was attrac-
tive, whereas downtown, in the business area, it was “otherizing.” I also
3

recall that the same color was perceived differently in different areas.
Even in Latino contexts, I saw some people as lighter or darker, de-
pending on certain factors such as their clothes, occupation, and fami-
lies.
2
I suspect that others saw me similarly, so that in some contexts, I
was very light, in others darker, and in still others about the same as
everyone else. Even though my color stayed the same, the perception
and sometimes its valuation changed.
I also realize now that some Latinos’ experiences were different
from mine and that our experiences affect the way we view the world.
I know that not all Latinos have multiple or fluctuating identities. For a
few, social context is irrelevant. Regardless of the context, they see
themselves, and/or are seen, in only one way. They are what the Cen-
sus Bureau refers to as consistent; that is, they consistently answer in the
same way when asked about their “race.” Often, but not always, they
are at one or the other end of the color spectrum.
My everyday experiences as a Latina, supplemented by years of
scholarly work, have taught me that certain dimensions of race are fun-
damental to Latino life in the United States and raise questions about
the nature of “race” in this country. This does not mean that all Latinos
have the same experiences but that for most, these experiences are not
surprising. For example, although some Latinos are consistently seen as
having the same color or “race,” many Latinos are assigned a multi-
plicity of “racial” classifications, sometimes in one day! I am reminded
of the student who told me after class one day, “When people first meet
me, they think I’m Italian, then when they find out my last name is
Mendez, they think I’m Spanish, then when I tell them my mother is
Puerto Rican, they think I’m nonwhite or black.” Although he had not
changed his identity, the perception of it changed with each additional
bit of information.
Latino students have also told me that non-Latinos sometimes as-
sume they are African American. When they assert they are not “black”
but Latino, they are either reproved for denying their “race” or told they
are out of touch with reality. Other Latinos, who see whites as other-
than-me, are told by non-Latinos, “But you’re white.” Although not all
Latinos have such dramatic experiences, almost all know (and are often
related to) others who have.
In addition to being reclassified by others (without their consent),
some Latinos shift their own self-classification during their lifetime. I
have known Latinos who became “black,” then “white,” then “human
4
L AT I N O S I N T H E U. S . R AC E S T RU C T U R E

beings,” and finally again “Latino”—all in a relatively short time. I have
also known Latinos for whom the sequence was quite different and the
time period longer. Some Latinos who altered their identities came to be
viewed by others as legitimate members of their new identity group. I
also saw the simultaneously tricultural, sometimes trilingual, abilities
of many Latinos who manifested or projected a different self as they ac-
climated themselves to a Latino, African American, or white context
(Rodríguez 1989:77).
I have come to understand that this shifting, context-dependent ex-
perience is at the core of many Latinos’ life in the United States. Even in
the nuclear family, parents, children, and siblings often have a wide
range of physical types. For many Latinos, race is primarily cultural;
multiple identities are a normal state of affairs; and “racial mixture” is
subject to many different, sometimes fluctuating, definitions.
Some regard racial mixture as an unfortunate or embarrassing term,
but others consider the affirmation of mixture to be empowering. Lu-
gones (1994) subscribes to this latter view and affirms “mixture,” mesti-
zaje, as a way of resisting a world in which purity and separation are
emphasized and one’s identities are controlled: “Mestizaje defies con-
trol through simultaneously asserting the impure, curdled multiple
state and rejecting fragmentation into pure parts . . . the mestiza . . . has
no pure parts to be ‘had,’ controlled” (p. 460). Also prevalent in the
upper classes is the hegemonic view that rejects or denies “mixture”
and claims a “pure” European ancestry. This view also is common
among middle- and upper-class Latinos, regardless of their skin color
or place or origin. In some areas, people rarely claim a European ances-
try, such as in indigenous sectors of Latin America, in parts of Brazil,
and in the coastal areas of Colombia, Venezuela, Honduras, and
Panama (see, e.g., Arocha 1998; De La Fuente 1998). Recently, some Lati-
nos have encouraged another view in which those historical compo-
nents that were previously denied and denigrated, such as indigenous
and African ancestry, were privileged (see, e.g., Moro: La Revista de nues-
tra vida [Bogota, Colombia, September 1998]; La Voz del pueblo Taino [The
voice of the Taino people]), official newsletter of the United Confedera-
tion of Taino People, U.S. regional chapter, New York, January 1998).
Many people, however—mostly non-Latinos—are not acquainted
with these basic elements of Latino life. They do not think much about
them, and when they do, they tend to see race as a “given,” an ascribed
characteristic that does not change for anyone, at any time. One is either
L AT I N O S I N T H E U. S . R AC E S T RU C T U R E
5

white or not white. They also believe that “race” is based on genetic in-
heritance, a perspective that is just another construct of race.
Whereas many Latinos regard their “race” as primarily cultural,
others, when asked about their race, offer standard U.S. race terms, say-
ing that they are white, black, or Indian. Still others see themselves as
Latinos, Hispanics, or members of a particular national-origin group
and as belonging to a particular race group.
3
For example, they may
identify themselves as Afro-Latinos or white Hispanics. In some cases,
these identities vary according to context, but in others they do not.
I have therefore come to see that the concept of “race” can be con-
structed in several ways and that the Latino experience in the United
States provides many illustrations of this. My personal experiences
have suggested to me that for many Latinos, “racial” classification is
immediate, provisional, contextually dependent, and sometimes con-
tested. But because these experiences apply to many non-Latinos as
well, it is evident to me that the Latino construction of race and the
racial reading of Latinos are not isolated phenomena. Rather, the gov-
ernment’s recent deliberations on racial and ethnic classification stan-
dards reflect the experiences and complexities of many groups and in-
dividuals who are similarly involved in issues pertaining to how they
see themselves and one another (U.S. Department of Commerce 1995;
U.S. Office of Management and Budget 1995, 1997a and b, 1999; these
deliberations will be reviewed in chapter 8).
Throughout my life, I have considered racism to be evil, and I op-
pose it with every fiber of my being. I study race to understand its in-
fluence on the lives of individuals and nations because I hope that hon-
est, open, and well-meaning discussions of race and ethnicity and their
social dynamics can help us appreciate diversity and value all people,
not for their appearance, but for their character.
“OTHER RACE” IN THE 1980 AND 1990 CENSUSES
It was because of my personal experiences that I first began to write
about race (Rodríguez 1974) and that I was particularly sensitive to
Latinos’ responses to the censuses’ question about race. The U.S. Cen-
sus Bureau’s official position has been that race and ethnicity are two
separate concepts. Thus, in 1980 and in 1990, the U.S. census asked peo-
ple to indicate their “race”—white, black, Asian or Pacific Islander,
6
L AT I N O S I N T H E U. S . R AC E S T RU C T U R E

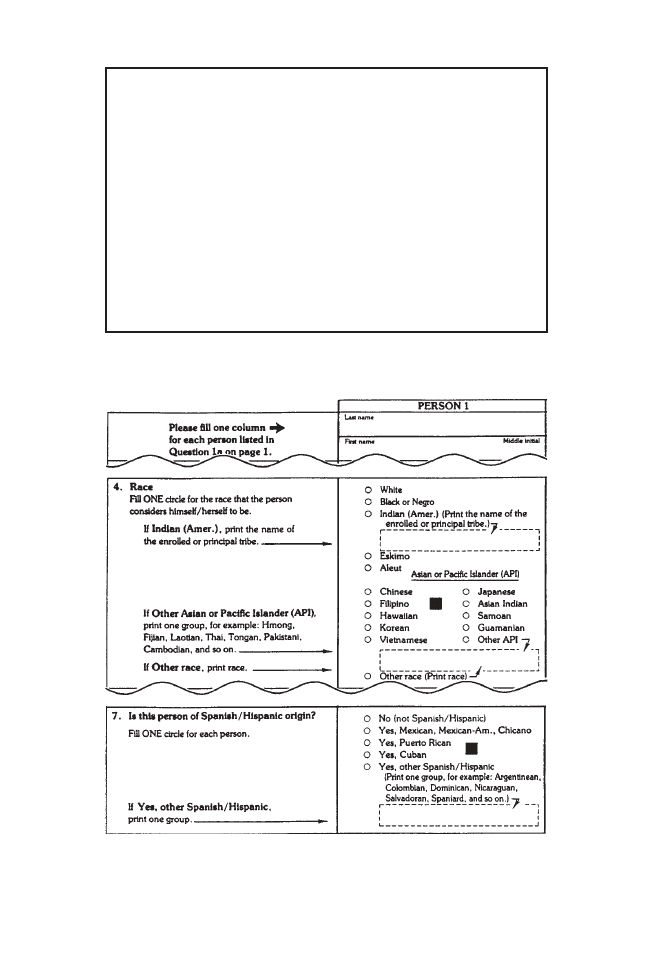
American Indian, or “other race”—and also whether or not they were
Hispanic. (The two questions used in the 1980 and 1990 censuses are
shown in figures 1.1 and 1.2). As table 1.1 shows, Latinos responded to
the 1990 census’s question about race quite differently than did non-
Latinos. Whereas less than 1 percent of the non-Hispanic population re-
ported they were “other race,” more than 40 percent of Hispanics chose
this category. Latinos responded similarly in the previous decennial
census (Denton and Massey 1989; Martin, DeMaio, and Campanelli
1990; Rodríguez 1989, 1990, 1991a; Tienda and Ortiz 1986). Although
the percentages of the different Hispanic groups choosing this category
varied, all chose it more often than did non-Hispanics (see table 1.1,
which shows a wide range in the proportion of Hispanic-origin groups
choosing “other race” in the 1990 census).
In addition, the many Hispanics who chose this category wrote—in
the box explicitly asking for race—the name of their “home” Latino
country or group, to “explain” their race—or “otherness.”
4
The fact that
these Latino referents were usually cultural or national-origin terms,
such as Dominican, Honduran, or Boricua (i.e., Puerto Rican) under-
scores the fact that many Latinos viewed the question of race as a ques-
tion of culture, national origin, and socialization rather than simply bi-
ological or genetic ancestry or color. Indeed, recent studies have found
that many Latinos understand “race” to mean national origin, national-
ity, ethnicity, culture (Kissam, Herrera, and Nakamoto 1993), or a com-
bination of these and skin color (Bates et al. 1994:109; Rodríguez 1991a,
1992, 1994a; Rodríguez and Cordero-Guzmán 1992). For many Latinos,
the term race or raza is a reflection of these understandings and not of
those often associated with “race” in the United States, for example, de-
fined by hypodescent.
5
Studies have found that Latinos also tend to see
race along a continuum and not as a dichotomous variable in which in-
dividuals are either white or black (Bracken and de Bango 1992; Ro-
dríguez and Hagan 1992; Romero 1992).
This does not mean that there is only one Latino view of race.
Rather, there are different views of race within different countries,
classes, and even families. Latinos’ views of race are dependent on a
complex array of factors, one of which is the racial formation process in
their country of origin. Other variables also influence their views of
race, for example, generational differences, phenotype, class, age, and
education. But even though there is not just one paradigm of Latin
American race, there are some basic differences between the way that
L AT I N O S I N T H E U. S . R AC E S T RU C T U R E
7
8
4. Is this person ———? Fill in one circle.
o
White
o
Asian Indian
o
Black or Negro
o
Hawaiian
o
Japanese
o
Guamanian
o
Chinese
o
Samoan
o
Filipino
o
Eskimo
o
Korean
o
Aleut
o
Vietnamese
o
Other—specify
o
Indian (Amer.) Print tribe ________.
__________________
7. Is this person of Spanish/Hispanic origin or descent? Fill in one circle.
o
No, not Spanish/Hispanic.
o
Yes, Mexican, Mexican-Amer., Chicano.
o
Yes, Puerto Rican.
o
Yes, Cuban.
o
Yes, other Spanish/Hispanic.
FIG. 1.2.
Race and Hispanic-Origin Questions on the 1990 Census
FIG. 1.1.
Two Questions about Race and Hispanic Origin on the 1980 Census

Latinos view race and the way that race is viewed overall in the United
States.
In the United States, rules of hypodescent and categories based
on presumed genealogical-biological criteria have generally domi-
nated conceptions of race. Racial categories have been few, discrete,
and mutually exclusive, with skin color a prominent element. Cate-
gories for mixtures—for example, mulatto—have been transitory. In
contrast, in Latin America, racial constructions have tended to be
more fluid and based on many variables, like social class and pheno-
type. There also have been many, often overlapping, categories, and
mixtures have been consistently acknowledged and have had their
own terminology. These general differences are what Latinos bring
with them to the United States, and they influence how they view
their own and others’ “identity.”
Although Latinos may use or approach “race” differently, this does
not mean that “race” as understood by Latinos does not have overtones
of racism or implications of power and privilege—in either Latin Amer-
ica or the United States. Indeed, the depreciation and denial of African
L AT I N O S I N T H E U. S . R AC E S T RU C T U R E
9
Table 1.1
Racial Self-Classification by Selected Hispanic-Origin Groups, 1990
White
Black
NAI
API
a
Other
Mexican
50.6
0.9
0.6
0.4
47.4
Puerto Rican
46.4
6.5
0.3
1.0
45.9
Cuban
83.8
3.7
0.2
0.4
12.0
Other Spanish
b
52.4
6.5
1.0
2.1
38.0
Dominican
29.26
29.96
1.02
c
39.76
Ecuadoran
50.81
1.90
1.68
c
45.62
Colombian
64.46
2.33
1.34
c
31.87
Guatemalan
42.95
0.89
1.67
c
54.48
Salvadoran
38.53
1.27
1.10
c
59.10
Panamanian
32.97
35.50
2.94
c
28.59
Total Hispanic
52.1
3.0
0.7
0.9
43.5
Non-Hispanic
83.1
12.9
0.8
3.1
0.1
Total population
199.5
29.8
2.0
7.2
9.7
(millions)
Rows sum to 100% except for rounding.
a
API = Asian and Pacific Islander; NAI = Native American Indian.
b
Includes both those who gave a Latino referent and those who identified themselves only as
Hispanic.
c
These two categories were combined because of small numbers.
Source: 1990 PUMS (Public Use Micro Sample) 1% sample. (These numbers may not be identical to
tables based on the 100% census survey or the 5% PUMS because of sampling variability.)

and Amerindian characteristics are widespread.
6
Everywhere in Latin
America can be found “a pyramidal class structure, cut variously by
ethnic lines, but with a local, regional and nation-state elite character-
ized as ‘white.’ And white rules over color within the same class; those
who are lighter have differential access to some dimensions of the mar-
ket” (Torres and Whitten 1998:23).
Even those countries that subscribe to a racial ideology of mestizaje
7
often maintain racial and class hierarchies that favor upper-class inter-
ests and political agendas, privilege European components, ignore
racialisms, and neutralize expressions of pluralism by indigenous or
African-descended groups (Martínez-Echazábal 1998). That the aware-
ness of these issues is increasing is evidenced by Torres-Saillant’s ap-
peal to Dominican historians to embrace a narrative that “privileges the
many rather than the few” (1998:140). As one Jamaican student travel-
ing in the Spanish-speaking Caribbean noted, the attitude there toward
race is similarly destructive but strikingly different from that in the
United States. Unfortunately, time has not altered the fact that “color”
and its associated connotations continue to convey and determine the
treatment that many receive in the Americas and the Caribbean.
When they migrate to the United States, some Latinos become more
aware of the racism existing in their own country of origin, and other
Latinos begin to question their conceptions of ethnic, racial, and na-
tional identities. Identities often thus become “a terrain of ideological
contestation” (Duany 1998b:149; Foner 1998; Oboler 1995; Omi and
Winant 1995; Torres-Saillant 1998). It was this ideological contestation
that was manifested when Latinos checked the “other race” category
and wrote in their national origins, ethnicity, and so forth on the decen-
nial census forms. Thus, most of the 40 percent of Hispanics who
marked the “other race category” and wrote in a Latino referent were
asserting that they were “none of the above.” Others—non-Latinos—
might fit them into one or more of the groups listed on the basis of color,
phenotype, or biological or ancestral knowledge of “race” origin, but
culturally or politically these Latinos did not see themselves as “white,”
“black,” or “Asian or Pacific Islander”—or just one of these (Rodríguez
1992). According to their own, more culturally defined perspective of
race, the “race” groups listed on the census were “social groups” but did
not include their own social group. This is why many Latinos still mark
“other” on census forms and fill in the space specifying their national
origin. Still others disagree with the race structure mirrored in the cen-
10
L AT I N O S I N T H E U. S . R AC E S T RU C T U R E

sus’s race question and choose the “other race” category because they
are more than “one of the above” race categories; that is, they are mestizo,
mulatto, black Latino, or another mixture (Davis et al. 1998a; Rodríguez
1992; Rodríguez and Cordero-Guzman 1992; Rodríguez et al. 1991).
Although the remaining 60 percent of Hispanics chose one of the
census’s standard race categories, this does not necessarily mean that
they all have assimilated or adopted the United States’ racial classifica-
tion system. Rather, some Latinos believe that this is how they are seen
and will always be seen in the United States and accept or understand
that this is their race in this country. Others, however, choose one of the
standard categories because that is what they are considered in their
country of origin. As one Bolivian respondent explained in an interview
conducted by the census, “I chose ‘white.’ I am considered white in my
country” (Davis et al. 1998a:III-19).
8
Still others are aware of the “offi-
cial” pressure to mark one of the standard categories. As one Hispanic
respondent in a census study indicated, “I do not consider myself
white, but this is what the government says I am.” Another respondent
said, “I don’t belong to any of these groups: probably I can be in ‘Some
other race’ and say ‘Hispanic’; but I decided to use ‘White.’” Still an-
other checked the white category but added, “I am a Hispanic white”
(Davis et al. 1998a:III-20–21). These responses suggest that even though
some Hispanics choose a standard race category, they believe that they
also have other, or multiple, identities.
Other Hispanics choose the standard race categories for the same
reasons that members of other groups do. They determine that “biolog-
ically,” or in terms of “blood quantum,” they fit into a particular cate-
gory (Davis et al. 1998b:48 ff). Finally, some Hispanics do not want to be
(or admit to being) “other than white,” “other than black,” or “other
than indio” (i.e., a member of an indigenous nation). That is, they iden-
tify culturally and/or politically with members of a particular category.
Latinos’ responses to the census are discussed in more depth later.
Suffice it to say at this point that in my many years of research in this
area, I have noticed in my and others’ work that “race” is a recurring,
sometimes amusing and benign, and sometimes conflictual issue.
9
For
Latinos, responses to questions of race are seldom as simple and
straightforward as they tend to be for most non-Hispanic whites (Ro-
dríguez et al. 1991).
These “other race” responses presented a problem to the Census
Bureau because they differed from previous responses and therefore
L AT I N O S I N T H E U. S . R AC E S T RU C T U R E
11

could not be easily fit into the existing race structure. What was to be
done with the nearly 10 million Hispanics who answered the race ques-
tion in this way? In what category were they to be placed? How were
they to be reported or tabulated? In short, how was this group to be un-
derstood? When analyzing these results, references to this “data qual-
ity” problem were couched in terms of responses in “the other race” cat-
egory. But the overwhelming majority (97.5%) who chose this category
were “Hispanic,” and they accounted for 40 percent of the total number
of Hispanics (U.S. General Accounting Office 1993:26). How, then, was
this “other race” group (or Hispanic component) to be understood or
accommodated in a country that for most of its history had employed
an overarching dual racial structure with four presumed major color
groups, that is, white, black, Asian or Pacific Islanders, and Native
American Indian?
This group, moreover, represented a growing number of people. In
1990, those who had checked the “other race” category represented the
country’s second-fastest growing racial category (after Asian and Pa-
cific Islanders) (Rodríguez 1991b:A14; U.S. General Accounting Office
1993). In addition, the population of Latinos was growing seven times
faster than the population of the nation as a whole. Between 1980 and
1990, it had increased by half while the white (non-Hispanic) popula-
tion increased by only 6 percent (U.S. Bureau of the Census 1991:table
1; U.S. Bureau of the Census 1993c:2).
10
By 1999, the number of Hispan-
ics in the United States (30 million) was greater than the total popula-
tion of Canada.
As we will see, the search for solutions to this and other problems
has contributed to a radical reexamination of the concept of race by the
U.S. government. This reexamination included numerous hearings,
conferences, and massive studies of hundreds of thousands of house-
holds and resulted in the decision to reverse the Census Bureau’s two-
hundred-year policy. For the first time, in the 2000 census, respondents
were allowed to choose more than one racial group when answering the
question about race.
Demographic and Other Changes
Also contributing to the question about the nature of race are
broader demographic trends, such as immigration and the concentra-
tion (and consequently greater visibility) of racial and ethnic minorities
12
L AT I N O S I N T H E U. S . R AC E S T RU C T U R E

in populous states and metropolitan areas (Edmonston, Goldstein, and
Tamayo Lott 1996). Added to this is the wide range of physical types of
many immigrant groups, for example, Middle Easterners and Latinos,
as well as the trend toward racial and ethnic intermarriage, particularly
between those of high socioeconomic status (Edmonston, Lee, and Pas-
sel 1994; Kalmijn 1993; Rolark, Bennett, and Harrison 1994; Spickard
1989).
These new trends contrast with past patterns, in which those in in-
terracial unions were usually marginal, foreign born, or part of ex-
ploitative slave relationships (Berry 1963; Williamson 1984). Con-
versely, many of the children of these modern unions are attending uni-
versity and will undoubtedly assume leadership positions in the future,
in which their positions on multiracial identities will carry the weight
of their class positions. The percentage of interracial marriages rose
from 0.4 percent in 1960 to 2.2 percent in 1991 (Rolark, Bennett, and Har-
rison 1994), and the number of births to parents of two different races
tripled, from 1.2 percent of all births in 1971 to 4.4 percent in 1995
(Atkinson, MacDorman, and Parker 1999).
11
Indeed, the seriousness
with which the proposal to include a multiracial category was received
suggests that these forces have already influenced the way that race and
ethnicity are viewed (see chap. 8).
In addition to these demographic trends, the greater affirmation of
a mixed-race identity and the increasing use and acceptance of self-
identification instead of observer identification have produced a more
heterogeneous and more tenuous concept of race (Edmonston, Lee, and
Passel 1994; Root 1992b, 1996) in the census and elsewhere. In this re-
gard, it is interesting that in 1990, half (50.6%) the children of interracial
unions were classified as “white” on the census form by their parent(s)
(Bennett, McKenney, and Harrison 1995:table 5), whereas in the past,
census takers would most likely have classified such children according
to the race of the nonwhite parent.
12
These trends are changing the
“face” of the United States and will intensify in the twenty-first century,
contributing to the growing trend to view race as many Latinos already
do, as race-ethnicity.
Blurred Boundaries
As increasing numbers of physically heterogeneous groups—such
as Latinos—have become more concentrated and/or more visible,
L AT I N O S I N T H E U. S . R AC E S T RU C T U R E
13

questions of what constitutes “whiteness” and nonwhiteness have sur-
faced. Can individuals seen as white and those seen as nonwhite be
members of the same race group? Where does whiteness—or black-
ness—begin? These questions have led to a reanalysis of whiteness and
fundamental reconsiderations of race and ethnicity. (See, e.g., the fol-
lowing works, which examine how whites see themselves, how white-
ness has been—or has not been—achieved by certain groups in Ameri-
can history and law, and how race and ethnicity are being rethought:
Brodkin Sacks 1994; Delgado and Stefancic 1997; Ferrante and Brown
1998; Frankenberg 1993; Gallagher 1999; Haney López 1996; Ignatiev
1995; Waters 1990.)
More and more native-born Americans see that many people’s
racial/ethnic definitions of themselves are at variance with others’ def-
inition of them. For example, white-appearing, third-generation Lati-
nos, who sometimes no longer even speak Spanish, may insist they are
“not white” or declare themselves to be “brown,” “black,” or “other.”
Government officials, office managers, criminal justice administra-
tors—that is, those who are responsible for counting race and ethnicity,
are increasingly realizing that individuals—particularly the growing
numbers of new and existing minorities—often define their “race”
quite differently than they would be defined by others.
13
THE PROPOSAL TO MAKE LATINOS A RACE
In July 1993, the U.S. Office of Management and Budget announced that
it would review the racial and ethnic categories used to collect govern-
ment data (U.S. Office of Management and Budget 1997a). A number of
proposals to amend the current categories were made. One proposal
that received quite a bit of media attention was to add a “multiracial”
category. Another proposal, even though it involved greater numbers of
people, received considerably less attention: to make Hispanics a race.
14
This proposal was subsequently referred to as “the combined question”
because it would list “Hispanic” as a category along with the other race
categories. That is, it would reclassify what the census had considered
an “ethnic group”—in which Hispanics could be of any race—to a
“race” group in which all Hispanics were of one race.
What made this proposal curious was that Hispanics did not
wholeheartedly initiate or support it, in contrast to other proposals con-
14
L AT I N O S I N T H E U. S . R AC E S T RU C T U R E

sidered at the time.
15
Even more striking was the fact that evidently few
Latinos noticed the lack of a Hispanic constituency. Although three His-
panic organizations were occasionally cited as supporting the proposal
(del Pinal 1994; Wright 1994), a close look at their statements shows this
was not exactly the case. Rather, their statements indicated reserva-
tions, questions, support for relabeling the race question “race/ethnic-
ity,” and a need for more research (National Council of La Raza 1995;
U.S. House Committee 1994k, 1994p).
As the final chapter in this book makes clear, Hispanics were a sig-
nificant but silent presence in the process, which was extraordinary
given the striking population growth of Latinos in the United States. In
March 1997, the Latino population was “officially” 29.7 million, or 11
percent of the total U.S. population (Reed and Ramirez 1998:table 1).
This figure did not include, however, the 3.6 million Hispanics who
lived in Puerto Rico (Hispanic Link, March 6, 1995, p. 1; Rodríguez
1994b) or those Hispanics who lived in the United States but were not
counted.
The U.S. Supreme Court recently decided in favor of total counts for
the 2000 census, and not statistical sampling. The debate surrounding
this highly politicized issue did not clearly explain the discrepancies
that exist in each group with regard to the undercount.
16
After Native
Americans on reservations, who had an undercount rate of 12.2 percent,
Hispanics had the highest undercount of all racial-ethnic groups, or 5.0
percent in the 1990 decennial census. African Americans followed with
4.4 percent, and non-Hispanic whites had an undercount rate of less
than 1 percent (or 0.7%) (U.S. Bureau of the Census 1997:4). Moreover,
about 4 million people, “most of them affluent whites living in suburbs
that tend to vote Republican” were counted twice (Holmes 1999:24; and
see app. A for a discussion of the undercount issue).
But despite the undercount, the growth of the Hispanic population
has been dramatic. Hispanic youths already outnumber black youths
(Vobejda 1998:A2). Indeed, the U.S. Census projects that the Hispanic
population will surpass the African American population by 2005, and
it is expected to be about a quarter of the total U.S. population by 2050
(Day 1996:63,13; Larmer 1999). However, if immigration and birthrates
continue to climb, some of these changes may occur much sooner than
that.
Notwithstanding the lack of support by this substantial and grow-
ing group, the proposal to make Hispanics into a separate race persisted
L AT I N O S I N T H E U. S . R AC E S T RU C T U R E
15

and became one of the primary propositions that the Office of Manage-
ment and Budget examined in its extensive review between 1995 and
1997. The proposal was eventually dropped, however, when it became
evident that making Hispanics into a separate race would result in
fewer being counted—and in fewer whites being counted (U.S. Bureau
of the Census 1996a, 1997).
MULTIRACIAL AMERICANS AND LATINOS
The insistence on self-definition—particularly within one’s own lin-
guistic and philosophical framework—is central to the challenges to
racial construction in the United States today. The insistence on identity
in one’s own terms is a major nexus between the issues raised by the
multiracial movement and those raised by Latinos. Both groups seek, or
have, definitions of self and their group that are often outside the bira-
cial structure created in the United States. Furthermore, those who are
“white” are dominant and thus determine who is “nonwhite” or
“other.” Many Latinos, and many in the multiracial movement, are
challenging these rigid categorizations, along with the implied racial
hierarchy.
Hispanics and those in the multiracial movement are often seen
and defined as distinct groups, yet there are interesting overlaps. “Mul-
tiracial” Americans and those who go by the terms interracial, mixed
race, and biracial are defined as “persons who identify with more than
one race group” (Bennett, McKenney, and Harrison 1995:1). (Race
group refers only to white, Asian or Pacific Islander, black, or Native
American groups.) The census defines as “Hispanics” those who clas-
sify themselves as being of Hispanic or Spanish origin on the census,
adding, “Hispanics may be of any race.” (The census defines origin as
the ancestry, nationality group, lineage, or country of birth of a person
or his or her parents or ancestors before their arrival in the United States
[U.S. Bureau of the Census 1993b:B-12].)
Yet many Hispanics claim a multiple “racial” ancestry. Indeed, in
recent census tests, more Hispanics chose the “multiracial” category
(6.7%) than did non-Hispanics (less than 1%), and about one-third of all
those in the multiracial category were Hispanic (U.S. Bureau of the Cen-
sus 1996a:13 and table 12). In addition, because many Latinos see race
as a cultural construct, some consider themselves Latinos and “multira-
16
L AT I N O S I N T H E U. S . R AC E S T RU C T U R E

cial” because one parent is white, black, Asian, or Pacific Islander and
the other is Hispanic or because each parent has a different Hispanic na-
tional origin.
HISTORICAL CONSTRUCTS
An analysis of U.S. decennial census classifications shows the clear his-
torical progression toward a more definitive bipolar structure. Al-
though the taxonomy of race has changed, we can see in historical and
legislative documents the evolution of two fundamental and socially
constructed polarities that place “whites” at one end and “other social
races” at the other. Although each of these polarities has been and con-
tinues to be fluid, this basic dichotomous structure has prevailed
throughout most of the census’s two-hundred-year history. It is with
this historically evolved bipolar structure that groups who have not
been “quite white” or “quite black” have contended in the past, and it
is in this structure that Latinos and other groups are entangled today.
Although this bipolar structure has been overarching, providing the
basic racial structure of the various “racial” groups, there is and proba-
bly always has been a great deal of heterogeneity within the two polar-
ities. Moreover, the boundaries between these polarities have always
been ambiguous and shifting. Finally, alterations of group and individ-
ual classifications have been both unofficial and legal and bureaucratic.
For some people throughout U.S. history, the labels applied by the
census and the identities created or used by the individuals and groups
themselves have always differed. Furthermore, these externally created
labels and identities have changed, so, for example, the Mohawks of the
Hotinonshonni Confederacy refer to themselves—and recognize that
they are also referred to—as “Iroquois,” “Native American,” or simply
“Indian.”
IMMIGRANTS AND THE RACIALIZATION PROCESS
In the past, new immigrants immediately underwent a racialization
process, which conveyed an implicit hierarchy of color and power. The
two elements of this racialization process were (1) the acceptance of and
participation in discrimination against people of color (Bell 1992; Du
L AT I N O S I N T H E U. S . R AC E S T RU C T U R E
17

Bois 1962:700 ff; Morrison 1993) and (2) negotiations regarding the
group’s placement in the U.S. racial-ethnic queue (Jacobson 1998; Ro-
dríguez 1974; Smith 1997; Takaki 1994). Immigrants undergoing this
racialization process discriminated implicitly or explicitly against oth-
ers because of their color and status. Indeed, some immigrants realized
that one way to become “white,” or more acceptable to whites, was to
discriminate against others seen as “nonwhite” (Ignatiev 1995; Kim
1999; Loewen 1971). Kim (1999) reviewed the historical experience of
Asian Americans being triangulated with blacks and whites through a
simultaneous process of valorization and ostracism. This racial trian-
gulation continued to reinforce white racial power and insulate it from
minority encroachment or challenge.
Some immigrants discriminated against blacks and/or other de-
preciated minorities by not living with “them,” not hiring “them” in
enclave economies, or articulating prejudices against “them.” Institu-
tionalized discrimination and normative behavior aided racialization
so that, for example, it became difficult to rent or sell to members of
certain groups because of exclusionary practices. Nearly all immi-
grant groups experienced this seldom-mentioned but indisputable
dimension of the Americanization process. Critical to the racializa-
tion process was the belief that there was always some “other” group
to which one was superior. Indeed, this process has been an effective
means of protecting the status quo because it made it difficult to un-
derstand and pursue areas of common interest and resulted in di-
vide-and-conquer outcomes.
Imputed and Self-Defined Race for Latinos
Latinos—and many other groups—come to the United States with
different views of race and with their own racial hierarchies. The rela-
tion of these people’s racialization to their hierarchies in the United
States has not been widely studied. But it is clear that when they arrive,
they too become part of a racialization process in which they are differ-
entiated according to the official perception of their race, which may or
may not be the same as their own perception. This racial reclassification
immerses immigrants in a social education process in which they first
learn—and then may ignore, resist, or accept—the state-defined cate-
gories and the popular conventions concerning race (particularly one’s
own) (Rodríguez 1994a).
18
L AT I N O S I N T H E U. S . R AC E S T RU C T U R E

The racialization process also includes contradictory views of the
way that Hispanics are generally regarded. At one extreme, Hispanics
are a Spanish-speaking white ethnic group who are simply the most
recent in the continuum of immigrant groups and are expected to fol-
low the traditional path of assimilation. Another view holds that the
term Hispanic—which has generally been unknown to new immi-
grants from Latin America—is subtly “colored” by negative and
racial associations. For example, the stereotyped image (for both His-
panics and non-Hispanics) of a Hispanic is “tan.” Within this per-
spective, Hispanics are often referred to as “light skinned,” not as
white. Yet many Hispanics would be seen as white, black, or Asian if
it were not known that they were Hispanic. But seeing Hispanics/
Latinos as “light” clearly restricts their “whiteness” and thus makes
them nonwhite by default, but not a member of other race groups.
Thus, many Hispanics entering this country become generically
“nonwhite” to themselves, or to others, regardless of their actual phe-
notype or ancestry.
The United States’ racialization process affects all groups’ sense of
who they are and how they are seen, in regard to color and race. There
are few studies of this concerning Latinos, but some autobiographies
suggest that the racialization process has had a significant impact (see,
e.g., Rivera 1983; Rodriguez 1992; Santiago 1995; Thomas 1967).
Whether this has been a dissonant impact and has affected Latinos’ mo-
bility and the quality of life has not yet been determined.
Some Latinos, influenced by movements such as the Black Power
movement, Afrocentrism, Pan-Africanism and African diaspora phi-
losophies, and the celebration of negritude, have come to see them-
selves, and sometimes their group, as black. Terms like Afro-Latino, black
Cuban, and black Panamanian are now common, and some Latinos cele-
brate their African roots. Others focus on their Amerindian or indige-
nous component, while still others see themselves only as white or
mixed or identify themselves only ethnically.
A Dominican student of mine told me that each of her and her
husband’s children claimed a different identity. So they had one black
child, one white child, and one Dominican child. Each of the children
had different friends and tastes. Many variables contribute to and in-
teract with the racialization process to determine how individuals de-
cide on their group affiliation. Generation, phenotype, previous and
current class position, and the size and accessibility of one’s cultural
L AT I N O S I N T H E U. S . R AC E S T RU C T U R E
19

or national-origin group, as well as the relative size of other groups,
all affect how individual Latinos identify themselves.
DISCRIMINATION
Most Latinos believe that they are discriminated against as a group. In
one of the largest and most comprehensive surveys of Latinos, 80 per-
cent of Mexicans, 74 percent of Puerto Ricans, and 47 percent of Cubans
reported “a lot” or “some” discrimination against their own group, a
general perception that appeared to be unrelated to skin color (de la
Garza et al. 1992:94–95). Falcon (1995), for example, found that Puerto
Ricans’ phenotype was not related to their perception of group dis-
crimination.
Thus, although darker or more visible Latinos may experience
more direct discrimination, looking white or light does not substan-
tially alter their perception of discrimination. Indeed, it may sometimes
have the opposite effect. That is, lighter Latinos may more often be in a
position to observe discrimination. They may be assumed to be white
and consequently be better able to see how others are treated or that
they are treated differently from those who are darker. Moreover, all
Latinos, regardless of color, may experience discrimination, for His-
panicity is based on more than skin color. Other clues, such as accent,
residence, surname, or first name, can reveal that a person is Hispanic.
Thus, despite an individual’s physical appearance as “white,” knowl-
edge of this person’s Hispanicity often causes a readjustment of status.
The perception shifts from “I thought you were one of us” to “You’re an
other”—and even an accent is heard where it was not before. This type
of redefinition or reclassification may be imposed more often on lighter
Latinos and may make them just as conscious of discrimination as
darker Latinos are. Therefore, even though “color” or phenotype is sig-
nificant in an individual Latino’s experience, all physical types can and
do experience discrimination.
17
Considerable evidence shows that the discrimination Latinos per-
ceive is very real, for example, disparities in judicial treatment (Díaz-
Cotto 1996:416–417; Haney López 1996:138–139, 252–253) and evidence
of housing discrimination (Denton and Massey 1989; James, McCom-
ings, and Tynan 1984; Massey and Denton 1990; Yinger 1995). In New
York City, black and Hispanic immigrants—particularly those from the
20
L AT I N O S I N T H E U. S . R AC E S T RU C T U R E

Dominican Republic—continue to live in the least desirable housing,
pay among the highest percentages of income for rent, and have the
lowest rates of home ownership compared with European, Russian,
and Asian immigrants (Hevesi 1998; Schill, Friedman, and Rosenbaum
1998). Moreover, because of where they live, Hispanics and blacks in
New York City—whether they are foreign born or native born—have
less access to medical care, higher crime rates, and greater concentra-
tions of poverty and housing-code violations (Rosenbaum et al. 1999).
Individuals who are clearly identified as “Hispanic” by their
names, résumés, accents, and, sometimes, stereotypical looks experi-
ence greater job discrimination than do equally qualified whites (Ben-
dick 1992; Cross et al. 1990; Fix, Galsten, and Stryk 1993). Also, Hispan-
ics experienced greater employment discrimination as a result of the
1986 Immigration Reform and Control Act (Bendick 1992; U.S. General
Accounting Office 1990). With the passage of legislation sanctioning
employers for hiring undocumented workers, many Hispanics who are
citizens or legal residents were not hired for jobs for which they were
qualified because employers thought they might have been in the
United States illegally. Given these findings, it is not surprising that a
review of judicial cases involving employment discrimination based on
national origin found that most of the litigation pertained to Hispanics
(del Valle 1993).
Studies of employer preferences in hiring also suggest that dis-
crimination against Hispanics is widespread in the labor market
(Holzer 1997; Hossfeld 1994; Moss and Tilly 2000). In these studies, the
employers interviewed had definite beliefs and preferences concerning
the suitability of different groups for different jobs, including “negative
attitudes” toward “workers of color” (Moss and Tilly 2000). According
to Darity and Mason (1998:81), employers “set up a racial/ethnic gen-
der ranking of potential hires” that favored white men and women
workers over Hispanics and blacks. These studies underscore the dis-
advantages that race/color (and ethnic) markers can bring to employ-
ment and hiring practices (Darity and Mason 1998:81).
The literature on the effect of labor market discrimination on earn-
ings and occupational attainments has yielded a complex array of find-
ings that reflect not just differing theoretical perspectives but also vari-
ations in sampling and methodology (Meléndez and Rodríguez 1992;
Meléndez, Rodríguez, and Barry Figueroa 1991:293).
18
More recently,
the focus of labor market research has moved beyond measuring the
L AT I N O S I N T H E U. S . R AC E S T RU C T U R E
21

extent of in-market discrimination to the effect of premarket factors
(e.g., human capital characteristics like educational attainment) and
preemployment skills (e.g., punctuality). These researchers argue that
Hispanics receive less compensation or are less often hired because they
do not have the same preemployment skills as others and because pre-
market factors keep them out of the competition. But they gloss over the
role of discrimination in premarket factors. For example, where one
lives (or can live) influences early educational options and social, polit-
ical, and personal networks. These, in turn, affect subsequent educa-
tional opportunities, which influence scores on tests, which influence
educational options and outcomes.
In addition, although the lack of preemployment skills is often
mentioned as a reason for Hispanics’ lower incomes, there has been lit-
tle systematic or scientific research on whether Hispanics as a whole
have fewer preemployment skills. This explanation is reminiscent of
earlier images of African Americans as lazy and shiftless when in fact
more were working in the fields and other arduous occupations than
others were.
19
Similarly, Hispanics who often have poorly paid jobs
without benefits, security, or full-time employment (Boisjoly and Dun-
can 1994) and are overly represented in “jobs others won’t do” are seen
to lack preemployment skills. Yet in order to hold jobs, such as taking
care of other people’s children, lawns, homes, meals, and apartment
buildings and working in the food and textile industries, they must ar-
rive on time and operate quickly and efficiently.
From a more journalistic and contrastive perspective, Skerry (1990)
contends that since Hispanics are not a race, they cannot be subject to
racial discrimination in employment. Nonetheless, we have seen that
although some Hispanics identify themselves as a cultural or ethnic
group, others may see them as a “Spanish” race or as nonwhite.
Whether ascribed race or self-reported race is more determinant of how
Hispanics are treated in the United States has not yet been resolved or
studied systematically.
20
Some research, however, indicates that Hispanics who report they
are black or are seen as black are more segregated and less successful in
gaining access to predominantly Anglo residential areas than are their
white Hispanic counterparts (Denton and Massey 1989; Massey 1988;
Massey and Denton 1993:113 ff; Rosenbaum 1996). In addition, Latinos
who classify themselves as white or are identified as white (or light) fare
22
L AT I N O S I N T H E U. S . R AC E S T RU C T U R E

better with regard to earnings, hourly wages, and other socioeconomic
variables than do other Latinos (Arce, Murguía, and Frisbie 1987;
Gómez n.d.; Katzman 1968; Relethford et al. 1983; Rodriguez 1990,
1991a; Telles and Murguía 1990). Moreover, “black Hispanics suffer
close to ten times the proportionate income loss due to differential treat-
ment of given characteristics than white Hispanics” (Darity and Mason
1998:72).
The results of these studies suggest a need to continue collecting
“race” data on Hispanics, for they indicate a possible economic rent,
color credit, or tax paid, depending on perceived or imputed race. (The
differences found within Latino groups, however, are less pronounced
than those between white Latinos and non-Hispanic whites.) These find-
ings parallel those found in the African American community, in which
those with a lighter skin color had higher socioeconomic outcomes and
those with a darker skin color were moderately associated with being
working class and having a low income or little education (Hughes and
Hertel 1990; Keith and Hering 1991; Krieger, Sidney, and Coakley 1998).
Interestingly, as in the case of Falcon’s 1995 study of Puerto Ricans’ phe-
notype, color shade did not seem to be related to self-reported experi-
ences of racial discrimination (Krieger, Sidney, and Coakley 1998).
AN UNEQUAL PLAYING FIELD
Whether or not the result of discrimination, the demographic picture of
Hispanics suggests that disparities exist in regard to standard socioeco-
nomic indicators. For example, in 1996, more Hispanics were living in
poverty than whites and even blacks. Hispanic men were more likely
than white men to be employed, but they had higher unemployment
rates. Despite the high numbers of Hispanics in the labor force, their in-
come continued to be two-thirds that of whites, with family income
slightly below the black average. Among married-couple families in
which at least one person was working, Hispanics had the highest
poverty rates and the lowest income levels, compared with both white
and black families. Hispanics also paid a higher proportion of their in-
come for housing than did either whites or blacks (National Council of
La Raza 1997). Hispanics were less adequately covered by health insur-
ance, having lower health insurance rates and pension benefits than did
L AT I N O S I N T H E U. S . R AC E S T RU C T U R E
23

either whites or blacks (del Pinal and Singer 1997:36–37; National
Council of La Raza 1997; Santos and Seitz 2000).
Finally, while high school completion rates have improved for
whites and blacks, for the last thirty years, more Hispanics have con-
tinued to drop out of school. In 1994, this figure was 2.5 times the rate
for blacks and 3.5 times the rate for whites. One in five Hispanics aged
sixteen to twenty-four has left school (Secada 1998:5). Both U.S.-born
and foreign-born Latinos continue to lag with regard to education
(Chapa and Wacker 2000). And these results are not simply a transitory
reflection of the increased number of unskilled Hispanic immigrants.
Whereas other studies have concentrated on past and continuing struc-
tural, institutional, and discriminatory barriers that many Latino
groups face (De Freitas 1991:4–5; 53–94; Morales 2000; Morales and
Bonilla 1993; Rodríguez 1989:85–105; Torres 1995; Torres and Rodríguez
1991), at least two studies have concluded that the negative standing of
Latinos relative to that of other groups cannot be attributed to immi-
gration (Grenier and Cattan 2000; Valenzuela 1991).
The economic boom at the end of the twentieth century has had a
modest trickle-down effect. As compared with the past, Latinos today
have a higher rate of home ownership, college completion, and earn-
ings for college graduates, particularly for young Latinas (National
Council of La Raza 1997; Reimers 2000). In addition, different pictures
emerge when we examine diverse Hispanic groups by region, genera-
tion, and the like. For example, Cubans in Florida and Puerto Ricans in
Texas typically live at a higher socioeconomic level than do Hispanics
as a whole (García 1996; Pedraza-Bailey 1985; Portes and Bach 1985;
Rivera-Batiz and Santiago 1997; Rodríguez 1991a:27, 46). Nevertheless,
the broad indicators suggest that Hispanics’ general socioeconomic sit-
uation is not favorable. Moreover, the perception and evidence point to-
ward discrimination. In other words, the playing field is not level,
which further complicates issues of race.
The Reality of Race
This book emphasizes the social constructedness of race and how
Latino experiences in the United States illustrate race as a social con-
struction.
21
We should not, however, lose sight of the continuing signif-
icance of race. The research still shows that race and ethnicity influence
24
L AT I N O S I N T H E U. S . R AC E S T RU C T U R E

where and how people live, work, shop, and play and how they are
treated in everyday social interactions and in institutions. Race is dif-
ferent, and it also feels different (Edley 1996). Racial/ethnic categories
in the United States are still socially meaningful indicators of racial sub-
ordination, privilege, and denomination (Bhopal and Donaldson 1999:
784; Krieger, Williams, and Zierler 1999:782).
22
My own life experiences have demonstrated the social constructed-
ness of race, and this book shows that “race” is not fixed, is imperfectly
measured, is at variance with scientific principles, is often conflated
with the concept of “ethnicity,” and is under increasing scientific criti-
cism and popular interrogation. Nonetheless, race is still real; it still ex-
ists.
23
We may question its necessity, the right of anyone to establish
such markers, and its validity as a scientific concept. We may see it as
unjust and want to change it. But we must acknowledge its significance
in our lives. It can be deconstructed, but it cannot be dismissed.
Race as a Changing Concept
The concept of race is changing in the United States and Latin
America and around the world. Increasingly, we find both exclusionist
and inclusive definitions of racial and ethnic identities that go beyond
nation-state boundaries, for example, in organizations such as the
Aryan Nation and its international cousins, organizations for indige-
nous peoples worldwide, the various movements and organizations of
African and African-descended peoples, and various diasporas. In our
increasingly global world, all these definitions and movements help
change race. Hanchard, speaking specifically about African-descended
populations in the United States, argues that restrictions on their “citi-
zenship and movement in the United States” have led “black political
actors” to mobilize politically and transnationally (1999:1). Adding to
the increased identification as African-descended populations are the
affirming and reclaiming of ancestral identities that have always ex-
isted and were featured during the black power, American Indian, Chi-
cano, Puerto Rican, and Asian American movements of the 1960s and
1970s. Similar restrictions and affirmation can be found among mem-
bers of other populations when they travel throughout the world, and
they also lead to greater and broader identification with ancestral
groups. Opposing trends can be found as well, toward more restrictive
L AT I N O S I N T H E U. S . R AC E S T RU C T U R E
25

ethnic identifications and rivalries, such as in the ethnic cleansing in
eastern Europe and Rwanda. Whether these trends will result in a more
homogenous concept of race, built on U.S. race constructs, or in a
greater variety of racial constructs remains to be seen. But even though
the outcome may not yet be clear, it is clear that race is changing.
26
L AT I N O S I N T H E U. S . R AC E S T RU C T U R E

2
The Idea of Race
T H E R E S U LT S O F
recent censuses, as well as the personal experiences
of Latinos and non-Latinos, raise the question of what race is in the
United States. Latinos’ wide range of physical types, their history, and
their more “social” or cultural views of race have historically chal-
lenged U.S. racial constructions, and the government has had difficulty
categorizing them. As the next chapters will show, Latinos are not alone
in this regard, as other groups have had similar histories and present
similar challenges. But it has been the increase in the two i’s, immigra-
tion and intermarriage, that has made questions of racial classification
more salient and has led to the question of just what race is.
In this chapter, we begin exploring these questions by examining
“the many faces of race,” its multidimensional nature. We then turn to
race as it has been commonly understood in the United States or, as U.S.
courts have termed it, race “in the common understanding” (Haney
López 1996:85, 91, 107). This understanding sees race as a “self-evident
‘fact’ requiring no protracted thought” (Hannaford 1996:3) and as ex-
isting in the same way in all places and times. We challenge this idea,
however, when we examine (1) studies of “race” in the past, (2) how
other governments count their populations, (3) the literature on
“mixed” race, (4) changing U.S. census classifications, and (5) standard
reference sources of racial definitions over time. Evident in these exam-
inations are the fluidity and variability of race over time and place and
its overlap with ethnicity, which is dependent on context.
THE MANY FACES OF RACE
Race has many dimensions and so is often used and defined in different
ways. For example, race can be as defined by official bodies, such as the
census or state governments. This is state-defined race. Race also is the
27

perception or experience of laypersons. This is often referred to as pop-
ular race, folk race, or race “in the common understanding” (Jensen 1988;
Wright 1994:50). Although state-defined race is often thought of as re-
flecting popular race, they often influence each other. For instance, law
constructs race, and states can define, restrict, or privilege races through
legislation (Haney López 1996:19). Race is also studied by scholars who
examine racial ideologies or ideas in public pronouncements, policies,
or literary works. This is referred to as ideological race (e.g., Graham
1990; Horsman 1981; Stanton 1960).
In both academia and more popular circles, we find the “whatever
you think it is” concept of race, which is often a shifting combination of
all of the above and frequently translates into the “you know one when
you see one” idea. Some people think of race as “identity” and “how
you see yourself.” Others consider race to be determined more by “how
others see you.” These two views sometimes conflict, hence, golf champ
Tiger Woods’s dilemma in which his view of himself as being of mixed
race conflicts with the view that many have of him as “black.”
1
In real-
ity, racial definitions are often both external (what others think) and in-
ternal (what the subject thinks). This external-internal axis is also de-
scribed as “imputed versus self-defined race” or “objective versus sub-
jective” definitions of race. Each of these different internal/external
usages is strongly affected by cultural and class considerations. But
these nuances or different definitions of race are generally not ac-
knowledged in people’s everyday conversations.
RACE IN THE UNITED STATES
In the United States, race as defined “in the common understanding”
has usually been simple and straightforward. On the simplest, least re-
flective, and most practical plane of interaction in the United States,
race is often thought of as one’s biological ancestry, manifested most
clearly in skin color. Within this one-dimensional conception, color
terms are frequently used to designate different “races.” Thus, there are
ostensibly four color groups, roughly corresponding to geographic re-
gions: black (Africa), white (Europe), red (North America), and yellow
(Asia). In this color palette, what makes a person “white” is the absence
of any “black” or nonwhite blood, and what makes a person “black” is
the presence of “black” blood. White is white because it is not mixed
28
T H E I D E A O F R AC E

with any other color; it is “pure.” “Black” blood, however, is “potent”
or “polluting,” in that it takes only a small amount of “black blood” (an-
cestry) to make someone “black.” This concept is referred to in aca-
demic circles as hypodescent, or “the one-drop rule.” (Davis 1992; Root
1992b; Williamson 1984; Wright 1994).
2
Despite these different color terms, in all four cases, the white cate-
gory is the norm or referent, and the other three groups are nonwhite.
We can understand the significance and power inherent in this con-
struction of groups if we imagine a similar classification schema that
uses another defining category. In this case, we would have reds and
nonreds or yellows and nonyellows. In broad and blunt terms, this is
the way in which “race” has been simply understood in the United
States; this has been its social construction.
These four race-color groups have had and continue to have corre-
sponding categories on census forms, one of which individuals must
choose, and not more than one.
3
The fact that the four categories have
been presented as mutually exclusive conveys the impression that each
of the groups is a “pure” race (Lee 1993). Although this has been the im-
pression, the reality was and is quite different. Appendix B contains a
closer review of contemporary critiques of “race” as constructed in the
United States. In short, it has been challenged on the grounds that it is
illogical and inaccurate; based on unscientific assumptions; more deter-
mined by contextual, political, economic, and social factors than gener-
ally acknowledged; and generally dismissed by scholars in the field
(see, e.g., Begley 1995:67; Gregory and Sanjek 1994:6–7; Gutin 1994:73;
Marks 1994, 1995; Rosin 1994; Sanjek 1994; Shreeve 1994:60; Washburn
1963; Wills 1994:81).
More journalistic treatments have also found fault with this concept
(see, e.g., the following extensive treatments: Barringer 1993; Discover
November 1994; Lemonick and Dorfman 1999; Morrison 1993; Mother
Jones October 1997; Newsweek February 13, 1995; Rosin 1994; The Sciences
March/April 1997; Weissman 1990; Wood 1994; Wright 1994). The fact
that this issue has appeared in the popular press indicates that it has
gone well beyond modest academic contemplation. In addition to, or
along with, this academic and journalistic examination has been an of-
ficial, high-level, and massive reconsideration of racial-ethnic cate-
gories for the 2000 census, resulting in the decision to eliminate the Cen-
sus Bureau’s “choose-only-one-category” standard that has contributed
to the myth of pure races.
T H E I D E A O F R AC E
29

Given the U.S. racial classification system’s reliance on color, we
should look at the critiques of the race concept’s emphasis on color and
color differences among population groups. Population groups do vary
by skin color. Thus, groups like the Scandinavians, who have lived for
long periods in areas with little sun, have less melanin in their skin on
average than do Africans who have lived for a long time close to the
equator. Melanin is the chemical substance responsible for color in the
skin. It protects humans from the sun’s ultraviolet rays, so in areas of
the world where these rays are stronger, people’s skin contains greater
amounts of melanin. Likewise, in areas where there are fewer ultravio-
let rays, skin pigmentation is lighter.
4
Consequently, skin color is an
adaptive—evolved—characteristic, but it is independent of other ge-
netic characteristics. That is, color can be inherited independently of
hair texture or color.
Geneticists examining the role of melanin have determined that it is
most likely not related to differences affecting intelligence, personality,
or ability (Wills 1994). Therefore, color—ostensibly the principal marker
distinguishing groups or “races” in the United States—must act in con-
cert with other variables to determine differences among groups, for by
itself it does not seem to play a major role. Indeed, if the presence or ab-
sence of melanin were related to variables such as intelligence, we
would expect that within population groups, tanning ability would re-
flect greater or lesser intelligence. But if you think for a moment about
beach-tanning profiles, you will quickly dismiss this hypothesis!
RACE IN THE PAST
Until recently, race in the United States was generally seen to be a
universal given—uncomplicated, unchangeable, and unavoidable.
Indeed, U.S. sociology textbooks often describe race as an “ascribed”
characteristic, in contrast to “achieved” characteristics such as educa-
tion and income.
Some scholars contend, however, that what we understand as
“race” today is what we used to understand as “ethnicity” (Bernal 1987;
Dunn and Dobzhansky 1952:107–108; Sanjek 1994; Shreeve 1994:60;
Snowden 1983; Thompson 1989). Other studies argue that race as we
understand it in the United States today is a modern invention with no
equivalent in pre-Columbian history (Bernal 1987; Hannaford 1996;
30
T H E I D E A O F R AC E

Snowden 1983; Thompson 1989). Hence, referring to “blacks” in ancient
history is incorrect, because people then identified themselves and were
identified primarily by religion, language, culture, and other variables,
and not by color.
Some writers maintain that ancient societies did not harbor the
color prejudice of modern times (Hannaford 1996; Harris 1977; Jalloh
and Maizlish 1996:9; Snowden 1983; Thompson 1989). In fact, Snowden
believes that “this is the view of most scholars who have examined the
evidence” (1983:63). In essence, the ancients made ethnocentric judg-
ments about societies; subscribed to narcissistic canons of physical
beauty; considered themselves civilized and others, barbarians; but did
not regard black skin color as a sign of inferiority. The Greeks and Ro-
mans did not establish color as an obstacle to integration into society,
and color was not the basis for judging a person.
In regard to immigrants, Snowden argues that black émigrés were
not excluded from the opportunities available to others of alien extrac-
tion, nor were they handicapped in fundamental social relations.
Rather, they were “physically and culturally assimilated: in science,
philosophy, and religion,” and “color was not the basis of a widely ac-
cepted theory concerning the inferiority of blacks” (1983:108). Egyp-
tians, for example, saw their land as the only one that really mattered
and considered outsiders to lack some elements of humanity. But “once
a foreigner came to live in Egypt, learned the language and adopted
Egyptian dress, he or she was accepted as one of ‘the people’” (Snow-
den 1983:89).
5
Thompson, focusing specifically on the Roman Empire, supports
Snowden’s view concerning the relative absence of color prejudice
(1989:10 ff). Thompson asserts that “a black in possession of symbols of
high status received appropriate deference from those of lower (gen-
uine or apparent) status irrespective of colour and ethnic identity or ori-
gins.” This was the case “even if he happened to be passing through a
district whose population lacked current familiarity with the sight of
black faces.” The treatment he received depended above all “on the per-
sonal status and deference-position of each of the parties in the en-
counter, and there was considerable variety in the statuses and (positive
and negative) deference positions of blacks.” There were, however, few
blacks above the rank of plebeian (Thompson 1989:158–159).
6
Thompson also agrees with Snowden that what “race” is today was
not what it was in the past and so it would be wrong to apply today’s
T H E I D E A O F R AC E
31

assumptions to past relations (1989:10 ff).
7
“Of course the notion of a
collective mind precisely and exclusively linked at any given point in
time with a particular skin colour (let alone the idea of an eternally fixed
‘white’ or ‘black’ or ‘yellow’ mentality) is an utter absurdity” (Thomp-
son 1989:8). He points out that “differences in cultural habits, and in
quality and scale of material goods” were as important in determining
social distance as is “somatic distance” or “what is today popularly
called ‘race.’” In our world, Thompson maintains, terms like European,
whites, and blacks symbolize a particular cultural situation and power
relationship. These symbolic assumptions were not relevant to the an-
cient Romans, however, who saw the majority of the world’s white in-
habitants as “savages” and “benighted barbarians.” Therefore, to the
Romans, “white people” was not a meaningful sociocultural category
(Thompson 1989:10 ff).
8
In their review of much of the classical literature, Harris (1977),
Hannaford (1996), and Bernal (1987) agree that the idea of race as we
know it today is not evident in these early works. Kinship, nationality,
and cultural or religious identity had meaning then, but “skin colour in
itself” had “no more meaning than height or weight” (Thompson
1989:8). Referring to later interpreters of these works—who, Hannaford
(1996) and Bernal (1987) argue, did racialize early classical writings—
Thompson says: “It is the mind of the observer that, drawing on past ex-
perience, renders pigmentation and other physical traits a repository of
messages about personal beliefs, cultural habits, and social status, and
makes these traits a focus of passionate sentiments transcending the
merely aesthetic” (1989:8).
Intermarriage was not prohibited and was common (Thompson
1989:40, 44, 95).
9
In addition, the hypodescent rule did not exist. Rather,
“in the Roman perceptual context the progeny (and even less so the
more distant descendants) of an Aethiops did not necessarily fall into
the category of Aethiops: some were perceived as ‘swarthy,’ some
as ‘white,’ and some as Aethiops, the classification in all cases depend-
ing entirely on the individual’s physical appearance” (Thompson
1989:158).
Snowden (1983) studied African blacks in northeast Africa and the
Sudan and the Kushites in southern Egypt during ancient times. He ex-
amined meetings of blacks and whites, images, inscriptions, and litera-
ture and concluded that their views were largely the result of first im-
pressions and a long history of contact and relations between the an-
32
T H E I D E A O F R AC E

cients and long-established African nations. Blacks had first been en-
countered as military men (often as part of conquering armies).
Aethiops (Africans) were seen as civilization’s pioneers, astrologists,
and writers and also were known to have had long-term territorial in-
tegrity, material resources, and trade. “There was clear-cut respect
among Mediterranean peoples for Ethiopians and their way of life.
And, above all, the ancients did not stereotype all blacks as primitives
defective in religion and culture” (Snowden 1983:59).
10
This contrasts
with Americans’ first view of blacks—as slaves. Furthermore, in antiq-
uity, slavery was independent of race or class, and most slaves were
white. As Snowden (1983) put it, the ancients enslaved all conquered
people, whereas the moderns, only the colored races.
UNRESOLVED ISSUES
Embedded in these views of race in the past are a number of unresolved
issues. One is relative size. Snowden (1983) examined—but took issue
with—the postulate that the relatively small size of the black popula-
tion at that time helped minimize the hostility toward them. He argues
that the exact ratio of blacks to whites is not known because the ancients
did not consider color sufficiently significant to mention it. Neverthe-
less, Snowden feels that blacks were more numerous than previously
thought. The emphasis on counting “pure” Negroes, he argues, is mis-
leading and tends to underestimate the number of blacks, just as such
an approach in the United States now would tend to underestimate the
number of blacks. He also notes that blacks are often depicted in pottery
and artwork, suggesting that they were more numerous. But icono-
graphical evidence of blacks has been neglected.
Another issue is selectivity. Harris maintains that we have really
two streams of information from the classical writers: one favorable to
the people of Africa and one not favorable and that the unfavorable
characterization has “had the greatest influence on the image and treat-
ment of blacks in our own times” (1977:xx). Did the authors just cited
ignore the unfavorable literature? Were the classic views of peoples far-
ther south in Africa more negative (in comparison with the views of
peoples closer to the Mediterranean)?
Although the issue of whether darker-skinned groups were re-
garded less or more favorably than today has not been resolved, there
T H E I D E A O F R AC E
33

is general agreement that the ancients referred to as Aethiopes
(Africans) had a highly developed civilization and that Africans and
other Europeans had substantial and influential contacts before the de-
velopment of Greek civilization (see, e.g., Harris 1977: 61–62, 67–147, 89;
also see pp. 5–15 for a discussion of the derivation and meanings of the
term Aethiopes).
Another issue is that many of these sources refer only indirectly to
blacks or Aethiops, even though they have been the focus of the re-
search on blacks in antiquity. In no texts do the blacks speak for them-
selves. In addition, references to blacks are often made by those with, at
best, second-hand information or by travelers. Therefore, one wonders
how reliable these analyses are for interpreting color and race attitudes.
Finally, there is the problem of accuracy concerning sources like works
of fiction, scriptures, and pagan texts written from the perspective of
the elite, who were remote from blacks (conversation with Prof. Lucius
Outlaw at Haverford College).
These issues are countered by the argument that the reason there
are no texts in which blacks speak for themselves is that those peoples
referred to as black today did not see themselves as such then, nor were
they seen as such by others. Moreover, the application of this modern-
day, racialized lens to the past is problematic. An example is the Egyp-
tians, who are sometimes referred to as African and therefore must be
“black.” Yet Bernal (1987) asserts that because the Egyptians were geo-
graphically positioned at an important trading point, their population
contained many different physical types. This assertion leads to two
questions: One is whether darker-skinned Egyptians held or evinced a
different identity but did not write about it. The second is whether
Egyptians at that time saw themselves as a “black” or “nonwhite”
group distinct from other groups. These issues continue to be debated
today.
11
THE SHIFT TO A RACIALIZED PARADIGM
Regardless of how much the same or different race was in the past from
what it is today, a number of scholars agree that the way in which race
was conceptualized underwent a major shift, although not all agree on
exactly how and when this shift began. Most believe that it was in place
by the time that routes through Asia and the New World had begun to
34
T H E I D E A O F R AC E

be explored (see, e.g., Bernal 1987; Hannaford 1996; Johansen 1982:84;
Sanjek 1994; Shreeve 1994; Snowden 1983; Thompson 1989).
12
Bernal
(1987) sees this as a shift from the ancient model to the Aryan model and
argues that this shift was reinforced between 1785 and 1850 by the as-
cendant paradigms of progress, romanticism, and scientific racism.
Also aiding this shift were the French Revolution and the consolidation
of northern expansion into other continents (Bernal 1987:22 ff).
According to Thompson, this shift encompassed not merely “the
justification of the historically peculiar configuration of ‘white’ mas-
ter/conqueror set against ‘coloured’ slave/subject” but also a rewriting
of history that diminished and denigrated the role and contributions of
Africans and Asians to civilization—to say nothing of those of Native
Americans (1989:10–11). Also obscured in this process were the earlier
relations between blacks and Europeans and the earlier conceptions of
race. Thompson estimated that the shift occurred in the eighteenth cen-
tury when Europeans (at home and in their colonies) began to attach
greater significance to somatic distance than to religious and other cul-
tural differences between themselves and other peoples.
13
Thompson
(1989) contends that in earlier times, non-Europeans were seen as “es-
sentially” different but that they always believed that people of all eth-
nic categories could move from one socioeconomic category to another.
Snowden contends that arguments for the “naturalness” and aboli-
tion of slavery were mustered only in the New World (1983:70 ff). Be-
fore this, a color association with slaves did not exist, since slaves were
of many colors, although most were European and North African
(Forbes 1988:101). According to Thompson, the European outlook
changed when people became highly conscious of the distance between
culture and technological and material power that came to separate the
white from the nonwhite parts of the world. This was reinforced by the
institution of all-black slavery and by European imperialism on other
continents. This power distribution determined the world and caste
into which people were born.
Sanjek pointed out that by the 1700s, efforts were made to “fit” ex-
ploited peoples into “natural” schemes that would rationalize their op-
pressed position and included the devaluation of peoples of color
(1994:1–17, esp. 5). A number of works have traced the emergence of
these “scientific” racial classification efforts in western Europe and the
United States during this period (see, e.g., Banton 1983; Barzun 1965;
Bieder 1986; Freedman 1984; Gossett 1963; Gould 1981; Jordan 1968;
T H E I D E A O F R AC E
35

Sanjek 1994:5; Stanton 1960; Thomas 1989:29–31). Other works have cri-
tiqued and disproved the results of these earlier “scientific” studies
(Gould 1978, 1981; see Sanjek 1994:5 for a review of this literature).
Mixture and “Pigmentocracies”
Despite the racist paradigm that developed after the fifteenth cen-
tury, people throughout the world began to interbreed, resulting in
“varying social constructions” of racial identity in the United States, the
Caribbean, Latin America, South Africa, and elsewhere (Sanjek 1994:4).
These various constructions of racial identity were affected by the pre-
dominant ideological racial paradigm of the times. Racial rankings
were understood and communicated through these paradigms and im-
plemented through legal frameworks that specified racially determined
limits to social interaction (Sanjek 1994). Later chapters analyze these
social formations more closely. In short, although also affected by the
same shift and therefore fundamentally racialist, the development of
“race” in Latin America remained closer to earlier conceptions of
race/ethnicity.
Governments Count “Peoples” around the World
When we examine how other countries count their populations, we
find that not all ask about “race” or “color”—indeed, only a minority
does. Even ethnicity has not been found to be a universal population
characteristic; nor is there general agreement on what constitutes eth-
nicity.
14
Tamayo Lott (1997; 1992) notes that a dominant theme of a
major international census conference was that ethnicity is constructed
differently in each country—that for some race was a dimension of eth-
nicity, while for others ethnicity was a dimension of race. For non-
whites, race was more important than ethnicity because it represented
their unequal power relations with Whites.
Bates et al. (1995:433–35) reviewed a nonrandom sample of recent
censuses in 45 countries. They found that tribe, nationality, linguistic
group or dialect, district or country of birth, religion or sect, ethnic
group, citizenship, indigenous or aboriginal origin, race, and skin color
were among the criteria used (alone or in combination) to count popu-
lations in these countries. In half of the countries, questions about race
36
T H E I D E A O F R AC E

and ethnicity were not asked. They also found that direct inquiries
specifically about “race or color” were “rare” and were concentrated in
countries in or near the Caribbean region (Bates et al., 1995:434). Al-
though this was not a representative sample, it does indicate that many
governments do not ask about race/ethnicity, and that different cul-
tural, political, ethnic, and religious criteria are used to measure and
distinguish populations.
The data collected by the UN (United Nations 1992) also reveal a
great deal of fluidity and variability with regard to how different na-
tion-states classify “race” groups in their countries. Different variables
are used as bases for group classification, e.g., ethnic nationality, race,
color, language, religion, customs of dress or eating, tribe, or various
combinations of these factors (United Nations 1980:79; 1985). Indeed, it
is difficult to make international comparisons because the data gath-
ered are dependent on national circumstances (which are highly vari-
able) (United Nations 1980; 1985). Many countries collect data on mi-
nority groups for reasons that are quite similar to those of the United
States, i.e., because they are concerned with the equal participation of
all groups and the equitable distribution of benefits to all groups
(United Nations 1989:30–31).
Finally, a survey of the censuses of 51 countries in the Americas
over the last 40 years (Almey, Pryor, and White 1992) examined how
race and ethnicity questions were asked and found that 31% (16) of
the countries they surveyed did not include race/ethnicity questions
on their national censuses, while 68.6% (35) did. The authors also
found that many people did not want to, or were unable to, respond
to ethnic background questions. The authors concluded that these re-
sults question the assumption often made that everyone has an eth-
nicity. Moreover, they found that there was “no consensus on what
criteria determines ethnicity” (Almey, Pryor, and White 1992:3).
Those countries that did distinguish drew from a variety of factors in
different combinations to determine ethnicity, e.g., language, country
of birth, residence, color, race, and religion. In addition, the study
maintained that census questions on ethnicity elicited multiple re-
sponses and that these responses changed over time.
15
In all three
Americas, there was a striking fluidity and variability of race and eth-
nicity between countries and over time.
Even in countries that share ostensibly similar “racial,” “cultural,”
T H E I D E A O F R AC E
37

or political identities, different approaches are sometimes taken. For
example, English-speaking countries with common historical and po-
litical ties, e.g., Australia, Canada, and Britain, ask very different ques-
tions on their censuses. Britain, for example, has various categories of
Blacks (Caribbean and African) and Asian Indians (Bangladeshi, In-
dian) (Sillitoe and White 1992; White and Pearce 1993). Australia does
not ask about race, but has an open-ended question that asks about an-
cestry and a question that asks about aboriginal descent (Cornish 1992).
These countries have also changed their questions and categories over
time. The fluctuations inherent in the classification process can also be
seen in the experience of other countries, which have altered their crite-
ria to accommodate new populations and/or to be in accord with new
political regimes, e.g., Russia and Malaysia. (Statistics Canada and U.S.
Bureau of the Census 1993)
Canada provides an interesting example of change and continuity.
For example, it still collects data on their indigenous population and
on the Métis, people who are the result of indigenous and European
mixing. It has also included an ethnic origin question in all but its 1891
census. It recently reintroduced a race question after not having had
one in its census for decades. On its 1996 census, it referred to races as
“population groups” and further clarified that its term “the visible mi-
nority population” referred to those who were “non-Caucasian in race
or non-white in colour.” Finally, they added that the term population
group should not be confused with citizenship or nationality. Their
race/population group question included the following detailed cate-
gories, with allowance to specify more than one: White, Chinese,
South Asian (e.g., East Indian, Pakistani, Punjabi, Sri Lankan), Black
(e.g., African, Haitian, Jamaican, Somali), Arab/West Asian (e.g., Ar-
menian, Egyptian, Iranian, Lebanese, Moroccan), Filipino, South East
Asian (e.g., Cambodian, Indonesian, Laotian, Vietnamese), Latin
American, Japanese, Korean, Other—Specify_____. (1996 Canadian
census form and instructions.)
The results of these surveys suggest considerable change from
country to country. Consequently, “persons migrating from one coun-
try to another are likely to encounter an official schema for classifying
origin, race, or ethnicity, which is quite foreign to them.” (Bates et al
1995:435) Indeed, Duany’s 1997 study comparing Dominicans that mi-
grated to Puerto Rico with those that migrated to New York City pres-
ents evidence for this.
38
T H E I D E A O F R AC E

THE SHIFTING LITERATURE ON MIXTURE IN THE
UNITED STATES
The literature on mixture in the United States also is changing. In par-
ticular, the extent to which the mixture of races has been acknowledged
has changed, and the way in which it is discussed is different as well.
Unfortunately, in the United States in the past, “mixture” tended to be
either ignored or demeaned (Root 1992a, 1995). Early studies of com-
munities of mixed groups tended to portray them as unfortunate or
“pathetic folk of mixed ancestry who never know quite where they be-
long . . . neither fish nor fowl” (Berry 1963:vii). The term used to refer to
communities in which two or more “races” had mixed was triracial iso-
lates, a term that conveyed the marginality of such groups. These com-
munities, which were referred to by names such as Melungeons, Brass
Ankles, Croatan, or Red Bones, were described as existing in geo-
graphic isolation, having marginal status, and occurring in particular
geographic situations, for example, in “forbidding swamps or inacces-
sible and barren mountain country.” There was general agreement in
this literature that the members of these communities were reluctant to
be identified as black and that they had relatively high growth rates
(Berry 1963:32; Thornton 1987:210 ff).
On the level of the individual, the most prevalent image was that of
the tragic mulatto, the result of a slave woman raped by her master
(Orbe and Strother 1996). Although later research has begun to explore
instances of white women and black men who had children together
(Hodes 1997), until recently the literature generally conceived of mul-
tirace persons as marginal, with “neither/nor status, cultural malad-
justment, limited social assimilation, incomplete biological amalgama-
tion, and pathological personalities” that were often the outcome of
labyrinthine relationships between marginality and colonialism
(Williams 1992:281). Mixed-race persons were thus viewed and treated
as by-products of exploitative sexual unions between colonialists and
members of indigenous or colonized groups (Williams 1992:281).
16
Ear-
lier studies of intermarriage in the United States also found a higher
proportion of foreign whites and marginal whites in mixed marriages
(Williamson 1984:112). But particularly during the country’s early for-
mation, there must have been consensual unions in which women of
color exercised some power or that involved white women and men of
other races.
T H E I D E A O F R AC E
39

In recent years, a new paradigm has developed in which the earlier
literature is challenged and new perspectives are emphasized (Root
1992b, 1995). For example, triracial isolates have been relabeled as plu-
ralists, runaways, and refuseniks (Daniel 1992). Daniel maintains that “de-
spite their patent Eurocentrism, these strategies . . . may be legitimately
viewed as diverse tactics of resistance to oppression utilized by indi-
viduals of African descent. While some individuals may seek to con-
front oppression head-on, passers and pluralists seek to turn oppres-
sion on its head by subverting the racial divide” (1992:70). He further
argues that other ways of subverting the racial divide have included
“passing,” blue vein (i.e., when the skin color is light enough to reveal
blue veins) societies, and the development of elite creole groups. In
addition, the recent literature stresses “the complex realities” of mul-
tiracial people, the “multiple sensibilities” that come from their having
both insider and outsider perspectives, and their highly developed ca-
pabilities to adapt “to various environments, different cultural settings,
and paradoxical situations” (Williams 1992:283).
The new literature has also examined areas formerly neglected, sig-
naling a new perspective on mixture. For example, scholars have stud-
ied settings in which intermarriage is common, for example, Hawaii
(Grant and Ogawa 1993; Labov and Jacobs 1986); the significance of
color differences in the African American community (Russell, Wilson,
and Hall 1992); the merging of diverse racial-ethnic groups under pan-
ethnic categories (Lopez and Espiritu 1993); children of mixed parent-
age (Cauce et al. 1992; Field 1996; Jacobs 1992; Johnson, R. 1992; Root
1992c; Taylor-Gibbs and Hines 1992; Tizard and Phoenix 1993); philo-
sophical dimensions of mixture (Zack 1995); critiques (Jacobs 1992;
Johnson, D. 1992; Miller 1992; Nakashim 1992; Root 1992a; Valverde
1992); explorations of the applicability of conventional psychological
theories to mixed-race families (Stephan 1992); and the fluidity and
shifting contexts of racial constructions (Gregory and Sanjek 1994).
Contributing to the changing paradigm reflected in this literature is
the increase in the numbers and types of individuals in interracial fam-
ilies. In the past, it was lower-class whites who intermarried, but today,
it is upper-class whites (Spickard 1989) and higher-status blacks
(Kalmijn 1993) who are intermarrying.
17
In addition, in the past, mixed-
race children were born to black women and white men, whereas today,
most are born to white women and black men (Williamson 1984:112).
Recently Kalmijn (1993), analyzing 1970–1980 marriage license data in
40
T H E I D E A O F R AC E

thirty-three states, found that the incidence of intermarriage has risen
since the 1960s, especially between high-status black males and lower-
status white females. Kalmijn’s research (1993) reinforces the link ear-
lier found between status and race in intermarriage (Davis 1941; Heer
1966; Merton 1941; van den Berghe 1960). In other words, those minori-
ties with a higher socioeconomic status marry members of the majority
with a lower socioeconomic status, thereby exchanging one person’s
“racial caste prestige” for the other’s socioeconomic prestige (Kalmijn
1993:122–123). Spickard (1989:349) noted that leftist intellectuals, col-
lege professors, artists, entertainers, and people with elite international
careers are those most likely to intermarry. Rolark, Bennett, and Harri-
son’s analysis (1994) of multiracial responses on the 1990 census found
that the number of interracial marriages rose from 0.4 percent in 1960 to
2.2 percent in 1991. Two-thirds of these marriages were between black
males and white females.
18
CHANGING CLASSIFICATIONS IN THE UNITED STATES
In the United States, racial classifications have also been more variable
and fluid than generally acknowledged. Definitions of race vary by
state and sometimes are regionally based, often changing over time and
in response to political and legal events (Bell 1973; Davis 1992;
Domínguez 1986; Haney López 1996; Schafer 1993; Williamson 1984).
Davis offered an early example of these changes: in Virginia, the defini-
tion of who was “white” became more and more restrictive in order to
limit intermarriage. That is, in the 1800s, a “white” person was anyone
who was less than one-quarter Negro; these people could marry other
whites. By 1924, however, legislators prohibited anyone with “a single
drop of Negro blood” from marrying a white person (Cose 1995:70).
Although there is little awareness in everyday speech of the lack of
uniformity or cohesion that has existed or exists in state-defined race in
the United States, racial criteria are not as clear-cut or unchanging as
many believe. The U.S. government and, more specifically, the Census
Bureau, which is responsible for counting people by race, do not have a
single criterion or principle to determine different races. Rather, they
currently use several, for example, national origin, tribal affiliation and
membership, and physical characteristics (McKenney and Bennett
1994:16). Moreover, these criteria are not applied in the same way to all
T H E I D E A O F R AC E
41

groups (Hahn 1992). For instance, whereas tribal affiliation is critical to
identifying Native Americans, it is not used at all to identify whites or
blacks.
In addition, the format and terminology that the U.S. census has
used in the question on race have changed over time (Lee 1993). In some
censuses, groups have been assigned racial categories. For example,
mulattoes were a racial category in the 1850, 1860, 1870, 1890, 1910, and
1920 censuses. “Mexicans” were a “race” in 1930 but not before or after
then. Finally, before 1980, “race” was generally determined and/or re-
ported by the census interviewer. Since 1980, however, people have
chosen their own race from a list of categories. Moreover, the way that
people see themselves and the way that the census takers or others
record their race are not always the same.
Although the public has adhered to a rather rigid belief in race as a
biological fact, some census officials have come to believe that “race” is
more social than biological. Accordingly, as early as the 1950 census,
“race” was explained as follows:
The concept of race, as it has been used by the Bureau of the Census, is
derived from that which is commonly accepted by the general public.
It does not, therefore, reflect clear-cut definitions of biological stock,
and several categories obviously refer to nationalities. . . . Although it
lacks scientific precision, it is doubtful whether efforts toward a more sci-
entifically acceptable definition would be appreciably productive,
given the conditions under which census enumerations are carried
out. (U.S. Bureau of the Census 1953:35, italics added)
Here, the census is acknowledging that “race” is a social construction
and not a scientific criterion, as the courts had earlier concluded. In ad-
dition, the census now admitted the significance of geographic “con-
text” or “social setting” in making racial determinations and conceded
that it was difficult to classify individuals by race without sufficient
numbers of their group in the area where they were being interviewed.
19
THE CONFLATION OF RACE AND ETHNICITY
More recently, the U.S. census has become aware of the overlap of race
and ethnicity, as reflected in a recent census report noting that this issue
42
T H E I D E A O F R AC E

should be examined further for the 2000 census (McKenney and Bennett
1994:23–24). This is a significant departure from the census’s past posi-
tion, treating “race and ethnicity as two separate concepts” (McKenney
and Bennett 1994:16; U.S. House Committee 1994f). The idea that “race”
and “ethnicity” overlap is not new, but demographic changes (e.g., in-
creasing numbers of Latinos, Asians, and mixed-race individuals) and
greater “ethnic” self-identification have brought this idea to the fore-
front. In particular, it is the experience of Latinos in the United States
that most clearly illustrates the interrelatedness of “race” and ethnicity.
Even dictionary definitions of race reveal the overlap between race
and ethnicity. Moreover, according to Webster’s Collegiate Dictionary, this
overlap has existed for some time. In all the editions between 1898 and
1994, most definitions of “ethnic” refer to races, and some definitions of
“race” sound like ethnic definitions (Rodríguez and López-Hernández
1995). These definitions also have shifted over time, from a singular and
narrow biological definition of race to the inclusion of more cultural
and social definitions (see table 2.1).
For example, in the first edition (1898), race is biologically defined
as meaning “the descendants of a common ancestor; lineage; breed;
stock” (Rodríguez and López-Hernández, 1995; Webster’s Collegiate Dic-
tionary 1898:660). In 1936, “the race of doctors” is used as one example
of “race” (Webster’s Collegiate Dictionary 1936). In 1973, “the English” is
cited as an instance of “race” used as “a class or kind of people unified
by community of interests, habits or characteristics.” This example is re-
peated in the 1983 edition and appears most recently in the 1994 edition
(Webster’s Collegiate Dictionary 1973:950; 1983:969; 1994:961). In sum,
some definitions of “race” begin to sound like definitions of “ethnicity”
or culturally distinguishable classes.
At present, primary definitions of race still refer to “a breeding stock
of animal,” and secondary definitions refer to “a class or kind of indi-
viduals with common characteristics, interests or habits . . . or a kind of
people unified by community of interests, habits, or characteristics.” In
essence, the biologically based definition of “race” as a “breeding stock”
has been retained, but additional definitions have been added to in-
clude other, more cultural or social definitions. The inclusion of these
broader, somewhat overlapping definitions of race and ethnicity in a
commonly used dictionary is somewhat surprising, particularly be-
cause ethnicity in the United States (and in the U.S. census) has gener-
ally been considered separate from race.
T H E I D E A O F R AC E
43

RACE AS RACE OR AS ETHNICITY
Today, most scholars agree that “race” is determined by context, just as
ethnicity is.
20
Indeed, some scholars believe that race and ethnic group
are the same. Spickard (1992:23), for example, argues that race and eth-
nic group are the same, because both are defined on the basis of social,
not biological, criteria. Both race and ethnic group claim descent from a
common set of ancestors, have a common sense of identity, share the
same culture from clothing to music to food to language to child-rear-
ing practices, build similar institutions like churches and fraternal or-
ganizations, and pursue common political and economic interests.
Other scholars, though, insist that race or legal minority status is
quite different from ethnicity (Cox 1948:317–320; 392–401; Mullings
44
T H E I D E A O F R AC E
Table 2.1
Dictionary Definitions of “Race” and “Ethnic,” 1898–1994
Year of new
edition
Race
Ethnic
1898, 1st ed.
The descendants of a common
1. Belonging to races or nations;
ancestor; lineage; breed; stock.
based on distinctions of race;
ethnological.
a
1910, 2d ed.
No change.
No change.
1916, 3d ed.
The descendants of the same
1. Heathen; pagan. 2. Pertaining
ancestor; a family, tribe, people,
or peculiar to race; pertaining to
or nation taken as of the same
groups of mankind discrimi-
stock; a lineage; breed; also, a
nated by common customs and
class of individuals with common
character.
b
characteristics, interests, or the like.
1931, 4th ed.
No change.
No change.
1936
The descendants of a common
1. Neither Jewish nor Christian;
ancestor; a family, tribe, people, or
pagan. 2. Of, pertaining to, or
nation, believed to belong to the
designating races or groups of
same stock; a lineage; a breed; also
races discriminated on the basis of
a class or kind of individuals with
common traits, customs, etc.
common characteristics, habits, or
the like.
1949, 5th ed.
No change.
No change.
1963, 6th ed.
1. A breeding stock of animal.
1. Neither Jewish nor Christian;
2a. A family, tribe, people, or
heathen. 2. Of or relating to races
nation belonging to the same stock.
or large groups of people classed
b. A class or kind of individuals
according to common traits and
with common characteristics,
customs.
interests, or habits.

1978; Ogbu 1978; Sanjek 1994:8 ff; Steinberg 1981). They do not accept
that ethnicity can be substituted for race because the concept of ethnic-
ity does not convey or imply the context of discrimination associated
with race in the United States. Also, ethnicity is a term that historically
has been used to refer mainly to people of European origin and not
those of African origin. Conversely, those who maintain that race is a
social fabrication of little scientific or practical value contend that racial
categories only reinforce our beliefs in this falsehood and that ethnicity
should be used only, for example, to classify people (Patterson 1997).
T H E I D E A O F R AC E
45
Table 2.1 (continued)
Year of new
edition
Race
Ethnic
1973, 7th ed.
1. A breeding stock of animal.
1. Neither Jewish nor Christian;
2a. A family, tribe, people, or
heathen. 2. Of or relating to races
nation belonging to the same stock.
or large groups of people classed
b. A class or kind of individuals
according to common traits and
with common characteristics,
customs. Minorities. 3. A member
interests, or habits. 2b. A class or
of an ethnic group; esp. a member
kind of people unified by
of a minority group who retains
community of interests, habits, or
the customs, language, or social
characteristics. The English.
views of his group.
1983, 8th ed.
No change.
1. Ethnic: a member of an ethnic
group; esp. a member of a minority
group who retains the customs,
language, or social views of his
group. 2. Ethnic: 1. Heathen. 2a. Of
or relating to large groups of
people classed according to com-
mon racial, national, tribal, reli-
gious, linguistic, or cultural origin
or background. b. Being a member
of an ethnic group. c. Of, relating
to, or characteristic of ethnics.
1993, 9th ed.
No change.
1. Heathen. 2a. Of or relating to
large groups of people classed
according to common racial,
national, tribal, religious, linguis-
tic, or cultural origin or back-
ground. b. Being a member of an
ethnic group. c. Of, relating to, or
characteristic of ethnics.
a
The definition given is for ethnical. The word ethnic does not appear until the 1936 edition.
b
The word ethnical is no longer listed.
Source: Webster’s Collegiate Dictionary (Springfield, MA: Merriam-Webster, 1898, 1910, 1916, 1931, 1936,
1959, 1963, 1973, 1990, 1994).

This conflation of and/or confusion between race and ethnicity has
been at the root of some of the positions taken throughout the United
States’ history. For example, in the debate between Takaki (1994) and
Schlesinger (1992), the issue was presented as follows: In the history of
the United States, were diverse ethnic (meaning race and ethnic) groups
assimilated into one melting pot? Or is it a segmented, racialized his-
tory comprising an official, articulated white history and a neglected, as
yet largely unwritten, history (or histories) of not-white groups—with
two melting pots?
At present, the issue of whether race and ethnicity are independent
or overlap (and to what degree) has still not been resolved. Lee (1993)
noted in her review of census categories over time that historically, race
and ethnicity have been confused. Indeed, race and ethnicity are often
discussed as if they were separate, somewhat independent concepts,
which seems still to be the census’s official position. Hispanics, for ex-
ample, are regarded as members of an ethnic group that can be of any
race. But the recent proposal to make Hispanics a race suggests pressure
to view Hispanics as a race and thereby to fold them into the United
States’ racial structure. The common juxtaposition of Hispanics with
groups such as whites, blacks, and Asian and Pacific Islanders rein-
forces this intention.
46
T H E I D E A O F R AC E

3
Stories of Self-Definition
T H E R E A S O N T H AT
both Latinos and non-Latinos choose particular
categories on the census has only recently received much research at-
tention (see, e.g., Elias-Olivares and Farr 1991; Kissam, Herrera, and
Nakamoto 1993; Martin, DeMaio, and Campanelli 1990; McKay and de
la Puente 1995; Rodríguez and Cordero-Guzmán 1992; Tucker et al.
1996:22–28). Even if we assume that Latinos who pick the traditional
U.S. race categories do so for the same reasons that non-Latinos do, this
still does not explain those who do not identify with “any of the above.”
The following case studies look at why some people choose the
“other race” category and how they decide on their particular “identi-
ties.” Although the case studies are not meant to be representative, they
are not unusual. These personal accounts are from a sample of sixty
Latinos living mainly in the Northeast (see Rodríguez et al. 1991 for a
more detailed discussion of this research project). The respondents
were selected by snowball sampling, and the researchers chose a spread
of class levels and national origins. This method ensured finding a di-
verse group of Latinos willing to be interviewed at length on an issue
that is, for many, sensitive. As might be expected, given the northeast
slant of the sample, 61 percent consisted of Latinos of Caribbean origin,
mainly from the Dominican Republic (33%) and Puerto Rico (28%). Five
percent were “mixed,” that is, had parents from different Spanish-
speaking countries, and 1 percent had one non-Latino parent. The re-
maining 34 percent came from Central and South America. Of the
thirty-six women and twenty-four men, 8 percent described their back-
grounds as upper or middle class, 45 percent as working class, and 15
percent as lower class. The remaining 32 percent did not indicate their
class background. One-quarter of the sample was raised in Spanish-
speaking countries, but only 15 percent of the interviews were con-
ducted in Spanish. All but two of the fifteen trained interviewers were
bilingual and generally were members of the groups they interviewed.
1
47

Most of the pre- and posttest interviews took place between 1989 and
1990, but a few were conducted later. The respondents were not paid
and were interviewed in a variety of home, school, and office settings,
where privacy, adequate time, and relaxed comfort had been arranged
before the interview.
The research team and I created an extensive, detailed, bilingual
questionnaire and tested it for a year and a half. It contained 107 open-
ended and structured questions and covered a wide variety of areas.
The interviewers were instructed to determine the respondent’s pheno-
type—as white, black, or “other”—before beginning the interview. The
respondents were asked first to fill out a duplicate of the 1980 census
question on race, and then they were asked to explain why they had an-
swered the question as they did. The next questions were (in order of
appearance): How would you describe yourself racially? What do you
consider yourself to be: white, black, or other? What color are you:
white, black, or other? How do you think North Americans see you:
white, black, or other? How would you describe yourself over the tele-
phone to a person who has never met you but who has arranged to meet
you in a crowded place? How would you classify, in terms of color and
features, the other people in your family on this (five-point) scale? Do
you think your identity has changed over time?
The case studies presented here are of persons (not using their real
names) who identified themselves as “other race.” During the inter-
view, the first four described here appeared to be at ease with their
“racial” identities. All four checked the “other race” category on the
census question and supplied a Latino referent. All four viewed their
“race” in different terms: three according to their Latino heritage and
one according to his Latino and black heritage. Based on their pheno-
types, the first was categorized as “white,” the second and third as
“black,” and the fourth as “in-between.” In fact, this fourth person ex-
plained that depending on the eye of the beholder, he can be white,
mixed, black, or “Hispanic.”
JOSÉ PETERSON OR JP: THE HYPHENATED AMERICAN
This respondent was named José Peterson because this composite name
has both Anglo and Hispanic elements. We chose the nickname JP, with
its business-tycoon connotation, because at the time of the interview, he
48
S TO R I E S O F S E L F - D E F I N I T I O N

perceived himself to be (and was understood to be) assimilating into
white corporate America. He is single, twenty-five, and a college grad-
uate working as an administrator in the arts. JP’s parents migrated from
Puerto Rico to New York when they were in their early twenties and set-
tled in a section of the city with a high incidence of violent crime. JP
lived here for the first eight years of his life until his parents moved to
a more stable working-class area where he continues to live. His family
speaks both Spanish and English at home, but JP says his Spanish is not
good. JP indicated that his background was working class because his
father did manual labor. He is the fourth child in a family of five siblings
and the first to go to college.
On the census race question, JP checked “other” and specified
“Puerto Rican American.” He explained that he attributed his Puerto
Rican heritage to his parents but that he identified as American because
he was born in the United States. He added that he was bicultural be-
cause “various aspects of both the American and Puerto Rican cultures”
influenced him.
But when asked questions that he interpreted as referring to his
physical appearance, JP answered consistently and unequivocally that
he was “white.” For example, when asked how he would racially iden-
tify himself—as white, black, or other—he answered white because of
his European (Spanish) background. He also referred to being “white”
when asked about his color, how North Americans viewed him, and
how he would describe himself over the phone. He classified everyone
in his family as white except for two grandmothers who, he explained,
had “Indian blood.” Finally, JP was classified by the Puerto Rican inter-
viewer as “white.”
When he understood the questions to be asking about his physical
appearance, JP consistently answered that he was white. But he did not
feel it necessary to explain why he did not then select the white race cat-
egory. When he understood the questions to be asking about his cul-
tural identity, however, he said he was a “hyphenated American.” In ef-
fect, when JP answered the census question on race, he assumed that
the categories represented other major social-cultural-racial-political
groups in the United States, and he supplied his own (hyphenated)
group. Although he clearly saw himself as physically white, he identi-
fied himself as “other (Puerto Rican–American) race.”
Even though JP identified as “other race,” his adaptation to the U.S.
racial system followed the familiar immigrant assimilation model. He
S TO R I E S O F S E L F - D E F I N I T I O N
49

answered the questions in much the same way that second-generation
European Americans usually answered them. For example, Greek
Americans or Italian Americans would see themselves as culturally the
product of both the old country and the United States, as JP did. But ear-
lier immigrants probably would not have mentioned that their grand-
mother had Indian blood.
CELIA: LATINA, BLACK, AND PROUD . . . AND NOT
AFRICAN AMERICAN
Celia was named after the salsa singer Celia Cruz because of the many
similarities she appeared to share with her. Celia identified herself as
“other race,” and on the census question, she wrote in “black Hispanic
Panamanian.” Celia came to the United States from Panama when she
was eighteen years old. She has four children, all over the age of seven-
teen, and has been married to her husband for more than twenty-five
years. She rose through the ranks to become an account coordinator at
the same place where she has worked for more than twenty years. Celia
lived through the racial insensitivity of the 1950s, the racial awakening
of the 1960s, and the renewed racial hatreds of the 1980s. Yet she says
that throughout the constant racial turbulence, she always knew “who
she was.” She emphasized that she is both Hispanic and black and has
strong roots in both identities. Celia often mentioned her love of His-
panic culture and her pride in being born and raised as a Panamanian.
Her feelings about the “black” portion of her self-identification are
equally strong, and on the family chart, she labeled all the members of
her family as black. Her tone was unwavering on this point; her iden-
tity has never changed.
Celia realized that most North Americans saw her to be like “any
other black” but noted that she felt uneasy with American-born blacks.
She sensed that they strongly disliked blacks from other countries. To il-
lustrate, Celia described an experience she had had at a playground
with two of her children when they were young. She said that when she
began talking and a black American woman there heard her accent, the
woman verbally abused her, and so Celia left the playground. Celia is a
black Hispanic Panamanian and proud of it. But she is not a black
American, and she does not see herself as black according to U.S. defi-
50
S TO R I E S O F S E L F - D E F I N I T I O N

nitions of blackness. So she did not check off the “black” category on the
census question.
FAT JOE (LATINO)
Fat Joe (Latino) was given this name because of his two passions, his
love for his Puerto Rican culture and his love of rap music—he had been
both a disk jockey and a rap artist. Born and raised in the suburbs of
Washington, D.C., Fat Joe was twenty-seven, recently married to an
African American model, temporarily working as a cab driver in At-
lanta, and about to complete a master’s degree in the social sciences
when he was interviewed in New York City. Both his parents had im-
migrated to Washington in the 1960s from Puerto Rico, where both had
been teachers. His father had been recruited to work in a government
agency. Fat Joe described his family and upbringing as middle class and
recalled his growing up as being filled with “good memories” and as
having friends that he had kept despite moving from one suburban
neighborhood to another. Few Puerto Ricans lived in these neighbor-
hoods; rather, they were made up mostly of other Latinos, blacks, and
whites. The main language he spoke at home was Spanish, but he and
his wife speak English. Over the years, he has frequently visited Puerto
Rico, but he has never lived there. At the time of this interview, Fat Joe
was intending to obtain a more advanced graduate degree.
He chose the “other race” category on the census question and
wrote in “black Puerto Rican.” When asked why he had answered in
this way, he first said that was how he always answered this question
(about racial classification). But he then added that if it had been an of-
ficial census question, he would have answered “black.” Or if the list in-
cluded “Puerto Rican,” he would have marked that. He would not have
checked “Hispanic” because that category was too vague and general
for him. His responses illustrate the significance of context to Latinos re-
sponding to questions of race.
Fat Joe’s first response also indicates his strong identity as both
black and Latino, which was repeated in subsequent questions. When
asked how he would describe himself racially, he answered, “As a
Puerto Rican of African descent.” When asked how he thought North
Americans saw him, he said that everybody saw him as a black
S TO R I E S O F S E L F - D E F I N I T I O N
51

American until they talked to him and found out about his back-
ground. Presented with three categories, white, black, and other, he
chose “black” but added that he was of a “brown” color. To him,
“black” meant that it racially described his body as being of African
descent. He said he identified as black because his ancestors were
brought over from West Africa to the Caribbean. When asked how he
would describe himself to someone over the phone, he replied,
“Black, 5’10”, 220 pounds, bald head and beard.” Only when asked
the general nonracialized question of how he identified himself did
he say, “By my name.”
Fat Joe described all the members of his family, including himself,
as “black” except for a maternal grandmother, whom he said was
“white.” He also indicated that they all would see themselves as
“black.” When asked what he felt his roots were, he answered, “Puerto
Rican, I guess.” He considered himself to have been “raised as a Puerto
Rican” but also stated that African Americans, white Americans, and
their culture had “rubbed off me as well.” He said he could “relate” in
a lot of ways, except when it came to food. The people in the southern
United States could not understand why he could not relate to collard
greens—because he had been raised with arroz and abichuelas (rice and
beans) and pasteles.
Asked to recall experiences outside his family in which people re-
acted to his race, Fat Joe said there were hundreds. For example, as a
senior in high school, he was at the beach when a bunch of white guys
sped by screaming “nigger.” Contrary to the experience of many Lati-
nos, Fat Joe (Latino) is consistently assumed to be black and seldom
anything else. Thus, only in specific contexts is he thought to be Latino.
As he said, only if he is in a Latino store and reading something in Span-
ish will someone speak to him in Spanish. People are always sur-
prised—and doubtful—when he tells them he is Puerto Rican, for he is
generally assumed to be any other kind of Caribbean but Puerto Rican.
Although this used to bother him, he says that now that he has studied
the history of these areas, he understands why people react this way,
that there are “phenotypically more African-looking people in the Do-
minican Republic and Cuba than in Puerto Rico.”
Fat Joe indicated that he has probably assumed a black identity on
occasion, noting that “if an African American refers to me as a ‘brother,’
I acknowledge the background.” However, he has known others who
52
S TO R I E S O F S E L F - D E F I N I T I O N

were darker than he who would have taken offense at the reference. His
assumption of this identity did not have an emotional impact on him—
it was “just what I am.”
Fat Joe’s identity has changed over time. He has no specific mem-
ory of when he first became aware of his color or of his being Puerto
Rican, but he assumes that he must have become aware of color when
he first started to play with other children, when he was three or four,
and of his Puerto Rican ethnicity when he brought friends home. He de-
scribed the two neighborhoods where he had been raised as having few
Puerto Ricans, but he also noted that his family’s circle of friends in-
cluded many Puerto Ricans. He admitted that he had changed the way
he viewed his color, facial features, and hair texture, explaining that
when he was younger, he was sensitive about his more African pheno-
type, even though his hair was less kinky than that of his friends. Col-
orism and “joking” about “too kinky” hair seemed to be part of grow-
ing up among his friends. In fact, he joked that now he would love to
have kinky hair—any kind of hair.
Fat Joe reached an important turning point in the formation of his
identity when he started applying to college. His parents sat him down
and told him that he should take advantage of the fact he was pheno-
typically black and Puerto Rican. So he added his mother’s last name, a
Spanish surname. He attended a large public university and believes
that he was counted as Hispanic and not as black, partly because he was
the only one of his friends who received handouts on Hispanics. But in
high school and college, he did not spend much time on Puerto Rican
culture; rather, he “delved into the black side of me.” He studied black
literature and participated in African American activities. Midway
through college, he decided to major in African American studies and
began to pay more attention to his Latino side. Then, when he had to
pick a topic for his senior thesis, he chose a connection to his Puerto
Rican culture. This focus in African American studies was distinctive,
and he thought it would be helpful.
Fat Joe (Latino) seems to have had a variety of experiences, and
when he was interviewed, he seemed comfortable with his identity as a
black Latino and interested in celebrating, and knowing more about,
both these heritages. His feelings were echoed by the Costa Rican–born
Delina D. Pryce, who pointed out, “Being Latina and black are not mu-
tually exclusive, but mutually complementary. Being black and Latina
S TO R I E S O F S E L F - D E F I N I T I O N
53

has influenced and shaped my views, my thoughts, my experiences—
who I am. Never would I deny either because they’re both me. And I
like me. All of me.”
MR. ARCO IRIS’S RAINBOW IDENTITIES
Mr. Arco Iris is yet another representative of the “other race” category.
His name means “rainbow” in Spanish, and he is always addressed as
“Mr.” because at sixty-two, he has a respected and established position
as a professional in the criminal justice system. Born and raised in East
Harlem and the South Bronx (predominantly black and Hispanic neigh-
borhoods), he is the son of parents who migrated from Puerto Rico to
New York before World War II. He described the household in which he
was raised as Spanish speaking and lower middle class. He considers
his roots to be in Harlem, for he has lived in Puerto Rico only a short
time. Although Mr. Arco Iris is fluent in Spanish, he is more comfortable
speaking English. His wife is West Indian, and they have three children.
In response to the census race question, Mr. Arco Iris checked
“other” and wrote “Puerto Rican” in the space next to it. But when an-
swering “How would you describe yourself racially” and “What do
you consider yourself to be,” he stated, in both instances, “I am a mix-
ture of black, white, and possibly Indian.” He noted that his racial iden-
tity had changed over time. “As a child, I perceived myself as a Puerto
Rican and distinctly apart from black and white. But as I grew, I under-
stood Puerto Rican as a mixture, and I could identify with both blacks
and whites.” The way he viewed his ancestry also has changed: “I
would have considered myself more white up to the age of nine. As I
got older, I developed a broader definition of race and acknowledged
greater mixture.”
Mr. Arco Iris described his color as “brown” and explained that
North Americans tend to see him as a “brown-skinned Puerto Rican or
a light-skinned black.” His interviewer described him as “not
white/not black.” On a five-point color scale, Mr. Arco Iris labeled his
mother as a one (light) and his father as a five (dark), and he identified
himself as a four. This was darker than the interviewer’s view of Mr.
Arco Iris, as a three (intermediate in color). When asked why he char-
acterized himself as darker than North Americans might see him, Mr.
Arco Iris stated that “four is more biologically accurate” and further ex-
54
S TO R I E S O F S E L F - D E F I N I T I O N

plained that he identified himself as dark out of respect for and loyalty
to his brown-skinned father.
Mr. Arco Iris and others like him identify strongly with color and
express a preference for racial diversity and mixture. They take pride in
themselves as combinations of African, European, and Native Ameri-
can.
2
The identification of Mr. Arco Iris’s race also varies according to
the eye of the beholder. He noted that since childhood he has been re-
garded as white, black, Greek, Arab, and Asian. These many instances
of mistaken identity have prompted him, perhaps more than many oth-
ers, to think about his identity. His racial identification mirrors this self-
reflection, representing a unique innovation and resolution within an
essentially biracial system.
These four persons, with different backgrounds, are phenotypically
white, black, and in-between. They emphasize not just physical but also
cultural variables. Furthermore, they are at ease with how they have re-
solved their identities, even though some data gatherers thought their
responses showed that they misunderstood or were confused by the
question. At this point in their lives, they seemed confident and indi-
cated that it was all right to be “other,” although they did not mention
this specifically. The following two stories reflect the more conflictual
and stressful dimensions of Latino identity resolution.
JOSÉ ALI: THE PRESSURE TO BE BLACK
The name José Ali is a combination of the common Latino name José
with Ali, borrowed from Muhammad Ali, the former heavyweight
champion. José Ali is a Dominican, twenty-four years old, single, and
a full-time student at a public university. He has a part-time job in an
advertising firm where the majority of his coworkers are white. His
parents are immigrants from the Dominican Republic. José Ali was
raised in New York and has visited the Dominican Republic only
once, when he was five. He lived in a predominantly Hispanic neigh-
borhood until he was eight years old, and Spanish was the only lan-
guage spoken at home until he was twelve. He later moved to an-
other area of New York with a large African American population. He
describes his family as working class: his father worked in the metal
goods industry, and his mother was an office worker. He does not
have a Hispanic surname.
S TO R I E S O F S E L F - D E F I N I T I O N
55

José Ali answered “other, Hispanic” to the census race question and
explained: “By inheritance I am Hispanic. However, I identify more
with blacks because to white America, if you are my color, you are a nig-
ger. I can’t change my color, and I do not wish to.” He consistently al-
luded to his identification as black when answering other racial items
in the interview, for example, “Hispanic, yet identifies as black” and “I
describe myself as black.” When asked what the word black meant to
him, he replied, “As other people see me.” Finally, when asked, “Why
do you see yourself as black?” his answer was, “Because when I was
jumped by whites, I was not called a ‘spic,’ but I was called a ‘nigger.’”
During the interview, José Ali noted that he assumes everybody at
his job believes he is black and he does not “want to burst their bubble.”
He said that he goes along with their assumption as long as he is treated
well but admitted that he accepts this identity because it would take
him too much time to explain why he is culturally not an African Amer-
ican. He pointed out that “when you are seen as a certain race, you are
also seen culturally the same.” But when people assume that he is an
African American, they are “disregarding my own feelings. They don’t
ask, they simply assume.” (The Dominican interviewer described him
as “a stereotypically dark-skinned Latino or a light-skinned Afro-
American.”)
Asked if his identity had changed over time, José Ali answered yes.
“I realized that although I feel Hispanic, I was not seen as Hispanic or
Latino, but as black. Now, I agree with whoever thinks I’m black. There
is no point in trying to prove that I’m not black . . . after being practi-
cally attacked by whites because of the way I look. I decided to accept
the fact that no matter who I feel to be, I am categorized as black.”
Thus, even though José Ali says he is “other race, Hispanic,” his
responses reveal the pressures that some Latinos feel to identify as an
American black. This conflict was first described in the literature on
the Puerto Rican migration (Colon 1982; Iglesias 1980).
3
(It was per-
haps best portrayed in Piri Thomas’s 1967 Down These Mean Streets,
and it has been discussed most recently by Brady 1988, Santiago 1995,
and Comas-Díaz 1996. For recent discussions of race and gender in
Puerto Rico, see Barbosa 1991, Ramos Rosado 1987, and Valcarcel
1994.) This imposition of the black-white racial order on Latinos sepa-
rates them into “whites” and “blacks” and in the process attempts to
create new African Americans and so-called hyphenated (European)
Americans. Latinos understand this phenomenon as their being iden-
56
S TO R I E S O F S E L F - D E F I N I T I O N

tified racially but not culturally. Other Latinos in the sample felt simi-
larly confused or pressured to be “white.” Consequently, today Lati-
nos are pressured to be categorized according to their color rather
than their national heritage and culture.
4
VICTORIA: A CELEBRATION OF COLOR
The next case illustrates the tensions inherent in assimilation through
education. In contrast to José Ali, Victoria first strongly assimilated into
“whiteness.” Then after a period of conflict and struggle, she acknowl-
edged her resentment of this assimilation and began to celebrate her
color. She was named Victoria because she seemed to have been victo-
rious in overcoming the obstacles that caused her pain and confusion.
Victoria is a single, thirty-year-old Chicana graduate student who was
born and raised in a small town on the U.S.-Mexican border. Almost all
the town’s residents are Mexican and work in the fields, although her
parents do not. Her father has a working-class occupation, and her
mother is a homemaker. Victoria has several sisters, and her family is
Protestant. She has been to Mexico only once, when she was twenty-
three, and she described this trip as consciousness raising.
During her interview, Victoria consistently placed herself in an in-
termediate position, choosing “other” on the census question and spec-
ifying “Hispanic.” She gave her color as “brown” and said that North
Americans saw her as “other,” not “white” or “black.” Even when
asked how she would describe herself over the phone to someone she
had never met (but would meet), she said she always was careful to
note her tan coloring. Even though the interviewer thought that Victo-
ria could be regarded as white with a summer tan, she consistently
identified herself as “not white”; indeed, a nonwhite color seemed to be
an important part of her racial identity. (But nonwhite was apparently
not the same to her as black.) Victoria saw herself as Hispanic because
she was not white and not black and because historically she (and her
group) had had a different relationship to those two groups.
When Victoria finished elementary school, she went to a junior high
school where she was placed on the accelerated track. Here most of her
classmates were Anglos. She describes this period as when she went
from being a “smart Chicana” to being a “smart white.” Most of her
friends were white, and her sisters would make fun of and mimic her
S TO R I E S O F S E L F - D E F I N I T I O N
57

“whiteness.” Victoria remembered that a group of mejicanos (Mexicans)
once showed their disapproval of her hanging around with whites by
calling her a Tía Taca (the equivalent of Uncle Tom). At the white parties,
Victoria said she knew that she was not a beauty because of her skin
color, so she compensated by developing a good “personality.” Her
awareness of being different (and less attractive or acceptable) because
of her skin color was so acute that when she became part of a group tra-
ditionally made up of “pretty girls,” she assumed she was included be-
cause she was “nice.” She also remembered that she always wanted to
be a cheerleader, but somehow this was not what Mexican girls did.
When Victoria went to the local community college, she continued
to excel academically and was very active in student government. She
also recalled the following experience that subsequently made her feel
very ashamed: One day the dean patted her on the shoulder and told
her, “I’m so glad you’re not like the other Mexicans,” considering this a
compliment. Asked how she felt about the remark, Victoria said that it
made her uncomfortable but remembered that she had looked up and
smiled.
Until she went to another college, in California, Victoria did not re-
alize the significance of the dean’s remark. When she did, she first re-
acted with fury at having denied her heritage and having accepted the
implication that her accomplishments were an exception to the rule. She
later also resented what she perceived as the limitations of Mexican cul-
ture. As she explained, she traveled a long road in a short time, from
being identified as white to being proud of being Mexican to being
angry at Mexican patriarchy. In essence, Victoria saw her education as a
vehicle that helped her escape certain sexual and racial boundaries, but
she also felt that while doing so, she had had experiences that damaged
her self-image, such as when she was treated as a credit to her race.
5
Clearly, family dynamics and other antecedent factors influence
how people decide on a racial identity. Victoria is an interesting ex-
ample of these dynamics. She described her family as having consid-
erable physical variation and herself as the darkest one. Accordingly,
she rated herself a four on the scale while giving everyone else in her
family an average of 2.5. Although the interviews were not calculated
to elicit deep psychological motivations, it seems that Victoria’s self-
described position as “the darkest in her family” may have influ-
enced her drive to be high achieving and her desire to be “white.” She
said during her interview that she did not remember openly saying
58
S TO R I E S O F S E L F - D E F I N I T I O N

that she wanted to be “white,” that at the time she felt she was just
following her intellectual interests. On reflection, however, she said
that she wanted to be white culturally and that her desire to be
“white” was subconscious.
Excelling in school and being accepted by whites may have added
to the low value she felt as a dark woman. Whether her educational ac-
complishment was recognized by others in her life (Latinos and non-
Latinos) is unclear, because their responses were filtered through Victo-
ria’s eyes. But she appears to have been praised by white officials and
rejected by her more “Mexican” family and community. It also is likely
that some whites resisted or resented her efforts and that some Mexi-
canos were proud of her achievements. What is perhaps most important
here is that Victoria’s drive to achieve may have stemmed from her per-
ception that she was not highly valued because she was dark. In effect,
her academic achievement was compensation. Whether it was also a cry
for greater acceptance (by whites and perhaps other Latinos) we do not
know.
Another less openly acknowledged and perhaps more positive side
effect of being the darkest in the family surfaced in Victoria’s account.
She described in detail the treatment that Blanca, her “light-skinned,
green-eyed sister,” received as la favorita (the favored one). Victoria re-
ferred to the “privileges of color” that Blanca enjoyed and how this con-
trasted with her own treatment and that of her other sisters. For exam-
ple, in the division of household chores, she and her sisters always were
given the harder, less desirable work, for example, carrying out the
trash. She also noted that even today, at family gatherings, the dark sis-
ters brought the food that took hours to prepare, and la favorita brought
the paper goods.
Victoria also noted the impact of this differential treatment on the
development of her sisters. She believed that because Blanca was so
“privileged,” that is, because she was protected and treated as fragile
and delicada (delicate), she never developed the independence and
strength that her other, darker, sisters did. In effect, Victoria’s darker sis-
ters also compensated for their skin color by developing other areas of
their personalities and lives. According to Victoria, they knew they
would always have to struggle in life, which helped them deal with ad-
versity. Blanca, however, never ventured beyond her traditional subur-
ban existence, did little that was innovative or challenging, and did not
develop the strong character of the others. According to Victoria, she
S TO R I E S O F S E L F - D E F I N I T I O N
59

was psychologically and constitutionally weaker than the others, who
were active in community and activist movements.
Victoria did not have strong negative feelings about her differential
treatment. Instead, they seemed to be a dull dislike of the attitudes im-
plicit in this behavior, that is, the depreciation of color and the fascina-
tion with or glorification of European physical types. She did not ap-
pear angry at Blanca. When asked about this, she explained that when
she was growing up, family love overrode these dynamics and that
other factors also influenced her treatment, for example, age, position in
the family, and sexuality. Consequently, despite the depreciation of
dark color that Victoria perceived in her family, it did not divide the
family, nor were the darker members excluded. Rather, color appears to
have been the basis of an implicit hierarchy that challenged those who
were darker to compensate in various ways.
Victoria’s maturation involved viewing differently both her cul-
tural identity and her feelings about her color. She came to appreciate
the beauty of her darker color, and she credited Chicano men with help-
ing her appreciate and celebrate her dark color.
MARIO: SELF-IDENTIFIED AND IMPUTED RACE
Mario represents another, quite different, example of the influence of
family dynamics. Mario is a common name used by both Italians and
Puerto Ricans. He identified himself on the census as “other race” and
wrote in “Puerto Rican.” As an infant, he was adopted and raised by a
Puerto Rican couple. Biologically, however, Mario was the child of an
African American mother and an Italian American father. Even though
he is aware and proud of his black and European ancestry, he charac-
terizes himself as Puerto Rican because of his immersion in the Puerto
Rican culture, but others not familiar with his background might iden-
tify him as a black American.
For Mario, as for many others, his racial and ethnic identity is only
partially in the eye of the beholder. Rather, to him his identity is how he
has lived rather than his biological ancestry. In his mind, his subjective
view of his racial-ethnic identity supersedes any race classification that
others may ascribe to him because of his appearance or his biological
ancestry. Although in our sample, subjective and external views often
played off against each other, in Mario’s case, his subjective view was
60
S TO R I E S O F S E L F - D E F I N I T I O N

determinant. In the interview, he identified himself simply and solely as
Puerto Rican, whereas some of the respondents in the preceding exam-
ples were torn between self-identity and that imputed by others.
These case studies are examples of the various identities of those who
say they are “other race” and specify a Latino referent. Some of them
easily accept being “other,”
6
but others feel the pressure to be white,
black, or brown and to assume the multiple identities they sometimes
develop. Some persons in the sample described the resolutions to these
pressures as “intense.”
As these case studies showed, racial identities change over time—
for example, from white to brown or from tan to white as the respon-
dents progressed from childhood to adulthood
7
—and according to con-
text—for example, in their home, their job, or their school. Forces such
as socioeconomic class, phenotype, family, the United States’ racial
structure, and experiences in school, jobs, and social settings also are
important determinants of racial identity. Consequently, the way in
which race is constructed in the family, school, or society influences the
way in which Latinos identify themselves and may create multiple
identities, for example, white at home and brown on the job, or vice
versa.
These case studies also challenge the way in which race and racial
identity are generally defined in the United States, where phenotype
and genotype are primary and racial identity is unchanging and unam-
biguous. Although all these respondents answered “other race” on the
census question on race, many Latinos choose one of the standard U.S.
race categories. But even in these situations, identity is complex. For ex-
ample, in the larger sample, one of the respondents who identified her-
self as “white” on the census question described herself racially as “an
American with Cuban blood” and stated that North Americans saw her
as “Hispanic.” She also defined the term white as “the comparative color
of my skin to other groups. It is not my background, my race, my atti-
tude toward others or my income.” She distinguished between her
white skin and her culture, explaining that this is “what I appear to be”
(white) to other groups. This view might be quite different from that of
non-Latinos who identified themselves as white.
The larger sample contained even more dramatic examples show-
ing that Latinos’ racial identity is complex and fluid. For example, a
professional woman from Puerto Rico stated that she was “white” in
S TO R I E S O F S E L F - D E F I N I T I O N
61

her home and neighborhood but, because of her lower socioeconomic
origin, was “less white” in the traditional upper-class Puerto Rican fam-
ily into which she had married. In the United States, where she was la-
beled “Hispanic” or “Puerto Rican” because of her accent, name, and
cultural style, she was “nonwhite.”
The case studies also demonstrate the resistance of many Latinos
to bipolar racial classifications, despite the pressures from both inside
and outside their culture. Finally, the case studies demonstrate that
Latinos’ racial identity is not just genetically determined but that it
depends on many variables, including phenotype, social class, lan-
guage, phenotypic variation within the family, and neighborhood so-
cialization. In addition, for Latinos, “race” is individually as well as
socially constructed.
A story told by one of the interviewers in the research project seems
a fitting end to this chapter, for it illustrates people’s creativity when
defining themselves in particular political and economic contexts. The
interviewer was a young Latina, of Caribbean origin, raised in a barrio
in New York City during a time when the phrase “black is beautiful”
was popular. She recalled that as a child, she and her three sisters, all of
whom were different colors, would walk down the street, arm in arm,
chanting “black is beautiful,” “white is wonderful,” and “trigueña is ter-
rific.” She could not remember other people’s reactions or even whether
they (the sisters) spent much, if any, time discussing or analyzing this.
But she remembered that it happened.
62
S TO R I E S O F S E L F - D E F I N I T I O N

PA RT I I
HISTORICAL CONSTRUCTIONS


4
Whites and Other Social Races
A S A F O R M E R
census official once pointed out, decennial censuses
often reflect a country’s historical needs, and the information collected
is deemed necessary for the national interest and for the needs of small
geographic areas (Estrada 1993:497). These “historical needs” are seen
differently by different political groups, however, and when govern-
ments try to create statistical representations of its populations, the
process is predicated on political and ideological choices. Thus the re-
sulting categories generally reflect a political consensus on who is to be
counted, how, and how often (Lee 1993). These categories describe the
population(s) from the perspective of those who have the power to se-
lect them, and in turn, they influence the way that populations see
themselves.
Over time, U.S. decennial census classifications have moved to-
ward a more sharply defined bipolar structure. Basically, two socially
constructed polarities have evolved that contain “whites” at one end
and “other social races” at the other. Although each polarity has been
and continues to be fluid, this dichotomy has prevailed throughout
most of the census’s two-hundred-year history. At various times, dif-
ferent divisions are featured, for example, white, black, and mulatto or
white, black, Chinese, and Indian. But even in these instances, the basic
dichotomous structure of “whites and other social races” has been re-
tained. It is this bipolar structure that groups—those not quite white or
black—have contested in the past, and it is this structure that Latinos
today resist (Halter 1993; Leonard 1992; Loewen 1971; Smith 1993).
This chapter traces the decennial censuses’ changing classification
of race. Besides some surprising changes over time, we will see the evo-
lution of this bipolar structure. Among the surprises are that the U.S.
Constitution did not refer to color or race when it set forth the criteria
on which the census was to be based. Rather, the initial distinctions per-
tained to free or slave status and taxed Indians.
65

By 1790, however, when the first census was taken, the color term
white was introduced, and so it was color—and not race—that became
the primary term of classification. Color remained an essential category
of the census for more than a century and a half and preceded race as a
category by nearly one hundred years. The concepts of color and race
were officially joined in the twentieth century and are the foundation of
the bipolar structure that evolved.
THE EARLY CENSUSES
Because the United States of America was conceived as a democratic
and representative government, its people had to be counted. In addi-
tion, all the states had to agree on who was to be counted and how. The
1787 Constitution of the United States established the outline of such a
count in its criteria for apportionment, an immediate outcome of which
was the structure of the census with regard to race.
According to article I, section 2, clause 3 of the U.S. Constitution
(the apportionment rule), the population was to be counted every ten
years, and this became the mandate for the decennial census. The same
paragraph specifies:
Representatives and direct Taxes shall be apportioned among the sev-
eral states which may be included within this Union, according to
their respective Numbers, which shall be determined by adding to the
whole Number of free Persons, including those bound to Service for a
Term of Years, and excluding Indians not taxed, three fifths of all other
Persons. (cited in Anderson 1988:9)
What is interesting about this excerpt is its vagueness. With the excep-
tion of the oblique reference to Indians, “race” is not explicitly men-
tioned. “Free Persons” does not specify “whites,” and persons of
African descent are not directly mentioned.
Nonetheless, it is understood that “three fifths of all other Per-
sons” refers to slaves, who were of African descent. That is, for appor-
tionment purposes, persons in this category were to be counted as
three-fifths of a white person. In addition, indentured servants, most
of whom were from Europe, were to be counted as free persons. The
66
W H I T E S A N D OT H E R S O C I A L R AC E S

Constitution clearly states that untaxed Indians—most likely the ma-
jority of Indians then—were not to be counted. But the implication
was that taxed Indians would be counted. These were generally Indi-
ans who lived in European settlements and were no longer affiliated
with a tribe. They may also have included Indian women who had
married white men.
As Anderson noted, the apportionment rule incorporated into the
census and the political fabric of the new nation a tradition of differen-
tiating “these three great elements of the population”—the free, slave,
and Indian populations (1988:12). The method used to determine ap-
portionment was tantamount to deciding who was to be acknowl-
edged, and how. These decisions reflected how various groups of peo-
ple were viewed at that time, which groups were considered to be part
of the constituent population, and which were not.
In the first census of 1790, being indentured or being a Native
American did not prevent one from being counted. As long as they paid
taxes, Indians could be represented.
1
Slaves, however, were not counted
or represented. Thus the two main non-European components of the
U.S. population were recognized in different ways. Being counted,
however, was not by itself assurance of equal citizenship rights, for free
white women were counted but could not vote, and free white men
who did not own property could not vote. But not being counted meant
that a person had no official place in society and being calculated as a
fraction of a free person meant that one was regarded as a different or
lesser kind of person.
The Initial Reference Point
The 1790 census was taken one year after President George Wash-
ington was inaugurated and included the population of the original
thirteen colonies plus the territories of Maine, Kentucky, Vermont, and
Tennessee (U.S. Bureau of the Census 1989:1). The questions asked the
name of the head of the family and the number of persons living in each
household who were free white males or free white females, both over
and under sixteen years of age; all other free persons; and slaves. The
gender and age of the slaves or “other free people” were apparently not
important (U.S. Bureau of the Census 1978:1).
2
The interest in “free
white males over the age of sixteen” reflected the need “to assess the
W H I T E S A N D OT H E R S O C I A L R AC E S
67

68
FIG.
4.1.
Census Schedule Forms, 1800–1820.
U.S. Statutes at Lar
ge,
6th–12 Cong., 1799–1813, vols. 2 and 3, ed. Richar
d Peters, Esq. (1846
and 1856; r
eprint, Buf
falo: Dennis & Co., 1963).
1820
1810
1800
Sixteenth Congress. Sess. I. Ch.
24. 1820.
Schedule of the whole number of persons
within the division allotted to A. B.
Eleventh Congress. Sess. II. Ch.
17. 1810.
Schedule of the whole number of persons
within the division allotted to A. B.
Sixth Congress. Sess. I. Ch.
12. 1800.
Schedule of the whole number of persons
within the division allotted to A. B.

country’s industrial and military potential” (U.S. Bureau of the Census
1989:1).
Between the drafting of the Constitution in 1787 and the taking of
the first census in 1790, the term white became an explicit part of the
first category to be measured. The “slaves” category remained un-
changed, and the third category was labeled “all other free persons.”
Theoretically, those in political charge could have chosen another def-
inition for the first category and, consequently, themselves. That is,
they could have chosen “free English-speaking males over sixteen” or
“free males of Christian descent” or “of European descent.” But they
chose color. Having named the central category “white” gave a cen-
trality and power to color that has continued throughout the history
of the census.
A Definitive Color Line
In the census’s first four decades, local authorities took the cen-
sus, and so the information was not uniform. Hence, the categories
used on the national census frequently differed from those used on
the state census. Finally in 1830, uniform census forms were intro-
duced, although congressional records between 1800 and 1820 al-
ready included schedules recommended for taking the census (see
figure 4.1).
By 1840, the census categories had established a number of pat-
terns, and significant changes had been made as well. As table 4.1
shows, between 1790 and 1840, the categories of “free whites” and
“slaves” stayed the same. But in 1800 and 1810, the 1790 category “all
other free persons” was changed to “all other free persons, except Indi-
ans not taxed.” In 1820 it was subsumed under “free colored persons,”
and in 1830 it disappeared altogether.
3
The “free colored persons” cate-
gory was retained in the 1840 census.
In 1830, when uniform census forms were introduced, the color line
was also more clearly established. The original color-free category “all
other free persons” that appeared in the first three censuses had disap-
peared. The major divisions were now more explicitly “colored”:
whites, who were free, and coloreds, who were free or slave. (See ap-
pendix C for a discussion of why the first three censuses did not contain
a color term and why the original “all other free persons” category was
replaced by the “free colored” category.)
W H I T E S A N D OT H E R S O C I A L R AC E S
69

70
Table 4.1
Labeling Citizens and Others in Early Censuses, 1790–1840
1790
1800
1810
1820
1830
1840
Free white
Free white
Free white
Free white
Free white
Free white
males and
males and
males and
males and
males and
males and
females
females
females
females
females
females
Slaves
Slaves
Slaves
Slaves
Slaves
Slaves
All other
All other
All other
Free colored
Free colored
Free colored
free persons
free persons,
free persons,
persons (all
persons
persons
except
except
other free
Indians,
Indians,
persons,
not taxed
not taxed
except
Indians,
not taxed)
Foreigners
Foreigners
Foreigners
not
not
not
naturalized
naturalized
naturalized
Sources: Return of the Whole Number of Persons within the Several Districts of the United States (1802);
“Aggregate Amount of Each Description of Persons within the United States of America, and the
Territories Thereof, Agreeably to Actual Enumeration Made According to Law, in the Year 1810”
(1810); Census for 1820 (1821); U.S. Dept. of State (1832a and b, 1835, 1842); U.S. House of Representa-
tives (1895); U.S. Statutes at Large (1846, 1856); U.S. Bureau of the Census (1967, 1978, 1989); Heads of
Families at the First Census of the United States Taken in the Year 1790: New York (1992).
THE EVOLVING BIPOLAR STRUCTURE
After 1820 and the shift to color categories, the elements of culture, lan-
guage, religion, and mixture were compacted into a choice between
white and colored. By 1830, a bipolar structure—of “whites” and “non-
whites”—was clearly taking shape. As table 4.1 shows, the categories
used between 1790 and 1840 were based on the three criteria of free-
dom, birthplace, and color (on one side were “free white males and fe-
males,” “all other free people,” “free colored,” and “foreigners, not nat-
uralized”; and on the other side were “slaves”). By 1830, however, the
data on “free people of color” and “slaves” were combined in some in-
stances. For example, a table in the 1830 census reporting “the number
of deaf and dumb” combined “slaves and colored persons” in one
count, and “aliens and foreigners not naturalized” were included in the
white count (U.S. Dept. of State 1832a:42–43). Moreover, “aliens and
foreigners not naturalized” were included in the “total white” count
(U.S. Dept. of State 1832b:48–51).
The bipolar structure of white and colored became more explicit.

Although the censuses between 1830 and 1860 reported the numbers of
whites, slaves, and free colored in separate columns, some of the tables
combined slaves and free colored.
4
The hypodescent rule also became
more explicit,
5
and “other races” were put into the not-white or colored
column. By the third decennial census (1820), whiteness was more pre-
cisely defined, with the addition of the “foreigners not naturalized” cat-
egory
6
(see table 4.2). This category distinguished the foreign (most
likely white and free) from the native-born white and free. Its introduc-
tion suggests a distinction between the “whites” in the power structure,
who were citizens by birth, and “probationary whites,” who were not
(Ignatiev 1995; Jacobson 1998). In the 1850 census, the category of “free
whites” was changed to simply “whites,” which suggests that by this
time it was evident that all the people in this category were free.
As table 4.2 shows, from 1820 to 1880, census forms continued to
ask for “color,” but by the twentieth century, they shifted away from the
term color and substituted race. As table 4.3 indicates, “mixed” persons
were counted, as there appeared to be a growing concern with measur-
ing mixture more accurately, particularly after the Civil War. A category
of “other races”—for example, Chinese, Indians, and Japanese—was
added. Finally, more information, such as exact age, was collected for all
persons, regardless of race or color.
Beginning with the 1850 census, census takers were instructed to
gather information on the color, age, sex, and other characteristics of
each slave and free colored person. This was a major shift, because pre-
viously these groups had simply been listed as household members and
information about them was not collected. Now these two “not-white”
groups, the slaves and the free colored, were to be described as fully as
the white group.
Mulattoes
As table 4.3 shows, in both the free and slave populations, mulat-
toes were counted for the first time in 1850, with similar procedures
used to count both the slaves and the free colored.
7
According to the
published data, mulattoes never constituted a large proportion of the
total recorded “Negro” population—less than one-fifth in all but one
year (Miller 1991:table 2; Williamson 1984:102). But given the difficul-
ties of measuring those who attempted to “pass” and of “accurately”
measuring “mulatto-ness,” these figures are not reliable.
W H I T E S A N D OT H E R S O C I A L R AC E S
71

72
T
able 4.2
The Shift fr
om
“Color” to
“Race” in Decennial Censuses,
1790–1990
Census
Categories
1790
1800
a
1810
1820
1830
1840
1850
1860
1870
1880
1890
b
1900
1910
1920
1930
1940
1950
1960
1970
1980
1990
All other
fr
ee persons
■■■
Fr
ee color
ed
■■■
Color
■■
■■
Color or race
■
Race
■■■■
■■
■
Is this
■■
person . . . ?
c
a
The 1800, 1810, and 1820 censuses contain the category “all other persons except Indians not taxed.” But starting with the 1820
census, that category was placed
under a new
, br
oader category
, “fr
ee color
ed persons.”
b
In 1890, the category stated “whether white, black, mulatto, quadr
oon, octor
oon, Chinese, Japanese, or Indian.” Figur
es for the
se gr
oups wer
e r
eported sepa-
rately and ther
e was also a “total color
ed” column that pr
ovided the total for all these gr
oups. See U.S. House of Repr
esentati
ves 1895.
c
In the 1960 and 1980 censuses, an interr
ogative category was used: Is this person . . . ?
Sour
ces:
Return of the Whole Number of Persons within the Several Districts of the United States
(1802); “Aggr
egate
Amount of Each Description of Persons within the
United States of
America, and the T
erritories Ther
eof,
Agr
eeably to
Actual Enumeration Made
Accor
ding to Law
, in the
Y
ear 1810”
(1810);
Census for 1820
(1821); U.S.
Dept. of State (1832b, 1842); U.S. House of Repr
esentatives (1895); U.S. Bur
eau of the Census (1932, 1943, 1953, 1963, 1973, 19
78, 1989).

The concern with correctly measuring color surfaced after the Civil
War when the slave category became an anachronism, and it is evident
in the instructions given to enumerators during this period. In the 1850
and 1860 censuses, the enumerators had been instructed to write “B” for
“black” and “M” for “mulatto” and to leave the space blank for
“white.” But in 1870, the census takers were instructed: “It must not be
assumed that where nothing is written in this column ‘white’ is to be
understood.” This may have corrected what must have been a problem
in the previous censuses, that leaving the space blank might have en-
abled some people of mixed ancestry to “pass” into the “white” cate-
gory. Thus, when in doubt about the “color” of difficult-to-classify in-
dividuals, the enumerators might have been inclined to leave the des-
ignation blank, resulting in their being counted as “white.” This type of
“passing” may have been more tolerated under slavery, when the num-
ber of free people of color was relatively small and the condition of slav-
ery served as a primary marker of status, color, and race. But “passing”
was not tolerated after Emancipation, when status could not be deter-
mined as easily and light-skinned former slaves might try to pass into
the white category.
W H I T E S A N D OT H E R S O C I A L R AC E S
73
Table 4.3
Labeling Mixture and Other Races, 1850–1880
1850
a
1860
1870
1880
Whites
Whites
Whites
Whites
Free blacks
Free blacks
Blacks
Blacks
Free mulattos
Free mulattos
Mulattos
Mulattos
Slave blacks
Slave blacks
Slave mulattos
Slave mulattos
Indians
b
Indians
Chinese
Chinese
Japanese
c
a
By 1850, gender (referred to then as “sex”) was being recorded for most
groups.
b
Counts for Indians and Chinese were reported in the 1860 census. But it was
in 1870 that categories for these groups appeared on the census form.
c
A category for the Japanese was not listed separately on the census form in
1880, but some of the tables did report separate figures for the Japanese (see,
e.g., U.S. House of Representatives 1883:table 1a, p. 3). The preface to the
1880 census also describes Whites and Coloreds and indicates that Asiatics
includes Chinese, Japanese, East Indians, etc. (U.S. House of Representatives
1883:xxvi).
Sources: U.S. House of Representatives 1883:xxvi, 1895; U.S. Statutes at Large
1856; U.S. Bureau of the Census 1967, 1978, 1989.

The instructions for the 1870 census also advised enumerators to be
“particularly careful in reporting the class Mulatto. The word is here
generic, and includes quadroons, octoroons, and all persons having any
perceptible trace of African blood.” In addition, “Important scientific
results depend upon the correct determination of this class” (U.S. Bu-
reau of the Census 1989:26). The concern with mixture (understood
mainly as the proportion of “black blood”) reached a peak in the 1890
census, which counted quadroons (one-quarter “black blood”), oc-
toroons (one-eighth “or any trace of black blood”), mulattoes (three-
eighths to five-eighths black), and blacks (three-quarters or more)
(Wright 1956:187).
8
This more complicated racial scheme was unwork-
able for the census, however, and it was omitted from the next one
(Miller 1991:1; U.S. Census Office 1901:cxi).
9
THE GROWTH OF A RACIST IDEOLOGY
The statement that “important scientific results” depended on the cor-
rect classification of “mulattoes” and “blacks” suggests that the census
may have been influenced by the then popular theories of scientific
racism, which held that group differences could be “scientifically” at-
tributed to “race.” It is widely believed today that in the nineteenth cen-
tury, a racist ideology (based on color differences) developed that
served the purpose of rationalizing expansion, slavery, and class differ-
ences (Banton 1983; Barzun 1965; Bernal 1987; Bieder 1986; Freedman
1984; Gossett 1963; Gould 1981; Johansen 1982:84; Jordan 1968; Sanjek
1994:5; Snowden 1983; Stanton 1960; Thomas 1989: 29–31; Thompson
1989). Horsman, who examined writings, politicians’ speeches, and
newspaper coverage of the period, found that after 1815, the “supposed
lessons of the American experience hastened the collapse of Enlighten-
ment theory and helped produce scientific theories of black and Indian
inferiority. Along with this debasement of other races was to come an
enhancement of the white race as superior ” and more explicitly stated
census concerns about the mixing of the races (1981:115).
By 1850, the census publications already manifested a strong iden-
tification with northern Europe and a desire to preserve, legitimize, or
develop a northern European “racial” identity for the United States. As
the 1850 census stated: “The great mass of the white population of this
country is of Teutonic origin, with a considerable admixture of Celtic”
74
W H I T E S A N D OT H E R S O C I A L R AC E S

(U.S. Secretary of the Interior 1853b:10). It was reasoned that with a
predominantly northern European population, the United States would
be able to compete with its northern European counterparts, particu-
larly since it was located on much the same latitude and had a climate
similar to that of Europe (U.S. Secretary of the Interior 1853b:10–11).
The assumption was that climate had determined and would con-
tinue to determine the evolution and progress of the different human
races. The United States, imagined as a country whose population was
of primarily Anglo-Saxon and Teutonic origin, was seen as having a
particular destiny. According to the 1850 census,
As has been truly observed, “a race of men launched upon the tide of
existence, have, by virtue of all the conditions, a determined course to
run, which will make its own way, and fulfil its own destiny, in accor-
dance with a system of laws as unalterable and supreme as those
which control the physical universe.” (U.S. Secretary of the Interior
1853b:10)
Another assumption was that the same laws of life would prevail on
both sides of the Atlantic and “produce like results upon both conti-
nents” (U.S. Secretary of the Interior 1853b:10).
To this end, the life expectancies of American whites were com-
puted and compared with those in Europe and were found to be the
same for the “different branches of the Teutonic family of nations, in
temperate climates.” The statistics were compared for England and
Massachusetts, which are on the same latitude, and for those of Mary-
land and France, which are also on the same latitude. That this type of
discourse should appear in the census volumes was unusual, as they
tended to be rather bureaucratic and devoid of editorial positions. The
departure probably reflected the intensity of these issues before the
Civil War.
This view of a future predestined by geographic location, the mi-
gration of northern Europeans, and climatic features was undoubtedly
the basis of the concern with the growth of the “colored” population,
which had evolved in more southern latitudes, in different climates,
and from seemingly less advanced people. This concern also reflected a
perceived threat to the numerical and political dominance of whites
and to the clear demarcation of the “races.” Whites may also have
feared that the colored (both slave and free) population might retaliate
W H I T E S A N D OT H E R S O C I A L R AC E S
75

against what one census publication referred to as the “governing race”
(U.S. Secretary of the Interior 1852:20).
These concerns about the races’ mixing and the growth of the “col-
ored” population had surfaced earlier in census documents. For exam-
ple, in the preparation for the 1830 census, Congress specifically asked
the census for projections of this population’s growth and its impact on
the white population. The 1830 census accordingly prepared tables
comparing the 1790 and 1830 populations, in which it combined both
the free colored and slave populations (U.S. Dept. of State 1835). Also in
1850, the census produced tables showing the ratio of increase of the
white, free colored, and slaves since 1790 (U.S. Secretary of the Interior
1853a:ix, lxxxvii).
Concern with the growth of the colored (both slave and free) pop-
ulation may also have been rooted in the fear that they might retaliate
against the “governing race” (U.S. Secretary of the Interior 1852:20).
Indeed, the demographic picture of the populace at the start of the
census taking shows that the “governing race” was not so much in
the majority (in all areas) as subsequent history texts suggested. In
1790, those seen to be the military and commercial guardians of the
society were not the overwhelming majority of the population. Free
white males over the age of sixteen constituted only 20.7 percent of
the total population, and slaves and “all other free persons” of all
ages accounted for 17.8 percent and 1.5 percent, respectively
10
(Heads
of Families, 1908/1992:8). The distribution of blacks by state at this
time also shows that some had very high proportions of “Negroes”
(U.S. House of Representatives 1895:xcvi). For example, in 1790,
blacks (both slave and free) constituted 44 percent of South Carolina,
41 percent of Virginia, 36 percent of Georgia, 35 percent of Maryland,
27 percent of North Carolina, 22 percent of Delaware, and 19 percent
of Ohio Territory (Reference Library of Black America 1990:483). These
demographic findings may have fueled the concern of many about
the growth of the “colored” populations.
This concern continued throughout the nineteenth century. The last
census before the Civil War, in 1860, contained a table comparing the
growth rates of the free colored, slave, and white populations by state
and territory between 1840 and 1850 (Kennedy 1862:table 1, p. 130) and
a table showing the percentage increase of the free colored and slave
populations between 1790 and 1850 (Kennedy 1862:17). Then, in the
76
W H I T E S A N D OT H E R S O C I A L R AC E S

1870, 1880, and 1890 censuses, maps were included that showed the
density of the colored population and the proportion of colored in the
total population (U.S. House of Representatives 1883, 1895; U.S. Secre-
tary of the Interior 1872b).
11
Occasionally, the census expressed concern with the growth of the
colored population. For example, when relating the history of African
Americans in Maryland, a special census volume stated: “The tendency
of the colored race to encroach upon the numerical superiority of the
white continued for twenty years longer, until, in 1810, they were found
to have attained the ratio of 38.22 in a hundred of the entire population,
and the whites had declined correspondingly to 61.78” (U.S. Secretary
of the Interior 1852:20). It added that during the last twenty years, the
number of colored had been more than double that of whites but that a
way had been found a way to check this growth:
There was in 1810, reason for apprehension that, in another half cen-
tury, the blacks would become the preponderating race. There is rea-
son to believe that this alarming tendency was checked by the intro-
duction of new pursuits of industry, giving employment to a portion
of the native population, which would otherwise have sought it be-
yond the limits of the State and inviting into it emigrants from abroad.
(U.S. Secretary of the Interior 1852:20)
These efforts, plus the encouragement of migration from Great Britain
and Germany, “rescued the whites from the peril, which seemed to be
impending, of a loss of their numerical predominance” (U.S. Secretary
of the Interior 1852:20).
Free People of Color
Free people of color were a challenge to the distinction between the
slave and free populations. On the one hand, they were free and there-
fore perhaps entitled to the same rights as nonslaves. On the other
hand, they were of African descent and thus “not equal” to free whites.
Because of the striking rise in their numbers in the two decades before
1820, it became important to count them more precisely.
12
(See appen-
dix D for a more detailed discussion of the concerns with the growth of
this group.)
W H I T E S A N D OT H E R S O C I A L R AC E S
77

Other Races
Before 1870, the census form offered a choice between two cate-
gories, whites, defined in terms of the absence of any “black blood,” and
colored, defined by its presence. Then in 1870, categories for Chinese
(and later Japanese) were added to the census form in response to the
increasing numbers of Asian immigrants toward the end of the nine-
teenth century.
13
The addition of Native Americans reflected the grow-
ing recognition of their dependence on the U.S. government after they
were relocated onto reservations (Lurie 1974).
In 1870, data were gathered according to color (i.e., “whites,” “Chi-
nese,” “Indian,” and “colored”—blacks and mulattoes) but were re-
ported separately by group. Thus, under the heading “Color,” the enu-
merators were to write in “white (W),” “black (B),” “mulatto (M),”
“Chinese (C),” or “Indians (I)” (U.S. Secretary of the Interior 1872a:18,
20–21; 1872b:606–609). According to Carlberg (1992), these additions
may have been “color” groupings, but they did not represent the popu-
lation referred to as “colored” at the time. In other words, they were not
“colored” (as understood then), but they also were clearly not “white.”
This method of separately reporting information on the other races
was continued in the 1880 census,
14
but some tables and the introduc-
tory section of the 1890 census contain a footnote that the “colored pop-
ulation” included “persons of negro descent, Chinese, Japanese, and
civilized Indians” (U.S. House of Representatives 1895: 400–401, clxxx,
681).
15
Thus, it appeared that the earlier “white” and “colored” di-
chotomy had begun evolving into a “white” and “other than white” di-
chotomy, with many more categories in the “other than white” group.
Whiteness and Birthplace
The large influx of immigrants from southern and eastern Europe
also led to a concern about how they were affecting the population at
large. Hence, the 1880 census listed the proportion of “defective, de-
pendent, and delinquent classes”—including the mentally disabled, re-
tarded, blind, and deaf—among the native born, foreign born, whites,
and colored (U.S. House of Representatives 1883:926 and table ix). In
addition, the census gave the distribution of native-born colored in the
population according to state or territory of birth (U.S. House of Repre-
sentatives 1883:477 and table xii).
78
W H I T E S A N D OT H E R S O C I A L R AC E S

This concern with immigrants and their impact on the total popu-
lation was reflected again in the 1890 census, in the more elaborate
maps, charts, and sections on the foreign-born population. Maps and
tables also showed the distribution in the United States of “Natives of
the Germanic Nations” and of “Greco-Latins.” Pie charts described
changes in the U.S. population over time in the birthplaces of native-
born parents, foreign parents, foreign born, and colored. These were
called the four “elements at each census” and were accompanied by ta-
bles and discussions of the marital status of each (U.S. House of Repre-
sentatives 1895:clxxix, 394, 681 ff). These reports suggest the continuing
concerns with preserving a national identity as a basically northern Eu-
ropean people.
The United States’ bipolar structure was still in place at the end of
the nineteenth century, although it had become more complex. Whites
were clearly the central category by which others were defined—as ei-
ther white or not white. Now, however, there were “other races” and
also more information on everyone. The official definition of “mulatto”
was someone with any perceptible trace of African blood, which was an
important step in the development of the hypodescent rule. At that
time, the rule distinguished mulattoes from blacks, but eventually it
would define all blacks (Grieve 1996:56).
Concern with the impact of immigration on the total population
continued. Questions about immigrants and their racial origins were
the subject of the government’s massive Dillingham Report, which
focused on immigration at the turn of the century (U.S. Immigration
Commission 1911). The report used the phrase “races and peoples”
throughout and entitled its ninth volume Dictionary of Races or Peo-
ples. This reflected the ambiguity of whether Europe’s linguistic
groups were racial groups or peoples. Nonetheless, these various
white peoples were eventually accepted as Caucasian or American
white (Jacobson 1998).
As the century drew to a close, questions of who was white and
who could be a citizen also began to be litigated in the courts, thereby
defining whiteness even more narrowly (Haney López 1996). The per-
sistence of the 1790 federal law requiring that naturalized citizens be
white, in combination with other state laws that required one to be a cit-
izen in order to own property, vote, hold office, and the like, continued
to restrict the rights of many nonwhite immigrants and to bring them to
court in an attempt to be designated either “white” and/or a citizen.
16
W H I T E S A N D OT H E R S O C I A L R AC E S
79

By the end of the nineteenth century, it was clear from these court cases
that a basic racial structure of whites and not-whites had evolved.
THE SECOND CENTURY
Color or Race, 1900–1940
The 1900 census dropped the 1890 attempt to count the black pop-
ulation by blood quantum of one-eighth and so forth and admitted that
these figures had been “of little value” (U.S. Census Office 1901:cxi). But
it still counted mulattoes and blacks as two subcategories of Negro,
17
and a footnote to the “Negro” column indicated that this category in-
cluded “all persons of Negro descent.” In addition, a special census of
Native Americans asked how much “white blood” they had (U.S. Bu-
reau of the Census 1989:46). Thus, “blood” (and its effect on color) still
seemed to be an important, if not the principal, basis for establishing a
person’s color, which in turn determined his or her “race.”
The division between “white” and “other-than-white” became
much more clear-cut in the 1900 census. Now the data on blacks, Chi-
nese, Japanese, Indians taxed, and Indians not taxed were listed under
the broader “Colored” column (U.S. Census Office 1901:483). Likewise,
in the introduction to the 1900 census, whites and colored were care-
fully distinguished: “From these tables it appears that the population of
the entire area of enumeration in 1900 is composed of 66,990,788 white
persons and 9,312,589 colored persons, the latter figure comprising . . .
persons of negro descent, . . . Chinese, . . . Japanese, and . . . Indians”
(U.S. Census Office 1901:cxi, numbers omitted).
Curiously, the 1900 census also added the term race to color and in-
troduced the phrase color or race, which was used on all the census
forms for the next forty years (U.S. Bureau of the Census 1978, 1989).
Used together, these terms reinforced the singularly physical interpreta-
tion of racial construction in the United States. Nevertheless, both the
white and other-than-white race groups were in fact social and political
constructions. Although the 1900 census text was clear with regard to
the division between races, it was slippery when classifying “mixed” or
in-between groups. It noted, for instance, that the Croatans in North
Carolina had been counted as white in 1890 and as Indian in 1900 (U.S.
Census Office 1901:cxxiv).
80
W H I T E S A N D OT H E R S O C I A L R AC E S

The 1910 census addressed the issue of in-betweenness more di-
rectly. It gave new instructions to the enumerators that formed the basis
for the following decennial censuses: “For all persons not falling within
one of these [race or color] classes they should write ‘Ot’ (for other). . . .
For census purposes, the term ‘black’ (B) includes all persons who are
evidently full-blooded negroes, while the term ‘mulatto’ (Mu) includes
all other persons having some proportion or perceptible trace of negro
blood” (U.S. Bureau of the Census 1989:ii, 50).
Perhaps influenced by the then politically ascendant eugenics
movement, which also was influencing immigration legislation (Jacob-
son 1998:133; Marks 1995:87 ff), the 1920 census reported in its intro-
duction the “color or race” of the people in the United States’ outlying
possessions—Guam, American Samoa, the Panama Canal Zone, the
Virgin Islands, the Philippine Islands, and “Porto Rico” (Puerto Rico)
and also a special census of “Porto Rico” (U.S. Dept. of Commerce, Bu-
reau of the Census 1922:11). In addition, the census more explicitly de-
fined blood “purity” and categories; for example, “The term ‘white’ as
used in the census reports refers to persons understood to be pure-
blooded whites.” Also, the “colored” applied to blacks, Indians, Chi-
nese, Japanese, and “all other,” who were “Filipinos, Hindus, Koreans,
Hawaiians, Malays, Siamese, and Maoris” (U.S. Dept. of Commerce,
Bureau of the Census 1922:10; 1921:16).
The 1920 census still had a few tables counting mulattoes,
18
but vol-
ume 2 acknowledged the “considerable uncertainty” concerning “the
classification of Negroes as black and mulatto,” since the “accuracy of
the distinction” depended largely on “the judgement and care em-
ployed by the enumerators” (U.S. Dept. of Commerce, Bureau of the
Census 1921:16–17). Furthermore, figures for the same county varied
greatly depending on whether the census enumerators were black (as in
the 1910 census) or white (as in the 1920 census). Black enumerators
found a higher proportion of mulattoes. This awareness that racial per-
ception was influenced by variables such as the interviewer’s race or
the community’s acceptance probably helped move the 1920 census to
abandon the distinction between “mulatto” and “black,” thereby mov-
ing the hypodescent rule to another level. Anyone with any black an-
cestry was now simply “black” or “Negro.”
Paradoxically, the awareness that racial classification was socially
constructed, that is, influenced by personal and social factors, led to a
more rigid adherence to genetic ancestry, which further reinforced the
W H I T E S A N D OT H E R S O C I A L R AC E S
81

hypodescent rule. The hypodescent rule also separated “race” from
“ethnicity,” for regardless of ethnicity, one’s race was the main determi-
nant of one’s status. Thus, race was the primary means of identification,
and ethnicity was subordinated, obscured, or combined with race.
Williamson (1984), Davis (1992), and Domínguez (1986) discussed
this shift in the hypodescent rule and the involvement of both the gov-
ernment’s definitions and people’s own self-affirming and self-deter-
mining actions. Williamson, for example, argued that in the shift from a
three- to a two-tier racial structure, a “new people” was born. A fusion
of Europeans and Africans, they were proud and articulated their iden-
tity most eloquently in the Harlem Renaissance of the 1920s (p. 111).
When the Negro culture was embraced, “negritude” was also rede-
fined, and “the beauty of all colors and features” was recognized (p. 58).
Accordingly, race was redefined as based on descent and cultural defi-
nitions rather than appearance. African Americans found strength in
their blackness and in that strength lay the power to stand apart from
the world (p. 187). As Williamson noted, “The drive for a biracial soci-
ety had reached its culmination . . . not by white dictation . . . but . . . by
the eager embracement of ‘blackness’ by American Negroes” (p. 3).
19
The 1920 census also confirmed the hypodescent rule by specifying
how mixed-race people were to be classified: “A person of mixed blood
is classified according to the nonwhite racial strain or, if the nonwhite
blood itself is mixed, according to his racial status as adjudged by the
community in which he resides.” The examples provided made clear
that “regardless of the amount of white blood,” a person with a mixture
of “Negro” or “Indian” blood was to be classified “either as an Indian
or as a Negro, according to his racial status in the community in which
he lives.” Finally, the white population was divided into four groups
depending on birthplace (U.S. Dept. of Commerce, Bureau of the Cen-
sus 1922:10).
20
As table 4.4 indicates, although other categories were added
throughout the twentieth century, the censuses taken between 1900 and
1940 varied little from the basic structure established in 1920. This struc-
ture contained three divisions (whites, Negroes, and other races) within
a basically bipolar population of whites and colored. “Other races” in-
cluded all those who were not white or Negro, for example, Japanese,
Chinese, and Indians—all those who were nonwhite or colored.
There was, however, one interesting deviation. In 1930, “persons of
Mexican birth or parentage who were not definitely reported as white
82
W H I T E S A N D OT H E R S O C I A L R AC E S

or Indian were designated Mexican” and tabulated with “other races,”
such as Native American, Japanese, or Chinese (U.S. Bureau of the Cen-
sus 1932:1).
21
The 1940 census, however, reversed this policy regarding
Mexican classification, stating that “persons of Mexican birth or ances-
try who were not definitely Indian or of other nonwhite race were
W H I T E S A N D OT H E R S O C I A L R AC E S
83
Table 4.4
Census Race and Color Categories, 1890–1990
1890
1900
1910
1920
1930
1940
1950
1960
1970
1980
1990
White
■
■
■
■
■
■
■
■
■
■
■
Black
■
■
■
Negro
■
■
■
■
Black/Negro
■
■
■
Mulatto
■
■
■
Quadroon
■
Indian
■
■
■
■
■
■
American Indian
■
■
Indian (Amer.)
■
■
■
Aleut
■
■
■
Eskimo
■
■
■
Asian or Pacific
Islander
■
Chinese
■
■
■
■
■
■
■
■
■
■
■
Japanese
■
■
■
■
■
■
■
■
■
■
■
Filipino
■
■
■
■
■
■
■
Hindu
■
■
Korean
■
■
■
■
■
Hawaiian
■
■
■
■
Part Hawaiian
■
Vietnamese
■
■
Asian Indian
■
■
Guamanian
■
■
Samoan
■
■
Mexican
■
Other
■
■
■
■
■
■
■
■
■
Source: Adapted from Sharon M. Lee, “Racial Classifications in the U.S. Census: 1890–1990,” Ethnic
and Racial Studies 16 (1) (January 1993): 78.

returned as white” (U.S. Bureau of the Census 1943:3). Thus, within a
decade, Mexicans were shifted from their own “Mexican” category to
being included in the “white” category—unless they appeared to cen-
sus interviewers to be “definitely Indian or of other Nonwhite races”
(U.S. Bureau of the Census 1943:3; see table 4.4).
Fluctuating Labels, 1950–1990
Until 1940, “color or race” was consistently used as a label to de-
scribe groups, but in the second half of the century, this practice
changed. As table 4.2 shows, in 1950, the census form used only “race.”
In both 1960 and 1980, it simply asked, “Is this person . . . ?” and pro-
vided a list of categories.
22
In 1970, it was “color or race,” and in 1990, it
was again “race.” As this book goes to press, the question in the 2000
census will be, “What is this person’s race?” and in a major departure
from the census’s two-hundred-year history, more than one response
will be allowed.
After World War II, the census first tried to explain the concept of
race, and the 1950 census admitted that the concept lacked scientific
precision and was based on public opinion (U.S. Bureau of the Census
1953:35). The census also recognized the importance of context in de-
termining race: “Experience has shown that reasonably adequate iden-
tification of the smaller ‘racial’ groups is made in areas where they are
relatively numerous but that representatives of such groups may be
misclassified in areas where they are rare” (U.S. Bureau of the Census
1953:35). Similar admonitions were repeated in the 1960 census (U.S.
Bureau of the Census 1963:xx).
23
These questions mirrored the scientific
and international community’s broader questioning of the concept of
race, in the wake of the atrocities committed during World War II in the
name of racial purity (see UNESCO 1952).
The question of “who was black” in the United States also was ex-
amined more closely and was found to have different answers in dif-
ferent states. In the years leading up to the 1954 Brown v. Board of Edu-
cation decision outlawing segregation in the public schools, it was evi-
dent that legal definitions of a “black” person varied as well. As Haney
López (1996:118–119) noted, some states used a broad “one-drop” rule;
for example, in Alabama and Arkansas, anyone with one drop of Negro
blood was black. Texas used the “all persons of mixed blood descended
from negro ancestry” standard. Tennessee followed the same rule but
84
W H I T E S A N D OT H E R S O C I A L R AC E S

included mestizos; it defined “blacks in terms of mulattos, mestizos, and
their descendants, having any blood of the African race in their veins.”
A number of states—Florida, Indiana, Missouri, Nebraska, North Car-
olina, South Carolina, and North Dakota—followed a more precise and
simple one-eighth rule, and Oregon had a one-quarter rule. Utah law
used a similar blood-quantum approach that distinguished among mu-
lattoes, quadroons, and octoroons.
Other states relied on what could be established. For example,
Georgia referred to “ascertainable” nonwhite blood. Kentucky relied on
a combination of any “appreciable admixture of Black ancestry and a
one-sixteenth rule.” Louisiana adopted an “appreciable mixture of
negro blood” standard, and Mississippi combined an “appreciable
amount of Negro blood” and a one-eighth rule. Maryland used a “per-
son of negro descent to the third generation” test. Interestingly, Okla-
homa, the home of many resettled Indian nations, referred to “all per-
sons of African descent,” adding that the “term ‘white race’ shall in-
clude all other persons,” which suggests that Native Americans and
others were now “white.” Virginia appeared to differentiate black Indi-
ans from blacks when it defined blacks as those in whom there was “as-
certainable any Negro blood: with not more than one-sixteenth native
American ancestry.”
By 1970, the census appears to have begun departing from what it
admitted was a very unscientific, contextually dependent, and opinion-
based approach and shifted to a self-classification of race. Although the
census forms as a whole were still administered by census takers, the
1970 census noted that information on race was “obtained primarily
through self-enumeration” and that respondents self-classified them-
selves “according to the race with which they identify themselves”
(U.S. Bureau of the Census 1973:5).
24
By 1980, census forms were
mailed, and the recipients chose their race from the categories supplied.
Self-classification continued in the 1990 and 2000 censuses.
THE LONG ROAD TO TODAY
From our current vantage point, it may seem surprising that through-
out the census’s two-hundred-year history, color and not race has usu-
ally been the term of reference. “Race” appeared on the census form
only at the start of the twentieth century when it was included with
W H I T E S A N D OT H E R S O C I A L R AC E S
85

“color” on the 1900 census. It was not until 1950 that “race” appeared
by itself. In contrast, “color” was in the census legislation from its in-
ception. Thus “color” was an integral characteristic of the census, per-
sisting for more than 150 years in census forms, introductions, and in-
structions to census takers
25
(U.S. Bureau of the Census 1978, 1989).
Why was the term color retained for so long on the census? It might
have been inertia or a reflection of the then commonly used term colored
people. Is the concept of color still commonly accepted today, even
though the term has been discontinued officially? Finally, is the history
or legacy of this concept connected to the fairly recent introduction of
the term people of color? This term is used, particularly in academia, to
define or unite what are, in effect, “other social races.”
The category that we think of today as “race” has undergone sev-
eral transformations. Nonetheless, many people believe that racial clas-
sifications are static and biologically based. These views were encour-
aged by the government’s policy requiring individuals to choose only
one category to identify themselves, which reinforced the impression
and myth of “pure” races (Lee 1993). Since these categories were based
on supposed color differences, census classifications also reinforced a
presumable biological basis for what were really social distinctions and
definitions. According to Lee (1993), the concepts of race and ethnicity
have been confused as well, viewing what are in effect “social group-
ings” as biological races. This view began to change in 1950 with the
census’s tacit admission that “race” is not a scientific concept but that it
is often socially determined. This view has continued to change, and the
basic bipolar, hierarchical racial construction is being challenged as the
result of a series of events, such as increased and more diverse immi-
gration, greater intermarriage, more global and intense economic com-
petition, new scientific and technical discoveries, changes in the socioe-
conomic positions of “other social races,” and new views of race.
86
W H I T E S A N D OT H E R S O C I A L R AC E S

5
The Shifting Color Line
D E S P I T E T H E O V E R A R C H I N G
bipolar structure that emerges from
our review of census documents, there is and has probably always been
a great deal of heterogeneity within the two polarities. Moreover, the
lines between the two have not always been definite but have fluctu-
ated. For example, some individuals and groups in the “other social
races” have occasionally been classified as “white,” and mixed-race
persons have always blurred the boundaries of these socially con-
structed polarities. Some people and groups have tried to alter their
classification, and the census itself has changed the labels it uses to de-
scribe various groups.
Among the groups that have legally contested their racial classifi-
cation or had it changed are Filipinos, Afghans, Chinese, Japanese, Ko-
reans, Syrians, Burmese, Mexicans, Hawaiians, Native Americans, and
certain mixtures (Haney López 1996). Sometimes the rulings regarding
their racial status have been both curious and conflicting. For example,
the 1854 case of People v. Hall ruled that Chinese immigrants in Califor-
nia were “generically ‘Indians,’” and the 1893 case of Saito v. U.S. ruled
that Japanese immigrants were “Mongolian” (Almaguer 1994:10). Ar-
menians were first classified as “Asiatic” until a federal court ruled in
1909 that they were white (Haney López 1996:130–131; Takaki 1994:15).
This chapter focuses on the changes in the census classifications of
Native Americans, African Americans, Asian Indians, and Hispanics.
These groups’ experiences are a good illustration of the shifts in racial
placement and labeling by the census over time, the groups’ challenges
of their racial classification, and the influence of political factors on
racial classification. In particular, the experiences of Native Americans,
African Americans, and Asian Indians illustrate the historical relation-
ship between challenges to racial classification and the awarding of cit-
izenship. The Hispanic experience—although less contentious in this
regard—nonetheless highlights the extent to which “mixture” has been
87

perceived as problematic for full U.S. citizenship. All groups exemplify
the historical difficulty that the census has had dealing with mixture
and with groups who have not fit neatly into discrete categories of
color. Finally, these groups’ experiences underscore the extent to which
classifications have been influenced by, and have influenced, political
considerations.
NATIVE AMERICANS
The generic term used to refer to those peoples present when Euro-
peans first arrived in North America has been modified only slightly
over the last one hundred years (see table 4.4). This vastly diverse set of
multilingual, multicultural peoples were first misnamed “Indians” by
Christopher Columbus, who thought that he had reached India. It is a
label that persists even today, although Native Americans is preferred.
This persistence is perhaps reflective of the tendencies in this country’s
racial structure to ignore differences among those classified as “not
white.” Although the census did distinguish between “domesticated”
or taxed Indians, referred to tribes in an “advanced state of civilization”
who owned slaves (Kennedy 1862:11), and described blood quantum,
the name used to describe the group as a whole has tended to stay the
same.
From 1860, when the census first counted untaxed Indians, to 1940,
Native Americans were simply “Indians”; for the next twenty years,
they were “American Indians”; and then between 1970 and 1990, they
were listed as “Indians (Amer.).” In the 2000 census, the category is
American Indian or Alaska Native. The censuses have always collected
tribal identification but only occasionally have reported it.
The U.S. Constitution states that taxed Indians are to be counted as
equal to “whites” for apportionment purposes. Thus, Native Americans
may have first been counted as white—if they paid taxes. Then when all
Indians were first counted separately in the 1860 census, they were clas-
sified as a not-white, not-Negro group within the “other races” cate-
gory, along with the Chinese.
1
Beginning in 1970, they have been listed,
along with Eskimos and Aleuts, in their own “Native American Indian”
race category.
The Constitution does mention taxed Indians. The fact that the fed-
eral government did not report taxed Indians separately led to the as-
88
T H E S H I F T I N G C O L O R L I N E

sumption that taxed Indians had been included in the white counts. A
later census showed that this was the practice: “A few domesticated or
taxed Indians” had been earlier “included in the tables of the whites”
(U.S. Secretary of the Interior 1853b:ix). The 1790 census form for New
Hampshire, however, showed that taxed Indians were included in its
“free colored” column, not in the “white” column (U.S. Bureau of the
Census 1967, 1989:276). It is not clear how these taxed Indians from
New Hampshire were reported in the national figures. But this New
Hampshire census suggests that how taxed Indians were counted in
these earlier censuses varied by locality. Very likely, how taxed Indians
were counted was determined by factors such as phenotype, the extent
to which they had assimilated and/or intermarried, and how much
wealth and property they had acquired.
Eventually, the category of “taxed Indian” ceased to have any
“practical relevance” and became “an anachronism” (Pevar 1983:155).
In 1935, the U.S. Supreme Court ruled that all Indians were subject to
federal taxation (Superintendent v. Commissioner), and in 1940, for ap-
portionment purposes, all Indians were included in the total number of
persons (Clemence 1981). Although some Native Americans still are not
taxed (those on reservations do not pay federal taxes), the census has
long ceased to distinguish between those taxed and untaxed.
Of greater importance perhaps, from our present-day perspective,
is that untaxed Indians were not counted. The 1850 census contained the
first estimate of untaxed Indians (De Bow 1854a:41, 1854b), and the 1860
census also included figures on Indians (Kennedy 1862:134–135). But
not until 1870 was there a serious attempt to count such Indians, in
order to measure the country’s “true population” (U.S. Secretary of the
Interior 1872a:22).
2
By 1890, the census reported that there were more
untaxed Indians (189,447) than taxed (84,160) (U.S. House of Represen-
tatives 1895:cxxiv). The 1900 census was the first to classify systemati-
cally all Indians residing in the United States, taxed and untaxed.
In addition to the early differentiation between taxed and untaxed
Indians, Native Americans were also separated according to blood
quantum. In the 1860 census, for example, “half-breeds” were listed
separately from Indians. Again, how they were counted on the local
level varied. In Wisconsin and in New Mexico Territory, they were tab-
ulated both separately and in the white column, whereas in California,
half-breeds and Chinese were listed separately under the white column
(Kennedy 1862:134–135).
T H E S H I F T I N G C O L O R L I N E
89

By 1870, the census admitted that “Indians” had intermixed to the
extent that there were few persons of “pure Indian race”
3
(U.S. Secre-
tary of the Interior 1872a:19). Consequently, the census wondered how
half-breeds should be classified racially. It began by defining the term as
popularly understood, that is, as including “persons with any percepti-
ble trace of Indian blood, whether mixed with white or with negro
stock” (U.S. Secretary of the Interior 1872a:19). It then asked: “Shall they
be regarded as following the condition of the father or of the mother?
Or, again, shall they be classified with respect to the superior or to the
inferior blood?” (U.S. Secretary of the Interior 1872a:19).
Although the census clearly regarded Indians as a different race
and half-breeds as having both “superior” (white) and “inferior” (In-
dian) blood, it stated that the criteria applied to “the former slave pop-
ulation” should not be applied to Indians (U.S. Secretary of the Interior
1872a:19).
4
Curiously, the census finally chose a socially dependent cri-
terion that classified half-breeds as white if they lived with whites and
had the “habits of life” and “methods of industry” of whites. But if they
lived in Indian communities, they were to be classified as Indian.
5
This
approach was referred to as the “most logical and least cumbersome
treatment of the subject,” especially if the census was “to trace and
record all the varieties of this race” and considering the “small and fast-
decreasing numbers” (U.S. Secretary of the Interior 1872a:19). Thus, al-
though Native Americans were referred to as a race, the hypodescent
rule was not strictly applied to them because behavior and community
recognition were considered in determining the race of half-breeds.
6
In chapter 4, we discussed the censuses’ difficulty—especially to-
ward the end of the nineteenth century—ascertaining the extent to
which persons of African descent were “mixed.” The censuses also
wanted to gauge the extent of Indians’ “white” or “black” blood. Ac-
cordingly, in 1890, the census questioned Native Americans living on
reservations about this (Thornton 1987:217), and as noted earlier, the
1900 special census of American Indians asked them how much “white
blood” they had (U.S. Bureau of the Census 1989:46). The census used
the amount of “Indian blood” as a basis not just for counting Indians
but also for awarding treaty rights and defining identity. Wilson
(1992:108–125) and Jaimes (1994:41–61) maintain that gauging this so-
called blood quantum has had a deleterious effect on Native Americans
and is at variance with the Indians’ own definitions of themselves. As
Wilson noted, this blood quantum criterion imposes “non-Indian racial
90
T H E S H I F T I N G C O L O R L I N E

(and racist) assumptions onto Native American thinking.”
7
Before the
Europeans arrived, people intermarried across tribes but did not use
the concepts of “half-“ and “quarter-breeds” or blood quantum (Wilson
1992:109, 116). Nonetheless, this blood quantum approach has di-
vided—and continues to divide—the Native American community, as
individuals debate what it is to be “Indian” and who is more “Indian,”
based on that person’s perceived blood quantum (Jaimes 1994).
8
AFRICAN AMERICANS
The census history of African-descent persons is similar in some ways
to that of Native Americans. Both were subdivided into two groups—
one into free and slave and the other into taxed and untaxed. Initially,
the “free colored” and the “taxed Indians” were small groups that were
between whites and their respective unfree and untaxed groups in
terms of rights of citizenship. In addition, blood quantum was used in
both cases to subdivide and classify the groups. Finally, in both cases,
one generic term was applied to all persons regardless of their highly
diverse cultural and linguistic backgrounds. But the two broad groups
also had some important differences.
Most persons of African descent were first counted in a category
that referred to their state of enforced lifetime bondage, that is, as
“slaves” and thus as three-fifths of a person. Even within this category
they were counted not as individuals but as part of a household. This
classification reflected their legal status as “property.” For example, the
data might show that the Henderson household contained one white
male over sixteen years of age and one white female over sixteen, four
children of different sexes, and five slaves. The gender and age of slaves
were not reported separately until 1820, and other information was not
available until 1840, when each slave was given a number (names were
not listed). In 1820, a separate “free colored persons” category was in-
troduced and retained until slavery was abolished.
Both slave and free African Americans were subdivided according
to their mixed heritage. Between 1850 and 1920, they could be either
“black” or “mulatto,” and in 1890, smaller fractions of “black blood”
were requested.
In contrast to Native Americans, the generic term used by the cen-
sus to refer to persons of African descent did change substantially over
T H E S H I F T I N G C O L O R L I N E
91

time. In the early censuses, the category used was “black.” Later, the
category “Negro” was used, and it included both “blacks” and “mulat-
toes.” Then between 1930 and 1960, the category Negro was used by it-
self. Beginning in 1970, the category “black or Negro” was used, and in
the 2000 census, the category is “black, African Am., or Negro.” The in-
clusion of “African American” is significant, for it is the first time the
group has been given a label that suggests geographic origin rather
than color or race. Only one other contemporary race term does not
refer specifically to geographic origin, the “white” census category.
BIRTHRIGHT, CITIZENSHIP, AND COLOR
Citizenship is related to the question of classification, for in the United
States, classification as white meant that a person could be a citizen by
birthright or as a result of naturalization. Although the states had the
right to restrict citizenship, they could not grant it to nonwhites.
Citizenship is perhaps a society’s most basic and significant defini-
tion of rights and equality. Although the U.S. Constitution does not ex-
plicitly define citizenship, it does give Congress the power to naturalize
aliens. One of the first laws that Congress passed was the Naturaliza-
tion Law of 1790, which required that naturalized citizens be white.
Thus, almost from the nation’s inception, the general outlines of citi-
zenship were in place: a white person who was born in the United
States was automatically considered a citizen and, if foreign born, could
become a citizen. For a nonwhite person, however, citizenship was not
a birthright, and a nonwhite, foreign-born person was prohibited by
law from becoming a citizen.
Consequently, neither African Americans nor Native Americans
born in the United States could automatically become citizens. Al-
though the path to full citizenship was different for Native Americans
and African Americans, for both groups, citizenship was initially given
to those in between, that is, to free people of color and to taxed Indians.
A number of scholars have argued that these in-between groups did not
enjoy a full citizenship status equal to that of whites; rather, it was a sec-
ond-class citizenship status that was given to (and sometimes with-
drawn from) them (see, e.g., Aptheker 1968; Fishel and Quarles 1970;
Franklin 1967; Kettner 1978).
92
T H E S H I F T I N G C O L O R L I N E

Native Americans
The relationship of the Native American nations to the new United
States government changed over time. In the colonial period, govern-
ment officials dealt with independent and unconquered tribes on the
fringes of the white settlements as “sovereign political communities.”
After 1776, “the central government assumed primary authority over
Indian affairs—or at least over tribes outside the boundaries of existing
states” (Kettner 1978:288, 291).
9
Since Native Americans were part of
these sovereign political nations, they were initially seen to be “aliens”
and not citizens. Furthermore, the naturalization laws that allowed Eu-
ropean “aliens” to become citizens excluded Indians.
Some “Indians,” however, did become citizens in accordance with
their “individual circumstances.” This meant that some de-tribalized
Indians were absorbed into the white population as citizens. Others ne-
gotiated separate agreements and relationships with the British monar-
chy, the different colonial governments, or, later, the U.S. government
through their tribal governments. The extent of this “absorption” is not
well documented. Kettner, for example, cites one source that found in-
creasingly “separate and unequal treatment of Plymouth’s Indians”
and not absorption. But many were undoubtedly absorbed as they in-
termarried and as white settlements gradually took over their lands
and their status as tribes or sovereign political entities was challenged
(Kettner 1978:289–299).
During the nineteenth century, this early status of “sovereign na-
tions” gradually eroded (Johansen 1982; Lurie 1974). In 1831, the U.S.
Supreme Court rejected the Cherokee Nation’s argument that it consti-
tuted a “foreign state” in the sense in which this was understood in the
U.S. Constitution. In Cherokee Nation v. Georgia, the Court argued that In-
dian nations were “domestic dependent nations” occupying a “state of
pupilage.” According to Kettner (1978), this domestic, dependent na-
tion status ultimately served the purposes of those who wished to
maintain control over the Indians without fully incorporating them into
the community of citizens. Being “domestic” allowed for the extension
of white laws over the Indian nations, for as “nations,” they were not
given citizenship or protection.
10
The federal courts and executive branch concurred in excluding
tribes and tribal members from citizenship. Even after the passage of
T H E S H I F T I N G C O L O R L I N E
93

the Fourteenth Amendment, which granted citizenship to all ex-slaves,
the federal courts continued to rule against birthright citizenship for
Native Americans. Instead, they were deemed to be perpetual inhabi-
tants with few rights—not citizens. Finally, in the Dred Scott case of 1857
(also important to determining the citizenship status of African Ameri-
cans in the mid-nineteenth century), the Supreme Court argued that In-
dians were “aliens incapable of qualifying for naturalization because of
the naturalization law’s color restrictions” (Kettner 1978:294–296).
11
Nevertheless, despite the federal courts’ decisions and the natural-
ization laws restricting citizenship to free white immigrants during the
nineteenth century, a number of treaties and statutes considered award-
ing citizenship to Native Americans under certain conditions. For ex-
ample, the Cherokee treaties of 1817 and 1819 provided for land grants
to heads of families “who may wish to become citizens of the United
States” (Kettner 1978:292). Unfortunately, citizenship granted in this
way eroded tribal landownership systems and often led to “the de-
struction of the tribal organization and government” (Kettner
1978:293). After the removal of the Cherokees to Oklahoma in the 1830s,
North Carolina agreed to consider in the same way as other citizens
those Cherokees who remained. Other examples are the treaties with
the Delawares in 1778, which envisioned the admission of a separate In-
dian state as part of the Articles of Confederation, and the Cherokee
treaties of 1785 and 1835, which raised the possibility of congressional
representation. However, neither of these last two provisions ever took
effect (Kettner 1978:291, 294).
It is not known how many Indians became citizens through treaties
and by breaking relations with their tribes, but the commissioner of In-
dian affairs reported in 1891 that before 1887, only 3,072 Indians had
been admitted to citizenship through such treaties and congressional
acts (Kettner 1978:293). With the Dawes Act of 1887, however, these
numbers increased dramatically. This act admitted to citizenship those
Indians who severed their relationship with their tribe and accepted
grants of land in severalty. (It also resulted in the destruction of much
communal tribal ownership.) Additional legislation raised the numbers
further; for example, an 1888 law allowed both Indian women who
married citizens and Indians who enlisted to fight in World War I to be-
come citizens. By the time the act to make all Native Americans citizens
was passed in 1924, two-thirds of them had already been admitted to
citizenship through these acts and treaties (Kettner 1978:300).
94
T H E S H I F T I N G C O L O R L I N E

African Americans
Whereas the question of citizenship for Native Americans was a
moot issue by those who saw Indians as belonging to (or having alle-
giance to and citizenship in) another “nation”—albeit a domestic, de-
pendent one—individual African Americans did not have allegiance to
a comparable foreign organization. Moreover, before Emancipation,
most African Americans were slaves, who were neither aliens nor citi-
zens but property. Kettner suggested this was a legal convenience, for if
slaves could be seen as property, “judges could avoid fitting them into
established categories of membership or non-membership” (1978:301).
Immediately after the American Revolution, there were moves to-
ward manumission, and during the first decades of the nineteenth cen-
tury, slavery declined in the North, and the federal government for-
mally outlawed it. But in the South, the rapid rise of cotton production
and the continued fear of an ever-expanding black population led to a
reversal of these early antislavery tendencies. Consequently, by the
1830s, local laws in the South became primary, and federal laws, sec-
ondary. Slavery and noncitizenship thus remained sanctioned by law in
the Southern states and by the federal government’s policy of compro-
mise and withdrawal (Kettner 1978:302, 311).
The phrasing of the issue of slavery and citizenship before the Civil
War shows how entrenched slavery had become in some areas. The
question at that time was not whether free Negroes were citizens but
whether their status was that of a former slave or a free person, that is,
whether they were property or persons. Those who held that they were
property argued that the manumission of slaves was an individual mas-
ter’s decision; therefore, the state could not bestow citizenship. Since it
was the master’s right to relinquish ownership of his property, his prop-
erty did not have the right to be a citizen, regardless of whether he or
she was a slave or an ex-slave. Thus, from this perspective, even free
Negroes were property, but without owners to command them.
In time, Southern states such as Tennessee and North Carolina re-
treated from these explicitly dehumanizing stands and emphasized
more active discrimination against free blacks and mulattoes as indica-
tion of their separate status as a “degraded race” or a “third class.” In
circular fashion, they cited the discrimination as justification for their
continued separate (and consequently discriminatory) treatment of
blacks with regard to citizenship rights. Similar arguments were used in
T H E S H I F T I N G C O L O R L I N E
95

the U.S. Supreme Court in the Dred Scott case. In contrast, the Northern
courts favored citizenship for free Negroes, but they also supported dis-
criminatory legislation for them (Kettner 1978:315, 320).
The issue of native-born free Negroes raised other questions. One
concerned gradations of rank within citizenship status—did free Ne-
groes have second-class status? Another question was whether the
states could adopt a definition of citizenship that differed from that of
the federal government. The latter question was particularly relevant to
the acquisition of new territories. If a slave moved with his master to a
territory or state where slavery was not legal, was he still a slave there?
When he returned? These issues came to a head in the Dred Scott case.
Dred Scott, a slave in Missouri, was taken by his master to a non-
slave territory for a number of years. When Scott returned to Missouri,
he sued for his freedom in the state courts. When he lost his case, he ap-
pealed to the federal courts, which would hear cases only when the lit-
igants were “citizens of different states.” (During this period, the state
still determined citizenship.) Thus, the first question was whether Dred
Scott was a citizen of Missouri. The U.S. Supreme Court (with the ma-
jority of its justices from the South) decided that he was not a citizen be-
cause he was a Negro and that residence in a free state or territory did
not result in a slave’s emancipation. The language used by the Court in
this case was particularly inflammatory. One justice referred to Negroes
as “natural-born subjects” and “not citizens.” In rendering the Court’s
decision, Chief Justice Roger B. Taney stated:
In the opinion of the court, the legislation and histories of the times,
and the language used in the Declaration of Independence, show, that
neither the class of persons who had been imported as slaves, nor their
descendants, whether they had become free or not, were then ac-
knowledged as a part of the people, nor intended to be included in the
general words used in that memorable instrument. (Dred Scott v. John
F. A. Sandford 60 U.S. 393, 10 [1856])
Justice Taney added that blacks had been “regarded as beings of an in-
ferior order, and altogether unfit to associate with the white race, either
in social or political relations.” Moreover, they were seen to be “so far
inferior, that they had no rights which the white man was bound to re-
spect.” The rationale for not granting citizenship rights was the pre-
vailing condition of such people. Justice Taney noted, “Indeed when we
96
T H E S H I F T I N G C O L O R L I N E

look to the condition of this race in the several States at the time, it is im-
possible to believe that these rights and privileges were intended to be
extended to them” (Dred Scott v. John F. A. Sandford, 60 U.S. 393, 10, 13
[1856]). He concluded that “the negro might justly and lawfully be re-
duced to slavery for his benefit” (cited in Blaustein and Zangrando
1968:162).
Some scholars have cited the Dred Scott decision as “the most far-
reaching judicial statement of the nineteenth century” with regard to
race relations and as “the case that set the stage for the Civil War”
(Blaustein and Zangrando 1968:146). The case clarified in 1857 the na-
tional status of both slaves and free Negroes. Justice Taney referred to
the Constitution to justify his decision, which, he said, differentiated
between “the citizen race, who formed and held the Government, and
the African race, which they held in subjection and slavery, and gov-
erned at their own pleasure” (Dred Scott v. John F. A. Sandford, 60 U.S.
393, 17 [1856]). In essence, those of the African race, whether slave or
free, were never intended to be citizens. Rather, the citizen race was
the white race.
Only after the Civil War and the passage of the Fourteenth Amend-
ment was the principle of birthright citizenship finally affirmed for
African Americans. The 1790 legislation was amended in 1870 to permit
the naturalization of “persons of African nativity” and “persons of
African descent” (Kettner 1978:331, 345). Native Americans had to wait
until 1924 for legislation to make them citizens, and both groups are still
struggling for equal rights.
For Native Americans, the price of citizenship was the surrender of
their tribal lands, tribal relationships, and tribal culture. For African
Americans, citizenship was granted initially by local regulations or
agreements, which were replaced much later by federal policies. In both
cases, the federal policies differed from those for Europeans, and more
restrictive local policies and needs often drove more restrictive federal
policies. In both cases, the citizenship status of those in between—that
is, taxed Indians and free people of color—often varied and was am-
biguous. In some states, they could be citizens, but in others, they could
not. In addition, the type of rights they had varied by state and changed
over time in some states (Kettner 1978:301). The status and rights of
taxed Indians and free blacks were also undoubtedly related to wealth,
property ownership, intermarriage, phenotype, and acculturation. Fi-
nally, in both cases, these in-between groups disappeared.
T H E S H I F T I N G C O L O R L I N E
97

Given that their own rights to equality were often challenged, it is
interesting that both Native Americans and free people of color owned
slaves, in the Americas and in Africa. Some scholars argue that it was a
different type of slavery. The traditional servitude that existed in
African feudal society before the onset of the European slave trade did
include people with virtually no freedom, but with few exceptions,
“servants were regarded as human beings and not chattel. They could
marry, own property, maintain their family unity, freely worship their
god, and sometimes they became military commanders and even
rulers.” This kind of servitude is “not to be confused with American
slavery in which the slave was regarded as chattel, and in some cases
defined as property” (Harris 1972:73). Among the indigenous peoples
of North America, slaves were often captives of war and could be In-
dian, white, or black.
Only a few free people of color in the United States owned slaves,
but a number of Indian nations did keep numerous slaves. Indeed, the
1860 census devoted a section to Indian slavery, and tables in its ap-
pendix listed the number of slaves held by “Indian tribes west of
Arkansas, comprising the Choctaw, Cherokee, Creek, and Chickasaw
nations” (Kennedy 1862:10–11). These were southeastern tribes that had
been removed from slave-owning states and been resettled, mainly in
Oklahoma. (The census acknowledged that these groups were but a
“small portion of the Indian tribes within the territory of the United
States” [U.S. Secretary of the Interior 1853b:11].) The census calculated
that slaves formed about 12.5 percent of the total Indian population in
these nations
12
(U.S. Secretary of the Interior 1853b:11).
Some scholars contend that slavery among Indians and free people
of color differed from that among European-descended peoples. The
Cherokee Nation, for example, had early been a “haven for escaped
black men,” who often served as English-language “interpreters for
full-blooded masters.” Some also taught the Cherokees how to cultivate
the soil (Strickland 1975:79, 82). The Cherokees eventually promulgated
laws similar to those of the states in which they resided. The laws
tended to favor the Cherokees’ planter class, but they were “at such
variance with the needs and expectations of the majority of the tribe
that the laws were widely ignored” (Strickland 1975:83). Initially, the
Cherokees’ regulations regarding slavery resembled “more closely
[those for] tenant farmers or hired servants, with little restriction on pri-
vate life but a clear separation between the red and black races.” As
98
T H E S H I F T I N G C O L O R L I N E

“plantation agriculture began to emerge, the role of the slave began to
conform more closely to that of blacks in the southern cotton king-
doms” (Strickland 1975:79–80). Legal restrictions on slaves were bor-
rowed from those of Alabama and Georgia. However, the “evidence
clearly demonstrates that most of these restrictions were ignored” and
that agricultural crops were shared, slaves were allowed to keep guns
and were educated, and it was not uncommon for them “to possess
horses, cattle and swine” (Strickland 1975:81–82). There is mention of
“only one minor slave uprising” (Strickland 1975:84). Slavery varied
among the Indian nations, for example, some intermarried to a greater
degree and had fewer slaves, and the Seminoles—who had also been
“transplanted from slaveholding states”—had no slaves and intermar-
ried with ex-slaves (Katz 1986; Kennedy 1862:11).
The majority of free people of color had a personal interest in their
slaves. For example, they might have been married to a slave; the slaves
might have been the children of a free father; or they might have been
“close friends who by law would have to leave the state if freed” (Fishel
and Quarles 1970:128). In some instances, large numbers of slaves were
owned just for economic benefit (Fishel and Quarles 1970; Franklin
1967:224 ff). Many free people of color also protested slavery and
helped slaves escape through their benevolent societies, schools,
churches, and the abolitionist movement (Aptheker 1968; Du Bois
1972:235–272; Fishel and Quarles 1970:128–132; Foner 1964; Rawick
1972:109–113; Rose 1965).
Asian Indians
How individuals or groups are classified by their government is
relatively unimportant if the rights of all members of the society are
truly equal, regardless of race, color, ethnicity, class, or gender. It is only
because these rights, practices, and privileges have not been equal in
the United States that such classifications have become important.
13
As
we have seen, census categories have reflected, sustained, and, in some
cases, established certain power relations because of the rights associ-
ated with being classified as white in the United States. The extent to
which this has been the case is illustrated by the example of immigrants
from Asia who, for 162 years could not become citizens (and therefore
could not own land) in some states. The federal government’s 1790 nat-
uralization law specified that only persons classified as free “white”
T H E S H I F T I N G C O L O R L I N E
99

immigrants could become naturalized citizens (Kettner 1978:331, 345;
Leonard 1992; Takaki 1994).
14
The fluctuating racial classification of Asian Indians is an inter-
esting example of both the extent to which racial definitions and clas-
sifications can change and the role of political factors in influencing
racial classifications. In some censuses, Asian Indians were counted
as “white” and in others as “other race.” In the 1910 census, for exam-
ple, Asian Indians were counted and classified as “other race,” but a
footnote explained that “pure blood hindus” were ethnically white
and had been so declared in several naturalization cases, but, it con-
tinued, in the popular conception they were not seen as “white.”
Consequently, they were included in the 1910 census with the “other
races” category, along with the Chinese, Japanese, Filipinos, and oth-
ers (Jensen 1988:252).
A 1923 Supreme Court case involving Asian Indians used the same
reasoning. Bhagat Singh Thind v. U.S. 261US204 concerned the question
of whether Asian Indians were “white” and therefore eligible for citi-
zenship. The Court concluded that although scientific and linguistic ev-
idence indicated that Asian Indians were Caucasian, the common un-
derstanding of people in the United States was that “white” meant Eu-
ropean and Caucasian, not just Caucasian. Accordingly, at least
sixty-five Asian Indians were denaturalized between 1923 and 1927
(Haney López 1996:91).
In effect, the 1923 Supreme Court’s decision legitimized the gov-
ernment’s refusal to accept scientific definitions of race and to opt in-
stead for a definition of race that was more socially acceptable at the
time. The “race” of Asian Indians could be defined in two ways: one
was seen to be scientific, and the other was based on what it was
believed “the common man” thought. It was the second one that
counted.
In making this decision, the Court reversed the position it had
taken just a year earlier. In Ozawa v. United States (1922), a Japanese im-
migrant contended that since the color of his skin was white—indeed,
whiter than that of many white persons—he should be classified as
“white.” The Court then unanimously ruled that “the words ‘white per-
son’ are synonymous with the words ‘a person of the Caucasian race’”
(cited in Haney López 1996:85). Thind thus used this ruling to argue
that since he was a Caucasian, he was therefore white and eligible for
citizenship. However, the Supreme Court’s decision on Thind made
100
T H E S H I F T I N G C O L O R L I N E

clear that “white” was what people believed it to be—or, as the Court
argued, “what the common man thought” (Haney López 1996:107). In
essence, race was socially determined.
Subsequent census classifications of Asian Indians reflected the
Court’s decision. The 1930 and 1940 censuses included a separate
“Hindu” category (see table 4.3). Curiously, Asian Indians who were
Muslim or Christian were placed with Hindus in the “Hindu” category.
Their racial classification at the local level varied, depending on their
skin coloring, the county, and the observer classifying them. For exam-
ple, during this period, clerks issuing marriage licenses to Punjabis in
California sometimes wrote “brown,” sometimes “black,” and some-
times “white” for the Punjabi grooms (Leonard 1992:68).
15
Toward the middle of the twentieth century, as India and Pakistan
moved toward independence, politics influenced racial classification.
In 1945/46, after extensive lobbying by Asian Indians, legislation was
passed enabling them to become citizens.
16
It was after this time that
their classification as “white” commenced.
17
Indians were subsequently
counted as white in the census until 1980, when a separate “Asian In-
dian” category was created. In 1990, Asian Indians became a subcate-
gory under the generic “Asian and Pacific Islanders” (API) category. In
the 2000 census, they are listed along with other groups from Asia or the
Pacific Islands but without the pan-ethnic API label.
18
Thus, Asian Indians have progressed from being an undefined
racial category to being “other race”—that is, Caucasian but not white
“in the common understanding” (or not European white)—to being
“legally white,” to being listed as their own “Hindu” race category
without a generic label or group, to being part of the “Asian and Pacific
Islander” race group, to again being listed as a race along with other
Asian and Pacific Islander groups but not under this generic label.
Hispanics
The classification of Hispanics has also fluctuated in the U.S. cen-
sus, not just because of “racial” classification changes, but also because
the cultural criteria, such as language, surname, and “origin,” to deter-
mine Hispanicity have changed.
19
As noted in chapter 4, the 1930 cen-
sus created a “Mexican” category for the race question (see table 4.3).
Thus, in 1930, first- and second-generation Mexicans were of the “Mex-
ican race” unless they were determined by the (usually white) census
T H E S H I F T I N G C O L O R L I N E
101

interviewer to be definitely white, Negro, Indian, Chinese, or Japanese.
Those in the Mexican category were considered part of “other races”
along with groups such as the Japanese, Chinese, and Native Ameri-
cans. In 1940, the census dropped the Mexican category and stated that
all Mexicans were to be reported as “white” unless they were deter-
mined by the census interviewer to be “definitely Indian or of other
Nonwhite races” (U.S. Bureau of the Census 1943:3).
20
So Mexicans
moved from being Mexican unless determined otherwise in the 1930
census to being white unless determined otherwise in the 1940 census.
This criterion, established in 1940, was also applied to other His-
panics who immigrated to the United States in greater numbers after
World War II—for example, Puerto Ricans in the late 1940s and 1950s,
Cubans during the 1960s, and Dominicans and Central and South
Americans in the late 1960s and 1970s. Accordingly, in the 1960 census,
the instructions for determining race or color by observation directed
that “Puerto Ricans, Mexicans, or other persons of Latin descent would
be classified as ‘white’ unless they were definitely Negro, Indian, or
some other race” (U.S. Bureau of the Census, 1989:78). In the 1970 cen-
sus, enumerators asked respondents to choose a category for race. If the
respondents wrote in, for instance, “Mexican” or “Puerto Rican,” the
enumerators moved them according to their appearance into the racial
categories listed (Lee 1993). Consequently, before 1980, most Hispanics
were classified as white.
21
But in 1980 and 1990, when mail-back ques-
tionnaires were instituted, Hispanics were permitted to classify them-
selves, and they reported a variety of racial and ethnic groups.
With regard to the changing cultural criteria used to define Hispan-
ics, in 1940 the census used a linguistic definition to determine who was
Hispanic, and “persons of Spanish mother tongue” were reported.
22
In
the 1950 and 1960 censuses, the language criterion was replaced by
“persons of Spanish surname.” In the 1970 census, in response to pres-
sure from the Hispanic community for a Hispanic self-identifier
(Choldin 1986), a subgroup of individuals were asked “about their ‘ori-
gin,’” and respondents could choose among several Hispanic origins
listed on the questionnaire (U.S. Bureau of the Census 1993c). (As the
next chapter explains, political factors also played a role in the decision
to include a Hispanic identifier in the 100 percent count of the 1980 cen-
sus.) Thus, between 1940 and 1970, Hispanics were counted according
to three different cultural criteria, linguistic (1940), surname (1950 and
1960), and origin (1970).
102
T H E S H I F T I N G C O L O R L I N E

In sum, over time, both various cultural criteria and various racial
classifications were used to classify Hispanics. In 1930, Mexicans were
a “race” within the “other races” category unless the census interviewer
determined they were white, black, or Native American. Between 1940
and 1970, Mexicans and other Latinos were “white” unless they clearly
appeared to be Indian or Negro,
23
and between 1980 and 2000, they
could be “of any race” they chose. In the 2000 census, the format used
to count Hispanics is essentially what it was in 1990, except that the
question about whether or not a person is Hispanic comes before the
race question.
In contrast to the other groups discussed in this chapter, citizenship
issues for Hispanics have been more a matter of defining citizenship
than of securing it. Perhaps somewhat incongruously, citizenship was
granted to many Spanish-speaking persons as a result of the treaties
signed after the United States invaded Florida, the Southwest, and
Puerto Rico. Many questions, however, have been raised about whether
this citizenship by conquest was an equivalent or a second-class citi-
zenship, whether legal repression occurred after conquest, and whether
this citizenship included cultural citizenship, that is, the right to speak
Spanish and maintain one’s culture (Acuña 1988; Cabranes 1979; Flores
and Benmayor 1997:1–23; Hernández 1997).
The legal case of Rodríguez, a “pure-blooded Mexican” who ap-
plied to become a naturalized citizen illustrates the ambivalence and
tenuousness attached to this citizenship by conquest, particularly in
regard to “color.” Although a Texas court granted Rodríguez’s re-
quest in 1897 to be granted citizenship because of the treaties’ exis-
tence, it also remarked that “if the strict scientific classification of the
anthropologist should be adopted, he would probably not be classed
as white” (cited in Haney López 1996:61). This decision and whether
“a person of [Mexican] descent may be naturalized in the United
States” were later questioned in the courts (Haney López 1996:242, n.
37). Thus, although the Texas court did allow a “pure-blooded Mexi-
can” to naturalize, in rendering its judgment, it reinforced the more
general rule that color was still a bar to citizenship for nonwhites
such as the Chinese and Japanese.
Although the census never tried to measure specific mixtures
among Hispanics, the changing instructions to enumerators regarding
how they were to classify Mexicans and the current census position that
Hispanics can be of any race suggest that Hispanics are at least a mixed
T H E S H I F T I N G C O L O R L I N E
103

lot. But are they a mixed lot in the same way that the United States as a
whole is a mixed lot, or are they seen as mixing a lot? Horsman
(1981:chaps. 11, 12, 13) argues the latter, maintaining that Americans
saw Mexicans as less fit because they had intermarried so much with In-
dians and thus were not capable of governing the southwestern territo-
ries. Although such a perspective can be seen to justify the expansion of
the United States into the Southwest, some academics believe that this
perspective also influenced how all Latin Americans were viewed.
For example, Hayes-Bautista and Chapa contended that with the
promulgation of the Monroe Doctrine and the rise of Manifest Destiny,
Latin Americans were racialized into a homogenous group (of Latinos)
that transcended the boundaries of Latin American nations. In essence,
with the annexation of other people and the incorporation of foreign
territories, racial identification replaced national identification, and the
“conquered race” was relegated to a lower social class level than that of
the “conquering race.” With Latin Americans continually cast as per-
sons belonging to a less advanced and different race, the confusion of
race for nationality continued. Hayes-Bautista and Chapa believe that
the general North American public assumes that the “race” of Latin
Americans is a reality and that it is the antithesis of the civilized United
States population (1987:62–63).
Whether Latin Americans were racialized into a Latino group dur-
ing the nineteenth century or later has not been resolved. What is clear
is that political factors have been important to the definitions of both cit-
izenship and racial classification in the United States. It is also clear that
Mexicans and other Latinos have confounded, and continue to con-
found, the bipolar structure that evolved in the United States. In part,
the reason is that they do not fit easily into the bipolar structure—nor in
some cases do they wish to be—because of their varying phenotypes,
mixture, and perspectives on race. Hispanics, perhaps more than other
groups, best illustrate the permeability and shifting lines of the bipolar
structure.
RACE IN REAL LIFE, THE ACADEMY, AND THE CENSUS
Historically, there have been many shifts in racial classification (Ander-
son 1988; Forbes 1988; Lee 1993), even though the general impression is
that the concept of “race” has been unequivocal and unchanging in the
104
T H E S H I F T I N G C O L O R L I N E

United States. As a recent extensive review of this subject pointed out,
there is a “widespread popular perspective that race is biologically de-
termined and permanent and that ethnicity is culturally determined
and equally permanent” (Edmonston, Goldstein, and Tamayo Lott
1996:18). Yet a primary perspective in the social sciences now views race
and ethnicity as social constructions. Indeed, Almaguer holds that it has
become “axiomatic in sociological research to view racial categories as
sociohistorical constructs whose meanings vary widely over time and
space” (1994:9).
24
This contrast between the popular and the academic perspectives
of race is apparent at a time when the significance of racial classification
has shifted. In the past, nonwhite petitioners to the courts often ar-
gued—as did Plessy in Plessy v. Ferguson—that they should be classified
as “white” so that they could be given the rights of whites. Thus, race
and ethnic definitions were often ways of excluding individuals from
equal membership in the society. More recently, defining groups has
been a way of including them and ensuring that particular groups are
not discriminated against. But whether race and ethnic classifications
are used to include or to exclude groups, the basic bipolar structure—
that of whites and other social races—has prevailed. Nonetheless, those
in between have always been more dialectically engaged—individually
and as groups—in contesting, resisting, rejecting, ignoring, transform-
ing, or being transformed by census categories than is generally be-
lieved and than census documents might indicate. Indeed, these cen-
sus-based historical analyses may project a smoother sense of history
than what the lived experience has perhaps been. The reason is that in
addition to being labeled by the census (and by others in more casual
situations), individuals also identify themselves racially and ethnically
for reasons of pride and to express group affiliation, and these self-clas-
sifications may differ in meaning as well as in actual terminology from
those used by the census for both these in-between groups and other
groups.
T H E S H I F T I N G C O L O R L I N E
105

6
Race in the Americas
I N L AT I N A M E R I C A
and the United States, Europeans, Africans,
Asians, and indigenous peoples mixed and produced “new people.”
1
Few people, however, would deny that the population stew in the
United States is quite different from that in Latin America. Indeed, a
number of scholars have noted the difference between the processes of
racial formation in the north and the south (Degler 1959; Denton and
Massey 1989; Ginorio 1979; Harris et al. 1993; Petrullo 1947:16; Pitt-
Rivers 1975; Rodríguez and Cordero-Guzmán 1992; Wade 1985; Wagley
1965). Snowden argues that the concept of “race” in Latin America is
similar to that of the ancient peoples in the areas surrounding the
Mediterranean (1983:97), and others contend that in Latin America,
“race” is more like a “social race” or an ethnicity (Pitt-Rivers 1975; Wa-
gley 1965).
However, the concept of race in Latin America has been quite dif-
ferent from the ancient view, in that it also implies a “pigmentocracy,”
a racist paradigm in which honor, status, and prestige are signaled by
skin color and phenotype. The whiter one’s skin and the more Euro-
pean looking one is, the greater is one’s claim to honor and privilege.
Conversely, the darker one’s skin is, the more closely associated one is
with African and Amerindian peoples—that is, the conquered and the
laborers.
2
The recent literature has highlighted this difference and con-
sequently stressed the similarities in this regard between racial forma-
tion in the United States and Latin America.
POLARITIES ALONG THE NORTH-SOUTH AXIS
Latin America is a very large and extremely heterogeneous area. For a
variety of reasons, studies of race by North Americans have usually
focused on just a few regions—for example, Brazil, the Spanish
106

Caribbean, and Mexico.
3
Consequently, the following generalizations
must be read with a number of provisos in mind. First, not all Latin
American countries have been adequately researched. Second, much of
what is reviewed here was written in English and thus does not cover
the literature written in Spanish or Portuguese that is not well known in
the United States. Third, even the Spanish and Portuguese studies may
not accurately incorporate or even consider the views of the less edu-
cated or nonelite. Finally, at present, travel, communications, and the
exchange of peoples and goods between Latin America and the United
States are at all-time highs and are expected to increase in this era of
global transformation. Because race is a social construct, it has been and
will continue to be influenced by these changes.
Table 6.1 indicates the broad differences found in the literature. The
first of these four major differences between the north and south is the
tendency in Latin America to see “race” as a social-racial construction
and in the United States to see it as a genealogical concept. In the Span-
ish Caribbean and Latin America, ancestral “blood” is only one variable
determining one’s race. Moreover, race is not necessarily passed down
from generation to generation, as is implicit in a system based on hy-
podescent or genetic inheritance. In the Spanish Caribbean, the parents
of a white child may be black or an intermediate shade. Accordingly, in
the Caribbean and Latin America, phenotype is often viewed as an “in-
dividual marker,” whereas in the United States it is a group marker de-
termining one’s reference group (Wright 1994). Of course, in almost all
Latin American countries, certain phenotypes are associated with par-
ticular linguistic or social/cultural groups, with cultural types, and/or
with stereotypes, for example, the tall Otavalo Andean Indians of
Ecuador and the African-descended people of the Chocó in Colombia
(see Arocha 1998 for an interesting analysis of the relationship of the lat-
ter to issues of inclusion in Colombia).
A second, related, dimension is that race is not always based on just
color. Other physical and social characteristics, such as facial features,
hair texture, social class, dress, personality, education, linguistic iden-
tity, cultural modes of behavior, relation of the referent to the speaker,
and context are important to “racial classification” (Rodríguez and
Cordero-Guzmán 1992; Sanjek 1971:1128). Hence, a person who would
be considered white in the Spanish Caribbean might be considered
black or nonwhite in the United States because of his or her color. Race
in the Caribbean and Latin America is highly dependent on context
R AC E I N T H E A M E R I C A S
107

and situation (Harris et al. 1993; Johnson et al. 1997; Rodriguez and
Cordero-Guzmán 1992).
Third, in many parts of Latin America, race is more openly re-
ported as able to change over time and space.
4
That is, in some coun-
tries, a person may be born “brown” but become “white” with up-
ward mobility, whereas in the United States, race is more static and is
often considered to be an ascribed characteristic. Reflecting this more
fluid conception of race in the Spanish Caribbean and Latin America
are a variety of racial terms, often overlapping and without clear de-
marcation. In Brazil, for example, an open-ended question about race
in a survey can yield more than 140 categories of answers (Sanjek
1971). The various terms used to refer to racial types or categories in-
dicate the different conceptions (and constructions) of race. Hence,
the racial taxonomies differ, although in both the north and the south,
white has generally been seen as preferable to or better than black be-
cause it was the color of those who conquered and colonized and
were the “governing race,” as they were labeled in the 1850 U.S. cen-
sus (U.S. Secretary of the Interior 1852:20).
In each country of the Spanish-speaking Caribbean, a greater num-
ber of terms are consistently and commonly used—for example, moreno,
indio, jabao, and trigueño—for what in the United States might be called
“black” or “intermediates,” a term not often used here. Some of these
terms (e.g., trigueño or moreno) also are ambiguous or have many mean-
ings, referring at times to those regarded as white or black in the United
States.
5
In addition, a variety of terms are used to refer to those who are
blancos (whites) or to their particular color, for example, blancusina/o
108
R AC E I N T H E A M E R I C A S
Table 6.1
General Differences in Racial Constructions
United States
Latin America
Type of social construction
Genealogical-biological-
Social-racial
hypodescent
Categories
Few, discrete, mutually
Multitude, overlapping
exclusive
Role of color
Basic variable
One of many variables
Fluidity over time
Some fluidity
Substantial fluidity
Nomenclature
Unstable for mixtures or
More stable
nonwhites

(very white), cano/a (white, as in gray or white hair), rubia/o (blond),
guera/o (blond), colorá/ado/a (reddish), and jincha/o (pale). In some
groups, the very term blanco or blanquito (white) is also increasingly
used to refer to removed, powerful, or upper-class persons, regardless
of their color, thereby underscoring the relationship between perceived
color and power. Finally, descriptive terms are used to refer to skin color
that is not white-white, for example, piel canela (cinnamon skin),
trigueño claro (light trigueño), and trigueño oscuro (dark trigueño).
Alvar found eighty-two racial terms used throughout Latin Amer-
ica—and since the same term often has more than one meaning, he
listed 240 definitions for them (1987:89–215). Many of these terms have
been used for a long time and have different meanings in different
countries. The following example from his work illustrates how com-
plex these terms are. The term puchuelo was first cited by Father Morell
in a work published in 1776, but he noted that it was coined much ear-
lier. In Peru and Venezuela, puchuelo is defined as the result of a cross
between a European and an ochavona. This cross is said to produce a
person of raza totalmente blanca (of the totally white race). Puchuelo is
also defined as the cross between a white person and a person who is
cuarterona de mestizo (one-quarter mestizo). If the term is modified by de
negro, “of blacks,” in Mexico the term means the child of a white and an
ochavona negra (or octoroon) (Alvar 1987:185). Some people may legiti-
mately object to works like Alvar’s that analyze and itemize minute dif-
ferences in conceptions of race as trivializing the inherent brutality of
slavery and racism. However, such works also demonstrate that both
researchers and the lay public were aware of the magnitude of pheno-
typic diversity and the complexity and fluidity involved in creating
such differences.
In contrast, in the United States, despite early and regional or local
variations—for example, in New Orleans—race is generally deter-
mined by perceived or imputed biological inheritance. The “rule of hy-
podescent,” according to which one drop of “black” blood makes a per-
son “black,” has been applied most recently and most rigidly to African
Americans.
6
Because race and color are often used synonymously,
African Americans are considered to be “black” regardless of their ap-
pearance or other factors. Similarly, Asians are considered “yellow” and
Native Americans “red.” Although other social variables are often part
of racial determination in the United States, for example, accent or
speech or dress style, the basis is ancestry and color. Moreover, in the
R AC E I N T H E A M E R I C A S
109

United States, persons born black remain black no matter what they
achieve socially. Until recently, intermarriage between whites and non-
whites (other than blacks) has resulted in their children’s race being de-
fined as partialized, as in “half-breeds” or “part Asians,” for a number
of generations. Assimilation often has meant hyphenated American sta-
tus for some groups, minoritization for other groups, and total Ameri-
canization for those who most resemble Europeans.
Although African Americans have also developed a variety of
terms to refer to color tones (Russell, Wilson, and Hall 1992) and
some terms such as mulatto and half-breed have been used by govern-
mental bodies in the past, the emphasis has been on constructing race
categories as if they were “pure” (Lee 1993). Even in the African
American community, individuals never become fully white, as they
do in some Latino communities. Indeed, when a person of African
American descent becomes white, it is because the individual is
“passing,” that is, leaving the black community. Although some peo-
ple in the African American community are seen as “white” by
African Americans, whites, and others, to use this as a self-designa-
tion or category would be seen as denying their group, ancestry, or
“true” identity. In contrast, in Latino communities, it is not uncom-
mon to refer to individuals as Latino and white (in color), without
any denial of ethnicity implied. At the same time, the terms white and
Latino can be juxtaposed as two distinct cultural-racial groups, so to
be one is not necessarily to be the other. In contrast, in the United
States, individuals are rarely considered both black/African Ameri-
can and white (in color); they tend to be seen as mutually exclusive. It
is only with the recent increase in intermarriage that the children of
such unions have begun to use terms such as biracial and multiracial
for themselves and that these terms have become common ways of
describing individuals of “mixed” heritage. Those persons without
immediate “mixed” ancestry have not generally been so described,
although increasingly many are claiming all their ancestries.
In essence, as noted in chapter 4, the racial taxonomy of the United
States has reflected a small number of intermediate racial categories
that have fluctuated (in both official and everyday use) over time,
whereas in the Spanish Caribbean and other parts of Latin America,
many intermediate and stable categories have persisted over time. As
noted earlier, the extent to which these different constructions of race
influence one another because of immigration to the United States,
110
R AC E I N T H E A M E R I C A S

transnational migration movements, and increased communications
between both hemispheres is not yet clear.
DIFFERENCES AND SIMILARITIES
Although the differences between north and south pertain to racial con-
structions, they may also obscure the similarities. First, both Americas
have histories of indigenous conquest, slavery, and immigration. Sec-
ond, in both Americas, race has been constructed to reflect and support
class and power relations. Each country in Latin America has devel-
oped its own racial constructions, but in all cases, they have tended to
benefit those in power. The ideological and practical racial distinctions
of the colonial structure of Latin America as a whole has favored the
conquerors and colonizers. As Spickard noted,
From the point of view of the dominant group, racial distinctions are
a necessary tool of dominance. They serve to separate the subordinate
people as Other. Putting simple, neat racial labels on dominated peo-
ples—and creating negative myths about the moral qualities of those
peoples—makes it easier for the dominators to ignore the individual
humanity of their victims. (1992:19)
A racial hierarchy was and is still evident today in Spanish-speaking
America, which has been reinforced in the Spanish-language media,
particularly in the ever-popular television novelas or soap operas that
air in both Latin America and the United States. In most novelas, the pro-
tagonists and major characters are usually played by northern Euro-
pean–looking actors, and the marginal and lower-status service roles,
such as maids and chauffeurs, are given to darker-skinned, non-Euro-
pean actors (Subervi-Vélez et al. 1997:234–235).
Reasons for the Differences
The reasons offered for these differences are too numerous to be ex-
plained fully here, so I will only summarize a few of them. One is that
Spain’s contact with North Africa made the Spanish more tolerant of
different color groups than the northern Europeans were. That is,
Mediterranean peoples tended to see darker-skinned people as white or
R AC E I N T H E A M E R I C A S
111

more like them than northern Europeans did. According to Forbes,
Spaniards were used to a great variety of colors but did not associate
them with a concept of separate “races.” Thus, the Spanish Mediter-
ranean world used a variety of color terms and had an awareness of
many gradations in human physical types and subscribed to the gen-
eral view that “human types changed gradually and blended into one
another.” According to Forbes, this view was typical not just of Spain
but also of most observers before 1900 (Forbes 1988:268).
7
Both Sanjek (1994) and Forbes (1988), however, contend that the
Spanish way of viewing race shifted over time toward a more racial-
ized view. Sanjek argues that despite the initially different views of
Spain and northern Europe regarding color and race, by the late sev-
enteenth century, all European countries looked down on both
Africans and Native Americans and were reluctant to sanction inter-
marriage or to admit persons of mixed background to the full entitle-
ments enjoyed by those of solely European ancestry (1994:1–17). “As
the centuries of dispossession and enslavement of these peoples wore
on, the ordinariness and economic utility of such treatment were ac-
cepted more and more” (p. 5).
Spain adopted the Roman slave law codes, which were developed
when a person of any race could be a slave. In this context, slavery was
“an unfortunate accident that could befall any luckless one.” This con-
ception of slavery as accidental and not racial “automatically endowed
[African/black slaves] with the immunities contained in the ancient
prescription” (Degler 1959:28). Consequently, the Spanish conceived of
slaves and Indians as vassals or royal subjects and thus as having cer-
tain rights. This differed from the North American conception of slaves
as property. This does not mean that the Spanish treatment of slaves
was more benevolent but, rather, that it was sanctioned and conceived
of differently. Indeed, Hoetink found in his study of the Caribbean that
“there is no clear connection between the type of slavery practices, that
is, whether ‘cruel’ or ‘mild,’ and the positions attained by free blacks or
colored in the society” (1985:8).
A third difference noted is the influence of the Spanish Catholic
Church, which had a central role in the conquest of Latin America. In
Latin America, it also promoted the conversion, baptism, and atten-
dance of slaves at integrated religious services, whereas in the United
States, the churches for blacks and whites were separate.
8
For some, the
role of the Catholic Church is seen to be analogous to that of the Span-
112
R AC E I N T H E A M E R I C A S

ish legal code. That is, in theory it promoted a positive cultural attitude
toward persons of color but in practice failed to carry it out (Denton and
Massey 1989; Rodríguez and Cordero-Guzmán 1992).
The economies of many Latin American countries were more mixed
and less dependent on slavery. As a result, slavery was less important
as an institution, and there were fewer slaves, both absolutely and pro-
portionately. (Brazil and the Caribbean were the major exceptions.)
This, together with the immigration of many Europeans and the sub-
stantial numbers in some countries of indigenous peoples, may have
led to a conception of race that was fluid instead of dichotomous
(Duany 1985; Hoetink 1985). Duany (1985) illustrated the significance of
economic development in racial formation by comparing the history of
race relations in nineteenth-century Cuba and Puerto Rico. He contends
that race relations in Cuba, which had a plantation economy, distin-
guished more rigidly between the white planters and the nonwhite
plantation workers or slaves. In Puerto Rico, however, the absence of an
extensive plantation economy created a large intermediate group of free
colored persons, which facilitated social-racial mobility (Hoetink
1985:14; Williams 1984).
9
The gender ratio was also quite different in early Spanish America.
As Rodríguez and Cordero-Guzmán found, “the greater migration of
European women and families to North America as compared with
Latin America—where men predominated and European women were
scarce—may also have influenced the relations between races and the
consequent conceptions of race that evolved” (1992:527). Indigenous
and African women may more often have been mates of European men.
The children of such unions were, in some cases, recognized and edu-
cated, and they contributed to the formation of the criollo class (Burkett
1978). In addition, the development of a large, free, African-descended
class may also have produced greater differentiation. As appendix D ex-
plains, the number and proportion of “free people of color” in the
United States was never very large, peaking at less than 15 percent of all
African Americans.
RACE IN EARLY SPANISH AMERICA
Undoubtedly all these explanations contributed to the distinctive con-
structions of race in Latin America, as compared with those in the
R AC E I N T H E A M E R I C A S
113

United States. When and how did these differences begin? Forbes sug-
gests that the Latin American tendency to view individuals in a “pro-
gression of colors” reflected a more Mediterranean worldview in which
numerous shades were associated with Europeans, Africans, and so
forth (1988:268). This approach, he argues, was brought by the
Spaniards to the Americas and predated the extensive mixing that took
place there. Even though his assumption has not been extensively re-
searched, if we examine the records of early Spanish America, we find a
society with many, fluid, and overlapping race categories, determined
by various physical, social, and economic variables.
Early Spanish colonial records use color terms to describe Euro-
peans, a practice not followed in the British colonies. Evidently, race
was determined by a variety of factors, such as reputation, legal
process, choice, acculturation, and calidad (quality) and many different
terms were used to describe people physically.
10
In addition, and again
somewhat in contrast to the British colonies, mixture (or mestisaje) was
recognized in the writings and paintings of the time. Finally, the early
Spanish American literature refers to lower-class Spaniards (or whites)
as a caste, suggesting that castes were not based just on color.
An example of how substantial the color variations were even
among those classified as “Spaniards” is a 1677 roster of colonists
bound for New Mexico. It lists as Spaniards those individuals described
as having “fair skin,” others as having “dark complexions,” and still
others listed as being “mestizos” or “dark.” Spaniards also were classi-
fied by national origin, and so there were European Spaniards, Mexican
Spaniards, and Spanish Indians (Gutiérrez 1991:197). Color was appar-
ently an adjective that could be applied to persons of different national-
origin groups.
These references contrast with the later practices in the British
colonies, whose European-descended population seldom referred to
degrees or modifications of color. Greene and Harrington’s 1966 com-
pilation of population estimates in the British colonies before 1790 re-
flects this convention and indicates the common use of terms such as
people, souls, inhabitants, or whites—with the last two terms sometimes
modified, as in European or white inhabitants—to count populations.
11
Color terms were not used to describe Europeans, nor were those of
“mixed race” generally reported as such. With some minor exceptions,
the basic divisions were—as in the first decennial census—whites,
slaves (or blacks), and Indians, by tribe.
12
114
R AC E I N T H E A M E R I C A S

Settlers in early Spanish America also emphasized racial classifica-
tion according to reputation or social acceptance (Gutiérrez 1991). For
example, in his analysis of sixteenth- to eighteenth-century northern
New Spain (now New Mexico), Gutiérrez discovered that a Juan San-
doval was listed “by appearance of white racial status.” Another man
was described as “mestizo, according to reputation,” and still another
was promoted to lieutenant because “he is known as a white man”
(1991:198). Categories such as español, mestizo, and mulato were some-
times used interchangeably with descriptions of physical color—like
blanco (white), pardo (roughly brown or gray), and prieto (black)—even
though color had no real legal definition. Consequently, a person could
be described as español mestizo (or a mestizo Spaniard).
Comments that a person “appeared to be,” “was reputed to be,” or
“was known to be” of a certain race also indicated that classification
depended somewhat on social perception and acceptance. This in turn
suggests that racial mixing and “passing” may have been prevalent on
this remote fringe of northern New Spain (Gutiérrez 1991:198). Except
at the extreme ends of the color scale, however, there was no direct cor-
respondence “between race and actual physical color” (Gutiérrez
1991:197).
Other scholars writing about early Spanish America have noted
this malleability of “race” (Carroll 1991). MacLeod, for example, writ-
ing about Central America in the seventeenth century, notes that many
Indians kept their “race” but became non-Indian through dress and the
adoption of language and cultural customs—becoming culturally mes-
tizos or Ladinos (1973:308, 383). Katzew reports that in Mexico during
the eighteenth century, a number of newly wealthy families who were
descendants of Indians and slaves purchased certificates of legal
“whiteness” (called gracias al sacar, which is translated literally today as
“thanks to be taken out” but which may have had a different meaning
at the time) (1996:12). At the same time, others manipulated their racial
identities for other purposes, as when mestizos identified themselves
culturally with Indians and adopted Indian hairstyles, language, and
the like in order to avoid paying tribute. Likewise, blacks adopted In-
dian and Spanish customs.
Furthermore, according to Gutiérrez, in this early period in Spanish
America, a person’s status was based not solely on race but also on cal-
idad (1991:202 ff). Calidad and color were often closely related. Spaniards
prized their honor, and many were persons of calidad because they lived
R AC E I N T H E A M E R I C A S
115

among (and were above) genízaros (detribalized Indians), who had been
dishonored by their enslavement, and among the Pueblo Indians, who
had been conquered. Gutiérrez pointed out that much of what it meant
to be “honorable” was a projection of what it meant to be a free, land-
holding citizen of legitimate white ancestry. Conversely, those without
honor were slaves, outcasts, or Indians. Nonetheless, the concept of
honor was not necessarily rooted in racial-physical difference but was,
rather, “a complex measure of social status based on one’s religion, eth-
nicity, race, occupation, ancestry and authority over land” (Gutiérrez
1991:206). Consequently, the resulting social order tended to favor those
most akin to the European conquerors yet still allowed non-Europeans
to improve their position.
This order differed somewhat from the system that evolved in the
United States, which based social and racial status strongly, if not solely,
on biological descent or appearance. Thus, calidad was not a concept
that had an exact equivalent in the United States’ racial formation
process. Moreover, even though concepts similar to calidad undoubt-
edly could be found in the United States, for example, “god-fearing”
and “honest,” these were not generally used in racial classifications. As
a minimum, it required “whiteness” to be a citizen, so people were first
members of a race and then were god-fearing, honest, or whatever.
Another difference is that in North America, mixtures were de-
scribed only biologically, whereas in Latin and Central America, cul-
tural descriptors were never completely abandoned (Forbes 1988).
Latin Americans distinguished first between those of legitimate birth
raised by the Spanish and those raised by Native Americans. This dis-
tinction recognized that cultural factors or socialization influenced the
identity of the “hybrids.” Early North American colonists followed this
same path, but by the 1800s, and especially after the Civil War, “greater
and greater emphasis was placed upon wholly biological or ‘racial’ cat-
egorization and differentiation in North America.” (Forbes 1988:269;
see also Davis 1992; Logan Alexander 1991; Williamson 1984)
A number of scholars have noted the early use of various and
changing terms to physically describe “mixes” of people as well as the
conquering Spaniards (Alvar 1987; Forbes 1988; O’Crouley 1972; Ro-
dríguez, R. 1991:24). O’Crouley, for example, in his description of New
Spain in 1774, lists and defines several common terms used to describe
mixtures.
13
Gutiérrez’s 1991 analysis of marriage and baptismal records
in sixteenth- to eighteenth-century northern Mexico uncovered various
116
R AC E I N T H E A M E R I C A S

terms used to describe brides, grooms, babies, and parishioners. This
contrasts with the United States, where official documents or common
parlance did not use many terms to refer to mixtures of people. Many
of these terms are still commonly used in Latin America, for example,
mestizo. Others, however, are no longer employed, for example, castizo
or genizaro.
14
MacLeod also noted the diverse categories in early Central
America, for example, Spanish and Ladinos, mestizos, blacks, mulat-
toes, Indios, English (1973:228). Finally, the casta paintings commis-
sioned during the 1700s by wealthy Spaniards and criollos illustrate the
numerous terms used to describe the different “mixes” (Katzew 1996).
15
Although in the United States, terms referring to “mixtures” were
few, in some parts of the Spanish-speaking Americas, numerous terms
were used to refer to different kinds of mixes, for example, children of
indigenous and African parents (Forbes 1988:130). Gutiérrez (1991), ex-
amining colonial records in Mexico dating between 1690 and 1846, also
found a variety of terms used for different mixes. For example, coyote
and lobo (wolf) were widely used to refer to the “half-breed” children of
Indian slave women born in captivity.
16
Color quebrado was a broad term
that did not specify the nature or extent of racial mixture but, rather,
meant “broken color” or “half-breed.” The precise degree of racial mix-
ture was not indicated. Hence, in contrast to the United States, the blood
quantum was not ranked, although like the United States, the sense that
mixture diminished “purity” was present.
Gutiérrez (1991) noted the various classifications of Indians and
Spaniards in northern New Spain. If an Indian spoke Spanish, he or she
was known as an indio ladino. Indios were Pueblo Indians who lived in
their own towns and were economically and politically independent. A
genízaro was a detribalized Indian who lived in a Spanish town. This
term is no longer used, but at the time it appeared as a column heading
in census counts. According to Gutiérrez, the status of genízaros was
similar to that of domestics or slaves (1991:150).
With regard to early views of the influence of “non-Spanish blood”
on future generations, the picture is quite complex. On the one hand,
Spanish colonial records indicate that (black) race was not necessarily
transmitted from one generation to another (Forbes 1988:121). Al-
though the records might classify a mother as negra (black), they might
also classify her daughter as lora (brown)
17
or might not indicate color
at all, which usually meant white. Gutiérrez’s 1991 analysis of early
records also indicates that race was not necessarily inherited. In the
R AC E I N T H E A M E R I C A S
117

early period, marriage statistics seldom gave race, and mixing ap-
peared to be common. This contrasts with how the children of African
slaves or free people of color were classified in the United States. Writ-
ers on the early Spanish American period also have not found evidence
of a strict view of hypodescent, as was prominent in the north.
Sometimes, however, racist views were clearly articulated, and
the biological and cultural supremacy of the Spanish and Europeans
was often explicitly stated or assumed. Also, some commentators of
the time distinguished between the influence of “black blood” and
that of “Indian blood” on “Spanish blood.” For example, in Pedro
Alonso O’Crouley’s description of eighteenth-century New Spain, he,
as a Spanish merchant from Cadiz, accepts without question the su-
periority of Spaniards and refers without hesitation to the more in-
delible stigma of mixture with Negroes as opposed to Indians
(1972:20 ff). Another Spanish merchant writing at about the same
time affirms this view and stresses even more the supremacy of the
white pole to the black (Katzew 1996:10–11). The question, of course,
is whether such texts reflected the prevailing customs, the views of
the elite class, or the observations and prejudices of these particular
upper-class Spanish observers.
The casta paintings offer a similarly complicated view. What is un-
usual about these paintings is that they depict the complexity of inter-
mixing. Indeed, this appears to be the paintings’ purpose. Thus, we see
a variety of mixtures, from children who appear to be white but whose
parents are described as not white, to those who appear to be black but
whose parents appear to be white. The paintings’ depiction and expli-
cation of mixture are not found in the same degree in the north, where
mixing also occurred. It also is curious that in these paintings, the Span-
ish who intermarry or interbreed are depicted as being of both genders.
Similarly, the Indians or blacks are not always the female slaves or In-
dian princesses commonly found in U.S. literature or folklore. Finally,
in the early eighteenth century, each of these mixed persons is por-
trayed as wealthy, whereas the later casta paintings show them in less
affluent circumstances. Analysts today see the projections of wealth as
reflecting the insecurities of the criollos and Spanish elite in the Ameri-
can colonies who were attempting to convince Europeans and them-
selves of the stability and prosperity in the New World. Although we do
not know whether these paintings were more ideal than real or whether
these terms were commonly used at that time, they nonetheless present
118
R AC E I N T H E A M E R I C A S

a striking visual contrast to how mixture was projected (or not) in the
north.
18
The casta paintings also show that the results of intermixture dif-
fered depending on whether a black or an Indian was mixing with a
Spaniard. As O’Crouley pointed out, a white and an Indian could have
a “white” child, and thus the Indian stigma would disappear “because
it is held as systematic that a Spaniard and an Indian produce a mestizo;
a mestizo and a Spaniard, a castizo; and a castizo and a Spaniard, a
Spaniard.” Thus, if intermarriage continued with the Spanish, the
Spaniard would return. If, however, “Spanish stock is mixed with In-
dian several times over, there is also a return to Indian” (O’Crouley
1972:20). Some of the paintings depict this process.
Intermarriages with blacks also are described and depicted in the
casta paintings as producing white-appearing children, for example, al-
binos and moriscos, but not as producing a “Spaniard.” The paintings
also depict a return to “black,” that is, torno atras (a return backward).
Thus, as the two Spanish merchants of the time maintained, white
blood was not “redeemable” (i.e., recoverable) with blacks. Blacks and
Indians could return to their original types, but Spaniards could return
to Spaniards only if the mixture had been with Indians.
It is likely, however, that as the mixtures continued to mix with
other mixtures, the utility or relevance of these classifications or theo-
ries diminished.
19
After the third generation (when everyone has eight
grandparents), it was difficult to categorize the racial mixture defini-
tively. In fact, the difficulty of classifying these mixtures was already ev-
ident in at least two of the terms used in the casta paintings, tente en el
aire (hold yourself in midair) and no te entiendo (I don’t understand you).
All of this impeded “the creation of a fixed system of classification and
representation” (Katzew 1996:10). Consequently, even though Spanish
commentators may have employed a version of hypodescent at the
time, very likely only those concerned about maintaining the “purity”
of their European ancestry and their “blood” claim to upper-class sta-
tus or power would have worried about such distinctions (Gutiérrez
1991:292).
Indeed, the casta paintings’ racial classifications may have been at-
tempts to clarify and stabilize what was an increasingly fluid society
whose social and racial boundaries were uncertain (Katzew 1996). Sug-
gesting the uncertainty of such boundaries are references in the litera-
ture of that time to “castes,” which included whites and Spaniards.
R AC E I N T H E A M E R I C A S
119

MacLeod noted, for example, the concerns in seventeenth-century Cen-
tral America about the growing number of castes, which included free
Negroes, mulattoes, mestizos, and déclassé white
vagabonds
(1973:141–42, 192, 211–213, 235, italics added).
20
Siguenza y Góngoro,
writing in the seventeenth century about the deplorable drinking habits
of the Indians and other groups of the Mexican population, described
these groups as “composed of Indians, of Blacks both locally born and
of different nations in Africa, chinos, mulattos, moriscos, mestizos, zam-
baigos, lobos, and even Spaniards . . . who are the worst among such a
vile mob (cited in Katzew 1996:12, italics in original).
Finally, MacLachlan and Rodríguez wrote that although the colo-
nials of New Spain (Mexico today) assumed that there was an ethnic hi-
erarchy (and historians accepted this assumption), the notarial records
indicate otherwise (1980:223). The records state that by the seventeenth
century, wealth and status were not confined just to whites and that the
poor included all racial groups. In fact, some European immigrants re-
mained quite poor, and mestizos of means occasionally had Spanish-
born servants.
In essence, from early on, Latin America more freely acknowledged
the influence of culture, class, and other social factors in determining
race. As a consequence, many Latin American countries developed
overlapping racial categories on a continuum from light to dark, from
European to indigenous, or from white to black, rather than discrete,
mutually exclusive racial categories. Scholars of early Spanish America
explain that the racial system in place then had many of the same fea-
tures found today. It was not bipolar (i.e., it had more than two cate-
gories), and it was—as the preceding examples illustrate—apparently
fluid, dependent on social perception, and quite complex. We also see
in place by 1744 the use of intermediate terms such as pardo, a polite de-
scription of individuals known to be mulattoes, and the use of the term
moreno for those who were negros (O’Crouley 1972). As noted earlier,
these terms are still common in many Latin American countries today.
At the same time, pigmentation was emphasized, and implicit and
sometimes explicit racism dominated the determination of one’s social
status. Biological descent was only one variable entering the racial cal-
culus, but as in the United States, it may have been more stringently ap-
plied to those with African ancestors than to those with Indian ances-
tors. During the early Spanish colonial period, other characteristics
such as class, physical type, social networks, or hairstyle and dress also
120
R AC E I N T H E A M E R I C A S

were important indicators of social status and ethnic identity (Gutiérrez
1991:205 ff). Yet despite what may have been great fluidity in early colo-
nial Spanish America, the race order relied on the existence of op-
pressed “others” in order to define “the included.”
Racial Configurations
A comparison of differences and similarities between north and
south may obscure the differences among the different countries in
Latin America itself. As we saw in chapter 2, the various countries’
racial and ethnic categories differ, as do the concepts and their defini-
tions (Rout 1976:185–312). Some countries do not ask about race and
ethnicity, and sometimes these change over time (Almey, Pryor, and
White 1992; Bates et al. 1995:433–435; Lee 1993; Martin, DeMaio, and
Campanelli 1990; Miller 1991; Statistics Canada and U.S. Bureau of the
Census 1993).
21
That is, race has been conceived differently in each
country in Latin America because each has had a different history (Scott
1995:56).
For the countries in Central and South America, this variability de-
pends on their history of settlement as well as political considerations
and policies concerning the collection (or noncollection) of race and eth-
nic data. Almey, Pryor, and White (1992) examined how, during a forty-
year period in the twentieth century, the censuses of fifty-one countries
classified their populations with regard to race and ethnicity. They
found that the census forms of those countries whose settlers had a pre-
dominantly European cultural background (e.g., Argentina, Chile,
Costa Rica, and Uruguay) had no questions on race/ethnicity (Almey,
Pryor, and White 1992:7). But the censuses of Central American and An-
dean countries usually did include questions on ethnicity and race.
Moreover, the censuses of countries in the Americas that had slave
and plantation economies generally did ask about ethnicity and race
but used different terms for racial categories. For example, Cuba and
Brazil used color terms to distinguish groups such as black, pardo (sim-
ilar to brown), white, and yellow.
22
The British West Indies, where Chi-
nese and East Indian indentured labor was an important part of the
country’s history, listed separate categories for these groups. Similarly,
those countries where Syrians, Lebanese, and other Arabs immigrated
in substantial numbers had separate categories for these groups. Some
countries included a category for “mixed,” and over time, others
R AC E I N T H E A M E R I C A S
121

replaced “black” with “African.” In the 1980 censuses for Belize, Barba-
dos, and the Dominican Republic, the Portuguese were put into a cate-
gory different from that for whites (Almey, Pryor, and White 1992).
Countries such as Bolivia, Guatemala, and Panama collected data
on their large indigenous and nonindigenous populations. But accord-
ing to Almey, Pryor, and White (1992), the data on indigenous popula-
tions were not consistent. In general, such information was collected
only sporadically, and the categories changed over time. Moreover,
those nations with small and rapidly disappearing indigenous popula-
tions, for example, Brazil and Chile, did not attempt to use the national
census to identify and count them (Almey, Pryor, and White 1992:8).
Thornton noted that Belize counted Mayans and Caribs, those who are
mixed Native American and black, and that some countries counted
separately those who speak another language (1987:222).
Settlement history is not the only variable determining how ques-
tions of race and ethnicity are asked (Almey, Pryor, and White 1992) or
how racial ideologies are expressed. Government policies, conditions of
the nation-state, balance of power, and external views of race also in-
fluence how countries come to see or measure race. These factors—be-
cause they vary by country—also lead to a multiplicity of racial ideolo-
gies and policies (Graham 1990). For example, scholars have concluded
that between the late nineteenth and early twentieth centuries, Cuba
and Argentina developed racial ideologies that openly or explicitly em-
phasized and glorified whiteness and whitening (Andrews 1980; Helg
1990; Rout 1976:193 ff); Brazil celebrated its “Racial Paradise or Racial
Myth”;
23
Puerto Rico talked about a sense of cryptomelanism (Serreno
1945; for a more extensive review of the literature on race in Puerto
Rico, see Rodríguez 1996); Mexico celebrated “mestizaje and indi-
genismo” (Gutiérrez 1991; Knight 1990); and Venezuela created a com-
placent café con leche society (Wright 1990).
24
These racial ideologies also
influenced cultural self-definitions, preserved power relationships,
shaped policies, and controlled the oppressed.
25
Although these characteristics apply to particular countries, re-
gional exceptions within countries and overlaps between countries can
be found as well. Moreover, a particular ideology may also be found in
another country; for example, El Salvador may also have a café con leche
society. In addition, racial formation is constantly evolving, so the char-
acteristics of one period may change.
26
Moreover, these characteristics
are drawn from analyses of writings on race, which often reflect the
122
R AC E I N T H E A M E R I C A S

class biases of upper-class intellectuals and political elites in these coun-
tries. Popular views of race may therefore be quite different from these
descriptions, although one could argue that a country’s racial ideology
eventually affects everyone. The process is circular. “Race” is created by
cultural practices; it is articulated in a particular way by writers; once
constituted, it speaks to and about culture; and it influences the way
people see themselves (Nobles 1995:128).
But these countries also have much in common. All have a legacy of
slavery and the oppression of non-European peoples, although some
countries were more dependent on slaves than others were. They all
also responded to the development of racialist theories in the nine-
teenth century and to the shift in the balance of power during this pe-
riod, with its attendant competition for political and economic domi-
nance. Some countries responded similarly, for example, Cuba and Ar-
gentina (Helg 1990), others differently, for example, Mexico (Knight
1990). But the racialist theories and the popular thinking of the time
touched them all. This thinking, in turn, influenced each country’s poli-
cies, especially with regard to immigration and national conceptions of
race and identity. In effect, all the countries emphasized the desirability
of whiteness and European immigration policies (Graham 1990). In the
same way that all Latin American countries were affected in the past by
Eurocentrism and racism, they continue to be affected in the present by
new movements, for example, Afrocentrism, Latinismo, and world-
wide indigenous rights movements.
Racial Legacies
Despite its different historical constructions, “race” in the various
Latin American countries has been more fluid and has led to the cre-
ation of more categories than the binary division adopted in the United
States. Moreover, race in these countries has not been solely determined
by genetic inheritance but has been much affected by other variables
such as class, phenotype, language, and degree of assimilation. When
viewed through the U.S. racial lens, this view of race is more akin to eth-
nicity, culture, or national origin, but from the Latin American perspec-
tive, it is simply raza, “race.”
Recently, this view was manifested in the responses of many His-
panics to the U.S. census’s questions about race. As noted earlier, at least
40 percent of all Hispanics in the United States responded that they
R AC E I N T H E A M E R I C A S
123

were “other race,” and many of them wrote in a Latino referent, for ex-
ample, their national origin or a cultural or ethnic label. Moreover, some
of the findings of studies conducted by the census echo many of the dif-
ferences between the U.S. and Latin American views of race just de-
scribed.
27
For example, and as will be discussed in the next chapter, sev-
eral ethnographers found that Hispanics, especially recent immigrants,
generally do not view race as a dichotomous variable but, rather, as a
continuum (Bracken and de Bango 1992; Rodríguez and Hagan 1991;
Romero 1992). Respondents also conceptualize race “as a constellation
of national origin, skin color and culture” (Bates et al. 1994:109). Finally,
it was not only particular Hispanic groups that had difficulty with the
race and Hispanic-origin questions, but all Hispanics, regardless of na-
tional origin (de la Puente 1993:37–38).
A study by Kissam, Herrera, and Nakamoto (1993) found that
many Hispanics understand “race” to be national origin, nationality,
ethnicity, or culture and that for many Hispanics, “race” and “ethnic
group” are closely related.
28
According to this study, while the mean-
ings of each of the three terms race, Hispanic origin, and ethnic group var-
ied extensively from respondent to respondent, in contrast, the concept
of national origin was, for most, well understood. The study’s focus
groups confirmed the researchers’ in-depth interview findings (p. xi)
and concluded that for the Hispanics they interviewed, race was closely
tied to national origin and cultural identity and only weakly to pheno-
type or genotype (p. 32).
The study also provides some intriguing discoveries about educa-
tion and race. It found that education influenced the respondents’ an-
swers, with those with more education responding in the way the cen-
sus anticipated, especially to the race question. The study stated that in
the cognitive interview, race “provided one of the most frustrating bar-
riers for low-literate Hispanic respondents” (Kissam, Herrera, and
Nakamoto 1993:22). Many of the less well educated respondents
scanned the first three racial-group terms, blanco (white), negro (black),
and “indio” (Indian). They then eliminated each and in some cases
wrote in a Hispanic term. Because of the overlap for many Hispanics
among race, ethnicity, and national origin, even well-educated Hispan-
ics “expressed annoyance when they realized that their preferred racial
group term was part of the amorphous group of ‘otro grupo racial’ (other
race)” (p. 23). The authors decided that for the respondents, choosing
the “other race” category conveyed a “disturbing and sometimes in-
124
R AC E I N T H E A M E R I C A S

sulting connotation to Hispanic immigrants about their role in ethnic
interactions in the United States” (p. 23). According to the authors, the
respondents felt that they had no “label” of their own and only a
generic “other race” at the end of the list. The researchers concluded
that the message to the Hispanic respondents was that they were less
important than other races and that from the perspective of most of the
study participants, the “census’s implicit conceptual framework . . .
[was] considered inadequate” (p. x).
29
These findings prompt several questions. How does the way that a
group is seen in the United States compare with the way it sees itself?
How long does it take for groups to understand their placement or clas-
sification on government forms? How might they resist, such as when
people who have always seen themselves as “Cuban” or “Peruvian” are
told that they are “Hispanic” and that this is the same as “Argen-
tinean”? This is a repetition of the earlier immigrant experience in
which Sicilians became “Italians” and Cherokees became “Indians.”
But today, these findings involve for Latinos, at least, an apparent
change in definitions of race. Many Latinos may come to the United
States believing that race, ethnicity, and hispanidad (Hispanicism) all are
related (because this is how “race” is socially constructed in Latin
America), but they soon learn that for U.S. census purposes, these are
supposedly distinct concepts; that contrary to what the ancients and
other cultures believed, a race group is not the same as an ethnic group.
Moreover, race is primarily biological or color based.
The following anecdote from one of the census studies illustrates
another dimension of the racialization process. It suggests that racial
perceptions change over time in the United States. A focus group pre-
dominantly made up of immigrant Hispanic women was confused
about the racial question. A more acculturated Hispanic woman in the
group told the others, “What they want you to put down is ‘white’”
(conversation with de la Puente, January 6, 1993). This conflict between
the U.S. census’s articulation of “race” and the respondents’ views will
be discussed in more detail in the next chapter.
R AC E I N T H E A M E R I C A S
125


PA RT I I I
RACE AND THE CENSUS


7
The “Other Race” Option
HISPANICS AND THE U.S. CENSUS
As chapter 1 pointed out, the 1980 census represented a historical break.
For the first time in its two-hundred-year history, the census asked the
respondents to indicate their race and also if they were of Hispanic or
Spanish origin (see figure 1.1 in chapter 1 which shows these ques-
tions).
1
Both questions produced surprising results, which provide a
focus for a larger discussion about who reported they were “other
race,” what contributed to their responses, and what issues their re-
sponses raised. More broadly, these results and the explanations of
them provide dramatic evidence of the fluidity and social construction
of race, as well as of the persistence and pull of the United States’ bipo-
lar racial structure.
From the perspective of the mainstream press, one of the most
significant results of the 1980 and 1990 censuses was that the number
of people who checked categories that were “other than white” was
much higher than in the 1970 census. By 1990, one of every four
Americans identified himself or herself as either Hispanic or not
white, that is, of non-European descent or race. Time magazine used
this subject as a cover story, in which it coined the colorful (and sub-
sequently much used) metaphor “the browning of America” (Henry
1990). Implicit—but largely unnoticed—in this phrase was the as-
sumption that all Hispanics, Asians, Pacific Islanders, African Ameri-
cans, or any others who checked any category other than “white”
were “brown.”
The reverberations from this interpretation were many. For exam-
ple, some corporations changed their marketing plans to be more in-
clusive, and the definition of “American” was scrutinized even more
carefully than it had been during the 1960s. Although these revelations
about the United States’ changing “racial-ethnic” composition received
129

considerable media attention, practically no notice was taken of His-
panics’ responses to the race question.
In 1980, however, Hispanics’ responses to the question differed rad-
ically from those of the non-Hispanic population, in that a substantial
number of Hispanics (7.5 million, or 40% of all Hispanics) chose the
“other race” option (Denton and Massey 1989; Martin, DeMaio, and
Campanelli 1990; Rodríguez 1989; Tienda and Ortiz 1986). Many of
them wrote in an explanation in the box asking for race. That is, after
checking the “other race” box, they specified that they were Dominican,
Honduran, Boricua, or some other cultural or national-origin term.
(Another 57.7 percent of Hispanics indicated that they were white, and
4.6 percent indicated that they were black, Asian, or Native American.)
2
In contrast, less than 3 percent of the non-Hispanic population in all
states said they were “other race” (Rodríguez 1989).
Despite changes in the 1990 census’s race question, this pattern was
repeated. A comparison of the race questions used in 1980 and 1990
shows that some of the changes were calculated to reduce the likelihood
that respondents would confuse race with national origin.
3
For exam-
ple, the label race was included in the race question and was also added
to the category of “other.” Indeed, in contrast to the 1980 question, in
which the term race did not appear at all, in 1990 it appeared five times
in the question (see figure 1.2).
Nevertheless, the proportion of Hispanics who replied that they
were “other race” did not decline; rather, it increased by almost 3 per-
cent in the 1990 census. In fact, the “other race” category was the second
largest racial category (after “Asian and Pacific Islanders”), increasing
by 45.1 percent between 1980 and 1990 (Rodríguez 1991b:A14; U.S.
General Accounting Office 1993). Moreover, the overwhelming major-
ity (97.5%) of those in the “other race” group were Latino (U.S. General
Accounting Office 1993:26).
“OTHER RACE” RESPONSES
The literature initially offered two explanations for why so many His-
panics chose the “other race” option. One was that they had misunder-
stood or had had difficulty with the question. Although most articles
did not specifically refer to Hispanics’ “misunderstanding,” many did
refer to the “difficulty” that the race item posed or stated that Hispanic
130
T H E “ OT H E R R AC E ” O P T I O N

respondents had “difficulty” responding to questions about race
(McKenney and Bennett 1994:21; McKenney and Cresce 1993:173–222;
McKenney et al. 1993; U.S. House Committee 1994f:9). One article
referred to how Hispanics had “inappropriately identified their race
as ‘other’ (for example, some white Hispanics reported their race as
other . . .)” (Buehler et al. 1989:458). This article went on to say that the
Census Bureau “corrected” the classification of race for many persons
and created “race-corrected data” that were later used in their calcula-
tions (Buehler et al. 1989:458). The second explanation was that the
“other race” response represented “mixed-race” individuals, that is,
mulattoes and mestizos. In essence, Hispanics who said they were
“other race” and identified their national origin were seen to be either
“mixed up” or “mixed.”
4
Neither interpretation questioned the validity
of the race question.
Further research showed that neither of these explanations was en-
tirely satisfactory. Indeed, later analyses showed that it was not just His-
panics who had “difficulty” with the race question. Census reinterview
studies (i.e., studies that later interviewed those persons who filled out
a census form) concluded that in addition to both foreign-born and na-
tive-born Hispanics, many other foreign-born persons had difficulty re-
porting in the race items (McKenney and Bennett 1994:22). In addition,
other studies indicated that these responses resulted not from a misun-
derstanding of the question but from a different understanding of race.
As noted earlier, Kissam, Herrera, and Nakamoto (1993) observed that
many Hispanics chose the “other race” option because they viewed race
as culture, national origin, ethnicity, or nationality or a combination of
these and skin color (Bates et al. 1994:109; Rodríguez 1992, 1994a; Ro-
dríguez and Cordero-Guzmán 1992; Rodríguez et al. 1991). These dif-
ferent understandings of race also were evident in many colloquial ex-
pressions, such as Mexican Americans’ references to themselves as raza
and the common use of the term raza to refer to culture and national ori-
gin, for example, la raza dominicana (the Dominican race), la raza colom-
biana (the Colombian race), and la raza italiana (the Italian race).
There were other indications that Hispanics had different under-
standings of race. For example, in the 1990 census race question, two-
thirds of those who did not specify their race did write in their Hispanic
ethnicity (U.S. Office of Management and Budget 1995:44689). That is,
they were not a race, they were Hispanic. Hispanics’ more cultural or
ethnic view of race was also revealed in the census’s methodological
T H E “ OT H E R R AC E ” O P T I O N
131

and ethnographic studies investigating the reporting and undercount
issues (see, e.g., Bracken and de Bango 1992; Romero 1992; Rodríguez
and Hagan 1991; and Elias-Olivares and Farr 1991). As the Interagency
Committee for the Review of the Racial and Ethnic Standards of the Of-
fice of Management and Budget later noted, “Hispanics tend to see race
as a continuum and use cultural frames of reference when discussing
race” (U.S. Office of Management and Budget 1997a:36909).
The second assumption made about Hispanics’ divergent pattern
of racial responses was that those who reported they were “other” were
mestizo or mulatto.
5
This, too, has not been fully supported in subse-
quent research, although it does account for some responses. Given a
facsimile of the 1980 census question on race, Latino respondents were
asked first to answer the question and then to explain their choice of cat-
egory.
6
Of those who chose “other race,” only 11.5 percent referred to bi-
ological “race” or mixture (Rodríguez 1992). Another 15.4 percent gave
both physical and cultural reasons. The majority (63%) stated that they
had chosen the “other race” option because “this was their culture,”
and/or they referred to their family, birthplace, socialization, or politi-
cal perspective. Representative answers were “Because that’s what my
parents and family are”; “I have always known this is my culture”;
“That’s where my roots are”; and “Although I was born in the United
States, my parents are Dominican.” Thus, it does not appear that the
majority of those Hispanics who say they are “other” do so because
they see themselves as “mixed” (Rodríguez 1992). The assumption that
“other race” represents mixed race may be true for some Latinos, but it
cannot be assumed that it represents the view of all.
THE GOVERNMENT’S RESPONSE
Soon after the 1980 census’s results were published, few argued that the
“other race” response represented a different understanding of race. In-
deed, there was relatively little reaction after 1980 to the “other race” re-
sponse, especially compared with the reactions ten years later after the
1990 census, which led to public hearings and extensive research on this
issue.
7
This delayed reaction was reflected in a high-level summary by
the U.S. Office of Management and Budget (1995), which stated that “a
high percentage of Hispanics selected ‘other race’ in the 1990 decennial
race question” (U.S. Office of Management and Budget 1995:44690, ital-
132
T H E “ OT H E R R AC E ” O P T I O N

ics added). It did not say, however, that this response was first given in
the 1980 census. It was only later that the U.S. General Accounting Of-
fice noted that “in both the 1980 and 1990 Censuses, the Bureau found
that Hispanics had difficulty classifying themselves by race” (1997:8).
8
Would the situation have been handled or interpreted differently if
the issue had not been race? In other words, if 40 percent of a group (or
more than 9 million people in 1990) had responded to any other ques-
tion on the census (e.g., marital status, income) in a way that differed
significantly from expectation or from the rest of answers, would the as-
sumption have been that the group had difficulty with or misunder-
stood the question? More likely, such a result would have meant that
the question may not have been relevant to the group or that the re-
sponse was not a misunderstanding but perhaps a different under-
standing of the question. The following example illustrates this point.
Consider gender identity. If 40 percent of any group of people stated
that they were neither male nor female, it seems likely that (1) such an
answer would have been noticed before the same result was obtained
again ten years later and (2) a search would have been undertaken to
determine why the people answered in this way before concluding they
did not understand the question or that all of them were hermaphro-
dites. But after the 1980 census results were known, alternative expla-
nations were not seriously explored at the time. Only when the results
were repeated in the 1990 census—despite attempts to discourage the
“other race” response—were other explanations sought.
Despite the substantial changes in thinking about these issues, the
notion that Hispanics were confused lingered. For example, in hearings
held in 1993 to reassess racial and ethnic standards, many of the expert
witnesses and federal representatives accepted the conclusion that His-
panics were confused by or had difficulty classifying themselves in
terms of the race categories (see, e.g., U.S. House Committee 1994d:234,
1994j:75; 1994m:55, 1994r:95. These hearings will be the focus of chapter
8.). Moreover, as recently as 1997, according to the U.S. General Ac-
counting Office, the Census Bureau’s evaluations in 1980 and 1990
found that “Hispanics had difficulty classifying themselves by race”
and that this difficulty led to inconsistent reporting (1997:8). The U.S.
Office of Management and Budget’s interim report, while acknowledg-
ing that “the [race] question may not be operating as intended,” still
stated that “some research supports the public comments that some
respondents are confused about how to respond to separate race and
T H E “ OT H E R R AC E ” O P T I O N
133

Hispanic origin items” (1995:44679). It then cited the high proportion of
Hispanics who marked “other” in the race question
9
and reminded
readers that in the census reinterview studies, many Hispanics changed
their classification when questioned by census personnel, again sug-
gesting confusion. (The report did not note the possible role of the cen-
sus interviewer in influencing this shift to another means of classifying
race.) In 1999, the results of cognitive interviews conducted by the cen-
sus led the Office of Management and Budget to decide that “there was
confusion regarding the separation of Hispanic or Latino origin from
race” (U.S. Office of Management and Budget 1999:10).
REASONS FOR CHOOSING THE
“OTHER RACE” CATEGORY
Many Hispanics chose “other race” because they saw that their na-
tional origin, ethnicity, and so forth were different from the other
choices on the census, that they were not the same as or just “white,”
“black,” “American Indian,” or “Asian and Pacific Islander.” But con-
text—often referred to as “external or methods effects”—also influ-
enced how Hispanics responded to the race question.
10
For example,
whether the interviewer was Anglo or Hispanic or whether the re-
spondent answered the questionnaire in private, over the phone, or in
person might have affected the answer. The structure of the question,
that is, whether it was open-ended or closed, and the options offered
also influenced the responses.
In regard to questions about race, some groups are unwavering. For
example, regardless of who asks the question or how the question is
asked, whites always say they are white, and African Americans al-
ways say they are black (U.S. Office of Management and Budget
1995:44675).
11
But Hispanics are different, and their answers to ques-
tions of race often vary considerably according to context.
12
Many stud-
ies refer to this variability to as inconsistency because respondents do not
consistently give the same answer (U.S. General Accounting Office
1993:26). The following section reviews the research on how Hispanics’
responses to questions of race are affected by (1) who asks and who an-
swers the question, (2) the format of the question, and (3) the context in
which the question is asked.
134
T H E “ OT H E R R AC E ” O P T I O N

Who Asks and Who Answers the Question
The question of who determines “race”—that is, whether it is de-
termined by the person being questioned or by someone else—is im-
portant to determining Hispanics’ racial classification. Three examples
are illustrative. The introduction of self-identification in the census
caused the proportion of “white” Hispanics to drop from 93.3 percent
in the 1970 census to 57.7 percent in 1980. At the same time, the propor-
tion of “other race” Hispanics rose from only 1 percent in the 1970 cen-
sus (when census personnel determined racial classification) to 40 per-
cent in 1980. The proportion of “black” Hispanics remained the same in
both years (Rodríguez 1991c:65, 81).
Second, in the 1990 census, 43 percent of Hispanics were “other
race,” 52 percent were white, 3 percent were black, 1 was percent API,
and less than 1 percent was American Indian (del Pinal 1994:4). But in
March of the next year, when the Current Population Survey (CPS) was
taken, Hispanics were 96 percent white and 1.5 percent other race (del
Pinal 1994:2; U.S. Bureau of the Census 1992:3) (see table 7.1). This dis-
crepancy in racial classification occurred because in the CPS data, a cen-
sus interviewer determined racial classification and Hispanic origin,
and the “other race” category was not even on the form. (The “other
race” category was used only when respondents refused to be placed
into those specified on the form.) Consequently, in this case, the use of
census interviewers to classify Hispanics resulted in significantly more
“white” Hispanics and significantly fewer Hispanics in the “other race”
category. (The proportions classified as black, Native American, or
Asian and Pacific Islander also decreased.)
Third, in the census’s Content Reinterview Study, personal inter-
views were conducted with those who had earlier submitted their in-
formation on the decennial census form. In a study of those who re-
ported that they were “other race” in the 1980 census, only 10 percent
were similarly classified when reinterviewed by census personnel
(McKenney, Fernández, and Masamura 1985). Martin, DeMaio, and
Campanelli cited as a possible cause for this inconsistency “interviewer
behavior in the reinterview study” (1990:554). Although race was to be
self-reported by respondents using a flashcard listing the race cate-
gories, they stated that the interviewers might have changed the “other
race” responses to “white” for respondents who “looked white.” Or
T H E “ OT H E R R AC E ” O P T I O N
135

maybe Hispanic respondents answered differently in a personal inter-
view (probably conducted by a white interviewer) than they did on the
census questionnaire.
These examples show the distinction between “self-determined”
and “imputed” race. In the case of Hispanics, how people see them-
selves and how they are identified by others (imputed race) may be
quite different. Consequently, what Latinos say they “are” in standard
U.S. “racial” terms is not necessarily what they are perceived to be by
others. For example, even though a Latino may write on a census form
that he or she is “white,” the same person may be viewed by landlords,
employers, or institutional service personnel as “black.” Conversely, a
Hispanic who has always thought of himself or herself as dark might be
considered by others as “white.” This is called perceptual dissonance (Ro-
dríguez 1974, 1992), and these differences between how Latinos classify
themselves and how they are identified by interviewers using the same
categories have been found even when the interviewers have been Lati-
nos as well (Falcon 1995; Ginorio 1979; Ginorio and Berry 1972;
Martínez 1988; Rodríguez 1974; Rodríguez and Cordero-Guzmán 1992;
Tumin and Feldman 1961).
Other studies examining ancestry, self-classification as Hispanic,
and interviewer identification have found that self-identified Hispanics
are usually labeled as white by interviewers (see Drury, Moy, and Poe
1980; Hahn, Truman, and Barker 1996). In funeral homes, Poe and col-
leagues (1993) found that Hispanics were misclassified as non-Hispanic
136
T H E “ OT H E R R AC E ” O P T I O N
Table 7.1
Hispanics by Race in Current Population Survey and 1990 Census
CPS
a
(%)
1990 Census (%)
White
95.7
51.7
Black
2.2
3.4
American Indian
0.6
0.7
Asian and Pacific Islander
0.3
1.4
Other race
1.5
42.7
Total
100.3
99.9
Total population
21,437
22,354
a
March 1991 Current Population Survey.
Sources: Jorge del Pinal, “Social Science Principles: Forming Race-Ethnic Cate-
gories for Policy Analysis,” paper presented at the Workshop on Race and
Ethnicity Classification, 1994, p. 4. 1990 census data from 5% PUMS (Public
Use Micro Sample) sample.

on 19 percent of death certificates. Nationally, more than half of all His-
panic infants who died within a year (between 1983 and 1985) were
classified as either “white” or “black” on their death certificates, as were
20 percent of Mexican, 48 percent of Puerto Rican, and 67 percent of
Cuban infants (U.S. Office of Management and Budget 1997a:36910).
This may seem morbidly amusing, but it has serious practical implica-
tions for calculating infant mortality rates, for example. Other health
surveys have found similar discrepancies between self-classification as
“Hispanic” and interviewer identification as “white” or “black” (see
Lindan et al. 1990; Massey 1980).
The Format of the Question
The format of the question also has an impact on how Hispanics re-
spond. For example, the mere presence of an Anglo interviewer was
found to influence responses. On the March 1980 Current Population
Survey, Hispanics identified themselves overwhelmingly as “white” to
a census interviewer who presented them with four non-Hispanic
choices (Chevan 1990). One month later, however, when Hispanics
were filling out the census form in the privacy of their own homes and
were offered an “other race” alternative, 40 percent chose the “other”
option (and wrote in a Latino referent). Thus, in the course of one
month, the proportion of white Hispanics fell from 97 percent to 55.6
percent.
How the question is structured or phrased also affects how His-
panics respond. As Chevan (1990) noted, when Latinos are faced with
rigid categories that do not include either a Hispanic or an “other” cat-
egory, most Hispanics choose “white.” This was discovered to be the
case in the 1990 census reinterview studies. Many of those Latinos who
had said on the census form that they were “other race” shifted them-
selves into the “white” category when interviewed later by census per-
sonnel (McKenney et al. 1993). Rodríguez and Cordero-Guzmán (1992)
found that if an open-ended question were used to ask Puerto Ricans
their “race,”
13
a wide variety of responses were elicited, but few said
they were white (11.1%) or black (1.6%). The majority (57.5%) re-
sponded with ethnic descriptors, for example, “Puerto Rican,” “Span-
ish,” or “Latino.”
Part of the question’s context is the presence of other cultural groups
in the census’s race question, for example, Chinese and Japanese. Some
T H E “ OT H E R R AC E ” O P T I O N
137

have argued that this may have prompted Hispanics to respond “other”
and write in a Latino referent (Lowry 1982; Tienda and Ortiz 1986). This
is quite plausible, for the appearance of these groups on the census form
might activate a sense of race more akin to that developed in Latin
America, that is, race as cultural or social (U.S. Bureau of the Census
1992:3; Wagley 1965). The presence of such cultural groups on the cen-
sus form became part of the context to which Latinos responded, and
this induced them to respond culturally as well. This is consistent with
the view that for Hispanics, racial self-classification is very dependent
on context. In this case, the question included other cultural groups like
theirs, and so they responded to the question by also identifying them-
selves culturally.
14
The format—where the question is placed on the census form and
how the question is asked—also influences the responses. The format
and sequencing of the questions and the presence of other cultural
groups in the question were the main reasons offered that Hispanics
checked the “other race” category. In other words, because the format
of the question did not include the word race, the respondents might
have mistakenly assumed that the question was asking about ethnicity.
In addition, because the question about race preceded the question
about Hispanic origin, Hispanics might have assumed that the race
question was asking about their “Hispanicity” or Hispanic origin. Con-
sequently, in 1990 the word race was inserted into the race question nu-
merous times, and in 1997, it was decided to place the Hispanic ques-
tion before the race question in the 2000 census because government re-
search showed that “Hispanics appear less confused by the race
question and do not select the ‘Other’ race category as often” when this
is done (U.S. Office of Management and Budget 1997a:36940).
Even though formatting issues did influence the “other race” re-
sponses, they did not account for all the other race responses. As we
have seen, when the term race was reinserted into the question in 1990,
the proportion of Hispanics saying that they were “other” rose. More-
over, when Martin, DeMaio, and Campanelli (1990) reversed the se-
quence of the race and Hispanic-origin questions in experimental tests
(the Hispanic question was asked first), the percentage of Hispanics
born in the United States who reported “other race” dropped. Foreign-
born Hispanics, however, continued to report that they were “other.”
More recent experiments in which the Hispanic and race items
were reversed resulted in fewer persons reporting they were “other,”
138
T H E “ OT H E R R AC E ” O P T I O N

but the category of “other race” was not eliminated (Bates et al. 1994;
McKenney et al. 1993; U.S. Office of Management and Budget
1995:44679). The most recent and largest government surveys to date
obtained substantially the same findings (U.S. Bureau of the Census
1996a, 1997; U.S. Office of Management and Budget 1997a:36912). As
Bates and colleagues (1995:452, 455) concluded, “Other remained the
preferred race for a large minority.” These studies and their results will
be discussed again in chapter 8.
The Context in Which the Question Is Asked
The context in which the question is asked also influences re-
sponses. From the respondents’ perspective, different contexts may
have particular consequences, as illustrated by the Puerto Rican woman
who commented at a seminar on race: “The only time I respond that I
am ‘white’ on a questionnaire is when I’m applying for a mortgage or a
loan.” Other situational factors affect how Latinos and other groups re-
spond to questions about both race and ethnicity. Johnson and col-
leagues, for example, found that 40 percent of their mixed-race and His-
panic respondents changed the way they reported their racial/ethnic
background depending on the context, social situation, options on
application forms, or “perceived advantages in applying for scholar-
ships, loans, school admissions, housing and employment” (1997:15).
Changes in self-awareness and identification also were responsible for
changes in reported identity. Hispanics with two Hispanic parents were
“much less likely (12.5%) to indicate ever having identified themselves
differently” (p. 15). Esbach and Gomez (1998) found similar contextual
shifts among Hispanic youth, with their identifying more consistently
as Hispanic in urban areas and less consistently in areas with few His-
panics and also among English monolinguals.
WHO CHOOSES THE “OTHER RACE” RESPONSE?
Based on the presumption that the process of Americanization will pro-
duce Americans with similar racial views, we would expect that those
Hispanics reporting that they are “other race” would be more likely to
have been in the United States for the least amount of time and to be for-
eign born, have limited English skills and education, and low levels of
T H E “ OT H E R R AC E ” O P T I O N
139

acculturation. This is not always the case, however. The relationships
between these variables and how Latinos racially classify themselves
are complicated. Bates and colleagues’ multivariate analysis did not
find “conclusive evidence” that educational level, knowledge of Eng-
lish, foreign or U.S. birthplace, or level of acculturation (i.e., whether or
not respondents were immigrants) were consistently associated with
choosing an “other race” response (1995:452–454). Moreover, my analy-
sis of the 1990 census data shows a similarly complex picture. The fol-
lowing section examines the largest Hispanic-origin groups (those with
substantial proportions of U.S.-born individuals over the age of 18)
with regard to each of the preceding variables.
15
Those Least Educated
Do those who choose the “other race” category tend to be less edu-
cated? Yes, but many of those with more education also check “other
race.” As figure 7.1 indicates, the proportion of those who say they are
“other race” does decline for all the major Hispanic-origin groups as ed-
ucational attainment rises, but each group has a different slope and pro-
file.
16
In addition, self-classification as “other” remains substantial in all
groups, regardless of age or educational attainment.
17
It is also consid-
erably larger than the 2 percent or less of non-Latinos who choose the
“other race” category.
In part, the higher numbers of Mexicans and Puerto Ricans indicat-
ing they are “other race” is associated with the fact that they are
younger as a group. With greater age and education, Mexicans and
Puerto Ricans report they are “white” more often and “other race” less
often. For example, in the 1990 census data, more than 73 percent of col-
lege-educated Mexicans (aged 45 to 90) reported they were “white,”
compared with only 41 percent of young Mexicans (aged 18 to 26) who
had an eighth-grade education or less. The respective figures for Puerto
Ricans were 70 percent and 44 percent. Correspondingly, fewer of this
same older, educated group of Mexicans reported they were “other
race” (22%), while more (58%) of the younger, less educated group
chose this option.
The most notable finding in this analysis was that the tendency to
self-classify as “other race” persisted for substantial numbers of all His-
panic groups, despite increasing age and education. Even in the oldest
and most educated group (aged 45 to 90), for which classification as
140
T H E “ OT H E R R AC E ” O P T I O N
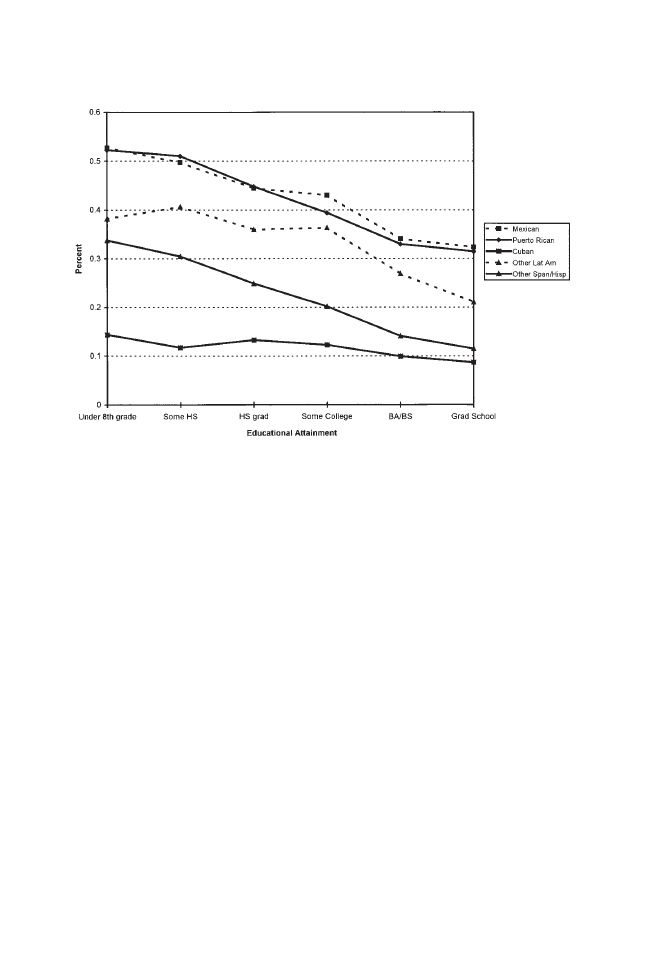
“other” showed the most precipitous decline as educational attainment
rose, 22 percent of Mexicans and 25 percent of Puerto Ricans with a
graduate school education still reported that they were “other.” In ad-
dition, although the cell sizes were small and additional controls were
necessary, there was an intriguing rise in “other race” reporting and fall
in “white” classification for the youngest and most educated group,
that is, those under age thirty-five with some graduate education. These
results are consistent with my earlier work (Rodríguez 1989, 1990,
1991a) on Puerto Ricans in New York in the 1980 census. They suggest
that Hispanics’ tendency to choose the “other race” option is not neces-
sarily the consequence of low educational attainment.
18
The association between higher education and more frequent self-
classification as “white” raises questions about causation. The data in-
dicate that higher education does not always mean a greater likelihood
of classification as white, but the trend is in this direction. Are those
with more education also those seen as white and/or those who see
themselves as white? Or is it that the very process of higher education—
in both Latin America and the United States—induces a change in racial
T H E “ OT H E R R AC E ” O P T I O N
141
FIG. 7.1.
Self-Classification as “Other Race” and Educational Attainment. 1990
Public Use Micro Sample (PUMS) 5% sample.

classification, so that individuals come to see and to identify themselves
as white?
Immigrants or U.S. Born?
Given that the foreign born tend to self-classify themselves differ-
ently than do the U.S. born (Martin, DeMaio, and Campanelli 1990;
McKenny and Bennett 1994:22), we would expect more foreign-born
Hispanics to report they are “other race” and more native-born His-
panics to classify themselves in traditional U.S. racial terms, that is, as
“white,” “black,” or whatever. This is the case, but what is striking is
that there are still relatively high proportions of U.S.-born Hispanics
who choose the “other race” category, especially Mexicans and Puerto
Ricans.
In the three Hispanic-origin groups, with large proportions of U.S.-
born individuals over the age of eighteen—that is, Mexicans, Puerto Ri-
cans, and the “other Spanish/Hispanic” (OSH) group—more U.S.-born
Latinos classified themselves as “white,” “black,” or “API/NAI” than
did their foreign-born counterparts.
19
Solid proportions of the U.S.-born
persons in these groups, however, still classified themselves as “other
race,” for example, 41.62 percent of U.S.-born Mexicans and 42.66 per-
cent of Puerto Ricans born in the states. Figure 7.2 shows this distribu-
tion for the largest group, Mexicans.
20
De la Garza and colleagues obtained similar results from their sam-
ple of 2,817 Latinos in the United States. They found, for example, that
53 percent of foreign-born Mexicans and 44 percent of native-born Mex-
icans chose the “other” category and supplied a Latino referent
(1992:22–23). Finally, my analysis (Rodríguez 1989, 1990) of earlier 1980
census data on Puerto Ricans in New York City found that 48 percent of
both those born in Puerto Rico and those born in the states chose the
“other race” category.
21
In sum, it appears that although a majority of
U.S.-born Latinos choose traditional U.S. race categories, many also
choose other race.
Those Who Speak Spanish at Home
Knowledge of the Spanish language is important to racial classifi-
cation, for it conveys terms, concepts, and perspectives that do not exist
142
T H E “ OT H E R R AC E ” O P T I O N
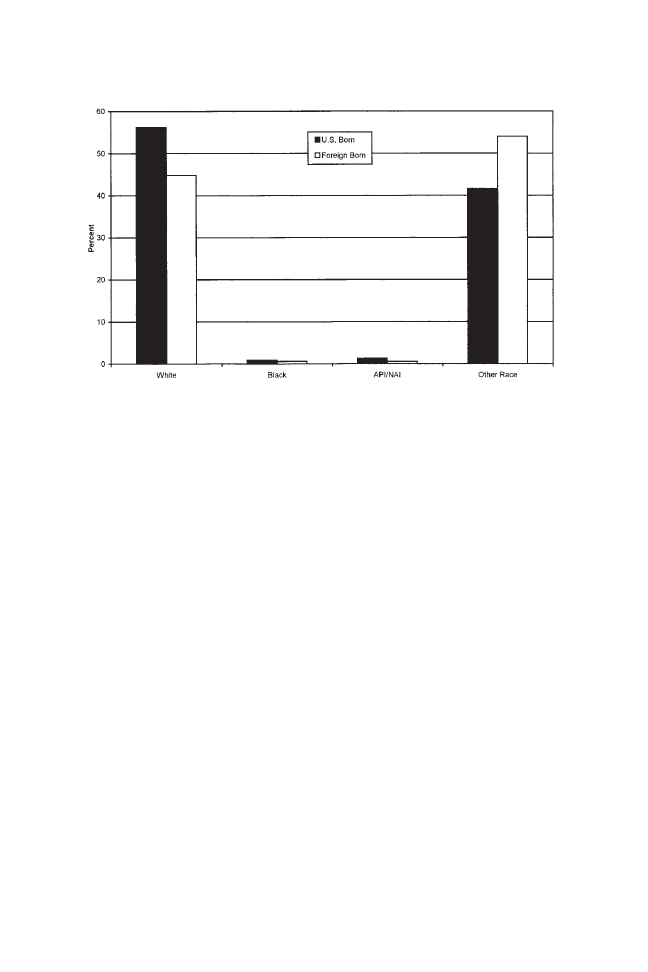
in English. For example, Spanish-language terms for “intermediate”
racial types like trigueño or moreno are incorporated and influence one’s
worldview. This may, in turn, make Latinos more likely to report that
they are “other race,” for they view “racial” identities through different
lenses. The 1990 PUMS (Public Use Micro Sample) data do seem to sup-
port the hypothesis that those who speak only English at home are more
likely to classify themselves in standard U.S. race terms, that is, as
“white,” “black,” or API/NAI.
22
This was true for almost all the His-
panic-origin groups examined.
For example, the percentage of Mexicans who “speak only English
at home” and classify themselves as “other” (37.3%) was considerably
smaller than those who speak Spanish at home (50.5%). For Puerto Ri-
cans, the pattern was the same, with the respective figures being 27.8
percent and 50.3 percent.
23
Consequently, within these admittedly
smaller “English-only” Latino groups, more persons classified them-
selves in traditional U.S. race terms, as “white,” “black,” or “API/
NAI.”
24
These results are consistent with earlier work that found a
higher percentage of those who spoke only English at home reporting
T H E “ OT H E R R AC E ” O P T I O N
143
FIG. 7.2.
Racial Self-Classification of Mexicans, 18 and Over, U.S. Born and For-
eign Born, 1990. API includes Asian and Pacific Islanders; NAI includes Na-
tive Americans. 1990 Public Use Micro Sample (PUMS) 5% sample.

that they were white or black (Rodríguez 1989, 1990). The relationship
of language to racial classification clearly is complex. As Bates and col-
leagues noted, although a knowledge of English was not by itself con-
sistently associated with choosing the “other race” response, speaking
only English at home did seem to influence the choice of more tradi-
tional U.S. race terms. Therefore, speaking Spanish at home may also be
associated with classifying oneself as other race, but more research is
needed in this area (Bates et al. 1995:452–454).
The extent to which the Spanish language is retained and its
racial terminology and constructions are applied is, in turn, affected
by a Latino’s exposure to primary and secondary language environ-
ments. For example, socialization (in a Spanish-language environ-
ment) may be more important than birthplace to determining the
racial self-classification of Hispanics. McKenney and colleagues’
finding (1993) that speaking another language at home is associated
with “inconsistency”—that is, with changing one’s racial classifica-
tion, regardless of one’s proficiency in English—also suggests that ex-
posure to Spanish-language environments is important to retaining
intermediate and alternative views of race. The amount of travel to
one’s country of origin may also affect language retention, assimila-
tion, and racial self-classification. The circular migration and transna-
tional migrations and communities associated with many Hispanic
groups, for example, Puerto Ricans, Dominicans, Colombians, and
Mexicans, are important in this regard.
Other variables may be significant. Rodríguez and Cordero-
Guzmán (1992), for example, found that age, education, and the re-
spondents’ perception of North Americans’ racial perception of them
were strongly related to Puerto Ricans’ racial self-classification.
25
More
research is needed to understand the role of these and other variables in
determining racial self-classification and identity. For example, does
living in areas with a high proportion of Hispanics influence how His-
panics racially classify themselves? What is the effect on Latinos’ self-
classification of living near large (or small) proportions of other
groups?
26
How does national origin, phenotype, or family color con-
stellation—for example, being the darkest sibling in a family—affect
racial self-classification? In particular, we need to investigate why many
Latinos born in the United States continue to classify themselves as
“other” and to write in a Latino referent.
144
T H E “ OT H E R R AC E ” O P T I O N

Those Who Have Been Here the Longest
The research on Latinos who have lived in the United States for a
long time is very limited, and the few data we do have—although
often qualitatively rich and provocative—are preliminary and only
raise more questions. The assumption is if race is socially con-
structed, then “persons migrating from one country to another are
likely to encounter an official schema for classifying origin, race or
ethnicity which is quite foreign to them” (Bates et al. 1995:435). The
question is whether the way that immigrants report their race
changes as their time in the United States increases. The following
studies used different samples, time periods, and methodologies. But
because of these differences and the complexity of the question, the
findings must be interpreted cautiously.
Controlling for age, I found (Rodríguez 1989, 1990) that older,
mainland-born Puerto Ricans in New York City classified themselves as
black and white more often than did younger, mainland-born Puerto
Ricans. I obtained the same result for Puerto Ricans born in Puerto Rico
but now living in New York, that the older they were, the more often
they classified themselves as white or black. However, Rodríguez and
Cordero-Guzmán (1992), controlling for age, education, and how the
Puerto Rican respondents thought they were “racially classified by
North Americans,” found that “length of time in the United States” was
only moderately related to self-classification as white rather than other
race.
Taking an ethnographic approach, Duany examined Dominican
migration to the United States and Puerto Rico and found support for
the restructuring of “cultural conceptions of racial identity,” particu-
larly regarding migration to the United States (1998b:148). He also
found that transnationalism, that is, “back-and-forth” travel patterns,
eroded hegemonic discourses in race and ethnicity in both the sending
and receiving countries (Duany 1998b) and contributed to redefinitions
of identity (Duany 2000).
Bates and colleagues (1995) found that more recent immigrants to
the United States reported that they were “other race” more often than
earlier immigrants did, but these results were not statistically signifi-
cant. Latinos who had lived longer in the United States were also less
affected by the reversal of the race and Hispanic-origin questions and
T H E “ OT H E R R AC E ” O P T I O N
145

tended to choose the white and black categories (Bates et al. 1995).
27
In
essence, reversing the sequence of the race and Hispanic-origin ques-
tions appears to have affected the racial self-classification of Latinos
born in the United States, but not of those born abroad. This is consis-
tent with the hypothesis that greater exposure to the United States in-
creases the tendency to choose the white or black category.
If we compare the racial classification pattern of Hispanic immi-
grants who arrived in the United States before 1980 with those who ar-
rived after 1980, the pattern of racial classification varies considerably
by group. With regard to Mexicans, Puerto Ricans,
28
Colombians, and
Salvadorans, there is little difference in the racial configuration before
and after 1980 (see table 7.2). At the same time, there were substantial
changes among Cubans,
29
Dominicans,
30
and Panamanians.
31
Other
groups also show some, but relatively trivial, changes.
32
It is tempting
to conclude that these observations of racial classification patterns re-
flect an alteration (or the lack thereof) in the racial classification of im-
migrants the longer they live in the United States. It also is possible,
however, that the changes represent a shift in the nature of the migra-
tions before and after 1980 or that changes in the respective countries
are contributing to the differences in racial self-classification patterns,
for example, changes in the way in which “race” is addressed by these
countries’ political leaders.
Taken as a whole, the results of these studies and of more journalis-
tic writings (see, e.g., Escobar 1999), suggest that the amount of time
spent in the United States may not be sufficient by itself to determine
racial self-classification. Just as important may be which years were
spent in the United States or in the country of origin. The childhood
years? Young adult years? Teenage years? Also important is the re-
spondents’ subjective assessment of their time spent in the United
States or their country of origin. This, in turn, may be influenced by
other variables, such as relative socioeconomic status, discrimination,
aspirations, and phenotype. Finally, whether immigrants who have ar-
rived more recently have a different racial-classification pattern than do
those who arrived earlier varies by country of origin. That is, the nature
and timing of immigration streams affect the racial classification pat-
terns of Hispanic groups. The clearest example of this among Latino
groups are the Cuban migrations before Castro and soon after Castro
and the Mariel boat lift (García 1996; Pedraza-Bailey 1985; Portes and
Bach 1985).
146
T H E “ OT H E R R AC E ” O P T I O N

ALTERNATIVE VIEWS OR DENIAL
We also need to understand better whether the phrasing of the question
about racial classification may frame the response. For example, as
noted earlier, an open question on race produced a majority of re-
sponses that referred to what is considered in the United States as “eth-
nicity” but generated a small fraction (12.7%) of responses that con-
formed to traditional U.S. race categories, that is, white and black (Ro-
dríguez and Cordero-Guzmán 1992). A closed question produced
greater numbers of respondents classifying themselves as white or
black, but the same proportion indicating they were “other.” In this
closed question, however, fewer of those who said they were “other”
(20%) used ethnic referents, and the majority (54.5%) used physical ref-
erents; for example, they said they were intermediate or trigueño (a
wheat-colored individual).
If we think of the questions as representing contexts to which indi-
viduals respond, did the open-ended question allow the Latinos in this
study to express their own view of race, and did the closed question re-
strict their response? Even though the open-ended question in the 1992
Rodríguez and Cordero-Guzmán study asked specifically about race, it
T H E “ OT H E R R AC E ” O P T I O N
147
Table 7.2
Percentage Differences, by Racial Classification and Hispanic-Origin Group,
of Immigrants Arriving before and after 1980
White (%)
Black (%)
API/NAI (%) Other (%)
Total
Mexican
-1.98
+0.31
+0.09
+1.76
1,733,947
Puerto Rican
-1.06
-0.19
+0.27
-1.13
251,486
Ecuadoran
-3.37
+0.14
+0.49
+2.73
58,421
Colombian
+1.58
+0.82
-0.24
+1.01
121,534
Guatemalan
-3.49
-0.74
-0.35
+2.39
120,658
Salvadoran
-0.32
+0.2
+0.35
-0.23
264,228
Other Latin American
+4.02
+2.2
+0.39
-5.85
322,604
Other Spanish/Hispanic
-9.64
+2.44
-1.63
+8.83
150,093
Cuban
-7.81
+2.6
+0.15
+5.06
174,328
Dominican
-0.28
+5.6
+0.19
-5.52
153,155
Panamanian
+0.54
-22.62
+2.2
-19.88
264,228
Non-Hispanic
-36.69
+5.06
+31.29
+0.33
3,902,646
Total
-23.77
+2.34
+14.59
+6.85
7,272,937
Figures indicate the percentage difference between pre-1980 and post-1980 immigrants. For example,
the percentage of Mexicans reporting that they were white was lower for the post-1980 immigrants
(43.37%) than for the pre-1980 immigrants (45.35%).
Source: 1990 (Public Use Micro Sample) 1% sample.

yielded several responses that ignored physical attributes, suggesting
that the respondents saw their “race” through their cultural frame of
reference. The closed question and the presence of categories for white
and black, however, introduced a more North American racial context
in which the respondents answered in more physical-racial terms about
themselves. But we do not know to what extent these responses may
have been influenced by the presence of a Latino interviewer.
From another perspective, we might argue that Latinos’ choice of
an ethnic descriptor, as opposed to a racial descriptor, reflects the disin-
clination of many Hispanics to identify as black and that many more
Latinos would be classified or identified as black by others than this
study or the census figures indicate. According to Rodríguez and
Cordero-Guzmán (1992), when the question was closed and the re-
spondents were asked whether they considered themselves to be white,
black, or other, the number who said they were white increased sub-
stantially, from 11.1 percent to 38.8 percent, and those who said they
were black increased slightly, from 1.6 percent to 5.1 percent. The small
proportion who said they were black raises the question of whether
they had an aversion to classifying themselves as black or whether they
really believed that they were simply not identified as black. We also
need to understand better why so few in the study responded “white”
in the first open-ended question.
When Rodríguez and Cordero-Guzmán (1992) asked the respon-
dents how they thought North Americans viewed them, the proportion
answering “black” doubled, from 5.1 to 11.9 percent, and the proportion
assuming they would be seen as “white” fell from 38.8 to 30.5 percent.
This suggests that more in the group thought they would be seen as
“darker” when viewed through North American eyes. But the propor-
tion who thought they would be seen as “other” stayed about the same.
What changed was how they defined “other.” The number of “interme-
diate” or trigueño terms that had been chosen by 30.6 percent of the
group dropped, which is to be expected, since such terms or concepts
are not common in English. The largest percentage of the group that
chose the “other” category (28.5%) thought that they would be seen as
“other, Spanish” or “other, Puerto Rican,” and another 11.5 percent did
not specify the kind of “other.” This shift in responses does indicate co-
existing dual racial contexts and the respondents’ awareness of them.
If there are dual contexts in which the ways of viewing race (or un-
derstanding the question about race) differ and if many Hispanics see
148
T H E “ OT H E R R AC E ” O P T I O N

race as culture, national origin, and so forth, do they distinguish be-
tween the concept of race and that of culture? In the United States, these
two concepts are distinct. In one small study, in which the respondents
were asked to define race and culture (Rodríguez 1992), many saw race
as inseparable and indistinguishable from culture, and others defined
race in geographic terms (as “where they came from”). Still others rec-
ognized an intellectual distinction between race and culture but ig-
nored it in their everyday lives or when describing their own identity or
themselves. Some respondents saw race as “independent of culture”
and responded to questions of race and ethnicity in the way in which
the census expected.
33
McKay and de la Puente’s analysis (1995) of cognitive interviews
contained conceptual questions about race and ethnicity. But they de-
cided that their respondents found the questions too difficult. Their re-
sults thus differed from those of my 1992 study, which might have been
because of different methodologies and samples. McKay and de la
Puente’s 1995 study used seventy-four respondents from various racial
and ethnic backgrounds who had been recruited by community organ-
izations, and my 1992 study used fifty-eight Latinos predominantly
from the Northeast. My questions were “How do you define race?” and
“How do you define culture?” and McKay and de la Puente’s were
“Please tell me what you think is the most important characteristic that
defines race,” and “Do you think there is any difference between race,
ethnicity, and ancestry?”
These results are intriguing but require more research with larger
numbers to find out how other Latino groups in other parts of the coun-
try would respond to standardized questions. What seems apparent at
this point is that many Latinos chose (and will choose) the “other race”
category. Did they do so because they felt culturally or socially “none of
the above” or because they refused to become officially “brown” in the
eyes of North Americans? And what determines racial reporting in the
other categories?
ASIANS, HAITIANS, JAMAICANS, AND RACE
Hispanics were not the only group that did not answer as expected or
that were seen to have problems with the race and ethnicity questions
on the census. For example, in the census’s ethnographic studies, Straus
T H E “ OT H E R R AC E ” O P T I O N
149

noted that of twenty respondents classified as Native Americans in the
Chicago census, only thirteen classified themselves as such in subse-
quent interviews (1991:10). Wingerd found that the Haitians she stud-
ied checked “other race” or left it blank (1995:17), and Bunte and Joseph
discovered that the Cambodians they studied were confused because
they were not specifically listed in the Asian and Pacific Islander cate-
gory (1992:10–11). All these results led to the conclusion that “the way
people view their own ethnic or racial identity and the way they per-
ceive the identity of others is a complex psychological and sociological
phenomenon that needs to be better understood before modifications
are made to the race, Hispanic origin and ancestry questions on the cen-
sus form” (de la Puente 1993:38).
The results of another not-yet published study by the census were
similar (de la Puente 1993). In this study, foreign-born blacks and Asian
and Pacific Islanders in Washington, D.C., San Francisco, and Miami
were interviewed in English and were part of focus groups. This study
also focused on cognitive understandings of race and ethnicity, in order
to determine the extent to which an English-speaking, foreign-born
black’s, Asian’s, or Pacific Islander’s self-concept of race and ethnicity
would result in misreporting, nonresponses, inconsistent responses, or
other problems. It was important, therefore, to understand the respon-
dents’ thought processes and the terms they used when answering
questions about race and ethnicity. For example, how did Haitians or Ja-
maicans view such terms as “African American,” “Afro-American,” or
“black”? Respondents were also asked about the Hispanic question, to
determine how much their culture and beliefs about race and ethnicity
influenced their definitions of race, ethnicity, and ancestry.
The preliminary results indicate that these non-Hispanic groups
also had different views of race, similar to those discussed in chapter 2
as having existed in ancient times and also to those found in research
with Hispanics (Rodríguez 1991c, 1992, 1994a; Rodríguez and Cordero-
Guzmán 1992). In focused, cognitive interviews with twenty Filipinos,
Chinese, Koreans, and Vietnamese, de la Puente (1993) found that the
respondents:
• Tended to interpret “race” as “national origin.”
• If born in the United States, checked “other” and wrote in, for ex-
ample, Chinese American for race, to acknowledge their “dual”
origin.
150
T H E “ OT H E R R AC E ” O P T I O N

• Had some awareness of the U.S. view of race but retained their
own views for self-definition.
• Had trouble understanding terms like ethnic origin and ancestry
because of their limited proficiency in English.
When the respondents finally understood that the census wanted his-
torical information in regard to ancestry, they supplied their national
origin, for example, “Chinese.”
Once we realize that the way race is currently viewed in the United
States is not necessarily the way it is viewed by others or the way it has
been viewed historically, the question of how people view (or viewed)
themselves becomes very interesting. For example, Judy Wingerd ob-
served that in her research, Haitians in Miami considered it almost an
insult to be called black. Instead, the Haitians she interviewed had their
own register of colors and resisted being confined to one color. In Cre-
ole, the term raz (race) is equivalent to “my people,” “the area of the
country I’m from,” or “my history.” These concepts match Latinos’ ex-
planations of why they checked “other race” and wrote in a Latino ref-
erent, such as Puerto Rican, Dominican, or Honduran in response to the
census’s race question (Rodríguez 1992).
EDUCATION AND RACIALIZATION
The role of education may be very important to constructing one’s con-
cept of race. Most of the Haitian interviewees were both poorly edu-
cated and immigrants to the United States, and they could not under-
stand why race and culture were different concepts. Although the
younger people that Wingerd interviewed learned to call themselves
black, some had different interpretations of the word. It may be that the
more education that people have in any country, the more often they are
exposed to either an alternative or the dominant view of race in the
United States.
Summary
In summary, for Latinos, questions concerning “race” are very
much affected by contextual variables, which in turn affect their re-
sponses. The variation in Latinos’ responses (compared with the more
T H E “ OT H E R R AC E ” O P T I O N
151

consistent responses of whites, African Americans, and Asians) reflects
the influence of context. Who asks the question, who answers it, and
how and where it is asked—that is, whether the interviewer is Anglo
and a Hispanic category is a possible choice—the presence of other cul-
tural groups as categories, and the question’s phrasing, structure, place-
ment, format, and purpose all affect Latinos’ responses.
But what also is evident from this review is that many Latinos who
chose the “other race” category saw their “race” as equivalent to their
nationality, culture, familial socialization, birthplace, skin color, ethnic-
ity, or a combination of these. The respondents who answered “other
race” to the race item were not necessarily “mixed” or mixed up, nor
were they forced into the “other” response solely by context. Rather,
they interpreted the question according to their own frame of reference,
which differed from that generally used in the United States. Whether
the tendency to choose “other race” represents (or incorporates) a de-
nial of blackness or an alternative view of race needs further research.
We also must ask whether this question itself reflects the hegemonic na-
ture and pull of the United States’ bipolar racial structure. The U.S. Of-
fice of Management and Budget stated that it changed its data collection
standards and policy because it needed to collect information reflecting
“the increasing diversity of our Nation’s population stemming from
growth in interracial marriages and immigration” (U.S. Office of Man-
agement and Budget 1999:3). Our review of Latinos’ “other race” re-
sponses sheds light on the complex dynamics underlying these
changes; we will examine in the next chapter the political sources ac-
companying these changes.
152
T H E “ OT H E R R AC E ” O P T I O N

8
Redefining Race in 2000
I N N O V E M B E R 1 9 9 3 ,
Congressman Tom Sawyer, chair of the House
Subcommittee on Census, Statistics, and Postal Personnel, completed a
series of hearings on federal measurements of race and ethnicity. There
was nothing particularly remarkable about a series of hearings con-
ducted by a fairly junior congressman, especially when they received
relatively little press attention. What made them extraordinary were
their proposals.
THE PROPOSALS
The hearings focused on four proposals to amend the race item on the
U.S. Census: (1) the addition of a multiracial category, (2) the addition
of a special category for Middle Easterners/Arab Americans, (3) the
shift of Native Hawaiians from the “Asian and Pacific Islander” cate-
gory to the “Native American Indian” category, and (4) the inclusion of
“Hispanic” as a race category.
1
Except for the proposal on Hispanics,
each had been advanced by representatives of the affected constituen-
cies, and government officials and community representatives com-
mented on the proposals (U.S. House of Representatives 1994).
Surprisingly, all four proposals challenged the status quo and the
assumptions inherent in the government’s current racial and ethnic
classification. The proposals also implicitly reinforced the social con-
structedness of race categories and their malleability and susceptibility
to political, intellectual, and social redefinition. But no groups formed
alliances to support any of the proposals.
2
Rather, the one area in which
there was agreement was on the need for more research.
The U.S. Office of Management and Budget (OMB) also agreed at
the hearings to undertake a comprehensive review of the race and eth-
nic categories used by government agencies, as it was responsible for
153

Directive 15, which specified and defined the categories (U.S. House
Committee 1994n). Directive 15 had been issued on May 12, 1977, to
meet the needs created by legislation passed to protect civil rights mon-
itoring and enforcement, as well as the requirements of Public Law 94-
311, passed one year earlier, which called for the collection, analysis,
and publication of economic and social statistics on persons of Spanish
origin and descent.
Multiracial Americans
The multiracial proposal challenged the long-held assumption
that racial categories were (or had to be) mutually exclusive.
3
Whereas all the current racial categories assume one (predominant?)
racial identity, that is, white, black, Asian or Pacific Islander, or Na-
tive American Indian, a multiracial category would acknowledge
that a person could be more than one race. Even the “other” race cat-
egory in the current census race question is mutually exclusive, for
it is the choice to be checked when one is “none of the above.”
4
As
noted earlier, this mutually exclusive way of viewing race has en-
abled North Americans in the United States to think of racial cate-
gories as representing “pure” races (Lee 1993). The extent of mixing
(miscegenation) between, for example, whites and blacks that has
produced “mixed” children has thus been overlooked and the myth
of “pure” races sustained.
Consequently, the possibility that a person might have more than
one racial identity (particularly at the same time) defied the conven-
tional approach to race in the United States. This new approach ques-
tioned the rule of hypodescent—in which one drop of black blood
makes a person racially black (see Davis 1941; Russell, Wilson, and
Hall 1992; and Williamson 1984 for excellent analyses of the evolution
of this racial construction). Despite the traditional, exclusivist way of
viewing race, the concept of multiple identities, which was inherent
in the multiracial proposal, is increasingly viewed as appropriate for
people with various heritages. This concept is particularly relevant to
Hispanics and to other groups as well, for example, the children of in-
terethnic or interracial marriages, ethnically identified Jews, and sec-
ond-generation immigrants from many European, Caribbean, and
Asian countries.
154
R E D E F I N I N G R AC E I N 2 0 0 0

Middle Easterners/Arab Americans
Although the multiracial proposal garnered the greatest media at-
tention, it was the proposal for a “Middle Eastern” category that most
challenged traditional and idealized assumptions about race and eth-
nicity in the United States by pointing to precedents already in place.
The proposal was for a Middle Eastern category, and the Arab Ameri-
can representative who argued in its favor did so on behalf of the pop-
ulation of the entire Middle East. She argued for “an ethnic non-racial
classification for persons from the Middle East”—whether or not Arab
(U.S. House Committee 1994g:183).
5
The Arab American representative
contended that Middle Easterners/Arab Americans deserved their own
category for many of the same reasons that Hispanics and other groups
have their own categories. The arguments presented raised basic ques-
tions about the nature of race and ethnicity, and the way they are deter-
mined in the United States.
One argument was about self-classification versus classification by
others. Middle Easterners and Arab Americans have most recently been
classified by the census as white, although a number of scholars have
noted that the media regard Arabs as nonwhite (Naber 1998; Shaheen
1984; Shohat and Stam 1994). The Arab American representative also
pointed out at the hearings that in their personal lives, many Arabs and
Middle Easterners identified themselves as “people of color” and that
this classification was increasingly influenced by current political and
ideological disputes and representations (U.S. House Committee
1994g).
6
According to one Arab American researcher, some Arab Amer-
icans identify as white, and others as nonwhite, with a broad range of
phenotypical diversity—some Arab Americans have very dark skin
and kinky hair, and others have blonde hair and blue eyes (Naber 1998).
Moreover, some identify as nonwhite because they feel discriminated
against because of their political views or their Muslim identity, which
in mainstream American discourse is seen as different from and inferior
to a white identity (Naber 1998). Thus, some were embracing a not-
white-American position at the same time that they were being classi-
fied by the census as white.
Furthermore, because the census classifies Arab Americans as
white, it is difficult to get a separate count for the group. The represen-
tative argued that such counts were necessary because of current
R E D E F I N I N G R AC E I N 2 0 0 0
155

trends, such as discrimination against Arab Americans in the United
States. This discrimination is seen as related to the politicization of eth-
nicity, in which Arab Americans are often viewed negatively because of
the United States’ changing political relations with some Arab nations.
Another trend noted is the change in rates of immigration, with a more
(physically and socially) diverse stream of Middle Easterners currently
coming to the United States than in the past.
Also mentioned was the current context of pluralism, which en-
couraged immigrant children to respect and be proud of their diversity,
to view their native language as an asset, and to preserve their religious
and cultural practices. The representative noted that the current context
favoring diversity conflicted with the speed with which Middle East-
erners/Arab Americans were becoming Americanized. Consequently,
they would continue as unassimilated (or visible) and persecuted mi-
norities and therefore should be counted separately. In addition, the
Arab American representative pointed to “perhaps a demonstration of
certain cultural disadvantages” that Arab Americans might experience
and to the possibly greater affirmative-action benefits and protections
to be gained as a result of identifying as a minority. These protections
were seen as necessary because of the discrimination against them,
which has been documented by the American Arab Anti-Discrimina-
tion Committee (Ekin and Gorchev 1992).
The Arab American Institute contended as well that both the His-
panic and the Asian and Pacific Islander categories contained models
relevant to the reclassification of Middle Easterners. “The rationale for
the Hispanic classification was to measure a population sharing com-
mon geographic and linguistic roots that could distinguish them from
the rest of the white population” (U.S. House Committee 1994g:188).
The institute pointed out that the Asian and Pacific Islander race cate-
gory was similar in that it transcended precise racial characteristics and
covered a geographical region that represented many nationalities, lan-
guages, and even racial groups.
7
The proposed Arab American category
would include Arabs, Iranians, Turks, Afghans, and others, who, it was
argued, had similar religious, linguistic, and cultural backgrounds;
faced similar discrimination and exclusion; and were distinguishable
from the European-based white majority.
Arab Americans noted a number of fluid and contextually depend-
ent race constructs in the classification of Hispanics and Asians. For ex-
ample, the focus on the increase in politically related discrimination, the
156
R E D E F I N I N G R AC E I N 2 0 0 0

cultural context celebrating diversity, the greater retention of cultural
differences, the greater diversity of the immigrating population, and
the establishment of affirmative-action benefits all are context-depend-
ent factors that influence how those affected view themselves and oth-
ers. Moreover, the representative pointed out, “Just as self-definitions
internal to racial minorities evolve and emerge, the lines between and
around race and ethnicity as identifiers continue to blur, shift and in-
tersect over time” (U.S. House Committee 1994g:188).
8
What was perhaps most interesting in the representative’s presen-
tation is that her request did not represent “a racial redefinition, but
rather a recognition of new realities.” In other words, Arab Americans
were not changing their “race”; rather, their position in American soci-
ety had changed. In essence, they explained that in order to keep up
with the changing realities, Arab Americans should be counted as a sep-
arate group, a new pan-ethnic group (Edmonston, Goldstein, and
Tamayo Lott 1996:33).
Some readers might view the Middle Eastern proposal as an at-
tempt to capitalize on the benefits associated with the shift from an ex-
clusionary to an inclusionary categorization. As a result of the civil
rights movement, categories formerly used to exclude individuals now
have been used to include individuals in affirmative-action programs,
set-asides, and so forth (Fienberg 1994). This shift has introduced, how-
ever, a new tension into the issue of classification, with some groups
wanting to be classified as protected minorities so that they can benefit
from these programs or because they need the programs’ protection.
But it is also possible that—regardless of the benefits to be gained—
Middle Easterners/Arab Americans, like Hispanics and other groups
or individuals, may simply want to be viewed in accordance with their
own self-conceptions of race and identity. Their position reflects a dif-
ferent view of “race,” in which one’s (white or nonwhite) racial status is
seen to bear no relationship to a group’s identity as a group. Indeed, at
a later workshop, the Arab American Institute’s spokesperson insisted
that Arab racial identity is ethnic and not racial (Samhan 1994).
A Middle Eastern category was not established. In its final recom-
mendations, the U.S. Office of Management and Budget noted that es-
tablishing a new category would require a “consensus building effort to
arrive at appropriate terminology and a definition” (U.S. Office of Man-
agement and Budget 1997b:36934). Some of the issues in this group still
requiring resolution were whether the term Arab American or Middle
R E D E F I N I N G R AC E I N 2 0 0 0
157

Eastern should be used. Should the category be defined as pertaining to
persons whose “mother tongue” or culture was Arabic, or should the
definition be more restrictive, and if so, which countries should be
included?
Native Hawaiians
The request by Native Hawaiians to be counted in the “Native
American” category, instead of in the “Asian and Pacific Islanders” cat-
egory, also challenged another tradition: the use of geographic origin
(with its implied biological characteristics) to determine race. Instead,
Native Hawaiians insisted that their history as a conquered and indige-
nous people be acknowledged, and not just their geographic location on
the Asian and Pacific side of the globe.
As Hawaii’s Senator Daniel Akaka explained, “Native Hawaiians
have a unique historical and political relationship with the United
States” (quoted in Omandam 1997), which differs from that of Native
Americans, who claim certain federal benefits based on earlier treaty
agreements in which they exchanged land for perpetual educational
and health provisions. Before 1893, Hawaii’s treaties with the United
States concerned friendship, commerce, and permission for U.S. ships
to enter Hawaiian waters and dock in its ports. Between 1826 and 1893,
the United States recognized Hawaii as a sovereign nation and ex-
tended it full diplomatic recognition. But in 1893, a U.S.-backed military
coup overthrew the constitutional monarchy headed by Queen Lili-
uokalani and in 1898 ceded Hawaiian lands to the United States (U.S.
House Committee 1994o:199). It was in 1920 with the passage of the
Hawaiian Homes Commission Act that Native Hawaiians were first
classified according to a blood quantum definition of 50 percent.
The Hawaiian proposal displayed the U.S. government’s colonial
and imperialist past. In so doing, Native Hawaiians placed themselves
alongside groups like Native Americans, Puerto Ricans, and Spanish
Americans in the Southwest who do not consider themselves immi-
grants to the United States but see themselves as part of the United
States because the United States came to them and took over their land.
Although the Hawaiians’ proposal was not supported, there has been
some change. In the 2000 census, Native Hawaiians are not listed under
the Asian and Pacific Islander category but have their own “Native
Hawaiian” category along with other Pacific Islanders.
158
R E D E F I N I N G R AC E I N 2 0 0 0

Hispanics
Finally, the Hispanic proposal also reflected a radical departure
from current policy. An important difference, however, was that it was
not advanced by the constituent group. The proposal called for the
elimination of the “Hispanic” identifier and the addition of a “His-
panic” race category to the race question. The proposal challenged the
Census Bureau’s official position that race and ethnicity were separate
concepts, and it would reclassify what had been an “ethnic group”—in
which Hispanics could be of any race—to a “race” group, in which all
Hispanics were one race.
The lack of constituent support for the proposal to include Hispan-
ics as a race category was not noted during the hearings. Nor is it clear
who first advanced this proposal. This lack of Hispanic involvement
contrasted sharply with the Hispanics’ earlier involvement with the
census. In 1970, “in response to demands by community groups for a
comprehensive self-identification measure of Hispanic ethnicity,” such
a question was included in the 1970 census long forms, which were sent
to 5 percent of households. This question relied on self-identification
and was not tied to parental birthplace or Spanish surname, as earlier
questions had been (McKenney and Cresce 1993:175–176).
According to Choldin, the census had resisted the demand for a
question in which respondents would identify themselves as “His-
panic,” arguing that it was too late to test such an item and that “ex-
isting procedures for identifying Hispanic individuals were more
valid” (1986:407). But the White House intervened and instructed the
secretary of commerce to add a “Hispanic” self-identifier. Since mil-
lions of questionnaires had already been printed, the compromise
reached was that the question would appear on the long form sent to
5 percent of households. (Only ten thousand copies of the long form
had been printed.) The question was also tested in the 1969 Current
Population Survey.
The results of the 1970 mail-out, mail-back questionnaire were dis-
puted and protested by Mexican American organizations who decided
on a class-action suit. It called for a new category on all the question-
naires and for Mexican-American or Chicano face-to-face, Spanish-
speaking enumerators, using Spanish-language questionnaires. Al-
though the case never went to trial, the House subcommittee did hold
a series of hearings on statistics for “Spanish-speaking Americans.”
9
It
R E D E F I N I N G R AC E I N 2 0 0 0
159

was these political forces that contributed to the emergence of the His-
panic identifier on the 1980 census form.
This sometimes contentious and antagonistic history was not re-
peated during the Sawyer hearings. Indeed, the Hispanic community’s
silence and lack of involvement on the issue of reclassification generally
and on the Hispanic proposal specifically were surprising. It is difficult
to tell whether this resulted from the exclusion and obfuscation of the
issues, a lack of awareness, a lack of Latino interest in the issue or in the
complexity and perhaps perceived irrelevance of the discussions, an in-
herent aversion to discussions of race, a sense that it did not matter how
Hispanics would be classified as long as they were counted, or a com-
bination of all these and other factors.
Although the major, requisite Hispanic organizations were present
at the hearings, few representatives of the Hispanic community testi-
fied. Likewise, there was little coverage of the issue in the Spanish- or
English-language media and few public discussions elsewhere.
When the Mexican American Legal Defense and Education Fund
(MALDEF) and the National Council of La Raza (NCLR) testified at
these hearings, MALDEF indicated that a recommendation on
“whether or how to change the Census’s Hispanic origin and race ques-
tions would be premature” (U.S. House Committee 1994b:179). Both
groups felt that the current Hispanic item should be retained; neither
endorsed the proposal as presented. Moreover, both recommended ad-
ditional research before any change was made, and MALDEF added
that any change contemplated should be targeted to reducing the dif-
ferential undercount (U.S. House Committee 1994k:178–182).
10
Only the National Council of La Raza made a statement at the hear-
ings that was later cited as supporting this proposal (del Pinal 1994;
Wright 1994). Yet a closer reading of the statement shows that by pro-
posing that “Hispanic” be included as a category in the race item, the
council was also requesting that the item be relabeled Race/Ethnicity.
(Its suggested question has this label; see U.S. House Committee
1994p:178.) Moreover, the statement advocated retaining the current
separate “Hispanic” identifier, whereas the proposal being considered
would eliminate it. Perhaps because their position was misinterpreted
by some, the National Council of La Raza decided to clarify its position
to the Office of Management and Budget (OMB): The NCLR “would be
inclined to support the combination of the race and Hispanic origin
questions into a question re-labeled ‘Race/Ethnicity,’ if testing indicates
160
R E D E F I N I N G R AC E I N 2 0 0 0

that such a question solicits a greater and more accurate response rate”
(1995:8, italics in original).
The Census Bureau’s history concerning this issue also received
scant attention in the hearings and other discussions of the proposal.
Earlier, in 1984, the census formed and chaired interagency working
groups (IWGs) to discuss the 1990 federal census data requirements.
These groups were composed mainly of program specialists familiar
with census data and their applications. The IWG on race and ethnicity
supported retaining a separate question on Spanish/Hispanic origin
and concluded that a combined race/Spanish origin question (i.e., to in-
clude “Hispanic” as a race group) “would not meet program needs and
could result in an undercount of the Spanish origin population” (U.S.
Bureau of the Census 1990:5).
In addition, a proposal to count Hispanics as a race was introduced
before the 1990 census but was so strongly opposed “through the most
aggressive campaign ever seen by the bureau” that agency officials de-
cided to abandon it, fearing it would lose needed community support
(Hispanic Link Weekly Report, May 26, 1986, p. 3). Subsequent attempts
by the census to institute such a proposal also were met with similar re-
sistance (McKenney 1994).
A study (done after the proposal was made) did find that a major-
ity of Hispanics preferred the combined question (U.S. Dept. of Labor,
Bureau of Labor Statistics 1995:table 3),
11
but this may reflect a different
understanding of the question. The study’s participants may have un-
derstood it as “Do you want to be included?” rather than “Do you want
to be a ‘race’?” The preference for a combined question probably does
not mean that Hispanics acknowledge or agree that they are a “race” in
the same way that the census conceptualizes this term. Moreover, as
Ruth McKay, a researcher at the Bureau of Labor Statistics, observed,
“The respondents did not understand the consequences of combining
the questions” (Torres 1996:4).
Given the history of the proposal in the Hispanic community and
its lack of apparent support or even involvement, we might ask why the
proposal was presented, and continued to be presented, as a serious
and legitimate proposal. A number of suppositions are possible. Mak-
ing “Hispanics” a race would make life easier for the data gatherers be-
cause there would be one item on the census instead of two and all so-
cial races could be counted directly instead of subtracting Hispanics
from the various race categories. Having a combined question would
R E D E F I N I N G R AC E I N 2 0 0 0
161

also be cheaper for the Census Bureau, as there would be one less item
to tabulate. Indeed, one researcher at the hearings described getting de-
tailed data on various race and ethnic groups as a “cumbersome and
fallible process” (U.S. House Committee 1994m:54).
The proposal would also make the counting of Hispanics consistent
across government agencies. At present, the government counts His-
panics in two ways, the census’s and that specified in Directive 15—the
executive order resulting from a federal interagency agreement in 1977.
Directive 15 places all people into five major racial/ethnic groups:
“white,” “black,” “Asian and Pacific Islander,” “Native American In-
dian,” and “Hispanic.” (The “other race” category is not included.)
12
Those supporting the “Hispanic” race proposal may therefore have
tried to adopt the Directive 15 model. But whereas the directive makes
clear that it refers to both race and ethnicity, the census proposal re-
ferred just to race.
In support of the Hispanic proposal, it could also be argued that the
proposal was more like the Latino view of race in that it presented all
the “social races” together. Apparently, some persons subsequently ex-
pressed support for a combined race/Hispanic-origin question because
“many Hispanics do not identify as a race” and this would end the prac-
tice “of using the term race which they see as a social rather than a sci-
entific construct” (U.S. Office of Management and Budget 1995:44678).
The term used in the proposal, however, was “race,” not “social race”
and not ethnicity; and the proposal did not refer to ethnic or cultural
differences among groups, which are central to Hispanic views of race.
In essence, Hispanics were included in the model, but at the cost of
making them a race within a framework that privileged the white social
race.
Some people may have supported the proposal because they felt it
was simply time to acknowledge a new nonwhite or “other” race in the
census categories. According to their perspective, this new Hispanic
race would span a color continuum from “almost white” to “black.”
Still others (both Hispanic and non-Hispanic) argued that Hispanics
were, for all intents and purposes, a race in the United States and
should therefore be counted as such. The NCLR, for example, noted
that despite the “technical” differences that might be found between
“race” and “ethnicity,” the two terms were really used interchangeably
by society and were synonymous for “Hispanics.” Furthermore, be-
cause Hispanics were treated as a “race,” it was important to be repre-
162
R E D E F I N I N G R AC E I N 2 0 0 0

sented in the race item (see chap. 1; Bendick 1992; de la Garza et
al. 1992:94–95; Del Valle 1993; U.S. General Accounting Office 1990).
Moreover, the lack of a Hispanic “race” category perpetuated the
black/white paradigm, which consistently excluded Hispanics. (How-
ever, as noted earlier, what the NCLR envisioned as a “race” was some-
what different from what was spelled out in the Hispanic proposal.
13
)
Such approaches appeared to argue that Hispanics be called a “race” in
return for recognition, as this might make the counts more accurate, re-
solve the problem of Hispanic invisibility, alter the prevailing black/
white axis and paradigm, and be more in keeping with changing
demographics.
14
Although the proposal to make “Hispanics” a race received some
attention by others testifying at the hearings, it was not enthusiastically
endorsed by anyone. Indeed, some participants were explicitly against
it. For example, Arthur Fletcher, chair of the U.S. Commission on Civil
Rights, stated that the commission recommended “against reclassifying
Hispanics as a racial group” because they were “a complex community
of races bound by common cultural, linguistic and geographic origins”
(U.S. House Committee 1994b:253, 260). Tony Gallegos, chair of the U.S.
Equal Employment Opportunity Commission, believed that the cen-
sus’s successful experience with five racial/ethnic groups precluded
the need for such changes (U.S. House Committee 1994c:285–286).
15
But
the general consensus was that the proposal needed to be tested and its
impact evaluated before it was put into operation (Morris 1994).
In addition, it was clear in the hearings that a multiracial category
would cause more problems than it would solve. Some groups felt such
a category would jeopardize the numbers in their categories. It was not
clear at the time, though, what a “Hispanic race” category would do to
the counts of other minorities. The lack of support continued, and the
Office of Management and Budget concluded that “most Federal agen-
cies did not comment on whether race and Hispanic origin should be
collected in one question or two questions. . . . Those few that com-
mented were split on the issue” (1995:44678).
THE PERSISTENCE OF THE HISPANIC PROPOSAL
Despite the lukewarm reception and earlier resistance, the proposal
continued to be considered seriously. When the Office of Management
R E D E F I N I N G R AC E I N 2 0 0 0
163

and Budget requested comments on the proposals being reviewed for
the “Standards for the Classification of Federal Data on Race and Eth-
nicity” in 1994, it mentioned having “Hispanic as a racial designation,
rather than as a separate ethnic category,” adding that combining race
and Hispanic origin has become one of “the more significant issues that
have been identified for research and testing” (U.S. Office of Manage-
ment and Budget 1995:44690). Hispanic input into the proposal contin-
ued to be minimal. Indeed, by the time the Hispanic Advisory Com-
mittee to the Census was established in 1994, the proposal had already
been discussed and researched. Instead, the meetings of the committee
in 1995/96 were to discuss the findings from the National Content Sur-
vey that had tested this combined question (U.S. General Accounting
Office 1997:8). At subsequent hearings on this proposal, Hispanic in-
volvement did not greatly increase.
Nonetheless, the proposal persisted and became part of a massive
research effort. Of the four proposals presented at the House hearings,
only two were pursued, the “Hispanic” proposal and the multiracial
proposal. The Office of Management and Budget created the Intera-
gency Committee for the Review of the Racial and Ethnic Standards
and, as part of this, an interagency research initiative. This research was
to evaluate the proposals for revising racial and ethnic reporting cate-
gories and to determine the potential effect of any changes.
The Studies
The first study in this research agenda was a supplement to the Cur-
rent Population Survey (CPS) that collected information on several key
issues, one of which was “the effect of adding ‘Hispanic’ to the list of
racial categories” (U.S. Dept. of Labor, Bureau of Labor Statistics
1995:1). The Bureau of Labor Statistics designed the special supplement
to the usual May 1995 Current Population Survey (CPS), so that it could
evaluate how the “inclusion of an Hispanic category in the list of races”
would affect racial and ethnic data (U.S. Office of Management and
Budget 1995:44690).
16
This special supplement surveyed by phone more
than sixty thousand randomly selected households. The census also
conducted cognitive research on this proposal, and by 1995, additional
research plans were made to examine larger samples (U.S. Office of
Management and Budget 1995:44691).
164
R E D E F I N I N G R AC E I N 2 0 0 0

Other agencies were to carry out similar research. For example, the
National Center for Health Statistics, using an approach similar to that
of the Bureau of Labor Statistics (i.e., comparing combined and separate
race and Hispanic-origin questions), was to examine the effects of racial
classification changes on birth certificates. The Centers for Disease Con-
trol and Prevention were to evaluate the recording of racial classifica-
tions on death certificates. The Department of Health and Human Ser-
vices (DHHS) was to conduct a literature search and make an inventory
of DHHS minority health databases. Finally, the National Center for Ed-
ucation Statistics was to examine current issues, state legislation, and
how schools currently collect, maintain, and report racial and ethnic
data (U.S. Office of Management and Budget 1995:44690–44691).
In 1996, the Bureau of the Census conducted two other major stud-
ies. Both sent self-administered, mail-back questionnaires to 90,000
households for the National Content Survey (NCS) and 112,000 house-
holds for the Race and Ethnic Targeted Test (RAETT). The National
Center for Education Statistics and the Office for Civil Rights in the De-
partment of Education conducted surveys in public schools to deter-
mine how they collect data. Finally, the National Center for Health Sta-
tistics, the Office of the Assistant Secretary for Health, and the Centers
for Disease Control and Prevention studied the methods used to gather
data in this area.
The CPS, NCS, and RAETT tested a number of innovations, includ-
ing the introduction of a multiracial category, a proposal to make His-
panics a race (subsequently called the combined format), and the reversal
of the sequence of the race and Hispanic questions. Although several in-
teresting and detailed results were produced, the net result of the CPS,
NCS, and RAETT studies was that the combined format resulted in
fewer Hispanics and whites being counted (U.S. Dept. of Labor, Bureau
of Labor Statistics 1995:table 1).
17
Consequently, the proposal to make
“Hispanic” a race was abandoned.
The Purpose of the Hearings
Why did the proposal to make “Hispanic” a race persist despite its
lukewarm support? To answer this, we should ask, Why did these hear-
ings take place at all? Why were they examining previously unexam-
ined questions? What was their purpose?
R E D E F I N I N G R AC E I N 2 0 0 0
165

A later analysis of the revision process maintained that the OMB
began to consider revising the federal standards for racial and ethnic
classification because of the demographic and social changes taking
place in the United States and because of the increasing dissatisfaction
with the current standard among data users, data providers, and the
public (Edmonston, Goldstein, and Tamayo Lott 1996:35).
18
Thus the
purpose of the hearings was to ascertain whether the way the federal
government measured race and ethnicity was satisfactory. The fact that
this question was being asked at all signaled a major adjustment in the
way that racial and ethnic concepts—until now taken at face value—
might be viewed in the future. The “concerns” expressed at the hearings
hinted at some of the underlying issues that led to this reexamination.
The Concerns Leading to the Hearings
Congressman Thomas Sawyer opened the hearings by citing three
concerns: (1) the identification of multiracial persons, (2) Hispanics and
Middle Easterners who do not identify with any of the four major racial
categories, and (3) self-identification by foreign-born persons whose
understanding of race is often shaped by different definitions and un-
derstandings in their countries or cultures of origin. Although only the
second concern refers specifically to Hispanics, all three pertain to them
because many are foreign born, many are seen to be multiracial, and
many have different views of race.
These concerns raise a number of questions, not the least of which
is why these issues were being addressed in 1993. For example, “the
identification of multiracial persons” implies that there is currently
some interest in, or need to identify, multiracial persons. The last time
that the census counted in a separate category those people whom it
viewed as multiracial was in 1920, when it classified “mulattoes” as a
race category.
The third concern suggests an awareness of alternative views of
race among the foreign born when it acknowledged that the under-
standing of race and “self-identification by foreign-born persons” is
“often shaped by different definitions and understandings in their
countries or cultures of origin.” The second concern, however, “His-
panics and Middle Easterners who do not identify with any of the four
major racial categories,” raises the question of why it is acceptable for
the foreign born, but not the groups called “Hispanics” and “Middle
166
R E D E F I N I N G R AC E I N 2 0 0 0

Easterners,” to have different understandings of race. Was the assump-
tion that these groups were born in the United States and not abroad? If
so, then the real concern was that different understandings of “race”
were persisting among Hispanics and Middle Easterners born in the
United States
Preceding these hearings was a more general questioning and
heightened awareness of the resurgence of racial and ethnic tensions on
an international scale, for example, the Islamic fundamentalists’ con-
flicts. In addition, in the U.S. scientific community there was a major re-
examination of race and ethnicity. The fact that this was receiving spe-
cial attention in the major media added to the need to reconsider the
meaning of race and ethnicity (see, e.g., Barringer 1993; Bernal 1987;
Discover November 1994; Marks 1994; Newsweek February 13, 1995;
Rosin 1994; Wood 1994; Wright 1994).
Congressman Sawyer noted that the stated “concerns” had been
voiced by “many people . . . during the 1990 census” (U.S. House Com-
mittee 1994a). These “many people” may have been those gathering the
data or those constituencies interested in specific census issues. At the
governmental level, the concern began to surface largely because of the
results of the 1980 and 1990 censuses. With the shift in the 1980 decen-
nial census from interviewer-identified race to self-identified race, un-
expected issues and questions emerged. According to a former census
official, the idea of “race and ethnicity” as a state of mind had not been
accepted by the census earlier, but with the shift to self-identified race,
the census recognized that this type of reporting raised other issues
(Estrada 1994).
Data-Quality Problems
Four key problems were discussed in a report submitted to Con-
gressman Sawyer by the General Accounting Office (GAO) earlier
that year:
19
1. The growth of the “other race” category.
2. Problems in the consistency with which some groups reported
their race and Hispanic origin.
3. A high allocation rate for the Hispanic item.
4. Some misreporting problems in both the race and the ethnicity
items.
R E D E F I N I N G R AC E I N 2 0 0 0
167

These were referred to as the “data-quality” issues that led to the
hearings.
Although these issues affected many groups, they particularly con-
cerned the large and growing Latino population. Indeed, a close exam-
ination of the GAO report reveals that Hispanics were at the center of
many of these issues, although this was not noted. For example, His-
panics make up the overwhelming majority (97.5%) of the “other race”
category. Thus, its dramatic growth is due to the fact that Hispanics con-
tinue to choose it, and it is difficult to recode their national-origin re-
sponses into other race categories.
With regard to the second problem, the extent to which individuals
consistently give the same response to questions of race and Hispanic
origin, many Hispanics changed their answers in reinterview studies
and in response to a series of contextual factors, whereas other groups
did not. The GAO’s report noted that only 36 percent of those who said
on the census form that they were “other race” said that again when
reinterviewed. The report did not specify whether most of these re-
spondents were Hispanic, but they likely were because they made up
95 percent of this category (U.S. General Accounting Office 1993).
20
Curiously, although “consistency” was a problem when answering
“race” questions, responses to the “Hispanic” question were highly
consistent, with 90 percent of Mexicans, 92 percent of Puerto Ricans, 86
percent of Cubans, and 100 percent of “those who said they were non-
Hispanic” responding the same way on both occasions. The exceptions
here were those who said they were “other Hispanic,” with only 64 per-
cent answering similarly in the reinterview study.
168
R E D E F I N I N G R AC E I N 2 0 0 0
Table 8.1
Percentage of Hispanics Choosing “Other Race”
in Different Question Formats
Race
Hispanic
Multiracial
Percentage Choosing
Question
Question
Category
“Other Race”
First
Included
33.0
First
Not included
42.9
First
Included
25.1
First
Not included
24.9
Source: U.S. Bureau of the Census, National Content Survey 1996a:tables 11
and 12.

On the third problem, it was also the “Hispanic” item that had the
highest allocation rate.
21
The Census Bureau allocates a particular re-
sponse for questions left unanswered on the census questionnaire. This
allocation procedure is based on a complicated series of steps for each
item that best approximates the missing information.
The allocation rate for the Hispanic-origin question was not only
the highest of all the questions, but it also increased from 4.2 percent in
1980 to 10 percent.
22
This was seen as particularly problematic: “The re-
sults from the 1990 census showed that the Hispanic-origin item con-
tinues to pose one of the more significant data quality challenges for the
Bureau in terms of allocation rate” (U.S. General Accounting Office
1993:24).
Why was the allocation rate so high for the Hispanic question in
1990? Why did 10 percent not answer the question about whether they
were Hispanic? The GAO report saw two underlying problems: One
was that many persons who were not Hispanic skipped the question al-
together because they did not see it as relevant.
23
Another problem was
that some Hispanics “equate their ‘Hispanicity’ with race by respond-
ing ‘other race’ in the race item, indicating they are Hispanic in the
space the race item provides, and then skipping over the Hispanic ori-
gin item because they see this item as superfluous” (U.S. General Ac-
counting Office 1993:25). That is, “confusion” about the race item might
have spilled over to problems with the Hispanic-origin item. The GAO
report does not explain what it means by “confusion” with the race
item, the implication is that it refers to Hispanics’ responding they are
“other race.” Two years later, the OMB stated that most of those who
did not respond to the “Hispanic” item were non-Hispanics (U.S. Office
of Management and Budget 1995:44689). Consequently, the reason for
the high nonresponse rate for the “Hispanic” item was more that non-
Hispanics saw the question as irrelevant to them than that Hispanics
were “confused.”
The last problem, misreporting, refers to several problems but is
seen to be principally the result of mistakes or misinformation. An ex-
ample is those who responded they were “other Hispanic” and later
said in the reinterview studies that they were not Hispanic at all but
wanted to indicate they were “other than Span/Hisp.”
24
Examples of
misreporting in the race question are those who checked the “other
race” category and wrote in a response that the census reclassified as
R E D E F I N I N G R AC E I N 2 0 0 0
169

one of the other four race categories, so “German” in “other race” was
reclassified as “white.” The report does not make clear to what extent
Hispanics were involved in this problem. Indeed, it is these early re-
ports’ lack of reference to Hispanics’ specific reporting behavior that is
most puzzling, particularly because Hispanics were so central to many
of the concerns raised at the hearing.
25
These problems notwithstanding, the GAO report concluded that
the 1990 data on race and Hispanic origin were “generally of high
quality” (U.S. General Accounting Office 1993:28). The report did
note a growing awareness of the population’s increasing diversity,
but it was not Hispanics to whom it was alluding; rather, the report
cited the more than 200,000 codes that had to be developed to accom-
modate all the write-ins in the “Asian and Pacific Islander,” “Native
American Indian,” and “other race” categories (U.S. General Ac-
counting Office 1993:28). The responses that produced the greatest
number of codes because of write-in responses were the Ancestry and
the Native American Indian items (Edmonston, Goldstein, and
Tamayo Lott 1996:23).
FINDINGS FROM THE GOVERNMENT’S STUDIES
• Regardless of the format used, a substantial proportion of the an-
swers remain in the “other race” category.
An important part of the “data-quality” issues addressed was the re-
spondents’ tendency to choose the “other race” category. As we now
know, almost all those (97%) in this category were Hispanic. The pur-
pose of the proposal to make “Hispanic” a race was to reduce the num-
ber of persons choosing the “other race” category. I suspect that the rea-
soning was that if Hispanics saw their group represented with the oth-
ers, they would choose “Hispanic” and not “other race.” In all three
studies, when Hispanics were made a race; that is, when the combined
question was used, the number of persons who chose the “other race”
option dropped. But what the studies showed was that regardless of the
context of the question, for example, whether or not a multiracial cate-
gory was included or whether multiple responses were allowed, many
people still chose the “other race” category.
170
R E D E F I N I N G R AC E I N 2 0 0 0

Sequencing was also thought to affect whether Hispanics chose the
“other race” option; that is, if Hispanics were asked about their His-
panic origin first, they would not choose “other race.” In all three stud-
ies, placing the “Hispanic” question before the “race” question did re-
duce—but did not eliminate—the number of persons choosing the
“other race” option.
An example of this adherence to the “other race” response can be
seen in the NCS study in which respondents were asked to choose their
race under what might be considered—from a statistician’s perspec-
tive—fitting conditions for discouraging an “other race” response (U.S.
Bureau of the Census 1996a). Ideal conditions meant including a “mul-
tiracial” category (so that those of mixed race could choose it) and plac-
ing the “Hispanic” question before the race question (so that those who
saw “race” as “culture” and “national origin” would have already iden-
tified themselves as such and could now choose their race). Under these
conditions, the proportion choosing “other race” did decline, but 25.17
percent of Hispanics still chose this option (see table 8.1). (Although this
was a substantial proportion, it was not statistically significant.)
26
• Hispanics choose more than one category even when instructed
not to.
Two other findings from these studies are relevant. One is that when the
combined question was used in the RAETT test, a high percentage of re-
spondents (18% to 19%) checked that they were Hispanic and also
checked one of the other race categories. Indeed, the Hispanic respon-
dents checked more than one category even when they were instructed
not to do so (U.S. Bureau of the Census 1997:4, chart I). Although the re-
sults of the RAETT test can be generalized only to areas with relatively
high concentrations of Hispanics and other targeted populations, it is
interesting that the census’s Hispanic Advisory Committee recom-
mended that respondents be allowed to choose “more than one” cate-
gory on the “Hispanic” item as well. In other words, the committee
thought it important that respondents be able to say they were both
“Hispanic” and “not Hispanic” (those who might want to acknowledge
a Hispanic component as well as a white, black, etc. component in their
response). This recommendation was considered but not accepted be-
cause it had not been tested.
R E D E F I N I N G R AC E I N 2 0 0 0
171

• The responses of Hispanic-origin groups differed.
Finally, some of the studies showed that the various Hispanic-origin
groups responded differently to the questions. For example, in the CPS
study, when having to choose the “Hispanic” or another category in the
combined question, a minority of Cubans (39.92%) chose the “His-
panic” category, compared with a majority of Mexicans (85.15%),
Puerto Ricans (71.51%), and Central or South Americans (77.67%). The
introduction of a multiracial category increased the percentage of
Cubans who chose the “Hispanic” category, but it was still only 46.40
percent. In the other Hispanic groups, the percentage choosing the
“Hispanic” category also increased slightly or stayed about the same
(U.S. Office of Management and Budget, 1997a:36916, table 4.4). These
results are consistent with those cited in chapter 7 regarding who
chooses the “other race” option.
• Why Did Hispanics Choose “Other Race”?
As noted earlier, the reasons that some Hispanics continued to choose
the “other race” category are complex and require further research. To
some degree, the context and format of the question influence the
choice. But the choice also reflects different conceptions of “race” and
perhaps a resistance to the racial structure as articulated in the United
States. This resistance may be traced to Hispanics’ objections to being
classified as a uniform, subordinate, not-white race. Or it may irritate
Hispanics who see themselves as physically diverse and defined by na-
tional origin or culture. In either case, making “Hispanic” a race may
have been seen as a perpetuation and extension of the racialist thinking
of the past.
The OMB’s final recommendations cite findings that both sup-
ported and did not support separate race and Hispanic-origin ques-
tions. Those findings that did not support a combined question were
that the concepts of race and ethnicity were difficult to separate; that
Hispanics want to identify their race in addition to their Hispanic ori-
gin; that some Hispanics, including the Census Hispanic Advisory
Committee and most Hispanic organizations, opposed a single, com-
bined question; that “Hispanic” was not considered a race by some re-
spondents and users; and, finally, that a combined question would in-
crease the need for additional tabulations because people would choose
172
R E D E F I N I N G R AC E I N 2 0 0 0

more than one category. Those findings that did support a single, com-
bined question indicated that it would eliminate redundancy, thereby
acknowledging that for many Hispanics, race, culture, and national ori-
gin are the same.
Race in Formation
The OMB finally decided to retain the two-question format, but it
also decided to allow individuals to choose more than one category.
27
Moreover, it recommended that when self-identification was not feasi-
ble or appropriate, a combined question could be used (U.S. Office of
Management and Budget 1997a:36930, 36939). The recommendation
that a combined question be used when self-identification was not pos-
sible suggested that attempts be made “to obtain proxy responses (from
family or friends) as opposed to using observer identification” in order
to ensure accurate data.
Unresolved Issues
According to the Office of Management and Budget, government
research shows that less than 2 percent of persons are expected to
choose more than one race category (U.S. Office of Management and
Budget 1999:4; Tucker et al. 1996). The preliminary Census 2000 Dress
Rehearsal Results, although not representative of the country as a
whole, also do not show many persons choosing more than one cate-
gory (del Pinal 1999). Therefore, the OMB does not anticipate any sig-
nificant impact on redistricting decisions or on total population counts
used for apportionment or for compliance with one-person, one-vote
requirements because of the “choose more than one” option (U.S. Office
of Management and Budget 1999:33 ff). But other researchers estimate
that the impact will be larger, that this shift may be greater than the net
size of the undercount (Goldstein and Morning 1999). Moreover, they
estimate that this shift will have different effects on the single-race
groups, with whites declining between 3 and 6 percent, blacks between
3 and 7 percent, Native Americans between 15 and 25 percent, and
Asian and Pacific Islanders between 4 and 9 percent.
This change in practice and policy has been put into effect. But
at this writing, there still are a number of unknowns. Unknown (and
not included in the preceding estimates) is the role of the media in
R E D E F I N I N G R AC E I N 2 0 0 0
173

influencing individuals to “choose more than one.” Also unknown are
the implications for race-based public policies. As Goldstein and Morn-
ing (1999) asked, Will people who in the past said they were white and
now claim Native American Indian ancestors in the race question be el-
igible for minority small business loans? Will those who previously said
they were only black and now say they are white and black no longer
be eligible? Should some individuals (or groups) of more than one race
be protected classes and others not? For example, if those of Japanese-
white ancestry are economically more advantaged than those of Viet-
namese-black ancestry, should the latter be protected but not the for-
mer? Last, it is not known how the data should be tabulated. A number
of possibilities are under discussion, but no firm decision has been
made (U.S. Office of Management and Budget 1999).
Issues Raised
The “Hispanic” proposal, as well as the other proposals discussed
at the initial hearings, raise a number of issues. They—and the events
that followed these hearings—also revealed the dynamics of racial for-
mation as we approach the next millennium. All the proposals made
clear the extent to which race and the construction of racial categories
are influenced by nonbiological factors, although this was seldom rec-
ognized or expressed.
On a theoretical level, the proposal to make “Hispanic” a race
raised the issue of how Hispanics should be counted. Should they be
treated as a European ethnic group (albeit multiracial) or as a separate
race? The first approach was (and is now) the one in effect in the census:
Hispanics could be of any race. The second approach implied that His-
panics were seen (and saw themselves?) as a distinct social group—a
race—regardless of phenotype.
Hispanics, as well as many other groups, challenge the U.S. system
of racial classification because they do not fit neatly into the given cate-
gories. They are neither a race nor a racially homogenous ethnic group.
Rather, they are a diverse array of multiracial ethnic groups, bound to-
gether by language, cultural ancestry, and discrimination in the United
States. They can best be understood in a paradigm acknowledging that
the social constructions popularly called “race” are really all social
groupings that convey political, social, and cultural differentials.
Within such a paradigm, Latinos and other “races” are clustered eth-
174
R E D E F I N I N G R AC E I N 2 0 0 0

nicities in a hierarchy of power growing out of the history of whites and
other social races in the United States.
Hispanics contributed significantly, albeit silently, to the concerns
voiced and to the “data-quality” issues raised that prompted the hear-
ings and subsequent research. Indeed, it might be said that Hispanics
have come to redefine everyone else, as in the use of terms such as “non-
Hispanic whites” and “non-Hispanic blacks.” An interesting irony here
is that at the same time that the influx of Hispanics led to the redefini-
tion of all other groups, the government attempted to redefine Hispan-
ics as a race. Just as in 1930 when the government introduced a “Mexi-
can” race category, as we end the twentieth century, the government is
proposing to create a race category for all Hispanics. The increase in
numbers at both times contributed strongly to these racial classification
projects.
The “Hispanic” proposal also highlighted the role played by “race”
or color in the United States. Making “Hispanic” a race and eliminating
a separate “Hispanic” identifier would not allow individuals to re-
spond that they were, for example, both Hispanic and black (U.S.
House Committee 1994k:179). As noted previously, research has shown
that Hispanics who classify themselves as white or who are classified as
white by others fare better economically than those classified in other
racial categories (Arce, Murguía, and Frisbie 1987; Rodríguez 1990,
1991a, 1992; U.S. Office of Management and Budget 1995:44678; Telles
and Murguía 1990). Using one combined question might make it more
difficult to determine which Hispanics are more likely to be victims of
discrimination. In addition, making “Hispanic” a race would make it
difficult to compare the data with past censuses. Finally, a combined
question might also dilute the counts of other race groups; for example,
Hispanics who in the past might have reported that they were “black”
or “white” might indicate instead that they were “Hispanic” (U.S. Of-
fice of Management and Budget 1995:44678). As Rachel A. Joseph ar-
gued, the counts and comparability of counts over time of Native
Americans would be affected adversely by making “Hispanic” a race
(U.S. House Committee 1994l). In 1990, 165,000 (or 8.5%) of the 2 million
who said they were “Native American Indian” also reported that they
were of Hispanic origin.
28
The hearings and the subsequent process showed “race” in forma-
tion. They showed, and sometimes acknowledged, the difficulties and
contradictions of the current racial classification structure. While in the
R E D E F I N I N G R AC E I N 2 0 0 0
175

past and in public discourse, racial and ethnic concepts had often been
projected as fairly immutable and not subject to diverse interpretations,
it was now being publicly acknowledged on a national level that these
concepts were not mutually exclusive but were fluid and “dynamic”
(U.S. House Committee 1994f).
29
Thus, on the one (conceptual) hand,
the intermingling of the concepts was recognized, but on the other
(practical or applied) hand, the concepts were treated as separate.
In stating the “lessons” from the hearings, Congressman Sawyer
stated that “the categories had to be relevant to those responding if co-
operation was to be secured.” This revealed the growing official con-
cern that current categories might not be relevant to some respon-
dents.
30
This lesson also raises questions about the government’s ability
to identify individuals correctly and clearly. In addition, it suggests an
emerging awareness of procrustean census tactics on the part of gov-
ernment officials. Last, it poses the question of whether there is a con-
flict between providing recognizable categories that are relevant to re-
spondents and needing to gather uniform, comparative data.
Although the stated concerns and the final formulations raised a
number of questions, taken in concert they suggest the extent to which
“race” and “ethnicity” are being reassessed in the public sphere. They
also reveal a changing demographic picture as well as a serious reex-
amination of race by academics and policymakers that may be having a
significant influence on public discourse. The hearings also demon-
strated that the government is beginning to question its former views
on race and ethnicity and to explore alternative views.
The final determination of how race and ethnicity will be measured
or viewed in the next century will depend on several factors. Demo-
graphic diversity will continue. Individuals and groups will continue to
have their own particular and changing views on race. The incidence of
intermarriage and the number of interracial individuals will also con-
tinue to grow. Consequently, if we are to understand the growing di-
versity of this country, we must improve our understanding of how
people view themselves.
176
R E D E F I N I N G R AC E I N 2 0 0 0

Appendix A
Data Limitations and the Undercount
When we examine data on the racial self-classification of individuals,
we assume that the data reflect individual choice. But we do not know
who fills out the census form and how the “race” of each person in a
household is determined. Generally, one person in the household fills
out the census forms, but which person that is, the mother, father, eld-
est son, or whoever, may affect the racial classifications recorded.
The data on Hispanics do not include Brazilians, but they do in-
clude persons from Spain. Although Brazilians are not considered His-
panic because they do not speak Spanish, many Brazilians consider
themselves Latinos, though not usually Hispanics.
THE UNDOCUMENTED AND THE UNDERCOUNT
We do not know how many undocumented persons are included in
contemporary census data, but we know that Latinos make up a large
proportion of the growing numbers of both undocumented and docu-
mented immigrants. Different methods yield different estimates of the
undocumented, with the total number ranging from 2 million to 5 mil-
lion (Passel and Woodrow 1984; Woodrow-Lafield 1992, 1993). But be-
cause we do not have estimates of how many undocumented are
counted in the census data, we must assume that they underestimate
the numbers of Latinos, though we do not know by how much. Despite
this underestimation, the numbers of Latinos have increased dramati-
cally. As we have noted, in 1997 the U.S. population “officially” con-
tained 29.7 million Latinos, or 11 percent of the total (Reed and Ramirez
1998:table 1). In 1999, the official figure was 31.365 million. The Latino
population is also expected to continue to grow substantially. It ac-
177

counts for almost half of contemporary immigration (Passel 1993:1076),
and it comprises 42.5 percent of the United States’ total foreign-born
population (U.S. Bureau of the Census 1993c). This also is a population
with a very high birthrate and a youthful median age, so that it would
continue to grow even if all immigration were to cease.
Somewhat separate from, but also related to, the undocumented
issue is the undercount issue. Even though the Latino communities
are large, growing, and diverse, Latino undercount rates have not
been studied extensively. Hispanics are often not included in analyses
because the data used are limited to race. For example, a historical
analysis of undercount rates from 1940 to 1990 by Robinson and col-
leagues (1993) did not include Hispanic undercount rates. The official
1990 undercount estimate for Hispanics is 5.2 percent (Hispanic Link,
August 1994, p.2), but this seems conservative, given the large num-
ber of estimated undocumented and documented Latino immigrants
(Passel 1993:1076; Passel and Woodrow 1984; Woodrow-Lafield 1992,
1993). Given the diversity and rapid growth of the Hispanic popula-
tion, it is surprising that the Hispanic undercount has not received
more attention.
In general, undercount rates overall have been found to vary
widely by age, race, geography, and homeownership status, with black
males having consistently higher rates over time than the total popula-
tion (Hogan 1993; Robinson et al. 1993). Hogan’s (1993) analysis of 1990
undercount rates indicates that the rates for Hispanics also varied
widely. For example, Latinos who did not own property but lived in
large urbanized areas of the Northeast were undercounted by an esti-
mated 6.72 percent, but if they lived in similar areas of the Midwest and
owned property, they were overcounted by 4.33 percent.
DIFFERENT METHODS, DIFFERENT ESTIMATES
Why the undercount rates differ is very complicated, particularly for
Latinos because of how they identify or are identified racially. Both may
affect the undercount estimates (Passel 1993:1076). If Hispanics are re-
ported as “white” in vital statistics data or if they report themselves as
“other” or “black” in census data, they will be counted in these cate-
gories and not as “Hispanics.” If Hispanics are reassigned to a “His-
panic” category, estimates of undercount or any other counts will be un-
178
A P P E N D I X A

derstated (see U.S. Bureau of the Census 1992 for estimates of these
effects).
1
How Hispanics identify household units also affects undercounts.
Examining the census’s Current Population Survey, McKay (1993)
found that Hispanics often omitted boarders as part of the household.
Or the census takers would not recognize that a housing unit might
have more than one household living in it. As do members of many
African American communities, respondents distinguished between
people who were “living with” and those who were “staying with” a
family unit. Thus, boarders or people who were “staying with” them
were often not counted.
There are many reasons that individuals are not counted in the cen-
sus. One is that they are missed because they live in irregular and com-
plex household arrangements. Some households were not counted be-
cause their living quarters were not visible to postal clerks because they
were, for example, behind and/or above a commercial establishment.
Other reasons are that people move, fear government and outsiders,
and speak English poorly (de la Puente 1993).
OMISSIONS
Besides not being counted by the census, respondents may not supply
all the information asked for on the census forms. Fein (1990) examined
the causes of census omissions among different racial and ethnic groups
and found some factors that were common “sources of omission” for
different groups and other factors that were unique to particular
groups.
2
He concluded that because 40 percent of the differences among
groups could not be explained by the available indicators, “idiosyn-
cratic social, cultural, and economic aspects of ethnicity constitute
major sources of census omission” (Fein 1990:297). Certain groups—
blacks, Mexican Americans, and Puerto Ricans—were less motivated to
fill out forms than other groups were (non-Hispanic whites, other His-
panics, and Asian and Native Americans).
3
Puerto Ricans had the high-
est omission rate, followed by blacks, Mexicans, other Hispanics,
Asians, and Native Americans.
Most interesting was Fein’s conclusion that for Puerto Ricans, ed-
ucation seemed to measure something other than the respondent’s
ability (1990:296). In other words, those who most often omitted
A P P E N D I X A
179

information were those with the most education. Thus, although
most of the reasons for the undercount are straightforward, such as
household structure and fear of government, apparently other, less
tangible factors influence it as well.
IMPLICATIONS
One result of the scanty research on the Latino undercount is that we do
not have a clear view of the parameters of this population and its future
impact on the United States. This affects the “visibility”—or the lack of
it—of the Latino population at all levels, but particularly at the policy
level. More generally, given the size and rapid growth of this popula-
tion, such data are important to general analyses of the population.
Other implications pertain to current practice. Both Passel (1993:
1076) and Vobejda (1991:9) observed that individuals who checked
“other race” on the census forms were reclassified to determine under-
count estimates. The Census Bureau estimates undercounts by compar-
ing their population counts with birth, death, and immigration records.
In order to match the census numbers to those administrative records
that do not use an “other race” category, the bureau had to reassign
racial categories to those who designated “other race” on the census. As
noted earlier, about 43 percent of Hispanics in the nation (or approxi-
mately 9 million persons) chose the “other race” option, making up
more than 97 percent of the “other race” category. These assignments to
standard race categories are increasingly problematic (Passel 1993:
1076), and they also present a picture different from that given by the
census without these reassignments.
Also not well studied is how this practice affects the socioeconomic
and health profiles of the resulting categories. Would, for example,
whites’ median income be higher without this reassignment? This may
not be a problem at the national level at which the impact is not great,
but what about at the local level or in geographic areas where substan-
tial numbers of Latinos live? When just racial data are examined and
Hispanics have not been selected out, the question of how the presence
of Hispanics in all those categories influences results is seldom ad-
dressed or considered.
A final implication again involves an undercount. Despite issuing
an official undercount estimate, the census figures were not revised to
180
A P P E N D I X A

include it, thus negatively affecting the representation of Latinos. Ac-
cording to an article in Hispanic Link (August 1994:2), including under-
count figures could have benefited districts with large Latino popula-
tions. Areas such as southern California, Texas, and New York would
likely have made adjustments that could have increased the represen-
tation of Latinos. Also, changing the figures might have created an extra
congressional seat for both California and Arizona, though at the ex-
pense of Wisconsin and Pennsylvania. Moreover, it could have gener-
ated more income for Los Angeles and New York City, the latter the pri-
mary plaintiff in the undercount suit. (For comprehensive analyses of
the litigation of the 1990 undercount suit, see Anderson and Fienberg
1999.)
A P P E N D I X A
181

Appendix B
The Biological Concept of Race in the United States
The biological concepts of race and its implicit assumptions have been
challenged on a number of grounds.
IT IS ILLOGICAL
The concept of “pure races,” which underlies the biological concept
of race in the United States, has been shown to be illogical and to be
disregarded by many today. For example, in the past when people
from two U.S. race categories had a child, the child was placed in the
same category as the nonwhite parent; that is, the “hypodescent rule”
was applied. The child was considered—as the prefix hypo- implies—
less than white; thus he was nonwhite.
1
Even though the child was
half white and half black, he was placed in the “black” category and
was viewed as solely black and not in any way white. In essence, and
contrary to logic, even though the child was not purely “black,” he
was classified as being so.
In the case of a child of two nonwhites, other considerations entered
the picture, such as physical type and socialization, but generally black
ancestry predominated in classification, and the child was classified as
“black.” In neither instance was “purity” a factor, but the classification
as only one race contributed to the myth of racial purity. Race was a
master status, and considerations of ethnicity or culture were relegated
to issues of color and race.
Contemporary practice, which allows people to choose their own
race, shows that the majority of Asian/white couples state that the race
of their children is “white.”
2
In the case of Native American/white
unions, the race reported for children tends to be consistent with that of
182

the mother, regardless of whether she is Native American or white.
Only in the case of black/white unions are the majority of children
given the race of the black parent, regardless of whether this is the fa-
ther or the mother. Yet even in this case, the majority is just 66 percent
(Bennett, McKenney, and Harrison 1995:18, 35–36, 22). Thus, present-
day racial self-classifications deviate from earlier approaches, making
racial categories even less “pure.”
GROUPS ARE NOT REALLY JUST ONE COLOR
Second, the concept of race, particularly as it has been constructed and
understood in the United States, has been criticized on the grounds that
people are not really one color. For example, people “who are called
‘white’ are really pinkish, light grayish, creamy, very light brown,
ruddy reddish and so on. Few are truly white-white. The term is sym-
bolic and non-specific. The same is true of the term ‘black’” (Forbes
1988:95). Lee observed that some “white”-looking people are classified
as “black” and that some whites are darker in color than are some non-
whites, for example, Asians; that not all “blacks” are black; and that
most whites are really “pinkish-yellowish.” The theory here (i.e., the
color categories) differs from the reality. Or as Lee phrased it, there is a
variance between the ideology of beliefs and the reality of observations
(1993:93).
OTHER VARIABLES AND CONTEXT ARE IMPORTANT
According to Forbes, the classification of “many dark, curly-haired Ital-
ians, Egyptians and Middle Eastern-South Asian groups” as white has
been based more on the recognition of their political and cultural ac-
complishments than on their physical resemblance to blond Scandina-
vians. It seems that many of these “so-called Caucasoid groups could
just as well be regarded as being non-white or intermediate (mixed)
types of people” (1990:6–7).
Although color terms are used, cultural, political, and economic
variables enter the racial calculus as well, and race often depends on
context (Haney López 1996:xiii). Contexts affecting racial classification
include the political/legal, social, and economic frameworks that
A P P E N D I X B
183

encompass individuals and groups. These contexts vary over time, and
implicit in these frameworks are variables that influence racial and eth-
nic classifications, for example, national origin, religion, language, mi-
nority status, tribal membership (Bates et al. 1995:433–435), or the vari-
ables mentioned in the introduction to this book (Leets, Clement, and
Giles 1996:2).
In short, considerations other than color or biological ancestry are
important to constructing these categories and classifying individuals.
For example, many persons are put into the “red” group because they
are seen, or they see themselves, as members of a political unit called a
tribe or a nation. They are not “red” in color. Others are “black” because
their ancestors were classified as “black” or because currently they
identify culturally, politically, or spiritually with this group. Some peo-
ple alter their classification as “white” and become members of other
groups (e.g., the “red” group) when they develop a sense of cultural
pride or, more crassly, so that they can be considered affirmative-action
candidates. Thus, “race” in the United States is not just “color.”
IT IS DISREGARDED BY SCIENTISTS AND ITS SCIENTIFIC
UNDERPINNINGS ARE QUESTIONED
Third, the assumptions underlying the simple but classical conception
of U.S. race as a scientific or biological construct have been intensely
questioned. For example, the assumptions that biological race is a
given; that hypodescent is a natural law; that some geographic regions
are homogeneous; and that ethnicity is less important than color and
race have been questioned in both the academic literature and the pop-
ular press. Earlier questioning in the academic anthropological com-
munity preceded the inquiry in the popular press. A 1989 survey indi-
cated that about 70 percent of cultural anthropologists and 50 percent of
physical anthropologists rejected race as a biological category (Begley
1995:67; see also Sanjek 1994).
Common to the relatively recent, critical literature on race is a
distrust of the validity of race as a biological concept and an increas-
ing awareness of the illogic of the United States’ racial constructions.
In much of this literature, experts argue that the differences within
groups are often greater than the differences between groups (Begley
1995:67; Gregory and Sanjek 1994:6–7; Gutin 1994:73; Marks 1994,
184
A P P E N D I X B

1995; Rosin 1994; Shreeve 1994:60; Washburn 1963; Wills 1994:81). As
Marks put it, fieldwork revealed, and genetics later quantified, that
there is far more biological diversity within any group than between
groups (1994:34).
3
Moreover, specialists contend that what generally varies from one
population to the next is the proportion of people in these groups dis-
playing a particular trait or gene. For example, Marks (1994) pointed
out that hair color varies greatly among Europeans and native Aus-
tralians, but not among other peoples. He also noted that Africans are
more biologically diverse than Europeans. At present, both academic
and popular research is concerned not with whether there are rigid bi-
ological distinctions between races but with when our most recent com-
mon ancestors lived and when subpopulations branched off (Goldstein
and Morning 1999:5; Lemonick and Dorfman 1999).
The sense in this literature is that although there appear to be
clearly visible differences among groups, in fact these are just popula-
tion clusters. In other words, what we use to distinguish groups, for ex-
ample, pigmentation, eye form, and body build, are anatomical proper-
ties, but they are not restricted to particular groups. Rather, they are dis-
tributed along geographical gradients, as are nearly all the genetically
determined variants detectable in the human gene pool. In essence, the
physical characteristics that appear to mark these groups (and that
some people see as equivalent to distinct categories or races of people)
are distributed along gradients. This variation is gradual, and these gra-
dients span populations.
Three factors account for the variation of populations: (1) natural
selection, (2) genetic drift, and (3) gene flow. Natural selection occurs as
people, that is, populations, adapt to their surroundings. Those who are
best able to survive in a particular environment live to reproduce oth-
ers who will carry their genetic heritage. Through natural selection,
populations become differentiated from other populations. Genetic
drift also contributes to the variation of groups. Random fluctuations in
a gene pool occur as a result of genetic drift. These random fluctuations
increase the uniqueness of populations, differentiating them from other
populations, but in nonadaptive ways. Finally, as humans have mi-
grated, developed trade networks, and engaged in the political con-
quests of other populations, intermarriage and “other child-producing
unions” have resulted. This has increased the gene flow between popu-
lations, making neighboring populations more similar (Marks 1994:34).
A P P E N D I X B
185

Geographic barriers are also cited as important to creating different de-
velopment paths for different population groups (Diamond 1997).
Consequently, “the racial categories with which we have become so
familiar are the result of our imposing arbitrary cultural boundaries in
order to partition gradual biological variation” (Marks 1994:34). These
culturally constructed categories that we develop and call “races” are
discrete and are unlike biological, graduated distinctions. Moreover,
our conception of “pure” racial types is also a construction. Thus, for ex-
ample, very light skinned groups in cold, northern latitudes are not
pure types or populations; rather, they are those best adapted to these
environments.
Despite the recent, extensive criticism of the concept of race and
even though “scientists have been broadly unable to come up with any
significant set of differences that distinguishes one racial group from
another, the controversy over racial differences persists” (Morganthau
1995:64). For example, the recent controversy over racial differences in
intelligence was revived—but not settled—by books like the best-sell-
ing The Bell Curve by Richard Hernstein and Charles Murray.
186
A P P E N D I X B

Appendix C
A Technical Oversight or Racial Flux?
Given that the “color” term and concept endured in the U.S. census for
most of the nineteenth century and a large part of the twentieth century,
an intriguing question is why the first three censuses did not contain a
color term. Related to this question is why the original “all other free
persons” category was replaced by the “free colored” category.
1
CHANGE IN TERMINOLOGY, NOT DEFINITION
One explanation is that the shift to a color category was inconsequen-
tial. The category then represented only a very small proportion of the
population—1.5 percent (or 59,557) in 1790 (Wright 1956:49). It could be
argued that the shift reflected a mere change in terminology but not in
definition (Bill Creech, National Archives, conversation, November
1995). In other words, the people in this category were the free colored,
even though it was not so named. (This was the position that later cen-
suses took with regard to the meaning of this category. See, e.g., U.S.
House of Representatives 1895:xcv–xcvi; U.S. Secretary of the Interior
1853a:table xxxvii; 1853a:xxxvi, 6, 926, tables ix and lxvii.)
Missing or Miscellaneous Information
The “all other free persons” category may have included errors and
the “don’t knows.” It may have reflected the most generic category pos-
sible for what was then a very unstandardized process of data gather-
ing. No specific instructions were issued to census takers until 1820
(U.S. Bureau of the Census 1989:ii), and before 1830, the states designed
their own forms and categories. Thus, the information they collected
187

varied. For the early censuses, marshals submitted their returns to the
federal government “in whatever form they found convenient and
sometimes with added information” (U.S. Bureau of the Census 1978:7).
In addition, many states changed the categories they used from one
decennial census to another. For example, the Massachusetts census
form of 1810 counted “free white males,” “free white females,”
“slaves,” and “all other free persons, except Indians, not taxed.” In its
1820 census, when it was no longer a slave state, Massachusetts kept all
these categories except “slaves” and added “free colored persons” and
“foreigners, not naturalized.” Massachusetts’s 1820 census also asked
for the age and gender of the “free colored persons” (U.S. Bureau of
the Census 1978). In other states, of course, the category of “slaves”
remained.
Change in Political Leadership
Another view is that the shift simply reflected political changes in
leadership. From the beginning of the census, some of the founding
fathers had been interested in counting the “colors” of the free popu-
lation. Indeed, all the legislative acts mandating the 1790, 1800, and
1810 censuses specified that the “colors of free persons” be reported
(Jackson and Teeples 1976; U.S. Bureau of the Census 1967:43).
2
But
the census categories did not reflect this requirement, and it is not
clear why.
3
The 1820 legislation was similar to the earlier legislative acts but
also included a substantially different schedule form (U.S. Statutes at
Large 1963:548). On this schedule, foreigners were “white,” and the
third category (“all other free persons”) was placed under the “col-
ored” category. The emphasis on color in this census is also seen in
Secretary of State John Quincy Adams’s instructions to the marshals,
in which he specifically noted the need to count the population ac-
cording to “sex, color, age, condition of life” (U.S. Bureau of the Cen-
sus 1967:133, italics in original). This letter was published at the front
of the 1820 census.
4
President James Madison had earlier proposed a more comprehen-
sive first census to Congress, arguing that the census should count the
numbers engaged in the different “professions and arts.” He also sug-
gested that Congress count “free blacks” along with “free white men,”
188
A P P E N D I X C

“free white women,” and “slaves.” (Wright 1956:132–133) Some in Con-
gress opposed a census that did more than count individuals,
5
but it
may be that President Madison and Secretary of State Adams finally
had their way in the 1820 census.
RACIAL FLUX
Alternatively, the absence of a color term before 1820 may also have re-
flected the influence of an earlier period of racial formation in the
United States in which there was a great deal of flux and classifications
may have been more fluid and differently determined. A number of
scholars note that in the very early colonial period, an individual’s sta-
tus was not “determined solely on the basis of race” (Franklin 1967:225
ff; Higginbotham 1978:22). One’s status as a free person may have been
more important than color.
Color may also have been viewed differently at that time. It is in-
teresting that of twenty-six reprinted advertisements from the Pennsyl-
vania Gazette for “white indentured servants who fled their masters”
(1728–1790), more than a quarter of the runaways—or seven of the
twenty-six ads—were described as “brown,” “swarthy,” “dark,” or “of
a brownish complexion” (Smith and Wojtowicz 1989:5, 161–172). In ad-
dition, Meaders discovered in his more extensive review of runaway in-
dentured servants between 1729 and 1760 in Pennsylvania that there
were “a few black and Indian indentured fugitive servants” (1993:xi). In
his sample of 1,036 runaway servants and apprentices, he found that
5.79 percent were of unknown or mixed race, Indian, or black (p. 505).
Thus the group referred to today as “white” included some who were
described then as “not-white” or “dark.”
Some colonial figures suggest that there was more heterogeneity
during this period than is generally acknowledged today. According to
Parrillo’s analysis of colonial data, in 1776, Africans accounted for 39.2
percent of the population of the southern states and 20.5 percent of the
total; and African Americans and Native Americans together were
more numerous than the English in the South (1994:530). The English
also made up only 46.9 percent (less than half) of the total U.S. popula-
tion of 2.587 million. In addition, Galenson found that whereas in the
northern colonies, blacks constituted less than 10 percent of the total
A P P E N D I X C
189
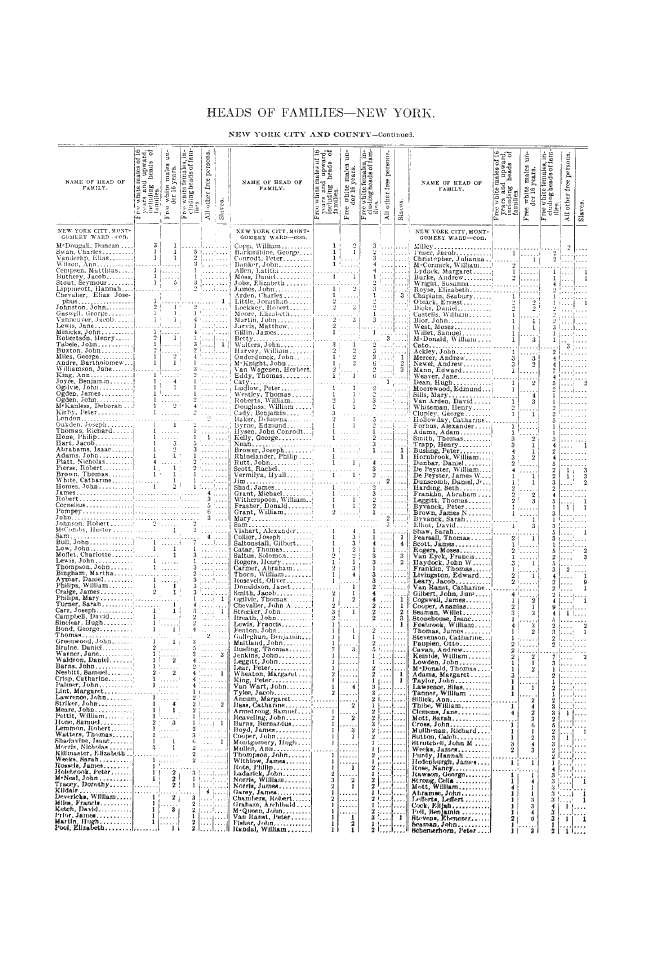
190
FIG. C.1.
Heads of Families, New York 1790.

population in 1770, in Maryland, Virginia, North Carolina, South Car-
olina, and Georgia, they made up 35 to 61 percent of the total popula-
tion (1981:119).
This also was a period when substantial numbers of individuals
were described in early colonial data as “unassigned,” including
“those of mixed or unknown nationality and/or living in the back
country.” They constituted 6.6 percent of the total white population in
1790 and more than 10 percent of the populations of Connecticut
(26%), Maine (24%), New Hampshire, Vermont, and Rhode Island.
Although unassigned, they were included in the white colonial
counts (Parrillo 1994:533). These people may have been the first prod-
ucts of the American amalgam of European groups and may also
have included taxed Indians and those mixed with taxed Indians, as
well as persons of some African descent. In any case, they illustrate
the flux and variability characteristic at the time, even with regard to
groups classified as white.
The “all other free persons” category may also have included per-
sons not of African descent, for example, taxed Indians, mestizos, or
“other” free people who were not seen as simply white, such as Asians
and Arabs. But the general assumption in the literature and in later cen-
sus reports was that this early category consisted of “free blacks.”
6
Who
exactly was in the “all other free persons” category has not yet been de-
termined. My own analysis of the largest ward (i.e., political district) in
New York City in 1790, Montgomery Ward, reveals a rather complex
picture.
As figure C.1 indicates, New York City’s 1790 census records show
the name of the head of the family and then the number in each family
who were free whites (by age, sex, and headship status), slaves, and “all
other free persons.” It is generally understood that in the 1790 census,
“a family where there is a name of the head of the family with nothing
written after it . . . is likely to be a free black family” (Carlberg 1992:33).
In New York City, of all the households with members in the “all other
free persons,” 44.4 percent were in households listed without last
names. But the majority (55.6%) lived in households that had last names
and included white persons as well as slaves in some cases. Five house-
holds without last names had only white persons resident (Heads of
Families 1992:119–124).
7
It is likely that many people in this category were “free people of
African descent.” But they may also have been of Native American
A P P E N D I X C
191

descent or various combinations of European, Asian, African, or Native
American ancestry. In any case, we need to find out who else might
have been in this category and whether there were regional variations
with regard to its composition during this period of racial flux and not-
yet-crystallized categories of color.
192
A P P E N D I X C

Appendix D
Free People of Color
THE EARLY PERIOD, 1790–1840
The free population of color grew by 82.1 percent between 1790 and
1800 and then by 71.9 percent between 1800 and 1810. In the follow-
ing decade, however, the growth rate dropped dramatically, growing
only 25.3 percent between 1810 and 1820, as shown in figure 4.1 and
table 4.1. It was in 1820 that the category “free colored persons” was
introduced and included “all other free persons” (U.S. Bureau of the
Census 1967:sec. vi, tables 20 and 17). After 1820, the numbers and
proportion of “free colored” did not increase much (see figures D.1
and D.2). Indeed, the proportion of all African Americans who were
free actually declined between 1840 and 1860. Figure D.2 illustrates
how the gap between the free and unfree grew substantially between
1820 and 1860. The proportionate decline in the free population oc-
curred despite the passage of legislation in 1807 prohibiting the im-
portation of foreign slaves (see Blaustein and Zangrando 1968:53–57
for a description of this act, as well as other statutes passed by Con-
gress to restrict the slave trade). Part of the increase in the number of
slaves was due to the admission of new states during this period. Of
these states, Arkansas (1836), Florida (1845), and Texas (1845) entered
as slave states.
It still is curious that the population of free people of color did
not grow significantly during this period. One possibility is that after
1820, free people of color were no longer counted as they had been
before when there was no color term in the third category, “all other
free persons,” or that many were perhaps not counted at all after
1820. In her local-area study of free women of color in the nineteenth
century, Logan Alexander (1991) decided that they usually did not
193
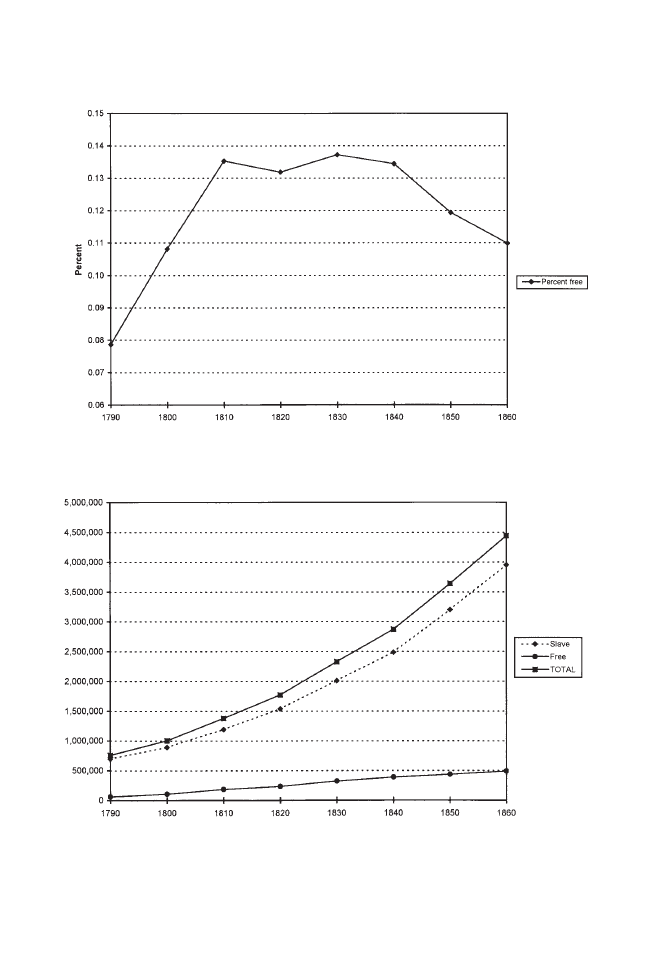
194
FIG. D.1.
Proportion of African Americans Who Were Free, 1790–1860. The
Negro Almanac 1971:344.
FIG. D.2.
The Increase in Numbers of Slaves and Free African Americans,
1790–1860. The Negro Almanac 1971:344.

bother to register for the census, perhaps because they realized that
there were unpredictable swings in the freedoms allowed free people
of color. Bell (1973) noted that the legislation concerning free people
of color fluctuated from liberal to more restrictive in different states.
Accordingly, people who might have been counted in this group
when the category was not “colorized” might have realized by 1820
that if they were counted as “colored,” their freedoms might be cur-
tailed (Bell 1973; Logan Alexander 1991). This precarious status was
also mentioned in a 1907 census report summarizing the first hun-
dred years of the census. It stated that in earlier times, a “free negro”
was believed to be a threat or have an “unfavorable influence” on
other slaves in the same “neighborhood” (U.S. Bureau of the Census
1967:37; see also Fishel and Quarles 1970:127–144; Franklin 1967:214–
241; Frazier 1962:117 ff). Last, some “free colored persons” probably
passed into the white population (Hodes 1997:67 ff).
BLURRED BOUNDARIES
The growth of a free, mixed population threatened to blur group
boundaries, making it impossible to distinguish the “white” from the
“colored.” The reality of the extent to which “miscegenation” had made
many “visibly white” can be seen in the numerous advertisements
promising rewards for runaway slaves who could pass for white, the
suspected black ancestry of a number of famous “white” Americans,
and the invisible African ancestry of noted black leaders (Blockson and
Fry 1977).
The following anecdote suggests how many mixed people were in
the South, where the majority of slaves and free people of color lived.
When the South Carolina legislature tried to define race by suggesting
that “a Negro” was any person with even a single drop of nonwhite
blood, George Tillman objected: “Gentlemen,” he solemnly declared,
“then we must acknowledge that there is not a full-blooded Caucasian
on the floor of this convention!” (Blockson and Fry 1977:107). If the
chains of slavery were lifted, it was expected it would be even more dif-
ficult to maintain the boundaries between “white” and “not white.”
This concern appears to have been behind the admonitions to the
census enumerators in 1850 (when mulattoes were first counted) to
be very careful about determining color, to indicate whether the free
A P P E N D I X D
195

person was “mulatto” or “black” (U.S. Secretary of the Interior
1853b:xxii, italics added). In the section explaining the schedules (i.e.,
census forms) for free inhabitants, the instructions state, “It is very
desirable that these particulars be carefully regarded” (U.S. Secretary
of the Interior 1853b:xxii). In the instructions given for determining
the color of slaves, this phrase was not included; rather, enumerators
were told that “the color of all slaves should be noted” (U.S. Secretary
of the Interior 1853b:xxiii). Thus, it was very important to distinguish
color among the free colored but not among the slaves. Instructions
for the section on mortality, which also required free and slave indi-
viduals to be identified according to whether they were mulatto or
black, carried no such admonition (Jackson and Teeples 1976). Color
distinctions among the dead were apparently not as important.
The census of 1860 was taken on the eve of the Civil War. It too ex-
amined the general population growth of the free colored and con-
cluded that it was “a stationary population,” that they had as many
deaths as births (Kennedy 1862:6). It also concluded, however, that “it
is important to observe the growing disparity between the pace at
which the white and colored races are advancing in this country.” The
number of whites was increasing faster than that of slaves, and the free
colored had the lowest rate of increase.
1
These differential growth rates were seen to be relevant to the issue
of possible emancipation: “Leaving the issue of the present civil war for
time to determine, it should be observed, if large numbers of slaves
shall be hereafter emancipated, so many will be transferred from a
faster to a slower rate of increase” (Kennedy 1862:8). The assumption
was that given the current rates of increase for both groups, if slaves
were emancipated, they would not increase as rapidly as they had
when they were slaves.
2
This led proslavery advocates to conclude in-
congruously that slavery was more beneficial than freedom to persons
of African descent.
AFTER THE CIVIL WAR
As Williamson (1984) and Davis (1992) argue, it was after the Civil War
that the need to distinguish all people of color (i.e., those who had been
slaves as well those who had been free) from whites became more in-
tense. Without slavery, it was important to discern any “perceptible
196
A P P E N D I X D

trace” among the now-freed population as a way of maintaining the an-
tebellum social structure.
3
Having been lost on the battlefield, the strug-
gle over the social status of African Americans moved to the area of
racial classification.
4
As noted earlier and as table 4.4 shows, the concern with determin-
ing “traces” of Negro blood continued, and by 1890, the census appears
to have become obsessed with distinguishing the amount of Negro
blood in individuals (Wright 1956:187). Although this obsession had
eased by the next census, the same approach was echoed in the 1894
Supreme Court case of Plessy v. Ferguson. The plaintiff held that he
should have the rights of a white man because he was seven-eighths
white and only one-eighth black. The Supreme Court’s ruling against
the petitioner thereupon made tenable and authenticated the concept of
hypodescent and legitimized the Jim Crow legislation of the day for
many decades to come.
A P P E N D I X D
197


Notes
NOTES TO INTRODUCTION
1. Although this review was quite extensive, less mainstream journals,
such as the Journal of Ethnic Studies or the Latino Studies Journal, were not in-
cluded. Therefore, the findings may be more typical of practices in the more
traditional social science publications.
2. In this book I rely more heavily on commonly used definitions of race
and ethnicity—that is, those used in the dictionary and by the census—and less
heavily on definitions that represent academic consensus. Since census defini-
tions come largely out of political and bureaucratic negotiation, they are, in this
regard, more useful for my purposes, and they also are relevant to the issues
and data I analyze.
NOTES TO CHAPTER 1
1. In her study of Spanish-speaking Caribbeans, Dominguez states that
“an individual may be identified as indio, trigueno, blanco, prieto, or whatever in
different contexts by different people or even by the same person” (1986: 275).
2. Except when specifically referring to women, I use the word Latino to
refer to both women and men. At the descriptive level, my analyses of how Lati-
nas and Latinos classify themselves racially have not revealed significant dif-
ferences. But under more controlled conditions, some labor market differences
by race and gender have been noted (Gómez n.d.; Rodríguez 1991a).
3. In this book, I use both Hispanic and Latino, in part because both terms
are used in the literature and I try to use those of the authors I cite when dis-
cussing their work. Works based on census material, for example, tend to use
the term Hispanic, mainly because this is the category under which the data
were collected. Other works refer to surveys employing the term Latino. See the
following for different arguments concerning the preferred term: Gimenez
1989; Hayes-Bautista and Chapa 1987; Oboler 1995; Treviño 1987.
4. According to Jorge del Pinal, 42.7 percent of the Hispanics who chose
the “other race” category in the 1990 census gave a Latino referent. However,
94.3 percent of “other race” persons who provided a write-in gave a Latino ref-
erent (personal communication, July 30, 1999). In addition, two-thirds of all
199

those who did not specify their race wrote in their Hispanic ethnicity (U.S. Of-
fice of Management and Budget 1995:44689).
5. Hypodescent is also referred to as the “one-drop rule,” in which “one
drop” of “nonwhite or black blood” determines a person’s “race.”
6. The degree to which racism is perceived and experienced in the Latino
framework may be related to phenotype. Consequently, those farthest from ei-
ther the local mean or the ideal European model may be those most subject to,
and therefore most aware of, racism and discrimination. In the dominant U.S.
framework, those farthest from the stereotyped “Latin look” may be those most
acutely aware of, or in the best position to observe, discrimination.
7. Martínez-Echazábal uses the word “mestisaje as a way of avoiding the
English term miscegenation because in the Anglo-American context miscegena-
tion refers exclusively to the sexual union of two people of different races while
in the Ibero-American contexts it signals both biological and cultural interracial
mixing” (1998:38).
8. Two sets of cognitive, face-to-face interviews were commissioned by the
U.S. Bureau of the Census in order to evaluate the race and Hispanic-origin
questions on the Census 2000 form. One set (Davis et al. 1998a) examined the
formatting of these questions, and the other (Davis et al. 1998b) evaluated two
versions of the race question and the revised Hispanic-origin question on the
Census 2000 form. The two samples questioned fifty-nine Hispanics from dif-
ferent parts of the nation.
9. This will be covered in chapter 3, but see Davis et. al. (1998a:III-22–23)
for light and humorous discussions of skin color in the cognitive interviews.
10. The Hispanic population increased from 4.5 percent of the total U.S.
population in 1970 to 9 percent in the 1990 census, and the white non-Hispanic
population decreased from 83.5 percent in 1970 to 79.6 percent in 1980 to 75.6
percent in 1990 (del Pinal and Garcia 1993; U.S. Bureau of the Census 1972,
1982). Between 1980 and 1990, the black population increased by 13 percent,
Native Americans increased by 38 percent, and Asian and Pacific Islanders in-
creased by 108 percent. The growth rates of Hispanic-origin groups differed,
with Mexicans increasing by 54 percent, Puerto Ricans by 35 percent, Cubans by
30 percent, and other Hispanics by 67 percent (del Pinal 1993).
11. Atkinson, MacDorman, and Parker (1999) noted that their analysis of
the 4 million births in the United States each year may slightly underestimate the
percentage of interracial births.
12. Asian/white unions are more likely to classify their children as
“white” instead of “Asian.” This pattern is similar among Native Americans
and contrasts with the two-thirds of children in black/white families who have
consistently been identified as “black” in the last few decennial censuses. Con-
sequently, the high proportion of interracial children classified as “white” can,
to some degree, be explained by the composition of interracial couples. In 1990,
200
N OT E S TO C H A P T E R 1

Asian/white couples accounted for the largest proportion of interracial cou-
ples, that is, almost one-third (31%); American Indian/white couples were the
second largest group (22%); and black/white couples comprised fewer than
one-seventh. The “other race” category, which consisted mainly of Hispanics,
accounted for almost one-third, and most of these marriages were to whites
(Bennett, McKenney, and Harrison 1995:22, 12–13).
13. Numerous scholars have noted differences between observed and re-
spondent-reported race (see, e.g., Edmonston, Goldstein, and Tamayo Lott
1996; Falcon 1995; Hahn 1994; Hahn, Mendlein, and Helgerson 1993; Massey
1980; McKenny and Bennett 1994; McKenney, Fernandez, and Masamura 1985;
McKenney et al. 1993; Rodríguez 1974, 1989; Rodríguez and Cordero-Guzmán
1992; Tumin and Feldman 1961).
14. Those responding that they were “multiracial” in a series of surveys
conducted by various government agencies rarely reached 2 percent (U.S. Of-
fice of Management and Budget 1997a), whereas the proportion of Hispanics
in the population was 11 percent of the population (Reed and Ramírez
1998:table 1).
15. For example, the proposal for a multiracial category was actively sup-
ported and advanced by organizations such as Project RACE and the Associa-
tion of Multiethnic Americans. The Arab American Institute argued for the ad-
dition of a special category for Arab Americans, and the proposal to shift Na-
tive Hawaiians from the “Asian and Pacific Islander” category to the “Native
American Indian” category was supported by Senator Daniel Akaka from
Hawaii, the National Coalition for an Accurate Count of Asians and Pacific Is-
landers, and representatives of Native Hawaiians (U.S. House of Representa-
tives 1994o).
16. The U.S. Supreme Court decided in January 1999 that the Census Bu-
reau could not use sampling to help produce the official population figure that
would be used to determine the number of House seats that each state would
be allocated. However, the Court did not explicitly rule on whether sampling
would be permitted to establish where precisely in a state people live, and it is
this information that is used to draw boundaries for congressional and state leg-
islative districts (Holmes 1999:24).
17. The privileging of one color or type over others in the group is often the
result of historical practices and the effect of racial policies pursued within
bipolar systems. It is a tendency found in many oppressed groups and often
leads to unnecessary divisions and acrimony within the group. See, for exam-
ple, Russell, Wilson, and Hall 1992 on the antecedents of “colorism” in the
African American community and Jaimes 1994 on how blood quantum policies
contributed to internal jockeying for Indian-ness.
18. Results from the following studies reflect the resulting mélange of
findings from the use of local versus national databases or differing models,
N OT E S TO C H A P T E R 1
201

controls, and foci. For example, Stolzenberg (1982) found that occupational
discrimination against Hispanics affects only first-generation, non-English-
speaking immigrants. Torres (1992) discovered discrimination in earnings
against all Puerto Ricans but more often against island-born Puerto Rican
women and men than against those born in the mainland United States.
Reimers (1985), examining wage-gap differences among Hispanics of differ-
ent national origins and non-Hispanic whites, found that discrimination var-
ied in importance in explaining the wage gap and was not a major factor with
regard to the gap between Hispanic and non-Hispanic women. But Meléndez
(1991) saw discrimination as important to explaining a large proportion of
the wage gap between Hispanic and non-Hispanic New Yorkers. Kossoudji
(1988) discovered that Hispanics have paid more dearly for their lack of Eng-
lish-language skills than have Asians, at every skill level.
19. The classic film Ethnic Notions conveys this message well by juxtapos-
ing the media images in a particular historical context against the reality of that
time.
20. Telles and Lim (1998) addressed this question in Brazil and found the
interviewer’s classification to be more useful for determining treatment.
21. In other words, “race” is a set of socially constructed meanings subject
to change and contestation through power relations and social movements. The
conception of subordinate social races can be eliminated only when the struc-
tures that support these conceptions are eliminated, for example, dual labor
markets, residential segregation, discriminatory institutional and legal treat-
ment, and segregated school systems. Given the socially constructed nature of
race, racial identity is historically flexible and culturally variable, and it is em-
bedded in a particular social context (Duany 1998b; Omi and Winant 1995).
22. For an interesting discussion of whether race should be employed as a
research category in public health research, see Fullilove 1998 and various com-
ments on this article in the subsequent volume of the American Journal of Public
Health (1999).
23. Marks (1994) maintains that folk concepts of race—flawed and scien-
tifically deficient as they may be—are passed down from generation to genera-
tion, just as genetic material is inherited. This is part of what keeps the concept
of race real.
NOTES TO CHAPTER 2
1. Tiger Woods refers to himself as “Cablinasian”—Ca, Caucasian; bl,
black; in, Indian; and Asian. Some African Americans maintain that regardless
of how he sees himself, the average American would see him as black (Ebony,
“Black America and Tiger’s Dilemma,” July 1997, pp. 28–30, 138).
2. In this simple conception of race, the “red” and “yellow” color groups
202
N OT E S TO C H A P T E R 1

are also defined as nonwhite. However, it appears that “blood quantum,” that
is, the amount of “red” or “yellow” blood and not the “one-drop” criterion, was
used to determine “race.” There is, however, some disagreement in the litera-
ture about the extent to which the hypodescent rule was (and is) rigidly applied
to all white/nonwhite mixes. See Root 1992a and c and 1995, who says that the
hypodescent rule has been rigidly enforced for Asian mixes by the Asian, black,
and white communities, and Davis 1992, who argues otherwise.
3. As noted earlier, the 2000 decennial census offered the option of choos-
ing more than one race category.
4. According to Wills (1994), the evolution of skin color was not a one-time
event. Instead, it appears that groups had different skin colors at different times
in their evolutionary history.
5. This, he argues, was quite different from the reactions of whites, who
were struck by the novelty of Africans’ skin. “To wash an Ethiopian white” was
a common expression in Greek and Roman literature, but it was used to de-
scribe futile labors or the unchangeability of nature, not to designate negative
“racial” attributes (Snowden 1983, 7).
6. Thompson (1989:10 ff) points out that because most Aethiops were in
humble positions, this led to their association with humble status. Nonetheless,
he argues that this association was not a prejudice, that the treatment of a per-
son of color depended on his or her status and not color.
7. Although Thompson (1989) basically agrees with Snowden (1983), he is
also somewhat critical because he feels that Snowden does not take into account
Roman perceptions of race. Thompson (1989) contends that he, however, does
do this in his own work.
8. According to Thompson, the Greco-Roman view distinguished among
the “developed” world of pale brown (albus) Mediterranean people, a barbar-
ian “underdeveloped” world, and another barbarian but cultivated world
(1989:10 ff).
9. With regard to the ancients’ aesthetic preferences, Snowden found a
few more expressed preferences in classical literature for white beauty than
those for black or dark beauty. But this, he said, was not strange. What was
strange was “the number of those in the Greco-Roman world who rejected
the norm of whiteness and openly stated their rejection” (1983:79). Thomp-
son agreed that some scholars interpret Roman comments about blacks in lit-
erature and iconography as reflecting “race prejudice,” “color prejudice,”
and “racism” but that in these cases, people were confusing racism and eth-
nocentrism (1989:11).
10. Snowden found that the ancients did not make color the focus of irra-
tional sentiments or the basis for uncritical evaluation, and he concluded that
the image of Ethiopians in Greek and Roman literature was essentially favor-
able (Snowden 1983:55, 59). He also did not find in Greek drama any specifically
N OT E S TO C H A P T E R 2
203

antiblack sentiments, even though the Greeks had confronted Ethiopians as en-
emies in the Persian wars (Snowden 1983:48).
11. See, for example, Bilger’s review (1997) of the contemporary debate be-
tween Frank M. Snowden Jr. and Molefi K. Asante, director of African-Ameri-
can Studies at Temple University in Philadelphia.
12. Shreeve argues that the concept of race did not exist until the Renais-
sance, when ships could navigate the open ocean. Even people like Marco
Polo in the thirteenth century or the Islamic explorer Ibn Batuta in the four-
teenth century never thought in racial terms, because traveling by foot and
camel rarely allowed them to cover more than twenty-five miles a day: “It
never occurred to them to categorize people, because they had seen every-
thing in between. . . . [T]hat changed when you could get into a boat, sail for
months, and wind up on a different continent entirely. When you got off, boy
did everybody look different! Our traditional racial groupings aren’t defini-
tive types of people. They are simply the end points of the old mercantile
trade networks” (1994:60).
13. Hannaford maintains that these changes were foreshadowed in earlier
writings, but his view of “race” is considerably broader than that of other writ-
ers. When talking about the racialization process, he includes differences based
on language, culture, disposition, and appearance, as well as color (1996:1).
14. The question of what categories or terms are used to describe or count
a population is important for language is not a transparent window; it is a
screen through which a culture views its world. Moreover, “naming” has both
descriptive as well as prescriptive power. For example, the term Hispanic was
first introduced by the census in 1980 to describe persons of Spanish origin and
it is today used by some to identify themselves outside of the census context.
15. On a more theoretical level, the authors concluded that ethnicity lacked
replicability and a shared meaning and had multiple dimensions and overlap-
ping categories (Almey, Pryor, and White 1992).
16. According to Williams, “Most of the research on racially blended peo-
ples and their families reflects Eurocentric bias, painting interraciality as prob-
lematic” (1992:281).
17. A recent analysis of Asians’ intermarriages did not find a consistent re-
lationship between education and intermarriage (Lee and Yamanaka 1990).
18. There was, however, considerable variation between race and ethnic
groups with regard to intermarriage. Native Americans had the greatest per-
centage of “outmarriage,” followed by Asian and Pacific Islanders and those of
“other race,” who were mainly Hispanic. Whites and blacks had very low rates
of outmarriage (3% and 6.2%, respectively). Thus, even though the majority of
intermarriages were between whites and blacks, 97 percent of whites and 92.8
percent of blacks married others within their own “race” group.
Hispanics (like Native Americans and Asian and Pacific Islanders) also
204
N OT E S TO C H A P T E R 2

had relatively high outmarriage rates, with some variation by Hispanic sub-
group. “Other Hispanics” (50.3%) and Puerto Ricans (45.1%) married “out”
more than Mexicans (30.6%) or Cubans (36.8%) did. A large proportion mar-
ried non-Hispanics: 28.3 percent of Mexican, 35.4 percent of Puerto Rican,
25.7 percent of Cuban, and 43.6 percent of “other Hispanic” marriages were
to non-Hispanics. The reason may be that Hispanic subgroups are geographi-
cally concentrated and separated from one another and there are more eligi-
ble non-Hispanic marriage partners. The three fastest-growing groups in the
country—Native Americans, Asian and Pacific Islanders, and Hispanics—
had the highest rates of outmarriage.
19. In sum, the report stated that in areas where they are relatively numer-
ous, the smaller “racial” groups are reasonably well identified but in areas
where they are rare, they may be misclassified (U.S. Bureau of the Census
1953:35).
20. These political-legal, social, and economic contexts contain the vari-
ables that influence racial and ethnic classifications, for example, national ori-
gin, religion, language, minority status, and tribal membership (Bates et al.
1995:433–435) or those found in the academic literature (Leets, Clement, and
Giles 1996).
NOTES TO CHAPTER 3
1. Although it was desirable for the interviewer and interviewee to have
similar backgrounds, this similarity might have introduced biases not readily
identifiable. So, in order to check for bias, the interviewers were asked to sum-
marize two of their interviews. The other interviewers then reviewed and ed-
ited the summaries, checking for inconsistencies and personal and factual con-
clusions, and asked additional questions. In some cases, the interviewers asked
the respondent for additional information or read the summary to him or her
for confirmation or validation. Finally, the original interviewers rewrote the
summary.
2. I have stated elsewhere that the consolidation of these multiple identi-
ties represents a unique form of resistance to the United States’ dichotomized
racial structure (Rodriguez 1994a).
3. Forbes noted a similar pressure on Native Americans by whites and
blacks in the United States to be black Americans (1990:33 ff).
4. Paradoxically, at the same time that U.S.-born and foreign-born Latinos
are experiencing these pressures, the increasing number of Latino immigrants
to the United States is enforcing Latinos’ more traditional focus on national
identity and cultural differences between themselves and other groups, both
Latino and non-Latino.
5. See Hurtado 1997, who emphasizes the significance of the Chicano
N OT E S TO C H A P T E R 3
205

movement at that time in shaping the evolution of her own identity as a
strongly and proudly identified Chicana.
6. According to a number of studies, some Latino respondents do not like
the “other race” classification (Kissam, Herrera, and Nakamoto 1993; Johnson
et al. 1997). These respondents maintain that “‘other’ implies you don’t belong
to a group” or represents marginality (Johnson et al. 1997:3). Yet some of the
case studies described here convey the sense that it is all right to be “other.” This
does not mean, however, that these respondents endorse the category of “other
race” but, rather, that being “none of the above” is not a problem for them.
7. For most European Americans, racial identity is less complicated and
more straightforward. The following example of a young white middle-class
woman responding to the racial questions used in these case studies illustrates
the “normative” position. The woman was born in the Midwest and was a
graduate student on the West Coast. She was at least third-generation northern
European on both her maternal and paternal sides. In response to the census
item, she checked “white.” When asked why she had answered in this way, she
replied, “Because I’m white.” She added that she had not bothered to look at the
other categories to see whether they might be more appropriate, for she did not
consider herself “ethnic.”
The young woman’s responses to the other racial identifiers were similarly
unvarying. She described herself as being “white, as white as they come.” The
only times she did not answer “white” was when the question did not specifi-
cally address race—as when asked how she would describe herself over the
phone (she said she would describe her clothing) or whether her identity had
changed (she said it did when she got married, became a graduate student, etc.).
When asked, “How do you identify yourself?” she first stated she was a
woman, then white, and finally identified her current student role and future
occupational goals.
This woman’s responses reflect her life in the United States. Her racial
identity is clear, although factors such as class, national origin, religion, or pig-
mentation may affect the way in which other European Americans identify
their race.
NOTES TO CHAPTER 4
1. A much later decennial census confirmed this practice of counting only
taxed Indians: “Those bound for a term of years have always been taken among
the free; Indians not taxed always excluded” (U.S. Secretary of the Interior
1853b:xvi).
2. The fact that neither the sex nor the ages of free or slave African Ameri-
cans were requested indicates the relative unimportance of these groups in the
social hierarchy at the time.
206
N OT E S TO C H A P T E R 3

3. In the 1830 census, sex and age were also requested for the first time
within this third category and within the “slaves” category (U.S. Bureau of the
Census 1989:20).
4. For example, in the 1840 census for Maine, tables were included with
columns for “Deaf and dumb, blind and insane white persons” and for “Deaf
and dumb, blind and insane colored persons.” The colored included both free
persons and slaves (U.S. Dept. of State 1842: table entitled “Aggregate Amount
of Each Description of Persons within the District of Maine,” n.p.).
The 1850 decennial census described and presented data for the popula-
tion’s three classes: whites, free colored, and slave (U.S. Secretary of the Interior
1853a:xxxii), but it also combined the “free colored” and “slave” populations to
calculate projected population increases (U.S. Secretary of the Interior 1853a:table
xxxvii) and the ratio of illiterate persons to total population (De Bow 1854a:153).
5. By the 1890 census, the hypodescent rule was firmly in place, and table
footnotes explicitly indicate that “Negro” “includes all persons of negro de-
scent” (U.S. House of Representatives, 1895:xcv–xcvi). Moreover, in compiling
tables of census data gathered earlier, the former “all other free persons” and
free colored categories were combined with the “slaves” category to determine
the percentage of blacks in the total population between 1790 and 1890 (U.S.
House of Representatives, 1895:xcv).
6. Although foreign-born whites were separated from native-born whites
for the first time in 1830, this did not affect the total count of whites. The “for-
eign born” have been counted in every decennial census since then.
7. The 1850 and 1860 censuses followed the same procedures, but in 1860
the actual categories “white, black, or mulatto” appeared on the census form
under the “color” column. The next census, in 1870, used the 1860 format but
added letter codes in the column head (i.e., “W,” “B,” and “M”).
8. In the 1890 census, the question was, “Whether white, black, mulatto,
quadroon, octoroon, Chinese, Japanese or Indian.” The instructions to the enu-
merators referred to “Color.” (U.S. Bureau of the Census 1989:34, 36)
9. The 1900 census, in fact, noted that these figures’ worthlessness had
been acknowledged in the 1890 census (U.S. Census Office 1901:cxi).
Interestingly, only one table in the 1890 population census volume pre-
sented the data collected on the various categories of mixtures. It was entitled
“Colored Population Classified as Negroes, Mulattoes, Quadroons, Octoroons,
Chinese, Japanese, and Civilized Indians, by States and Territories: 1890” (U.S.
House of Representatives 1895:table 10, p. 397). In the other tables, the data on
race and color were generally presented in the columns for Negroes, Chinese,
Japanese, and the Civilized Indian Population.
10. These latter categories made up smaller proportions of the southwest
and northern territories, 9.6 percent and 1.0 percent, respectively (Heads of Fam-
ilies 1992).
N OT E S TO C H A P T E R 4
207

11. Maps showing the density of foreign population were also included in
this 1870 census (U.S. Secretary of the Interior, 1872b).
12. As the next chapter explains, the legal and citizenship status of free
mulattoes was originally not clear, and few states specified their status. Differ-
ent states resolved the issue differently (see Kettner 1978:287–333).
13. Counts for Indians and Chinese were reported in the 1860 census, but
it was not until 1870 that categories for these groups appeared on the census
form.
14. In the 1880 census, the “Asiatic” category was also more explicitly de-
fined as including Chinese, Japanese, East Indians, and so on and not including
Native Americans or “half-breeds” (U.S. House of Representatives 1883:xxxvi).
15. The table in the introduction of the 1890 census also included a sepa-
rate column tabulating “persons of Negro descent” (U.S. House of Representa-
tives 1895:clxxx).
16. When the Fourteenth Amendment was passed, persons of African ori-
gin could become naturalized citizens, but persons of Asian origin could not.
17. Mulattoes and blacks were also counted in the 1910 and 1920 censuses.
18. One exception was the distribution of the mulatto and black popula-
tion by state for 1910 and 1920 (U.S. Dept. of Commerce, Bureau of the Census,
1921:102).
19. Williamson (1984) and Davis (1992) see as ironic, but beneficial, the for-
mation of races in which people of African descent have triumphed over nega-
tive definitions and arrived at authentic and more constructive self-definitions.
According to Williamson, it was the acceptance of the “one-drop” rule that was
the antithesis to assimilation into white culture—which mulattoes and blacks
had earlier pursued—and the start of building a separate culture for blacks.
Wacquant (1994) sees this shift as demonstrating how “resistance” and the for-
mation of an oppositional cultural identity may, under certain historical condi-
tions, prompt the dominated to collude in the perpetuation of their own exclu-
sion. From yet another perspective, the hypodescent rule is seen to have had
more deleterious consequences: “The function of the one-drop rule was to so-
lidify the barrier between black and white, to make sure that no one who might
possibly be identified as black also became identified as white. For a mixed per-
son, then, acceptance of the one-drop rule means internalizing the oppression
of the dominant group, buying into the system of racial domination” (Spickard
1992:19).
20. The four categories were (1) both parents native born, (2) one parent
native born and the other foreign born, (3) both parents foreign born, and (4)
foreign born oneself. The last two categories were often combined in tables be-
cause they were thought not to “differ greatly in characteristics” (U.S. Dept. of
Commerce, Bureau of the Census 1922:10).
21. Census takers were instructed that “in order to obtain separate figures
208
N OT E S TO C H A P T E R 4

for Mexicans, it was decided that all persons born in Mexico, or having parents
born in Mexico, who were not definitely white, Negro, Indian, Chinese, or
Japanese, would be returned as Mexicans (Mex)” (U.S. Bureau of the Census
1989:60). This same census also contained a table entitled “Estimated Number
of Mexicans Included in the White Population in 1920,” that is, the number of
Mexicans who had been miscounted as “whites” in the previous census. The
table was accompanied by a chart of the number of Mexicans in selected states,
their birthplace, and whether they were of foreign or mixed parentage (U.S. Bu-
reau of the Census 1932:2).
22. The list of categories included white, Negro, American Indian, Japan-
ese, Chinese, Filipino, Hawaiian, Part Hawaiian, Aleut. Eskimo, and “(etc.).”
23. Although the 1960 census stated that race was derived from what was
“commonly accepted by the general public” (U.S. Bureau of the Census
1963:xx), it still maintained that groups of “color” included “Negroes, American
Indians, Japanese, Chinese, Filipinos, Koreans, Asian Indians, and Malayan
races” and added that “other races” included all “racial stocks” not listed sepa-
rately.
24. Interestingly, although self-classification was accepted, the enumera-
tors’ manual also contained a long list of possible classifications and how they
were to be reported. “For example, ‘Chicano,’ ‘La Raza,’ ‘Mexican American,’
‘Moslem,’ or ‘Brown’ were to be changed to white, while ‘Brown (Negro)’
would be considered as Negro or Black for census purposes” (U.S. Bureau of the
Census 1989:83). Consequently, persons who said they were “brown” were
white unless they indicated they were also “Negro.” Enumerators were also in-
structed to assume that unless they learned otherwise, the respondent’s rela-
tives living in the unit were also of the same race.
25. Many of the decennial censuses contained introductory sections in
which the census explained terms, concepts, procedures, and changes from the
previous census and noted problems in conducting the census. The terms used
in these “introductions” were not necessarily the same as those used on the cen-
sus form. For example, in 1950, “color and race” were explained in the intro-
duction, but the census form simply referred to “race.” The terms used in the in-
troductions also varied over time, although the term color was kept until 1960
(U.S. Bureau of the Census 1932, 1943, 1953, 1963, 1989:69).
NOTES TO CHAPTER 5
1. Many other groups were also counted in the “other race” category, for
example, Filipinos, but it was the Chinese (first counted in 1860) and the Japan-
ese (first counted in 1870) who were reported separately because they were seen
to constitute the largest “other race” groups.
2. The 1870 census states, “An Indian not taxed should, to put it upon the
N OT E S TO C H A P T E R 5
209

lowest possible ground, be reported in the census just as truly as the vagabond
or pauper of the white or the colored race. The fact that he sustains a vague po-
litical relation is no reason why he should not be recognized as a human being
by a census which counts even the cattle and horses of the country” (U.S. Sec-
retary of the Interior 1872a:22).
Correspondence to the Hon. James A. Garfield, chair of the Census Com-
mittee, from Dr. Franklin B. Hough (February 5, 1869) also notes the concern at
the time with counting the recently freed black population and Indians, who
lived on reservations but who were not otherwise counted because they were
not receiving annuities from the United States or who did not live on reserva-
tions but lived in U.S. territories, for example, Alaska (Ninth Census of the United
States 1869:13 ff).
3. The report specifically noted “how few of pure Indian race are to be
found outside of Government reservations” and how variously mixed were
others in camps or settlements popularly known as Indian (U.S. Secretary of the
Interior 1872a:19).
4. The report did not endorse the criterion applied to former slaves in
which children born of slave mothers were to be slaves. It stated that this un-
fortunate criterion “was the bad necessity of a bad cause, which required every
point to be construed against freedom” (U.S. Secretary of the Interior 1872a:19).
5. The 1870 census report states, “Where persons reported as ‘half-breeds’
are found residing with whites, adopting their habits of life and methods of in-
dustry, such persons are to be treated as belonging to the white population.
Where, on the other hand, they are found in communities composed wholly or
mainly of Indians, the opposite construction is taken. . . . In a word, in the equi-
librium produced by the equal division of blood, the habits, tastes, and associ-
ations of the half-breed are allowed to determine his gravitation to the one class
or the other” (U.S. Secretary of the Interior 1872a:19).
6. An issue on which there is some difference of opinion but little system-
atic research is how Europeans perceived Native Americans in terms of color.
Many Native Americans have intermarried, yet they are today classified as a
separate race. However, Wilson (1992:117) argues that Indians were not seen as
a “significantly darker race” until the 1750s and that they were not called “red”
until after 1800. He maintains that Indians were looked down on because of
their “brutishness” but that this was seen to be the result of custom and envi-
ronment and that it was partially ameliorated by the virtues of physical hardi-
ness, stoicism, and hospitality. Although they were referred to in negative terms
similar to those used for Africans, such comments did not usually refer to color
or physical features. Rather, it was “warfare, alien customs, and the enraging re-
fusal of Indians to accept the white man’s ‘civilization’” that contributed to neg-
ative views of Indians (quoted in Wilson 1992:117).
7. Wilson argues that the acceptance of the blood quantum approach rep-
210
N OT E S TO C H A P T E R 5

resents a “victory of the principles of racial stratification over ethnicity” and
that it also “contributes to the confusion between race and ethnicity, as Indians
are viewed and treated variously as a race and as an ethnic group” (1992:119).
8. Wilson (1992) cites the experiences of two of his students as illustrating
the way in which Native Americans commonly internalize these state defini-
tions. One student had consistently expressed a preference to be with full-
bloods until she discovered that she herself was not full-blooded. Another felt
consternation at discovering he was more Filipino than Native American.
9. The Continental Congress of 1775 had already established northern,
middle, and southern departments with boards of commissioners authorized to
conclude treaties with organized tribes. A permanent standing committee on
Indian affairs was established in 1776 (Kettner 1978:291).
10. As Kettner stated, “The idea of combining dependency and wardship
with the idea of a separate allegiance and nationality was perhaps inconsistent;
but it sufficed to exclude the Native Americans from the status and the privi-
leges of American citizenship” (1978:300).
11. In this regard, it is interesting that in most court decisions before the
Civil War, slaves whose masters lived in or were adopted by Indian nations
(e.g., the Choctaw) were not under the jurisdiction of Indian laws. Nor could
white men who were adopted into Indian tribes alter the obligations they owed
as a result of their primary citizenship (Kettner 1978:298–299). That is, federal
law took precedence in matters of citizenship and slavery.
12. This census also counted the number of free people of color and of
whites living in these particular nations (Kennedy 1862:10–11).
13. On an individual level, the desire to be white (as opposed to any other
color) has been rooted in the privileges and rights that this color offers. If this
were not the case, why would anyone want to be white instead of what they ac-
tually were? In other words, if the privileged color were yellow, then it would
be the desired color. This was recently illustrated in South Africa after
apartheid’s demise in 1994 when some “blacks” who had earlier passed into
“colored” status as relief from repression reverted to their black racial identities
(Duke 1998).
14. The 1790 law was in effect until 1952 when the Walter-McCarren Act re-
versed this policy. It states that “the right of a person to become a naturalized
citizen of the United States shall not be denied or abridged because of race”
(Takaki 1994:26). There is evidence that some nonwhite immigrants were “mis-
takenly granted U.S. citizenship” before 1952—for example, the Chinese be-
tween 1850 and 1882 and at least 420 Japanese immigrants before 1910 when the
Ozawa v. U.S. ruling stated unequivocally that the Japanese were “aliens ineli-
gible for citizenship” (Almaguer 1994:10).
15. Interestingly, some of the Punjabis in California married Mexican
American women in order to be able to own land (in their wives’ names)
N OT E S TO C H A P T E R 5
211

(Leonard 1992). In this way, they circumvented the prohibition against non-
white, foreign-born individuals owning land.
16. The law, which was officially entitled the “India Immigration and Nat-
uralization Act of 1946” (and unofficially known as the Luce-Celler Bill), also al-
lowed greater numbers of Indians to immigrate to the United States.
17. When exactly the classification of Asian Indians as white began is a
matter of some debate. They were clearly entitled to citizenship rights in
1946/47 and could own land. Some, particularly those of the second generation,
were classified as white because of their physical appearance, while others were
not (Leonard 1992:207). However, as late as 1960, the U.S. Bureau of the Census
still indicated in its census instructions that Asian Indians were to be classified
as racially “other” and that “Hindu” was to be written in for them (1989:78). It
was the same 1960 census that classified as “white” those southern Europeans,
Middle Easterners, and those Hispanics who were not definitely any of the
other races. Not until the 1970 census did the instructions indicate that a re-
sponse suggesting Indo-European stock (which included Asian Indians) was to
be included in the white category (U.S. Bureau of the Census 1973:app. 5).
18. The groups included with Asian Indians are Filipinos, Japanese, Ko-
rean, Vietnamese, Native Hawaiian, Guamanian or Chamorro, Samoan, Other
Asian, and Other Pacific Islanders. The last two categories allow individuals to
write in their “race.”
19. See Tienda and Ortiz 1986 for a very good analysis of the census items
in the 1980 census that are associated with an “Hispanic” identification.
20. In 1940, the census explained the procedure in the following way: “Per-
sons of Mexican birth or ancestry who were not definitely Indian or of other
Nonwhite races were returned as White” (U.S. Bureau of the Census 1943:3).
21. In 1970, for example, 93.3 percent of Hispanics were classified as
“white” (U.S. Bureau of the Census 1972:table 2).
22. A question about one’s “mother tongue,” or language spoken at home,
was included in the 1910, 1920, 1930, 1940, 1960, 1970, 1980, and 1990 censuses
(U.S. Bureau of the Census 1973: app. C).
23. In all likelihood, appearance was determined by white census enu-
merators, as the majority of census enumerators during this period were white.
24. The National Research Council’s recent analysis of the discussions
about the changing federal standards for racial and ethnic classification took a
similar approach. For example, see pp. 2, 15, and 18 in Edmonston, Goldstein,
and Tamayo Lott 1996.
NOTES TO CHAPTER 6
1. This concept of “new people” is borrowed from Williamson (1984), al-
though he uses it to refer solely to African Americans in the United States. As
212
N OT E S TO C H A P T E R 5

used in this chapter, Latin America refers to Spanish- or Portuguese-speaking
Central and South America and the Spanish-speaking Caribbean.
2. Russell, Wilson, and Hall (1992) argue that similar ideas developed in
the African American community and flow from earlier distinctions between
field and house slaves, who often had European ancestors. See also Frazier
1962:162–175.
3. See, for example, Adams 1989, who argues that the size of the
Amerindian population that survived in Central America is an important, but
neglected, variable in understanding the histories and current-day situations of
many Central American countries.
4. The classic example of changing “race” over space is given in the de-
scription of how the “race” of a Latin American man can change from “white”
in Puerto Rico to “mulatto” or “mestizo” in Mexico to “black” in the United
States. This example also illustrates each country’s distinct racial constructions.
5. Although these terms are fluctuating and ambiguous and vary some-
what from country to country, some rough equivalents for common terms are
trigueño/a (wheat colored), jabao (high yellow), moreno (dark skinned, with a va-
riety of hair textures and features), and indio (Indian prototype, straight haired).
6. Davis refers to the hypodescent rule as assigning racially mixed persons
to the status of the subordinate group. He contends that this “American cultural
definition of blacks is taken for granted as readily by judges, affirmative-action
offices and black protestors as it is by Ku Klux Klansmen.” He also states that
this rule is also known as the “one black ancestor rule” because it is not as strin-
gently applied to other nonwhites (1992:5).
7. Forbes (1988) argues that the evolution of the term mestizo (or hybrid) re-
flects this shift. He contends that the word hybrid was formerly used to refer to
any type of mixture, for example, wild and tame or citizen and stranger. But
gradually, a narrow, more “racial” concept of hybrid was emphasized, which
came to be called mestizaje in Latin America.
8. See Denton and Massey 1989, who reviewed the central role of the
Catholic Church with regard to the consideration of African slaves as having
souls and therefore being worthy of saving.
9. Hoetink (1985) also argues that the non-Hispanic Caribbean had
sharper class divisions, and the Hispanic Caribbean had more continuity.
10. According to Gutiérrez, calidad was a summation of several measures
of social worth in the community: religion, race, ethnicity, legitimacy, occupa-
tion, and ownership of land (1991:202 ff).
11. It is unclear to what extent this secondary source, first published in
1932, may have overlooked—and consequently obscured—particular notations
of color or mixture in the originals.
12. It is possible that in the period before the first decennial census, racial
classifications may have been less rigid. See appendix C, which describes the
N OT E S TO C H A P T E R 6
213

evidence for this in Smith and Wojtowicz’s 1989 and Meaders’s 1993 analyses of
advertisements for runaway indentured servants between 1728 and 1790.
13. O’Crouley’s 1972 text also contains illustrations and descriptions of the
“modes of dress” of these mixtures and families.
14. According to O’Crouley (1972), mestizo referred to the cross between a
Spaniard and an Indian, castizo to the cross between a Spaniard and a mestizo.
15. The genre of casta (caste) painting was developed in the beginning of
the eighteenth century, mainly in Mexico and Peru. The casta paintings were a
series of fourteen to twenty paintings that depicted families and individuals
that had interbred, and their offspring. Although little is known about who
specifically commissioned them, it is assumed that they must have been
wealthy peninsular Spaniards or criollos, that is, persons of full or partial Euro-
pean descent born and/or raised in the Spanish colonies. They were often
painted by unknown, indigenous, or mestizo painters (García Sáiz 1996).
16. These were often the unacknowledged children of slave owners. It is
curious that both these terms referred to animals, whereas terms referring to
other “mixes” did not. This may have reflected the negative view of such chil-
dren or simply the strongly agrarian environment of the time.
17. Forbes says that the term loro (or the feminine lora) was the archaic term
used in Spain for people from North Africa, the Canary Islands, the Americas,
or India. It was sometimes used to refer to mixed individuals, but it was also
used to apply to brown-skinned persons. He also notes that the first Spanish ex-
plorers referred to the indigenous people as loro colored but that after 1570, the
use of this term declined. Today this is the term used for a “parrot” (1988:111).
18. As Cotter 1996 and the essays in Katzew 1996 suggest, interpreting the
racial climate that these paintings reflect is quite difficult. Cotter, for example,
concluded that they represent a fictional melting pot with mixed messages of
half-celebration and half-coercion and that this is the legacy of Latin America
today.
19. Gutiérrez found in his analysis of northern Mexico that the vast major-
ity of racial mixing in 1750 and in 1790 occurred among mixed bloods. In other
words, “like married like.” He argues that this might have made more precise
racial or physical distinctions less important or possible. However, he rejects the
notion that persons were blind to race (1991:292). Klor de Alva (1996:60 ff) and
MacLeod (1973) also noted the expansion in number and variety of mixed peo-
ples during the early colonial period.
20. According to MacLeod 1973, these groups were free but were not seen
to be the social or legal equals of Creoles or Peninsulares. They were viewed as
antisocial elements who served as intermediaries with the Indians. Their rapid
growth and their possible alliance with the Indians also were feared.
21. Specifically, this has been found to be the case with regard to census
categories in Canada (Statistics Canada and U.S. Bureau of the Census 1993), in
214
N OT E S TO C H A P T E R 6

the United States (Lee 1993; Martin, DeMaio, and Campanelli 1990; Miller 1991),
and in the Americas (Almey, Pryor, and White 1992).
22. Stephens defined pardo or parda as “gray” or “brown” (1989:341).
23. The literature in this area on Brazil is extensive; see the following for an
analysis of past and more contemporary views of the development of race ide-
ology and practices in Brazil: Andrews 1980, 1991; Brookshaw 1986; Degler
1986; Dzidzienyo 1993; Fernandes 1969, 1979; Fontaine 1985; Frazier 1942; Han-
chard 1994; Hellwig 1992; Margolis and Carter 1979; Nobles 1995; Silva and
Hasenbalg 1992; Skidmore 1990; Telles 1992, 1993, 1994; Winant 1992).
24. Café con leche is translated literally as “coffee with milk,” and in Latin
America, this color covers a range from beige to mocha. Mestizaje refers to a bi-
ological and cultural mixture, as in the term mestizo, which refers to someone
who is half-Indian and half-Spanish. Indigenismo refers to the indigenous pop-
ulation, and cryptomelanism is a term created to signify the death of “melanin,”
or color.
25. Graham perhaps best described the influence of such ideologies: “It is
now commonplace among historians to refer to hegemonic ideologies through
which, it is argued, dominant classes shape the entire culture of their society,
creating the predominant intellectual categories and limiting the possible range
of any challenge. These ideologies are accepted (at least for awhile) by the very
groups who are thereby controlled. The idea of race as it was formulated in the
19th century seems to have served that function” (1990:1).
26. As Winant pointed out, race is always being contested and defined.
Elites, popular movements, state agencies, religions, and intellectuals of all
types develop racial projects that interpret and reinterpret the meaning of race
(Winant 1992:183).
27. These were studies conducted or commissioned by the census as part
of its efforts to determine why people were either missed or erroneously in-
cluded in the last decennial census. A number of reasons were found for the un-
dercount of various groups in diverse areas of the country. They were (1) irreg-
ular and complex household arrangements (plus the fact that different groups
conceived of households differently and would, therefore, not include persons
living in the household but not considered members of the household, for ex-
ample, boarders; (2) irregular housing (some households were not counted be-
cause their living quarters were not visible to postal clerks, being, for example,
behind and above a commercial establishment); (3) residential mobility; (4) fear
of government and outsiders; and (5) a poor command of English (de la Puente
1993:37).
28. This study used cognitive, in-depth interviews and focus groups in
Washington, D.C., San Francisco, and Los Angeles. The sample was chosen so
as to include immigrants for whom English was not their first language, as well
as Hispanics who spoke only English.
N OT E S TO C H A P T E R 6
215

29. When comparing Hispanics with other “races,” the researchers as-
sumed that Hispanics were a “race.” It is unclear whether they shared the
Latino view of “race” or if they were using another criterion. As noted earlier,
according to the current census policy, Hispanics can be of any race.
The question about ethnic origin did not elicit within-country ethnicity, for
example, Mayan Guatemalan. The authors recommended that to gather such
information, the census should change the phrase “ethnic origin” and ask: Cual
es el origen de esta persona? “What is this person’s origin?”
NOTES TO CHAPTER 7
1. The Census Bureau asked a similar question in the 1970 census, but it
was included only in the 5 percent sample questionnaire. The question asked
for the person’s origin or descent and provided five categories: Mexican, Puerto
Rican, Cuban, Central or South American and Other Spanish, and a final “No,
none of these.” (McKenney and Cresce 1993). With regard to the race question,
what had been eight categories in the 1970 census became, through modifica-
tions and additions, fourteen categories in 1980. These fourteen categories were
listed under the four major categories, that is, white, black, Asian and Pacific Is-
lander, and Native American Indian.
2. I examined these data by gender and found few differences between
males and females with regard to the general issue of racial classification. Con-
sequently, I have not presented separate data for men and women.
3. A subcategory called “Asian and Pacific Islander” was also included for
the first time in 1990.
4. Denton and Massey (1989) and Massey and Denton (1992) explicitly
mentioned this interpretation. Others, e.g., Rosenbaum (1996) and Rodríguez
(1990, 1991a), did not define the category as a mixed-race category but did use
the category in their analyses. Given the predominance of the bipolar perspec-
tive, some readers assumed that if the category was called “other race,” it had
to mean that those in the category were “other than white or black,” that is, mu-
lattoes or mestizos.
5. See Rodríguez 1990 and Massey and Denton 1992, who noted the
difficulties of discerning race from Hispanics’ subjective responses on the
census.
6. This sample is described in chapter 3. These were preliminary results.
7. There was some reaction. In 1988, the U.S. Office of Management and
Budget proposed adding an “other” racial category to Directive 15, but mem-
bers of Congress, some of the federal agencies, and “members of some of the mi-
nority communities” opposed it (U.S. House Committee 1994n:215).
8. With the exception of some articles, for example, Wright 1994 and San-
dor 1994, there was also relatively little coverage of the issue in the popular
216
N OT E S TO C H A P T E R 6

press. Neither the English- or the Spanish-language media took much notice of
the 1980 results.
9. It also referred to the 10 percent of the general population who did not
answer the Hispanic-origin question.
10. External effects on identification have been acknowledged for Native
Americans. A U.S. Department of Labor study of racial and ethnic identification
recognized that the identification of American Indian, Eskimo, or Aleut “may
not be straightforward” and “may have a reliability problem and be sensitive to
methods effects (e.g., the way the question is asked)” (1995:2).
11. With regard to the race question, 98 percent of whites, 96 percent of
blacks, and 91 percent of Asian and Pacific Islanders gave the same answer dur-
ing a reinterview study that they had given on the census questionnaire (U.S.
General Accounting Office 1993:22 ff).
12. Reporting race was less consistent for Hispanics and a number of other
groups, for example, multiple-race persons, the foreign born, and persons who
did not read or speak English well (U.S. General Accounting Office 1993:22 ff).
13. The question asked was “How would you describe yourself racially?”
14. A recent and dramatic example of how just the presence of particular
groups on census forms could influence responses was noted in the last Cana-
dian census. By including the category “Canadian” in its list of sample answers,
next to its question on ethnic origins, the number of people who reported this
ancestry increased eight times over that in 1991 (Norris 1999:A9).
15. This analysis was based on the 1990 PUMS (Public Use Micro Sample)
5 percent sample and included individuals who answered affirmatively to the
Hispanic-identifier question on the 1990 census. In this analysis, Mexicans,
Puerto Ricans, and Cubans refer to those who checked one of these categories
on this census question. The “other Latin American” (OLA) group are those
who indicated their “origin” from a Spanish-speaking country in the Caribbean
or Central or South America. The “other Spanish/Hispanic” (OSH) group are
those respondents who reported in a less country-specific way, for example,
that they were “Hispanic,” “Spanish,” “Spanish American,” “mestizo,” or
“Meso-American Indian.” (See appendix A for a discussion of the data limita-
tions of the 1990 census.)
16. For example, the distribution of Cubans was different from that of
Mexicans and Puerto Ricans. Cubans with both little and much education re-
ported they were “other race” much less often than did the other groups. Only
14.4 percent of Cubans with an eighth-grade education or less classified them-
selves as “other,” whereas the proportions of Mexicans and Puerto Ricans with
an equivalent education were higher and similar, 52.7 percent and 52.3 percent,
respectively.
17. For example, among those with a graduate education, the proportion
classifying themselves as “other race” continued to be substantial for Mexicans
N OT E S TO C H A P T E R 7
217

(32.3%) and Puerto Ricans (31.4%). Figures for the other groups were “other
Latin Americans” (21.1%), “other Spanish/Hispanics” (11.5%), and Cubans
(8.7%).
18. The 1990 data do not show self-classification as black to be associated
with age or education in any consistent or distinct pattern. Because the numbers
reporting they were Asian, Pacific Islander, or Native American Indian were so
small, they are not discussed in detail.
19. Of the “other Spanish/Hispanic” group, 70.74 percent of those eight-
een and older were born in the United States; Mexicans, 41.60 percent; and
Puerto Ricans, 42.66 percent.
20. Differences between how the U.S. born and the foreign born reported
race were slight in some cases. For example, 56.2 percent of U.S.-born Mexicans
reported that they were white, compared with 44.8 percent of immigrant Mex-
icans, and somewhat more Mexican immigrants in this age group (54.0%) re-
ported that they were “other,” compared with the U.S.-born group (41.62%).
The differences were smaller for Puerto Ricans: 48.09 percent of Puerto Ricans,
eighteen and older, who were born in the states classified themselves as white,
compared with 47.4 percent of those born abroad. Similarly, 42.66 percent of
those born in the states reported that they were “other,” compared with 47.8
percent of those born abroad. The differences were more marked for the “other
Spanish/Hispanic” group, with 63.19 percent of those born in the United States
reporting that they were white, compared with 52.9 percent of those born
abroad. The figures for those reporting that they were “other” were 23.87 per-
cent for the U.S. born and 25.9 percent for the foreign born. In addition, more of
the foreign-born persons in the OSH group reported they were “black” or
“Asian and Pacific Islander.”
21. Earlier research on Puerto Ricans in New York City suggested some
preliminary evidence of a “browning” phenomenon, in which individuals
see themselves as, or identify themselves with, nonwhites. This is a reversal
of the “whitening” process more prevalent in Latin America (see Rodríguez
1974). I discovered (Rodríguez 1989, 1990) that among mainland-born Puerto
Ricans, a slightly higher proportion classified themselves as black, and fewer
as white, than did island-born Puerto Ricans. I obtained similar results in
1990 for U.S.-born Mexicans and Puerto Ricans, but not for the OSH group.
But generalizations about “browning” versus “whitening” are risky because
the cell sizes were small; for example, 70 percent of the OSH group was born
on the mainland.
22. “Speaking only English at home” is only a partial proxy for language
knowledge. We cannot assume that because individuals report they speak
“only English at home,” they do not speak Spanish at all.
23. The pattern is the same for other groups, though with differences of de-
gree. Among Cubans, 10.5 percent of those who speak only English checked
218
N OT E S TO C H A P T E R 7

“other race,” compared with 12.4 percent of Cubans who speak Spanish at
home. For “other Latin Americans,” the respective figures are 23.7 and 36.1 per-
cent, and for the “other Spanish/Hispanic” group, 18.7 and 36.4 percent.
24. For Mexicans speaking only English, the figures are 58.4 percent white,
1.9 percent black, and 2.4 percent API/NAI. This contrasts with 48.3 percent
white, 0.5 percent black, and 0.6 percent API/NAI for those who speak Spanish
at home. This pattern also holds for Puerto Ricans, other Spanish/Hispanic,
and other Latin Americans. Interestingly, a lower proportion of Cubans speak-
ing only English reported that they were white (76.6%), compared with Cubans
who speak Spanish at home (84.4%). But consistent with the general pattern of
the other groups, higher percentages of those who speak only English reported
that they were black or API/NAI.
25. This study used logit regression to analyze the original survey data of
258 travelers to Puerto Rico—half of the sample lived in Puerto Rico and the
other half in the United States. It controlled for age, education, amount of time
spent in the United States, and the respondents’ perception of how North
Americans saw them racially.
26. I found (Rodríguez 1989) that for Hispanics, identifying as “other race”
in 1980 was positively associated with the density of the Hispanic population in
a particular state and negatively associated with the proportion of blacks in that
state. It was not associated, however, with the proportion of whites in a partic-
ular state. I believe that the more salient the biracial structure was, that is, the
greater the proportion of blacks was, the more likely Hispanics were to give
biracial classifications for themselves as white or black. Conversely, the greater
the proportion of Hispanics was, the more likely they would identify as “other
race” and write in a Latino referent. There was a great deal of variation from
state to state in the proportion of Hispanics who identified as “other race,” from
6 percent in West Virginia to 48.5 percent in Kansas.
27. According to Bates and colleagues (1994), reversing the Hispanic and
race items also reduced Hispanics’ nonresponse rates for this question, but the
amount of reduction varied in three experiments conducted in 1990.
28. Puerto Ricans are not immigrants, but the census does provide the year
that they first came to the mainland to stay. See Rodriguez 1989c for a discus-
sion of the (im)migrant status of Puerto Ricans.
29. Of Cubans who immigrated within the last ten years, 78.25 percent
identified as white, compared with 86.06 percent of those who immigrated be-
fore 1980. More of the recent immigrants identified as black (4.95%) or “other”
(16.24%), compared with the earlier immigrants, 2.35 percent of whom identi-
fied as black and 11.18 percent as “other.” Many recent Cuban refugees—de-
scribed in the popular press as “Marielitos”—were seen as “darker” and as hav-
ing lower-class origins than the earlier waves of post-Castro immigrants.
30. In the Dominican case, although the proportion who classified
N OT E S TO C H A P T E R 7
219

themselves as white was the same for both recent and earlier immigrants,
the proportion of immigrants checking “black” increased, from 26.77 per-
cent to 32.27 percent. However, the percentage of recent immigrants indicat-
ing they were “other” decreased, from 43.68 to 38.16 percent.
31. Panamanians had another transformation, with the percentage classi-
fying themselves as black dropping from 46.94 to 24.32 percent and the propor-
tion reporting that they were “other” rising from 22.16 to 42.04 percent after
1980. The apparently greater shifts in the Panamanian group may have been af-
fected by the group’s relatively smaller size.
32. For example, there was a slight decrease in the number of Ecuadorian
and Guatemalan immigrants classifying themselves as white and an increase in
those reporting they were “other.” Also, many fewer of the OSH group classi-
fied themselves as white before 1980 (56.78%) compared with the last ten years
(47.14%). However, given the polyglot composition of this latter group, it is dif-
ficult to determine the reason for this.
33. In other words, they classified themselves as racially white and an-
swered questions in cultural terms.
NOTES TO CHAPTER 8
1. Other proposals were made or discussed, for example, Katzen, from the
OMB, referred to proposals to provide an open-ended question to solicit infor-
mation on race and ethnicity or to combine the concepts of race, ethnicity, and
ancestry, but these did not receive much attention at this time (1994:219).
2. Although no major alliances were projected, many of those testifying,
particularly the federal representatives, did comment on the proposals and ex-
pressed support (or the lack of it) for the different proposals. For example, the
National Coalition for an Accurate Count of Asians and Pacific Islanders did
support the proposal of Native Hawaiians as presented (U.S. House Committee
1994r:95). Others provided qualified commentary on the proposals. The pro-
posal for a multiracial category particularly engaged the attention of many of
those at the hearings, although it too was not endorsed by most of the private
or public groups testifying. Indeed, Dr. B. Tidwell of the National Urban League
(U.S. House Committee 1994d) was more explicit than others about opposition
to the multiracial proposal when he expressed concern about the potential im-
pact of such a category on the numerical representation of blacks.
3. Many reject this mutually exclusive approach (see Graham 1994; Root
1992b, 1996), but others resist a “mixed race” classification (see Jones 1994; Sin-
clair 1994).
4. This “other race” category was not viewed as a satisfactory option by
the multiracial groups, for it implied to them that individuals were “none of the
above” while their position was that they were “more than one of the above.”
220
N OT E S TO C H A P T E R 7

As noted earlier, this position resonates with some Hispanics, who also feel that
they are “more than one of the above.”
5. It should be noted that at this point in the process, the representative ac-
knowledged that the group’s constituency had not yet formed a consensus ap-
proach with regard to ethnicity, race, and minority status.
6. Although increasingly used in the United States, the term people of color
has also been used in more international contexts. It is both a cultural/ethnic
and a political definition of identity that is often a response to the privileged
conception of the term white.
7. The “Asian and Pacific Islander” census category had thirty different
ethnic groups, each with its own language, health statistics, education, income,
and history in the United States (U.S. House Committee 1994h).
8. In this context, they gave the example of persons from the Indian sub-
continent who had not been considered “Asian” and had lobbied successfully
to be counted not as “whites” but separately within the “Asian and Pacific Is-
lander” category.
9. This was a subcommittee of the U.S. House of Representatives Commit-
tee on Post Office and Civil Service. It held hearings on May 28, 1974; June 12,
1974; March 21, 1975; March 21, 1975; and June 1, 1976.
10. The MALDEF statement also indicated that a more important problem
was the “lack of a uniform definition of ‘Hispanic’ throughout the Federal Gov-
ernment”—for example, the Department of Labor included Americans of
Brazilian and Portuguese ancestry in its definition of “Hispanic,” but the cen-
sus did not (U.S. House Committee 1994k:178). MALDEF argued that this lack
of uniformity compromised the data on Hispanics.
11. In this study, all four groups had a “preference for Hispanic origin as a
racial category.” The range for all four groups was 61 to 74 percent expressing
this preference, with those who had received the combined question having a
higher majority (U.S. Dept. of Labor, Bureau of Labor Statistics 1995:table 3).
12. The approach taken in Directive 15 is compatible with the Census Bu-
reau’s approach, for census data can be manipulated and presented in the form
required by Directive 15. Many governmental agencies, as well as academic and
private-sector researchers, collect their data using the Directive 15 categories.
Directive 15 has been criticized because its classification criteria are not
uniformly applied to all groups. The directive establishes four criteria for clas-
sifying persons into racial or ethnic categories: (1) descent from original peoples
of specific regions or nations, (2) a specific cultural origin, (3) cultural identifi-
cation or affiliation, and (4) physical race itself. The directive includes as
“white” any person with origins in any of the original peoples of Europe, North
Africa, or the Middle East. Thus, Arabs from these areas are classified as white,
but a specific cultural origin is used to classify Hispanics and not Arabs (Hahn
1992, 1994; Hahn, Mendlein, and Helgerson 1993).
N OT E S TO C H A P T E R 8
221

13. Specifically, the NCLR statement said: “While we recognize and un-
derstand that there is a technical difference between the terms ‘race’ and eth-
nicity, frequently these terms are interchangeably used by society. The practical
consequences of ‘Hispanic’ as a ‘race’ then, warrant that it be included in the
racial identifier question. The absence of such categorization [i.e., Hispanic]
contributes to a ‘black-white’ paradigm currently used to discuss the concept of
and issues related to race in the U.S.; as the changing demographics confirm,
that paradigm is neither accurate nor useful” (U.S. House Committee
1994p:177).
14. As just noted, the NCLR also attached to its position paper recom-
mended census questions that included retitling the race item “Race/Ethnicity”
and retaining the separate Hispanic question. Hence, although it appeared to be
in favor of making “Hispanic” a race, the NCLR supported “the consideration
of a question that would read, ‘Race/Ethnicity,’ followed by the ‘White, non-
Hispanic,’ ‘black, non-Hispanic,’ the other categories as currently listed, and
‘Hispanic’” (U.S. House Committee 1994p:177). Thus, the NCLR would make
the race question a race/ethnicity item. This suggests that its view of “race” was
still more akin to the “social race” concept associated with Latin American
views of race (Pitt-Rivers 1975; Wagley 1965).
15. This comment suggests that when race and ethnicity are explicitly
combined and defined as such, many issues disappear. Fernández seemed to
recommend a similar approach in his testimony, that whenever information
was sought on both racial and ethnic groups, a category called “multiracial/
multiethnic” be used (1992:128).
16. Two other issues were also examined: (1) the inclusion of a multiracial
category and (2) preferences for such terms as “African-American” or “Latino.”
17. These findings were first evident in the special Current Population Sur-
vey sample, which was divided into four panels, two of which were asked a
question in which Hispanics were listed as a category in the race question, and
the other two were asked separate race and Hispanic-origin questions. The re-
spondents were first visited and then interviewed a number of times by phone
for more than a year (U.S. Dept. of Labor, Bureau of Labor Statistics 1995). The
proportion that identified as “Hispanic” dropped significantly (by 20% to 25%)
when the combined question was used. Fewer Hispanics also reported they
were “white” (4% to 5% less) (U.S. Dept. of Labor, Bureau of Labor Statistics
1995:4, table 8). As indicated in the study, “a higher percent of people identified
themselves as Hispanic when they were asked a separate question than when
Hispanic was included as a racial category” (U.S. Dept. of Labor, Bureau of
Labor Statistics 1995:2).
The extent to which different Hispanic groups chose the “Hispanic” race
group varied by national origin, with Cubans being “more likely to identify as
222
N OT E S TO C H A P T E R 8

‘White’ in all panels” compared with the other Hispanic-origin groups (U.S.
Dept. of Labor, Bureau of Labor Statistics 1995:4). Thus, some groups, such as
“Cubans and ‘Other Hispanic’ are less likely to be included as Hispanics when
Hispanic is included in the list of races” (Tucker et al. 1996:45). This is in keep-
ing with the findings discussed in chapter 7 on who chooses the “other race”
category.
18. Specific dissatisfactions were that there had been little research on the
substantive meaning or relevance of the Directive 15 categories and that some
respondents did not identify with or find applicable any of the available cate-
gories while others encountered technical difficulties because of the current
wording of the directive. Examples of these difficulties were that persons of
Hispanic ethnicity were explicitly assumed in Directive 15 to be either white or
black and not Asian and Pacific Islander or American Indian and Alaskan Na-
tive. There was no race category that included persons native to Central and
South America, no race category for blacks from areas in the world other than
Africa, and uncertainty about many persons from northern Africa. There also
were problems with classifying Brazilians and persons from Spain who were in-
cluded with Hispanics and were thus separated from other European groups
(Edmonston, Goldstein, and Tamayo Lott 1996:25).
19. The report was a response to the request for information from the com-
mittee overseeing the preparation of the 2000 census. It also indicated that the
Government Accounting Office had earlier provided the subcommittee with in-
formation on December 15, 1992.
20. Other groups that also did not consistently give the same response
were Native Americans (only 59% were consistent) and “Other Asian or Pacific
Islanders” (18%) (U.S. General Accounting Office 1993).
21. In 1990, the allocation rate for the race question was 2 percent. In other
words, 2 percent of those who responded to the census form did not answer this
question; consequently they were allocated (assigned) to another race. This rate
was comparable to the allocation rates for other questions on the census, but it
did represent an increase from 1.5 percent in 1980 (U.S. General Accounting Of-
fice 1993).
22. The census indicated that the increase from 1980 to 1990 in the His-
panic-origin allocation rate was due to a lower level of follow-up in 1990. In
1980, the census corrected missing or inconsistent information in phone calls or
visits. In 1990, funds for these correcting activities were given to other areas, for
example, unanticipated cost increases and new program priorities (U.S. General
Accounting Office 1993). A preliminary analysis did not find any consistent bias
in the 10 percent allocated (U.S. General Accounting Office 1993).
23. This report did not indicate the response rate for Hispanics and non-
Hispanics on the Hispanic-origin question.
N OT E S TO C H A P T E R 8
223

24. This was termed high inconsistency in the Other-Hispanic category.
25. In making this statement, I am not advocating a conspiracy theory or
even suggesting that those who organized the hearings were remiss in their
arrangements. Rather, I am referring to the general lack of Hispanic input in all
the discussions concerning reevaluations of the race and ethnic measures. The
hearings were just a reflection of this.
26. As noted earlier, this is not to say that sequencing and the presence of
a multiracial category are unimportant, for when the race question was asked
first and the “multiracial” category was not included, more Hispanics (42.9%)
chose “other race” (see table 8.1). When a mixed-race category was offered and
the race question was asked first, 33 percent chose “other race.” This suggests
that—as discussed in earlier chapters—for some Hispanic respondents, “other
race” represents a mixed-race response. The presence of the multiracial cate-
gory reduced the number that chose the “other race” category in the race-first
scenario (U.S. Bureau of the Census 1996a:table 11). However, as the figures in-
dicate, this was not the case for all, for 33 percent still chose the “other race” re-
sponse under these same conditions.
Moreover, there are other indications of the importance of sequencing.
When we asked the “Hispanic” question first, the proportion of Hispanics who
chose the “other race” category was almost the same, regardless of whether a
multiracial category was offered (25.1%) or not (24.9%). Thus, a quarter of the
Hispanics still chose “other race” even when a multiracial option was available
and they had already indicated their Hispanic identity (U.S. Bureau of the Cen-
sus 1996a:table 12). In the RAETT study, changing the sequence also reduced—
but did not eliminate—the number of nonresponses to the “Hispanic” question
(de la Puente et al. 1997).
27. Other changes include the separate listing of Asian Pacific Islander
groups without a generic category called Asian or Pacific Islander. The OMB
also allowed the census to use, in the 2000 census only, a sixth category, called
“Some other race” (print race) (U.S. Office of Management and Budget 1999:13).
28. This group of 165,000 was not uniformly distributed (U.S. House Com-
mittee 1994l).
29. The then–acting director of the census stated that “the dynamic nature
of ethnicity and to a lesser extent, race, further complicates the evaluations of
the questions. Ethnicity totals are in constant flux. Ethnicity distributions
change as a result of new immigration flows, new and different ways of identi-
fying ethnicity, blending, and intermarriage, and the emergence of new ethnic
identities” (U.S. House Committee 1994f:14). See also U.S. Bureau of the Census
1990:5 for recent assessments of the race and ethnicity questions.
30. Congressman Sawyer’s two other lessons were that there was a need
“to continue to collect race and ethnic data” and that there “should continue to
be uniform data across government agencies.”
224
N OT E S TO C H A P T E R 8

NOTES TO APPENDIX A
1. The National Center for Health Statistics, for example, coded Hispanics
into the “white” category on vital statistics records (McKenney and Bennett
1994:21).
2. The common factors were age, relationship to household head, and in-
come. Factors that varied by group were household size, sex, education, and
district office mail response rates. The differences between groups decreased
when covariates were added.
3. Mail response rates were also generally lower in the 1980s than in the
1970s, despite the census’s efforts to improve response rates (Fein 1990:298).
NOTES TO APPENDIX B
1. The American College Dictionary (New York: Random House, 1957:595)
states that the term hypo is a “prefix meaning ‘under’ either in place or in degree
(‘less’ or ‘less than’).”
2. In 1990, Asian/white marriages constituted the largest group of interra-
cial marriages, 31 percent. In the majority of Asian/white unions, the father is
white. About as many American Indian women marry whites as do American
Indian men. In the majority of black/white marriages, the father is black (Ben-
nett, McKenney, and Harrison 1995:table 1).
3. The growing consensus on this statement is evident in Gutin’s comment
about scientists involved with the Human Genome Diversity Project. She says
that the scientists repeat, almost like a “mantra,” that “the patterns of variation
that appear at the genetic level cut across visible racial divisions.” This genetic
unity means, for instance, that “white Americans, though ostensibly far re-
moved from black Americans in phenotype, can sometimes be better tissue
matches for them than are other black Americans” (1994:73).
NOTES TO APPENDIX C
1. This shift has not been given much attention in the literature or in most
accounts of changes in census classifications (see, e.g., Anderson, 1988; U.S. Bu-
reau of the Census 1978, 1989). The question is why researchers and others have
not more closely examined it. One possibility is that the shift may have been
seen as inconsequential because of the size of the category. Or it may have been
seen as reflecting a change in terminology but not in the definition of the group.
In other words, the researchers may have simply assumed that the category re-
ferred to people of color and not been aware of the absence of a color term or
deemed the absence to be insignificant. Nonetheless, this difference in census
categories was the first notable change since the census began. The one other
N OT E S TO A P P E N D I X C
225

change, the inclusion of the term “except Indians not taxed” in the “all other
free persons” category in 1800 seems to have been one mainly of clarification.
2. The first act, which established the 1790 census, authorized U.S. mar-
shals to count the inhabitants in their districts, “omitting Indians not taxed, and
distinguishing free persons, including those bound to service for a term of
years, from all others; distinguishing also the sexes and colours of free persons,
and the free males of 16 years and upward from those under that age” (Wright
1956:43). The subsequent legislative acts establishing the 1800, 1810, and 1820
censuses were similar in that they retained this phrasing.
3. If we knew how the first census law was put into effect, we might know
why “colors of free persons” was not determined, despite the legal requirement
to do so. Just how President George Washington and Secretary of State Thomas
Jefferson put the first census law into operation is “not definitely known”
(Wright 1956:44). A search of correspondence files “did not reveal any record of
correspondence with the marshals” for the 1790 census other than that relating
to the transmission of their commissions (Wright 1956:44). A letter dated March
31, 1790, containing two copies of the census act was sent to the state governors,
and they may have instructed the marshals (Wright 1956:44).
4. The 1820 census also counted for the first time the gender and ages of
“free colored persons” and of “slaves.” But the gender and age of “foreigners”
or of “all other persons, except Indians not taxed” were not recorded (U.S.
Statutes at Large 1963:550; Census for 1820 1821:no. 1, n.p.). Interrogatory 33 in
the 1820 census specifically instructs the assistants of the marshals to determine
“how many other persons, EXCEPT INDIANS NOT TAXED?” (Census for 1820,
1821:no. 5, n.p.).
5. Actually, the House passed Madison’s proposal, but the Senate did not.
Since Senate sessions were closed during this period, it is not known exactly
why the Senate did not approve it.
6. The shift from “all other free persons” to categories of color was only
minimally addressed in the decennial censuses. For example, the 1850 census
notes in one table that the “free colored persons” category includes “THOSE
RETURNED UNDER THE DENOMINATION OF “ALL OTHER FREE PER-
SONS, EXCEPT INDIANS NOT TAXED” (capitalization in the original). A foot-
note to this table adds that “it is proper to remark, that prior to 1820 the returns
of slaves and free negroes were made in gross numbers, without regard to sex
or age; and, indeed, at that period a small portion of the latter class were re-
turned under the general appellation of [following in italics] all other free persons,
except Indians not taxed” (U.S. Secretary of the Interior 1853a:table xxxvii). Re-
gardless of how this footnote is interpreted, that is, as acknowledging an error
or a simple shift, the change was clearly not worthy of much discussion. More-
over, most of the later tables (comparing these population groupings over time)
completely ignored the distinction between “all other free persons” and “free
226
N OT E S TO A P P E N D I X C

colored” (see, e.g., U.S. House of Representatives 1895:xcv–xcvi; U.S. Secretary
of the Interior 1853a:xxxvi, 6, 926, tables ix and lxvii).
7. The city’s wards also varied greatly in the proportions in their popula-
tions of (a) slaves and (b) “all other free people.” For example, while slaves con-
stituted only 6 percent of New York City’s total population, they constituted
23.5 percent of the total population of the borough of Harlem. Similarly, while
“all other free people” constituted 3.3 percent of New York City’s total popula-
tion, they constituted 5.1 percent of the total population of Harlem (Heads of
Families 1992:119–124).
NOTES TO APPENDIX D
1. Given that this census was taken on the eve of the Civil War, the accu-
racy of its figures is unreliable, as are the figures of many of the earlier censuses.
2. This census found that the population of whites had risen by 38 percent,
while that of slaves and free colored had increased by less than 22 percent be-
tween 1850 and 1860. The previous seventy years showed a similar contrast, 485
percent versus 757 percent. The report also predicted that many of the emanci-
pated slaves would be of mixed descent, since “in 1850 one-ninth part of the
whole colored class were returned as mulattoes.” Finally, it discussed the num-
bers of Negroes who had gone to Liberia between 1820 and 1856, the majority
of whom had been free (Kennedy 1862:8).
3. The phrase “any perceptible trace” raises some interesting possibilities.
If a “trace” was not perceptible, then it is possible that they might have been
classified as “white.” However, residence, family, and other social factors may
also have influenced perception. The question is whether, according to this cri-
terion, classification was based more on “perception” than on known biological
descent (Miller 1991).
4. Before the Civil War, the majority of people of African descent had been
slaves. As long as individuals were slaves, their appearance (specifically, their
similarity to whites) was not of major consequence. After slavery, the possibil-
ity of passing and becoming “white” became more of a threat. Williamson
(1984) and Hodes (1997) found that fierce opposition to miscegenation and mu-
lattoes surfaced after the Civil War.
N OT E S TO A P P E N D I X D
227


References
Acuña, Rodolfo. 1988. Occupied America: A History of Chicanos. 3d ed. New York:
Harper & Row.
Adams, Richard N. 1989. “The Conquest Tradition of Mesoamerica.” The Amer-
icas, October, pp. 119–136.
“Aggregate Amount of Each Description of Persons within the United States of
America, and the Territories Thereof, Agreeably to Actual Enumeration
Made According to Law, in the Year 1810,” microfilm of photocopy of table,
1810.1 (Dubester 10) supplied by the Social and Economic Statistics Ad-
ministration Library, National Archives, Suitland, MD.
Almaguer, Tómas. 1994. Racial Fault Lines: The Historical Origins of White Su-
premacy in California. Berkeley and Los Angeles: University of California
Press.
Almey, Marcia, Edward T. Pryor, and Pamela M. White. 1992. “National Census
Measures of Ethnicity in the Americas.” Proceedings of the International
Union for the Scientific Study of Populations Conference on the Peopling
of the Americas, vol. 3. Vera Cruz, Mexico, May 23.
Alvar, Manuel. 1987. Léxico del mestizaje en Hispanoamérica. Madrid: Ediciones
cultura hispanica, Instituto de cooperación Iberoamericana.
American College Dictionary. 1957. New York: Random House.
Anderson, Margaret. 1988. The American Census. New Haven, CT.: Yale Univer-
sity Press.
Anderson, Margo, and Stephen E. Fienberg. 1999. Who Counts? The Politics of
Census-Taking in Contemporary America. New York: Russell Sage.
Andrews, George Reid. 1980. The Afro-Argentines of Buenos Aires, 1800–1900.
Madison: University of Wisconsin Press.
———. 1991. Blacks and Whites in Sao Paulo, Brazil: 1888–1988. Madison: Uni-
versity of Wisconsin Press.
Aptheker, Herbert, ed. 1968. A Documentary History of the Negro People in the
United States: From Colonial Times through the Civil War. Vol. 1. New York:
Citadel Press.
Arce, Carlos H., Edward Murguía, and W. Parker Frisbie. 1987. “Phenotype and
Life Chances among Chicanos.” Hispanic Journal of Behavioral Sciences 9
(1):19–32.
229

Arocha, Jaime. 1998. “Inclusion of Afro-Colombians: Unreachable National
Goal?” Latin American Perspectives 25 (3) (May):70–89.
Atkinson, Jonnae O., Marian F. MacDorman, and Jennifer Parker. 1999. “Trends
in Births to Parents of Two Different Races: United States, 1971 to 1995.”
Paper presented at the National Conference on Health Statistics, August
2–4, Washington, DC.
Banton, Michael. 1983. Racial and Ethnic Competition. Cambridge: Cambridge
University Press.
Barbosa, Belen A. 1991. “La ‘Mujer Negra.’” Paper presented at the Symposium
on Racial Discrimination to Commemorate the Abolition of Slavery. Uni-
versity of Puerto Rico, San Juan, March 6.
Barringer, Felicity. 1993. “Ethnic Pride Confounds the Census.” New York Times,
May 9, p. 3.
Barzun, Jacques. 1965. Race: A Study in Superstition. New York: Harper.
Bates, Nancy A., Elizabeth A. Martin, Theresa J. De Maio, and Manuel de la
Puente. 1995. “Questionnaire Effects on Measurements of Race and Span-
ish Origin.” Journal of Official Statistics 11 (4): 433–459.
Bates, Nancy A., Manuel de la Puente, Theresa J. DeMaio, and Elizabeth A. Mar-
tin. 1994. “Research on Race and Ethnicity: Results from Questionnaire De-
sign Tests.” Paper presented at the U.S. Census Bureau’s annual research
conference, March 20–23, Rosslyn, VA.
Begley, Sharon. 1995. “Three Is Not Enough.” Newsweek, February 13, pp. 67–69.
Bell, Derrick. 1973. Race, Racism and American Law. 3d ed. Boston: Little, Brown.
———. 1992. Faces at the Bottom of the Well: The Permanence of Racism. New York:
Basic Books.
Bendick, Marc Jr. 1992. Discrimination against Latino Job Applicants: A Controlled
Experiment. Washington, DC: Fair Employment Council of Greater Wash-
ington.
Bennett, Claudette N., Nampeo McKenney, and Roderick Harrison. 1995.
“Racial Classification Issues Concerning Children in Mixed Race House-
holds.” Paper presented at the annual meeting of the Population Associa-
tion of America, San Francisco.
Bernal, Martin. 1987. Black Athena: The Afro-Asiatic Roots of Classical Civilization.
New Brunswick, NJ: Rutgers University Press.
Berry, Brewton. 1963. Almost White. New York: Macmillan.
Bhopal, Raj S., and Liam J. Donaldson. 1999. “Bhopal and Donaldson Respond
to Krieger.” American Journal of Public Health 89 (5): 784.
Bieder, Robert E. 1986. Science Encounters the Indian, 1820–1880: The Early Years
of American Ethnology. Norman: University of Oklahoma Press.
Bilger, Burkhard. 1997. “The Last Black Classicist.” The Sciences 37 (2): 16–19.
Blaustein, Albert P., and Robert L. Zangrando. 1968. Civil Rights and the Ameri-
can Negro. New York: Washington Square Press.
230
R E F E R E N C E S

Blockson, Charles L., and Ron Fry. 1977. Black Genealogy. Baltimore: Black Clas-
sic Press.
Boisjoly, Johanne, and Greg J. Duncan. 1994. “Job Losses among Hispanics in
the Recent Recession.” Monthly Labor Review, June, pp. 16–23.
Bracken, Karen, and Guillermo de Bango. 1992. “Hispanics in a Racially and
Ethnically Mixed Neighborhood in the Greater Metropolitan New Orleans
Area.” Ethnographic Evaluation of the 1990 Decennial Census Report 16. Pre-
pared under Joint Statistical Agreement 89-45 with Hispanidad ’87, Inc.
Washington, DC: U.S. Bureau of the Census.
Brady, Vivian. 1988. “Black Hispanics: The Ties That Bind.” Centro boletin 2 (3)
(Spring): 44–47.
Brodkin Sacks, Karen. 1994. “How Did Jews Become White Folks?” In Race, ed.
Steven Gregory and Roger Sanjek. New Brunswick, NJ: Rutgers University
Press.
Brookshaw, David. 1986. Race and Color in Brazilian Literature. Metuchen, NJ:
Scarecrow Press (first published in Portuguese in 1983).
Buehler, James W., Donna F. Stroup, Douglas N. Klaucke, and Ruth L. Berkel-
man. 1989. “The Reporting of Race and Ethnicity in the National Notifiable
Diseases Surveillance System.” Public Health Reports 104 (September/Octo-
ber): 457–465.
Bunte, Pamela, and Rebecca Joseph. 1992. “The Cambodian Community of
Long Beach: An Ethnographic Analysis of Factors Leading to Census Un-
dercount.” Ethnographic Evaluation of the 1990 Decennial Census Report 9.
Prepared under Joint Statistical Agreement 89-31, with Community Ser-
vice Council of Broward County, Inc. Washington, DC: U.S. Bureau of the
Census.
Burkett, Elinor C. 1978. “Indian Women and White Society: The Case of Six-
teenth-Century Peru.“ In Latin American Women: Historical Perspectives, ed.
Asuncion Lavrin. Westport, CT: Greenwood Press.
Cabranes, José A. 1979. Citizenship and the American Empire: Notes on the Legisla-
tive History of the United States. New Haven, CT: Yale University Press.
Carlberg, Nancy Ellen. 1992. Beginning Census Research. Anaheim, CA: Carlberg
Press.
Carroll, Patrick J. 1991. Blacks in Colonial Veracruz: Race, Ethnicity and Regional
Development. Austin: University of Texas Press.
Cauce, Ana Mari, Yumi Hiraga, Craig Mason, Tanya Aguilar, Nydia Ordonez,
and Nancy Gonzales. 1992. “Between a Rock and a Hard Place: Social Ad-
justment of Biracial Youth.” In Racially Mixed People in America, ed. Maria P.
P. Root. Newbury Park, CA: Sage.
Census for 1820. 1821. Washington, DC: Gales and Seaton (microfilm).
Chapa, Jorge, and Craig Wacker. 2000. “Latino Unemployment: Current Issues
and Future Concerns.” In Strengthening Employment Opportunities for Latino
R E F E R E N C E S
231

Workers: Ideas for Policy and Practice, Report on the State of Hispanic America
1999, ed. Sonia M. Pérez. Washington, DC: National Council of La Raza.
Chevan, Albert. 1990. “Hispanic Racial Identity: Beyond Social Class.” Paper
presented at the American Sociological Association, Washington, DC, Au-
gust 14.
Choldin, Harvey. 1986. “Statistics and Politics: The ‘Hispanic Issue’ in the 1980
Census.” Demography 23 (3): 403–417.
Clemence, Ted. 1981. “‘Indians Not Taxed’ and the Census Apportionment
Base.” U.S. Bureau of the Census. Unpublished manuscript. (This paper
does not represent the views of the census.)
Colon, Jesus. 1982. A Puerto Rican in New York and Other Sketches. New York: In-
ternational Publishers.
Comas-Díaz, Lillian. 1996. “LatiNegra: Mental Health Issues.” In The Multiracial
Experience: Racial Borders As the New Frontier, ed. Maria P. P. Root. Newbury
Park, CA: Sage.
Cornish, John. 1992. “Australia’s Experience with Census Questions on Ethnic-
ity.” In Challenges of Measuring an Ethnic World: Science, Politics and Reality,
ed. Statistics Canada and U.S. Bureau of the Census. Proceedings of the Joint
Canada–United States Conference on the Measurement of Ethnicity, Ottawa,
Canada. Washington, DC: U.S. Government Printing Office.
Cose, Ellis. 1995. “One Drop of Bloody History.” Newsweek, February 13, pp.
70–72.
Cotter, Holland. 1996. “Faces from a Fictional Melting Pot.” New York Times, Oc-
tober 4, p. C1.
Cox, Oliver C. 1948. Caste, Class, and Race: A Study in Racial Dynamics. New York:
Monthly Review Press.
Cross, Harry, with Genevieve Kenney, Jane Mell, and Wendy Zimmermann.
1990. “Employer Hiring Practices: Differential Treatment of Hispanic and
Anglo Job Seekers.” Washington, DC: Urban Institute Report 90-4.
Daniel, Reginald. 1992. “Passers and Pluralists: Subverting the Racial Divide.”
In Racially Mixed People in America, ed. Maria P. P. Root. Newbury Park, CA:
Sage.
Darity, William A. Jr., and Patrick L. Mason. 1998. “Evidence on Discrimination
in Employment: Codes of Color, Codes of Gender.” Journal of Economic Per-
spectives 12 (2) (Spring): 63–90.
Davis, Diana K., Johnny Blair, Howard Fleischman, and Margaret S. Boone.
1998a. Cognitive Interviews on the Race and Hispanic Origin Questions on the
Census 2000 Dress Rehearsal Form. Report prepared by Development Asso-
ciates, Inc., Arlington, VA, under contract from the U.S. Census Bureau,
Population Division, May 29.
Davis, Diana K., Johnny Blair, Nancy Goudreau, Margaret S. Boone, Loretta R.
Johnston, and Eliodoro Robles. 1998b. Research on Race and Hispanic Origin
232
R E F E R E N C E S

for Census 2000. Report prepared by Development Associates, Inc., Arling-
ton, VA, under contract from the U.S. Census Bureau, Population Division,
December.
Davis, James F. 1992. Who Is Black? One Nation’s Definition. University Park:
Pennsylvania State University Press.
Davis, Kingsley. 1941. “Intermarriage in Caste Societies.” American Anthropolo-
gist 43: 388–395.
Day, Jennifer Cheeseman. 1996. Population Projections of the United States by Age,
Sex, Race, and Hispanic Origin: 1995 to 2050. U.S. Bureau of the Census, Cur-
rent Population Reports, P25-1130. Washington, DC: U.S. Government
Printing Office.
De Bow, J. D. B. 1854a. (Superintendent of the United States Census) Statistical
View of the United States Embracing Its Territory, Population—White, Free, Col-
ored, and Slave—Moral and Social Condition, Industry, Property, and Revenue;
the Detailed Statistics of Cities, Towns and Counties. Washington, DC: A. O. P.
Nicholson, Public Printer.
———. 1854b. (Superintendent of the United States Census) Statistical View of
the United States Embracing Its Territory, Population—White, Free, Colored, and
Slave—Moral and Social Condition, Industry, Property, and Revenue; the De-
tailed Statistics of Cities, Towns and Counties. Washington, DC: Beverley
Tucker, Senate Printer.
De Freitas, Gregory. 1991. Inequality at Work: Hispanics in the U.S. Labor Force.
New York: Oxford University Press.
Degler, Carl N. 1959. Out of Our Past: The Forces That Shaped Modern America.
New York: Harper & Row.
———. 1986. Neither Black nor White: Slavery and Race Relations in Brazil and the
United States. Madison: University of Wisconsin Press.
De La Fuente, Alejandro. 1998. “Race, National Discourse, and Politics in Cuba:
An Overview.” Latin American Perspectives 25 (3) (May): 43–69. Issue 100 en-
titled “Race and National Identity in the Americas” and edited by Helen
Safa.
de la Garza, R. O., L. DeSipio, C. F. Garcia, J. Garcia, and A. Falcon. 1992. Latino
Voices: Mexican, Puerto Rican and Cuban Perspectives on American Politics.
Boulder, CO: Westview Press.
de la Puente, Manuel. 1991. “In Search of the Causes of the Differential Census
Undercount of Racial and Ethnic Minorities: Overview of Ethnographic
Studies of Census Undercount.” Paper presented at the eighty-sixth annual
meeting of the American Sociological Association, Cincinnati.
———. 1993. “Why Are People Missed or Erroneously Included by the Census:
A Summary of Findings from Ethnographic Coverage Reports.” Paper pre-
sented at the U.S. Bureau of the Census’s 1993 research conference on un-
dercounted ethnic populations, May 5–7, Richmond, VA.
R E F E R E N C E S
233

de la Puente, Manuel, Nampeo McKenney, Roderick Harrison, and Claudette
Bennett. 1997. “Results of the 1996 Race and Ethnic Targeted Test
(RAETT).” U.S. Bureau of the Census, Population Division and Decennial
Statistics Division, Working Paper no. 18, May. Washington, DC: U.S. Gov-
ernment Printing Office.
Delgado, Richard, and Jean Stefancic. 1997. Critical White Studies: Looking behind
the Mirror. Philadelphia: Temple University Press.
del Pinal, Jorge. 1993. “Research on Race and Ethnicity, Cognitive Interviews:
Phase I.” Project 6120. U.S. Census Bureau, Center for Survey Methods,
July 8.
———. 1994. “Social Science Principles: Forming Race-Ethnic Categories for
Policy Analysis.” Paper presented at the Workshop on Race and Ethnicity
Classification: An Assessment of the Federal Standard for Race and Eth-
nicity Classification, National Research Council, Commission on Behav-
ioral and Social Sciences and Education, Committee on National Statistics,
February 18.
———. 1999. “Some Findings from the 2000 Census Dress Rehearsal, Race and
Ethnicity Data.” Paper presented at the Race and Ethnic Advisory Com-
mittee Meeting, U.S. Bureau of the Census. Reston, VA, July 16.
del Pinal, Jorge, and Jesus M. Garcia. 1993. “Hispanic Americans Today.” U.S.
Bureau of the Census. Current Population Reports, P23–183. Washington,
D.C.: U.S. Government Printing Office.
del Pinal, Jorge, and Audrey Singer. 1997. “Generations of Diversity: Latinos in
the United States,” Population Bulletin 52 (3).
del Valle, Manuel. 1993. “National Origin and Alienage Discrimination.” In Em-
ployment Discrimination: Law and Litigation, ed. Merrick T. Rossein. Deer-
field, IL: Clark Boardman Callaghan.
Denton, N. A., and D. S. Massey. 1989. “Racial Identity among Caribbean His-
panics: The Effect of Double Minority Status on Residential Segregation.”
American Sociological Review 54: 790–808.
Diamond, Jared. 1994. “Race without Color.” Discover, November, pp. 83–89.
———. 1997. “Continental Divides.” The Sciences 37 (2) (March/April):
32–37.
Díaz-Cotto, Juanita. 1996. Gender, Ethnicity, and the State: Latino and Latina Prison
Politics. Albany: State University of New York Press.
Discover. 1994. special issue, “The Science of Race.” November.
Domínguez, Virginia R. 1986. White by Definition: Social Classification in Creole
Louisiana. New Brunswick, NJ: Rutgers University Press.
Dred Scott v. John F. A. Sandford. 60 U.S. 393, 13. 1856. Supreme Court of the
United States, December 1856.
Drury, T. F., C. S. Moy, and G. S. Poe. 1980. “Going beyond Interviewer Obser-
vations of Race in the National Health Survey.” Classification Issues in Mea-
234
R E F E R E N C E S

suring the Health Status of Minorities. Hyattsville, MD: U.S. Public Health
Service.
Duany, Jorge. 1985. “Ethnicity in the Spanish Caribbean: Notes on the Consoli-
dation of Creole Identity in Cuba and Puerto Rico, 1762–1868.” Ethnic
Groups 6: 99–123.
———. 1998a. “Blurred Frontiers: The Socioeconomic Impacts of Transnational
Migration on the Hispanic Caribbean and the United States.” Paper pre-
pared for the conference One Hundred Years of Transformation: The
Caribbean and the United States, 1898–1898, Lehman College, City Uni-
versity of New York, Bronx, October 13–15.
———. 1998b. “Reconstructing Racial Identity: Ethnicity, Color and Class
among Dominicans in the United States and Puerto Rico.” Latin American
Perspectives 25 (3) (May): 147–172.
———. 2000. “Nation on the Move: The Construction of Cultural Identities in
Puerto Rico and the Diaspora.” American Ethnologist 27 (1).
Du Bois, W. E. B. 1962. Black Reconstruction in America, 1860–1880. Cleveland:
World Publishing.
———. 1972. John Brown. New York: International Publishers.
Duke, Lynn. 1998. “South Africa’s Race Charade Ends.” Washington Post, July
26, p. A01.
Dunn, L. C., and Theodosius Dobzhansky. 1952. Heredity, Race and Society. New
York: New American Library of World Literature.
Dzidzienyo, Anani. 1993. “Brazilian Race Relations Studies: Old Problems, New
Ideas?” Humboldt Journal of Social Relations 19 (2): 109–129.
Edley, Christopher F. 1996. Not All Black and White: Affirmative Action, Race and
American Values. New York: Hill & Wang.
Edmonston, Barry, Joshua Goldstein, and Juanita Tamayo Lott. 1996. “Spotlight
on Heterogeneity: The Federal Standards for Racial and Ethnic Classifica-
tion.” Committee National Statistics, National Research Council. Washing-
ton, DC: National Academy Press.
Edmonston, Barry, S. M. Lee, and J. S. Passel. 1994. “U.S. Population Projections
for National Origin Groups: Taking Race and Ethnic Ancestry into Ac-
count.” Proceedings of the American Statistical Association, Social Statistics Sec-
tion. Washington, DC: American Statistical Association.
Ekin, Larry, and Leila Gorchev, eds., 1992. Report on Anti-Arab Hate Crimes: Po-
litical and Hate Violence against Arab Americans. Washington, DC: American
Arab Anti-Discrimination Committee.
Elias-Olivares, Lucia, and Marcia Farr. 1991. “Sociolinguistic Analysis of Mexi-
can-American Patterns of Non-Response to Census Questionnaires.”
Ethnographic Exploratory Research, Report 16, Final Report for Joint Statisti-
cal Agreement 88-25, sponsored by the Center for Survey Methods Re-
search, U.S. Bureau of the Census.
R E F E R E N C E S
235

Eschbach, Karl, and Christina Gómez. 1998. “Choosing Hispanic Identity: Eth-
nic Identity Switching among Respondents in High School and Beyond.”
Social Science Quarterly 79 (1): 74–90.
Escobar, Gabriel. 1999. “Dominicans Face Assimilation in Black and White.”
Washington Post, May 14, p. A03.
Estrada, Leobardo F. 1993. “The Politics of the Census: A Reflection of the
Dilemmas in U.S. Society.” In Challenges of Measuring an Ethnic World: Sci-
ence, Politics and Reality, ed. Statistics Canada and U.S. Bureau of the Cen-
sus. Washington, DC: U.S. Government Printing Office.
———. 1994. “Selected Federal Agency Experience.” Comments at the Work-
shop on Race and Ethnicity Classification: An Assessment of the Federal
Standard for Race and Ethnicity Classification, Committee on National Sta-
tistics, National Research Council, Washington, DC, February 17–18.
Falcon, Angelo. 1995. “Puerto Ricans and the Politics of Racial Identity.” In
Racial and Ethnic Identity: Psychological Development and Creative Expression,
ed. Ezra Griffith, Howard Blue, and Herbert Harris. New York: Routledge
& Kegan Paul.
Fein, David J. 1990. “Racial and Ethnic Differences in U.S. Census Omission
Rates.” Demography 27 (2) (May):185–302.
Feinlieb, Manning. 1994. Statement of Manning Feinlieb, the Director of the National
Center for Education Statistics: Hearings before the Subcommittee on Census, Sta-
tistics and Postal Personnel of the Committee on Post Office and Civil Service,
House of Representatives, 103 Cong., 1st sess., April 14, 1993, ser. no. 103-
7, pp. 70–83.
Fernandes, Florestan. 1969. The Negro in Brazilian Society. New York: Columbia
University Press.
———. 1979. “The Negro in Brazilian Society: Twenty-Five Years Later.” In
Brazil Anthropological Perspectives: Essays in Honor of Charles Wagley, ed.
Maxine L. Margolis and William E Carter. New York: Columbia University
Press.
Fernández, Carlos. 1992. “La Raza and the Melting Pot: A Comparative Look at
Multiethnicity.” In Racially Mixed People in America, ed. Maria P. P. Root.
Newbury Park, CA: Sage.
Ferrante, Joan, and Prince Brown Jr. 1998. The Social Construction of Race and Eth-
nicity in the United States. New York: Longman.
Field, Lynda D. 1996. “Piecing Together the Puzzle: Self-Concept and Group
Identity In Biracial Black/White Youth.” In The Multiracial Experience:
Racial Borders As the New Frontier,” ed. Maria P. P. Root. Newbury Park, CA:
Sage.
Fienberg, Stephen E. 1994. Comments on “Social Science and Statistics Perspec-
tives” at the Workshop on Race and Ethnicity Classification: An Assess-
ment of the Federal Standard for Race and Ethnicity Classification, Com-
236
R E F E R E N C E S

mittee on National Statistics, National Research Council, Washington, DC,
February 17–18.
Fishel, Leslie H., and Benjamin Quarles. 1970. The Black American: A Documen-
tary History. Glenview, IL: Scott Foresman.
Fix, Michael, George Galsten, and Raymond Stryk, eds. 1993. Clear and Con-
vincing Evidence: Measurement of Discrimination in America. Washington, DC:
Urban Institute.
Flores, William V., and Rina Benmayor. 1997. Latino Cultural Citizenship: Claim-
ing Identity, Space and Rights. Boston: Beacon Press.
Foner, Nancy. 1998. “West Indian Identity in the Diaspora: Comparative and
Historical Perspectives.” Latin American Perspectives 25 (3) (May): 173–188.
Foner, Philip S. 1964. Frederick Douglass: A Biography. New York: Citadel Press.
Fontaine, Pierre Michel, ed. 1985. Race, Class and Power in Brazil. Los Angeles:
University of California at Los Angeles Center for Afro-American Studies.
Forbes, Jack D. 1988. Black Africans and Native Americans. New York: Basil
Blackwell.
———. 1990. “The Manipulation of Race, Caste and Identity: Classifying
Afroamericans, Native Americans and Red-Black People.” Journal of Ethnic
Studies 17 (4): 1–51.
Fox, Geoffrey. 1996. Hispanic Nation: Culture, Politics and the Constructing of Iden-
tity. Tucson: University of Arizona Press.
Frankenberg, Ruth. 1993. The Social Construction of Whiteness: White Women Race
Matters. Minneapolis: University of Minnesota Press.
Franklin, John Hope. 1967. From Slavery to Freedom: A History of Negro Americans.
3d ed. New York: Knopf.
Frazier, E. Franklin. 1942. “Some Aspects of Race Relations in Brazil.” Phylon, 3d
qtr., pp. 287–295.
———. 1962. Black Bourgeoisie: The Rise of a New Middle Class in the United States.
New York: Collier Books.
Freedman, Bernard J. 1984. “Caucasian.” British Medical Journal 288 (March):
696–698.
Fullilove, M. T. 1998. “Abandoning “Race” As a Variable in Public Health Re-
search—An Idea Whose Time Has Come.” American Journal of Public Health
88: 1297–1298.
Galenson, David W. 1981. White Servitude in Colonial America: An Economic
Analysis. Cambridge: Cambridge University Press.
Gallagher, Charles A. 1999. Rethinking the Color Line: Readings in Race and Eth-
nicity. Mountain View, CA: Mayfield.
García, María Cristina. 1996. Havana USA: Cuban Exiles and Cuban Americans in
South Florida, 1959–1995. Berkeley and Los Angeles: University of Califor-
nia Press.
García Saiz, María Concepción. 1996. “The Artistic Development of Casta
R E F E R E N C E S
237

Painting.” In New World Orders: Casta Painting and Colonial Latin America,
ed. Ilona Katzew, curator. New York: Americas Society.
Gilbertson, Greta, Joseph P. Fitzpatrick, and Lijun Yang. 1996. “Hispanic Inter-
marriage in New York City: New Evidence from 1991.” International Mi-
gration Review 30: 445–459.
Gimenez, Martha. 1989. “Latino/‘Hispanic’—Who Needs a Name? The Case
against a Standardized Terminology.” International Journal of Health Services
19 (3): 557–571.
Ginorio, Angela. 1979. “A Comparison of Puerto Ricans in New York with
Native Puerto Ricans and Native Americans on Two Measures of Accul-
turation: Gender Role and Racial Identification.” Ph.D. diss., Fordham
University.
Ginorio, Angela, and Paul C. Berry. 1972. “Measuring Puerto Ricans’ Percep-
tions of Racial Characteristics.” Summary. Proceedings of the 80th Annual
Convention of the American Psychological Association 7:287–288.
Goldstein, Joshua R., and Ann J. Morning. 1999. “The Multiple Race Population
of the United States: Issues and Estimates.” Paper presented at the National
Conference on Health Statistics. Washington, DC: National Center for
Health Statistics, August 2–4.
Gómez, Christina. n.d. “The Continual Significance of Skin Color: An Ex-
ploratory Study of Latinos in the Northeast.” Hispanic Journal of Behavioral
Sciences, currently under review.
Gossett, Thomas. 1963. Race: The History of an Idea in America. New York:
Schocken Books.
Gould, Stephen Jay. 1978. “Morton’s Ranking by Cranial Capacity.” Science 200:
503–509.
———. 1981. The Mismeasure of Man. New York: Norton.
———. 1994. “The Geometer of Race.” Discover, November, pp. 65–69.
Graham, Richard. 1990. Introduction to The Idea of Race in Latin America,
1870–1940, ed. Richard Graham. Austin: University of Texas Press.
Graham, Susan. 1994. “Challenges and Emerging Issues: Multi-racial People.”
Paper presented at the Workshop on Race and Ethnicity Classification: An
Assessment of the Federal Standard for Race and Ethnicity Classification,
Committee on National Statistics, National Research Council, Washington,
DC, February 17–18.
Grant, Glen, and Dennis M. Ogawa. 1993. “Living Proof: Is Hawaii the An-
swer?” Annals of the American Academy of Political and Social Science 530 (No-
vember): 137–154.
Greene, Evarts B., and Virginia D. Harrington. 1966. American Population before
the Federal Census of 1790. Gloucester, MA: Peter Smith.
Gregory, Steven, and Roger Sanjek, eds. 1994. Race. New Brunswick, NJ: Rut-
gers University Press.
238
R E F E R E N C E S

Grenier, Guillermo, and Peter Cattan. 2000. “Latino Immigrants in the Labor
Force.” In Strengthening Employment Opportunities for Latino Workers: Ideas
for Policy and Practice, Report on the State of Hispanic America 1999, ed. Sonia
M. Pérez. Washington, DC: National Council of La Raza.
Grieve, Victoria Marie. 1996. “Any Perceptible Trace: Representations of the
Mulatto in the United States Census, 1850–1920.” Master’s thesis, Univer-
sity of Georgia.
Gutiérrez, Ramon A. 1991. When Jesus Came, the Corn Mothers Went Away: Mar-
riage, Sexuality, and Power in New Mexico, 1500–1846. Stanford, CA: Stanford
University Press.
Gutin, Jo Ann C. 1994. “End of the Rainbow.” Discover, November, pp. 71–75.
Hahn, Robert A. 1992. “The State of Federal Health Statistics.” Journal of the
American Medical Association. 267 (2) (January): 268–271.
———. 1994. “The Coding of Race and Ethnicity in Federal Health Statistics:
Problems and Prospects.” Paper presented at the Workshop on Race and
Ethnicity Classification, Committee on National Statistics, National Acad-
emy of Sciences, Washington, DC, February 17–18.
Hahn, Robert A., James M. Mendlein, and Steven D. Helgerson. 1993. “Differ-
ential Classification of American Indian Race on Birth and Death Certifi-
cates, U.S. Reservation States, 1983–1985.” The Provider, January, pp.
8–11.
Hahn, Robert A., B. I. Truman, and N. D. Barker. 1996. “Identifying Ancestry:
The Reliability of Ancestral Identification in the United States by Self,
Proxy, Interviewer, and Funeral Director.” Epidemiology 7: 75–80.
Halter, Marilyn. 1993. Between Race and Ethnicity: Cape Verdean American Immi-
grants, 1860–1965. Urbana-Champaign: University of Illinois Press.
Hanchard, Michael George. 1994. Orpheus and Power: The Movimento Negro of Rio
de Janeiro and Sao Paulo, Brazil, 1945–1988. Princeton, NJ: Princeton Univer-
sity Press.
———. 1999. “The Color of Suberversion: Racial Politics and Immigration Pol-
icy in the United States.” EpiCenter: The Newsletter of the International Center
for Migration, Ethnicity and Citizenship 4, no. 1 (Winter):1, 6–7.
Haney López, Ian. 1996. White by Law: The Legal Construction of Race. New York:
New York University Press.
Hannaford, Ivan. 1996. Race: The History of an Idea in the West. Baltimore: Johns
Hopkins University Press, and Washington, DC: Woodrow Wilson Center
Press.
Hansen, Chris. 1995. “Race/Ethnicity and Data Collection.” Poverty and Race 4
(2) (March/April): 17–18.
Harris, Joseph E. 1972. Africans and Their History. New York: New American Li-
brary.
———, ed. 1977. Africa and Africans As Seen by Classical Writers (The William Leo
R E F E R E N C E S
239

Hansberry African History Notebook). Vol. 2. Washington, DC: Howard Uni-
versity Press.
Harris, Marvin, Consorte Gomes, Lang Josildeth, and Byrne Brian Joseph. 1993.
“Who Are the Whites? Imposed Census Categories and the Racial Demog-
raphy of Brazil.” Social Forces 72 (2): 451–462.
Hartman, Chester, ed. 1994. “Race/Ethnic Categories: Do They Matter? A Sym-
posium.” Poverty and Race, part 1, vol. 3, no. 6 (November/December).
———, ed. 1995. “Race/Ethnic Categories—A Symposium.” Poverty and Race,
part 2, vol. 4, no. 7 (January/February).
Hayes-Bautista, D. E., and J. Chapa. 1987. “Latino Terminology: Conceptual
Basis for Standardized Terminology.” American Journal of Public Health 77:
61–68.
Heads of Families at the First Census of the United States Taken in the Year 1790: New
York. 1992. Baltimore: Genealogical Publishing (originally published by the
U.S. Government Printing Office, 1908).
Heer, David M. 1966. “Negro-White Marriage in the United States.” Journal of
Marriage and the Family 28: 262–273.
Helg, Aline. 1990. “Race in Argentina and Cuba, 1880–1930: Theory, Policies,
and Popular Reaction.” In The Idea of Race in Latin America, 1870–1940, ed.
Richard Graham. Austin: University of Texas Press.
Hellwig, David J., ed. 1992. African-American Reflections on Brazil’s Racial Par-
adise. Philadelphia: Temple University Press.
Henry, William A. III. 1990. “The Browning of America” and “Beyond the Melt-
ing Pot.” Time, April 9, pp. 28–31.
Hernández, José 1997. Conquered Peoples in America. Dubuque, IA: Kendall/
Hunt.
Herrnstein, Richard J., and Charles Murray. 1994. The Bell Curve: Intelligence and
Class Structure in American Life. New York: Free Press.
Hevesi, Dennis. 1998. “Black and Hispanic Immigrants Lag in Housing Study.”
New York Times, May 4, p. 1.
Higginbotham, Leon A. Jr. 1978. In the Matter of Color: Race and the American Legal
Process, the Colonial Period. New York: Oxford University Press.
Hodes, Martha. 1997. White Women, Black Men: Illicit Sex in the Nineteenth-Cen-
tury South. New Haven, CT: Yale University Press.
Hoetink, H. 1985. “‘Race’ and Color in the Caribbean.” Washington, DC: Smith-
sonian Institution, Woodrow Wilson International Center for Scholars,
Latin American Studies Program.
Hogan, Howard. 1993. “The 1990 Post-Enumeration Survey: Operations and
Results.” Journal of the American Statistical Association 88 (423) (September):
1047–1060.
Holmes, Steven A. 1999. “The Big Census Issue: Using Sampling in Redistrict-
ing.” New York Times, nat’l sec., February 14, p. 24.
240
R E F E R E N C E S

Holzer, Harry. 1997. What Employers Want: Job Prospects for Less-Educated Work-
ers. New York: Russell Sage Foundation.
Horsman, Reginald. 1981. Race and Manifest Destiny: The Origins of American
Racial Anglo-Saxonism. Cambridge, MA: Harvard University Press.
Hossfeld, Karen J. 1994. “Hiring Immigrant Women: Silicon Valley’s ‘Simple’
Formula.” In Women of Color in U.S. Society, ed. Maxine Baca Zinn and Bon-
nie Thornton Dill. Philadelphia: Temple University Press.
Hughes, Michael, and Bradley R. Hertel. 1990. “The Significance of Color Re-
mains: A Study of Life Chances, Mate Selection, and Ethnic Consciousness
among Black Americans.” Social Forces 68 (4): 1105–1120.
Hurtado, Aída. 1997. “Understanding Multiple Group Identities: Inserting
Women into Cultural Transformations.” Society for the Psychological Study of
Social Issues 53 (2): 299–328.
Iglesias, Cesar Andreu. 1980. Memorias de Bernardo Vega: Una contribución a la
historia de la comunidad puertorriqueña en Nueva York. Rio Piedras: Edi-
ciones huracán.
Ignatiev, Noel. 1995. How the Irish Became White. New York: Routledge & Kegan
Paul.
Isajiw, Wsevolod W. 1993. “Definition and Dimensions of Ethnicity: A Theoret-
ical Framework.” In Challenges of Measuring an Ethnic World: Science, Politics
and Reality, Proceedings of the Joint Canada–United States Conference on the
Measurement of Ethnicity, April 1–3, 1992, Ottawa. Washington, DC: U.S.
Government Printing Office.
Jackson, Ronald Vern, and Gary Ronald Teeples. 1976. New York 1810 Census
Index. Bountiful, UT: Accelerated Indexing Systems.
Jacobs, James H. 1992. “Identity Development in Biracial Children.” In
Racially Mixed People in America, ed. Maria P. P. Root. Newbury Park, CA:
Sage.
Jacobson, Mathew. 1998. Becoming Caucasian: Whiteness and the Alchemy of the
American Melting Pot. Cambridge, MA: Harvard University Press.
Jaimes, Annette M. 1994. “American Racism: The Impact on American-Indian
Identity and Survival.” In Race, ed. Steven Gregory and Roger Sanjek. New
Brunswick, NJ: Rutgers University Press.
Jalloh, Alusine, and Stephen E. Maizlish, eds. 1996. The African Diaspora. College
Station: Texas A&M University Press.
James, Franklin, Betty L. McComings, and Eileen Tynan. 1984. Minorities in the
Sunbelt. Rutgers, NJ: Center for Urban Policy Research.
Jensen, Joan. 1988. Passage from India. New Haven, CT: Yale University Press.
Johansen, Bruce E. 1982. Forgotten Founders: Benjamin Franklin, the Iroquois, and
the Rationale for the American Revolution. Ipswich, MA.: Gambit.
Johnson, Deborah J. 1992. “Developmental Pathways: Toward an Ecological
Theoretical Formulation of Race Identity in Black-White Biracial Chil-
R E F E R E N C E S
241

dren.” In Racially Mixed People in America, ed. Maria P. P. Root. Newbury
Park, CA: Sage.
Johnson, Ronald C. 1992. “Offspring of Cross-Race and Cross-Ethnic Marriages
in Hawaii.” In Racially Mixed People in America, ed. Maria P. P. Root. New-
bury Park, CA: Sage.
Johnson, Timothy, Jared B. Jobe, Diane O’Rourke, Seymour Sudman, Richard B.
Warnecke, Noel Chavez, G. Chapa-Resendez, and Patricia Golden. 1997.
“Dimensions of Self Identification among Multiracial and Multiethnic Re-
spondents in Survey Interviews.” Evaluation Review 21: 671–687.
Jones, Lisa. 1994. bulletproof diva: Tales of Race, Sex and Hair. New York: Double-
day.
Jordan, Winthrop. 1968. White over Black: American Attitudes toward the Negro,
1550–1812. Baltimore: Penguin Books.
Kalmijn, Matthijs. 1993. “Trends in Black/White Intermarriage.” Social Forces 72
(1) (September): 119–146.
Katz, William Loren. 1986. Black Indians: A Hidden Heritage. New York:
Atheneum.
Katzen, Sally. 1994. “Statement of Sally Katzen, Administrator, Office of Infor-
mation and Regulatory Affairs, Office of Management and Budget,” at the
Hearings before the Subcommittee on Census, Statistics, and Postal Per-
sonnel of the Committee on Post Office and Civil Serivce, House of Repre-
sentatives, 103 Congress, 1st session, July 29, 1993, Serial No. 103–7, pp.
213–220.
Katzew, Ilona. 1996. “Casta Painting: Identity and Social Stratification in Colo-
nial Mexico.” In New World Orders: Casta Painting and Colonial Latin Amer-
ica. New York: Americas Society.
Katzman, M. 1968. “Discrimination, Subculture, and the Economic Perfor-
mance of Negroes, Puerto Ricans and Mexican-Americans.” American Jour-
nal of Economics and Society 27 (4): 371–375.
Keith, Verna M., and Cedric Hering. 1991. “Skin Tone and Stratification in the
Black Community.” American Journal of Sociology 97 (3) (November):
760–78.
Kennedy, Joseph C. G. 1862. Preliminary Report on the Eighth Census: 1860. Wash-
ington, DC: U.S. Government Printing Office.
Kettner, James H. 1978. The Development of American Citizenship, 1608–1870.
Chapel Hill: University of North Carolina Press.
Kim, Claire Jean. 1999. “The Racial Triangulation of Asian Americans.” Politics
and Society 27 (1) (March): 105–138.
Kissam, Edward, Enrique Herrera, and Jorge M. Nakamoto. 1993. “Hispanic
Response to Census Enumeration Forms and Procedures.” Task order no.
46-YABC-2-0001, contract no. 50-YABC-2-66027, submitted by Aguirre In-
242
R E F E R E N C E S

ternational, 411 Borel Ave, Suite 402, San Mateo, CA 94402, to U.S. Bureau
of the Census, Center for Survey Methods Research, March.
Klor de Alva, Jorge J. 1996. “Mestizaje from New Spain to Aztlán: On the Con-
trol and Classification of Collective Identities.” In New World Orders: Casta
Painting and Colonial Latin America, Ilona Katzew, curator. New York: Amer-
icas Society Art Gallery.
Knight, Alan. 1990. “Racism, Revolution and Indigenismo: Mexico, 1910–1940.”
In The Idea of Race in Latin America, 1870–1940, ed. Richard Graham. Austin:
University of Texas Press.
Kobayashi, Audrey. 1993. “Representing Ethnicity: Political Statistexts.” In
Challenges of Measuring an Ethnic World: Science, Politics and Reality, ed. Sta-
tistics Canada and U.S. Bureau of the Census. Washington, DC: U.S. Gov-
ernment Printing Office.
Kossoudji, S. 1988. “English Language Ability and Labor Market Opportunities
of Hispanic and East Asian Immigrant Men.” Journal of Labor Economics 6
(2): 205–208.
Krieger, Nancy, Steven Sidney, and Eugenie Coakley. 1998. “Racial Discrimina-
tion and Skin Color in the CARDIA Study: Implications for Public Health
Research.” American Journal of Public Health 88 (9) (September): 1308–1313.
Krieger, Nancy, David Williams, and Sally Zierler. 1999. “‘Whiting Out’ White
Privilege Will Not Advance the Study of How Racism Harms Health” and
Related Letters to the Editor by James W. Buehler, Richard Rabin, Mindy
Thompson Fullilove, Raj S. Bhopal, and Liam J. Donaldson. American Jour-
nal of Public Health 89 (5): 782–785.
Labov, Teresa, and Jerry A. Jacobs. 1986. “Intermarriage in Hawaii, 1950–83.”
Journal of Marriage and the Family 48 (February): 79–88.
Larmer, Brook. 1999. “Latino America.” Newsweek, July 19, pp. 48–51.
Lee, Sharon M. 1993. “Racial Classifications in the U.S. Census: 1890–1990.” Eth-
nic and Racial Studies 16 (1) (January):75–94.
Lee, Sharon M., and Keiko Yamanaka. 1990. “Patterns of Asian Intermarriage
and Marital Assimilation.” Journal of Comparative Family Studies 21
(2):287–305.
Leets, Laura, Richard Clement, and Howard Giles. 1996. “Explicating Ethnicity
in Theory and Communication Research.” Multilingua. 15 (2): 115–147.
Lemonick, Michael D., and Andrea Dorfman. 1999. “Up from the Apes: Re-
markable New Evidence Is Filling in the Story of How We Became
Human.” Time, August 22.
Leonard, Karn Isaksen. 1992. Making Ethnic Choices: California’s Punjabi Mexican
Americans. Philadelphia: Temple University Press.
Lindan, C. P., N. Hearst, J. A. Singleton, A. I. Trachtenberg, N. M. Riordan, D. A.
Tokagawa, and G. S. Chu. 1990. “Underreporting of Minority AIDS Deaths
R E F E R E N C E S
243

in San Francisco Bay Area, 1985–1986.” Public Health Reports 104:(4):
400–404.
Loewen, James W. 1971. The Mississippi Chinese: Between Black and White. Cam-
bridge, MA: Harvard University Press.
Logan Alexander, Adele. 1991. Ambiguous Lives: Free Women of Color in Rural
Georgia, 1789–1879. Fayetteville: University of Arkansas Press.
Lopez, David, and Yen Espiritu. 1993. “Pan Ethnicity in the United States: A
Theoretical Framework.” Ethnic and Racial Studies 13 (2): 198–224.
Lowry, Ira. S. 1982. “The Science and Politics of Ethnic Enumeration.” In Eth-
nicity and Public Policy, vol. 1, Ethnicity and Public Policy Series, ed. Win-
ston Van Horne and Thomas V. Tonnesen. Milwaukee: University of Wis-
consin Press.
Lugones, María. 1994. “Purity, Impurity, and Separation.” Signs 19 (2) (Winter):
458–479.
Lurie Oestrich, Nancy. 1974. “Historical Background.” In The American Indian
Today. Deland, FL: Everett Edwards.
MacLachlan, Colin M., and Jaime E. Rodríguez. 1980. The Forging of the Cosmic
Race: A Reinterpretation of Colonial Mexico. Berkeley and Los Angeles: Uni-
versity of California Press.
MacLeod, Murdo. 1973. Spanish Central America: A Socioeconomic History,
1520–1720. Berkeley and Los Angeles: University of California Press.
Margolis, Maxine L., and William E. Carter, eds. 1979. Brazil Anthropological Per-
spectives: Essays in Honor of Charles Wagley. New York: Columbia University
Press.
Marks, Jonathan. 1994. “Black, White, Other: Racial Categories Are Cultural
Constructs Masquerading as Biology.” Natural History, December, pp.
32–35.
———. 1995. Human Biodiversity: Genes, Race, and History. New York: Aldine de
Gruyter.
Martin, E., T. J. DeMaio, and P. C. Campanelli. 1990. “Context Effects for Census
Measures of Race and Hispanic Origin.” Public Opinion Quarterly 54 (4):
551–566.
Martinez, Angel R. 1988. “The Effects of Acculturation and Racial Identity on
Self-Esteem and Psychological Well-Being among Young Puerto Ricans.”
Ph.D. diss., City University of New York.
Martínez-Echazábal, Lourdes. 1998. “Mestizaje and the Discourse of Na-
tional/Cultural Identity in Latin America, 1845–1959.” Latin American Per-
spectives 25 (3) (May): 21–42. Issue 100 entitled “Race and National Identity
in the Americas” and edited by Helen Safa.
Massey, Douglas S. 1988. “Ethnic Residential Segregation: A Theoretical Syn-
thesis and Empirical Review.” Sociology and Social Research 69 (3): 317–350.
244
R E F E R E N C E S

Massey, Douglas S., and Nancy A. Denton. 1990. “Patterns of Neighborhood
Transition in a Multiethnic World.” Demography 28: 41–64.
———. 1992. “Racial Identity and the Spatial Assimilation of Mexicans in the
United States.” Social Science Research 21: 235–260.
———. 1993. American Apartheid: Segregation and the Making of the Underclass.
Cambridge, MA: Harvard University Press.
Massey, James. 1980. “A Comparison of Interviewer Observed Race and Re-
spondent Reported Race in the National Health Interviewer Survey.”
American Statistical Association’s 1980 Social Statistics Proceedings. Houston:
American Statistical Association.
McKay, Ruth B. 1993. “Undercoverage of Hispanics in Household Surveys.”
Monthly Labor Review, September, pp. 38–42.
McKay, Ruth B., and Manuel de la Puente. 1995. “Cognitive Research in De-
signing the CPS Supplement on Race and Ethnicity.” Paper presented at the
U.S. Bureau of the Census annual research conference, March 19–23, Ross-
lyn, VA.
McKenney, Nampeo R. 1994. Comments made at the Workshop on Race Eth-
nicity Classification: An Assessment of the Federal Standard for Race and
Ethnicity Classification, Committee on National Statistics, National Re-
search Council, February 17–18, Washington, DC.
McKenney, Nampeo R., and Claudette E. Bennett. 1994. “Issues Regarding Data
on Race and Ethnicity: The Census Bureau Experience.” CDC-ATSDR
Workshop, Public Health Reports 108 (1) (January/February): 16–25.
McKenney, Nampeo R., Claudette Bennett, Roderick Harrison, and Jorge del
Pinal. 1993. “Evaluating Racial and Ethnic Reporting in the 1990 Census.”
Reprinted from the Proceedings of the Section on Survey Research Methods of
the American Statistical Association. Washington, DC: American Statistical
Association.
McKenney, Nampeo R., and Arthur R. Cresce. 1993. “Measurement of Ethnicity
in the U.S. Census Bureau.” In Challenges of Measuring an Ethnic World: Sci-
ence, Politics and Reality. Proceedings of the Joint Canada—United States Con-
ference on the Measurement of Ethnicity, April 1–3. Washington, DC: U.S.
Government Printing Office.
McKenney, Nampeo R., E. W. Fernandez, and W. T. Masamura. 1985. “The
Quality of the Race and Hispanic Origin Information Reported in the 1980
Census.” Proceedings of the Survey Research Methods Section of the American
Statistical Association, Washington, DC: American Statistical Association,
pp. 46–50.
Meaders, Daniel. 1993. Eighteenth-Century White Slaves: Fugitive Notices, vol. 1,
Pennsylvania, 1729–1760. Documentary Reference Collections. Westport,
CT: Greenwood Press.
R E F E R E N C E S
245

Meléndez, Edwin. 1991. “Labor Market Structure and Wage Differences in New
York City: A Comparative Analysis of Hispanics and Non-Hispanic Blacks
and Whites.” In Hispanics in the Labor Force: Issues and Policies, ed. Edwin
Meléndez, Clara E. Rodríguez, and Janice Barry-Figueroa. New York:
Plenum Press.
Meléndez, Edwin, and Clara E. Rodríguez, eds. 1992. “Puerto Rican Poverty
and Labor Markets.” Special issue of the Hispanic Journal of Behavioral Sci-
ences 14 (1) (February).
Meléndez, Edwin, Clara E. Rodríguez, and Janis Barry Figueroa, eds. 1991. His-
panics in the Labor Force: Issues and Policies. New York: Plenum Press.
Merton, Robert K. 1941. “Intermarriage and the Social Structure: Fact and The-
ory.” Psychiatry 4: 361–374.
Miller, A. T. 1991. “Measuring Mulattoes: The Changing U.S. Racial Regime in
Census and Society.” Paper presented at the annual meeting of the Popu-
lation Association of America, May.
Miller, Robin L. 1992. “The Human Ecology of Multiracial Identity.” In Racially
Mixed People in America, ed. Maria P. P. Root. Newbury Park, CA: Sage.
Morales, Rebecca. 2000. “What a Latino Worker Finds in the U.S. Labor Mar-
ket.” Strengthening Employment Opportunities for Latino Workers: Ideas for
Policy and Practice. Report on the State of Hispanic America 1999, ed. Sonia M.
Pérez. Washington, DC: National Council of La Raza.
Morales, Rebecca, and Frank Bonilla. 1993. Latinos in a Changing U.S. Economy:
Comparative Perspectives on Growing Inequality. Newbury Park, CA: Sage.
Morganthau, Tom. 1995. “What Color Is Black?” Newsweek, February 13, pp.
63–65.
Morris, Milton. 1994. “Report from Rapporteur Milton Morris of the Joint Cen-
ter for Political and Economic Studies.” Presented at the Workshop on Race
and Ethnicity Classification, Committee on National Statistics, National
Academy of Sciences, Washington, DC, February 17–18.
Morrison, Tony. 1993. “On the Backs of Blacks.” Time, special issue (Fall), p. 57.
Moss, Philip, and Chris Tilly. 2000. “Why Opportunity Isn’t Knocking: Racial
Inequality and the Demand for Labor.” In Urban Inequality in Four Cities, ed.
Lawrence Bobo, Alice O’Connor, and Chris Tilly. New York: Russell Sage
Foundation.
Mullings, Leith. 1978. “Ethnicity and Stratification in the Urban United States.”
Annals of the New York Academy of Sciences 218: 10–22.
Naber, Nadine. 1998. “White—But Not Quite? An Examination of Arab Ameri-
can In/Visibility.” AAUG Monitor 13 (3): 1–16. Washington, DC: Associa-
tion of Arab-American University Graduates.
Nakashim, Cynthia L. 1992. “An Invisible Monster: The Creation and Denial of
Mixed-Race People in America.” In Racially Mixed People in America, ed.
Maria P. P. Root. Newbury Park, CA: Sage.
246
R E F E R E N C E S

National Council of La Raza. 1995. “Accurate Racial/Ethnic Data Should Drive
Category Review.” Poverty and Race 4 (1) (January/February): 7–9.
———. 1997. A Portrait of Hispanic Economic Status. Washington, DC: National
Council of La Raza.
Nobles, Melissa. 1995. “‘Responding with Good Sense’: The Politics of Race and
Censuses in Contemporary Brazil.” Ph.D. diss., Yale University.
Norris, Alexander. 1999. “Some Opt to Be Just ‘Canadian’ in Origin.” The Gazette
(Montreal), June 1, p. A9.
Oboler, Suzanne. 1995. Ethnic Labels/Latino Lives: Identity and the Politics of (Re)
Presentation in the United States. Minneapolis: University of Minnesota
Press.
O’Crouley Alonso, Pedro. 1972. A Description of the Kingdom of New Spain (1774),
trans. and ed. Sean Galvin. New York: John Howell Books.
Ogbu, John. 1978. Minority Education and Caste: The American System in Cross-
Cultural Perspective. New York: Academic Press.
Omandam, Pat. 1997. “Hawaiians Get Census Category: The Next Census Will
List Native Hawaiians Alone, Apart from Asians.” Honolulu Star-Bulletin
October 29.
Omi, Michael, and Howard Winant. 1995. Racial Formation in the United States.
New York: Routledge & Kegan Paul.
Orbe, Mark E., and Karen E. Strother. 1996. “Signifying the Tragic Mulatto: A
Semiotic Analysis of Alex Haley’s Queen. Howard Journal of Communications
7: 113–126.
Parrillo, Vincent. 1994. “Diversity in America: A Sociohistorical View.” Sociolog-
ical Forum 9 (4): 523–545.
Passel, Jeffrey S. 1993. Comment on “Estimation of Population Coverage in the
1990 United States Census Based on Demographic Analysis,” by Gregory J.
Robinson, Bashir Ahmed, Prithwis Das Gupta, and Karen A. Woodrow.
Journal of the American Statistical Association 88 (423) (September): 1074–1977.
Passel, Jeffrey S., and K. A. Woodrow. 1984. “Geographic Distribution of Un-
documented Immigrants: Estimates of Undocumented Aliens Counted in
the 1980 Census by State.” International Migration Review 18: 642–671.
Patterson, Orlando. 1997. “The Race Trap.” New York Times, op. ed. sec., July 11.
Pedraza-Bailey, Sylvia. 1985. Political and Economic Migrants in America: Cubans
and Mexicans. Austin: University of Texas Press.
Petrullo, V. 1947. Puerto Rican Paradox. Philadelphia: University of Pennsylvania
Press.
Pevar, Stephen L. 1983. The Rights of Indians and Tribes. New York: Bantam
Books.
Pitt-Rivers, Julian. 1975. “Race, Color and Class in Central America and the
Andes.” In Majority and Minority, ed. Norman R. Yetman and C. Hoy Steele.
Boston: Allyn & Bacon.
R E F E R E N C E S
247

Poe, G. S., E. Powell-Griner, J. K. McLaughlin, K. Robinson, and J. Placek. 1993.
“A Comparability Study of the Responses to the 1986 National Mortality
Follow-back Survey to Similar Demographic Items from the Death Certifi-
cate.” Vital and Health Statistics, Data Evaluation and Methods Research, ser. 2,
no. 118. Washington, DC: U.S. Department of Health and Human Services,
Public Health Service, Centers for Disease Control and Prevention, Na-
tional Center for Health Statistics.
Portes, Alejandro, and Robert L. Bach. 1985. Latin Journey: Cuban and Mexican
Immigrants in the United States. Berkeley and Los Angeles: University of
California Press.
Poverty and Race. 1994. “Race/Ethnic Categories: Do They Matter? A Sympo-
sium.” Part 1, vol. 3, no. 6 (November/December).
———. 1995. “Racial/Ethnic Categories: Do They Matter? A Symposium.” Part
2, vol. 4, no. 2, pp. 13–18. (March/April).
Pryce, Delina D. 1999. “Black Latina.” Hispanic, March, p. 56.
Ramos Rosado, Marie. 1987. “La Mujer Puertorriqueña negra: La Otra cara de
la historia.” Homines 10 (2): 491–497.
Rand Reed, Kathleen. 1994. “Comments by the Representative of the American
Society of Minority Health and Transplant Professionals.” Presented at the
Workshop on Race and Ethnicity Classification, Committee on National
Statistics, National Academy of Sciences, Washington, DC, February 17–18.
Rawick, George P. 1972. From Sundown to Sunup: The Making of the Black Com-
munity. Westport, CT: Greenwood Press.
Reed, John, and Roberto R. Ramirez. 1998. “The Hispanic Population in the
United States: March 1997 (Update).” Washington, DC: U.S. Department of
Commerce, Economics and Statistics Administration, Current Population
Reports, P20-511.
Reference Library of Black America. 1990. Vol. 2, comp. and ed. Harry A. Ploski,
with Otto J. Lindenmeyer and Ernest Kaiser. New York: Bellwether Pub-
lishing.
Reimers, Cordelia. 1985. “A Comparative Analysis of the Wages for Hispanics,
Blacks, and Non-Hispanic Whites.” In Hispanics in the U.S. Economy, ed. G.
Borjas and M. Tienda. Orlando, FL: Academic Press.
———. 2000. “Compensation for the Latino Worker.” In Strengthening Employ-
ment Opportunities for Latino Workers: Ideas for Policy and Practice, Report on
the State of Hispanic America 1999, ed. Sonia M. Pérez. Washington, DC: Na-
tional Council of La Raza.
Relethford, John H., Michael P. Stern, Sharon P. Gaskill, and Helen P. Hazuda.
1983. “Social Class, Admixture, and Skin Color Variation in Mexican-
Americans and Anglo-Americans Living in San Antonio, Texas.” American
Journal of Physical Anthropology 61: 97–102.
Return of the Whole Number of Persons within the Several Districts of the United
248
R E F E R E N C E S

States. 1802 Washington, DC: Printed at the Apollo Press by Wm. Duane
and Son.
Rivera, Edward. 1983. Family Installments: Memories of Growing up Hispanic. New
York: Penguin Books.
Rivera-Batiz, Francisco, and Carlos Santiago. 1997. Puerto Ricans in the U.S.: A
Changing Reality. 4th printing. Washington, DC: National Puerto Rican
Coalition.
Robinson, Gregory J., Bashir Ahmed, Prithwis Das Gupta, and Karen A
Woodrow. 1993. “Estimation of Population Coverage in the 1990 United
States Census Based on Demographic Analysis.” Journal of the American Sta-
tistical Association 88: 1061–1071.
Robinson, Gregory J., and Yvonne J. Gist. 1992. “The Effect of Alternative Race
Classification Rules on the Annual Number of Births by Race: 1968–1989.”
Paper presented at the annual meeting of the Population Association of
America, Denver, April 30–May 2.
Robinson, Gregory J., and Susan Lapham. 1991. “Inconsistencies in Race Clas-
sifications of the Demographic Estimates and the Census.” Demographic
Analysis Evaluation Project D9, Preliminary Research and Evaluation
Memorandum no. 82, Population Division, U.S. Bureau of the Census.
Rodríguez, Clara. 1974. “Puerto Ricans: Between Black and White.” Journal of
New York Affairs 1 (4): 92–101.
———. 1989. Puerto Ricans: Born in the USA. Boston: Unwin Hyman.
———. 1990. “Racial Identification among Puerto Ricans in New York.” His-
panic Journal of Behavioral Sciences 12 (4) (November): 366–379.
———. 1991a. “The Effect of Race on Puerto Rican Wages.” In Hispanics in the
Labor Force: Issues and Policies, ed. Edwin Meléndez, Clara Rodríguez, and
Janice Barry Figueroa. New York: Plenum Press.
——— 1991b. “Why Other Is Our Second Fastest Growing Racial Category.”
Letter to the Editor, New York Times, April 4, p. A14.
———. 1991c. Puerto Ricans: Born in the USA. Boulder, CO: Westview Press
———. 1992. “Race, Culture and Latino ‘Otherness’ in the 1980 Census.” Social
Science Quarterly 73 (4) (December): 930–937.
———. 1994a. Challenging Racial Hegemony: Puerto Ricans in the United
States.” In Race, ed. R. Sanjek and S. Gregory. New Brunswick, NJ: Rutgers
University Press.
———. 1994b. “An Overview of Puerto Rican Migration.” In Puerto Rican
Women and Children: Issues in Health, Growth and Development, ed. C. García
Coll and G. Lamberty. New York: Plenum Press.
———. 1996. “Racial Themes in the Literature on Puerto Ricans.” In Latinos in
New York: Communities in Transition, ed. Gabriel Haslip-Viera and Sherrie
Baver. South Bend, IN: University of Notre Dame Press.
Rodríguez, Clara, Aida Castro, Oscar García, and Analisa Torres. 1991. “Latino
R E F E R E N C E S
249

Racial Identity: In the Eye of the Beholder?” Latino Studies Journal 2 (3) (De-
cember): 33–48.
Rodríguez, Clara, and Hector Cordero-Guzmán. 1992. “Placing Race in Con-
text.” Ethnic and Racial Studies 15 (4): 523–542.
Rodríguez, Clara, and Almida López-Hernández. 1995. “Dictionary Definitions
of ‘Race’ and ‘Ethnic,’ 1898–1994.” Unpublished manuscript, Fordham
University.
Rodríguez, Nestor, and Jacqueline Hagan. 1991. Investigating Census Coverage
and Content among the Undocumented: An Ethnographic Study of Latino Immi-
grant Tenants in Houston. Ethnographic Evaluation of the 1990 Decennial Cen-
sus Report 3. Prepared under Joint Statistical Agreement 89–34 with the
University of Houston, U.S. Bureau of the Census, Washington, DC.
Rodriguez, Richard. 1982. Hunger of Memory: An Autobiography. Boston: Godine.
———. 1991. “Mixed Blood, Columbus’s Legacy: A World Made Mestizo.”
Harper’s, November, pp. 47–56.
Rodríguez, Roberto. 1991. “The Columbus 1492–1992 Quincentennial Debate.”
Black Issues in Higher Education, September 26, pp. 20–29.
Rolark, S., C. Bennett, and R. Harrison. 1994. “Tables on Multiracial Responses
and on Interracial and Interethnic Couples and Children.” Paper presented
at the Workshop on Race and Ethnicity Classification, Committee on Na-
tional Statistics, National Academy of Sciences, Washington, DC, February
17–18.
Romero, Mary. 1992. Ethnographic Evaluation of Behavioral Causes of Census Un-
dercount of Undocumented Immigrants and Salvadorans in the Mission District
of San Francisco, California. Ethnographic Evaluation of the 1990 Decennial Cen-
sus Report 18. Prepared under Joint Statistical Agreement 89-41 with the San
Francisco State University Foundation, U.S. Bureau of the Census, Wash-
ington, DC.
Root, Maria P. P. 1992a. “Back to the Drawing Board: Methodological Issues in
Research on Multiracial People. “ In Racially Mixed People in America, ed.
Maria P. P. Root. Newbury Park, CA: Sage.
———, ed. 1992b. Racially Mixed People in America. Newbury Park, CA: Sage.
———. 1992c. “Within, Between, and Beyond Race.” In Racially Mixed People in
America, ed. Maria P. P. Root. Newbury Park, CA: Sage.
———, ed. 1996. The Multiracial Experience: Racial Borders as the New Frontier.
Newbury Park, CA: Sage.
Rose, Willie Lee. 1965. “‘Iconoclasm Has Had Its Day’: Abolitionists and Freed-
man in South Carolina.” In The Antislavery Vanguard: New Essays on the Abo-
litionists, ed. Martin Duberman. Princeton, NJ: Princeton University Press.
Rosenbaum, Emily. 1996. “The Influence of Race on Hispanic Housing Choices,
New York City, 1978–1987.” Urban Affairs Review 32 (2) (November):
217–243.
250
R E F E R E N C E S

Rosenbaum, Emily, Samantha Friedman, Michael H. Schill, and Hielke Bud-
delmeyer. 1999. “Nativity Differences in Neighborhood Quality among
New York City Households, 1996.” Housing Policy Debate 10: 625–628.
Rosin, Hanna. 1994. “Boxed In: America’s New Racial Minority Place.” The New
Republic, January 3, pp. 11–12.
Rout, Leslie B. Jr. 1976. The African Experience in Spanish America: 1502 to the Pre-
sent Day. Cambridge: Cambridge University Press.
Russell, K., M. Wilson, and R. Hall. 1992. The Color Complex: The Politics of Skin
Color among African Americans. New York: Harcourt Brace Jovanovich.
Samhan, Helen Hatab. 1994. “Emerging Ethnic Categories” Paper presented at
the Workshop on Race and Ethnicity Classification: An Assessment of the
Federal Standard for Race and Ethnicity Classification, Committee on Na-
tional Statistics, National Research Council, Washington, DC, February
17–18.
Sandor, Gabrielle. 1994. “The Other Americans.” American Demographics 16 (6):
36–42.
Sanjek, Roger. 1971. “Brazilian Racial Terms: Some Aspects of Meaning and
Learning.” American Anthropologist 73 (5): 1126–1143.
———. 1994. “The Enduring Inequalities of Race.” In Race, ed. Steven Gregory
and Roger Sanjek. New Brunswick, NJ: Rutgers University Press.
Santiago, Roberto. 1995. “Black and Latino.” In Boricuas: Influential Puerto
Rican Writings, an Anthology, ed. Roberto Santiago. New York: Ballantine
Books.
Santos, Richard, and Patricia Seitz. 2000. “Benefit Coverage for the Latino
Worker and His/Her Family.” In Strengthening Employment Opportunities
for Latino Workers: Ideas for Policy and Practice. Report on the State of Hispanic
America 1999, ed. Sonia M. Pérez. Washington, DC: National Council of La
Raza.
Schafer, Daniel L. 1993. “‘A Class of People Neither Freeman Nor Slaves’: From
Spanish to American Race Relations in Florida, 1821–1861.” Journal of Social
History 26 (Spring): 587–609.
Schill, Michael H., Samantha Friedman, and Emily Rosenbaum 1998. “The
Housing Conditions of Immigrants in New York City.” Journal of Housing
Research 9 (2): 201–235.
Schlesinger, Arthur. 1992. The Disuniting of America. New York: Norton.
The Sciences 1997. “The Puzzle of Race.” The Sciences 37 (2) (March–April):16–43.
Scott, Rebecca J. 1995. “Dossier: Raza y Racismo.” Historia social 2 (22): 56–150.
Secada, Walter G. 1998. No More Excuses: The Final Report of the Hispanic Dropout
Project. Report submitted to U.S. Secretary of Education Richard Riley by
the appointed members of the Hispanic Dropout Project, February.
Seltzer, William 1994. “Politics and Statistics: Independence, Dependence or In-
teraction?” United Nations Working Paper Series, no. 6. New York: United
R E F E R E N C E S
251

Nations Department for Economic and Social Information and Policy
Analysis.
Serreno, Renzo. 1945. “Cryptomelanism: A Study of Color Relations and Per-
sonal Insecurity in Puerto Rico.” Psychiatry 10 (August): 261–269.
Shaheen, Jack 1984. The TV Arab. Bowling Green, KY: Bowling Green State Uni-
versity Press.
Shohat, Ella, and Robert Stam. 1994. Unthinking Eurocentrism: Multiculturalism
and the Media. New York: Routledge & Kegan Paul.
Shreeve, James. 1994. “Terms of Estrangement.” Discover, November, pp. 57–63.
Sillitoe, K., and P. White. 1992. “Ethnic Group and the British Census: The
Search for a Question.” Journal of the Royal Statistical Society, ser. A, vol. 155:
141–163.
Silva, N. do Valle, and Carlos Hasenbalg. 1992. Relações raciais no Brasil contem-
poráno. Rio de Janeiro: Editora rio fundo.
Sinclair, April. 1994. Coffee Will Make You Black (A Novel). New York: Avon Books.
Skerry, P. 1990. “Hispanic Job Discrimination.” Wall Street Journal, April 27, p.
A12.
Skidmore, Thomas E. 1990. “The Idea of Race in Latin America, 1870–1940.” In
Racial Ideas and Social Policy in Brazil, 1870–1940, ed. Richard Graham.
Austin: University of Texas Press.
Smith, Billy G., and Richard Wojtowicz. 1989. Blacks Who Stole Themselves: Ad-
vertisements for Runaways in the Pennsylvania Gazette, 1728–1790. Philadel-
phia: University of Pennsylvania Press.
Smith, David J. 1993. The Eugenic Assault on America: Scenes in Red, White and
Black. Fairfax, VA: George Mason University Press.
Smith, Rogers M. 1997. Civic Ideals: Conflicting Visions in U.S. History. New
Haven, CT: Yale University Press.
Snipp, Mathew C. 1989. American Indians: The First of the Land. The Population
of the United States in the 1980s: A Census Monograph Series. National
Committee for Research on the 1980 Census. New York: Russell Sage Foun-
dation.
———. 1994. “Presentation and Comments on Indigenous People.” Paper pre-
sented at the Workshop on Race and Ethnicity Classification, Committee
on National Statistics, National Academy of Sciences, Washington, DC,
February 17–18.
Snowden, Frank M. Jr. 1983. Before Color Prejudice: The Ancient View of Blacks.
Cambridge, MA: Harvard University Press.
Spickard, P. R. 1989. Mixed blood: Intermarriage and Ethnic Identity in Twentieth
Century America. Madison: University of Wisconsin Press.
———. 1992. “The Illogic of American Racial Categories.” In Racially Mixed Peo-
ple in America, ed. Maria P. P. Root. Newbury Park, CA: Sage.
252
R E F E R E N C E S

Stanton, William. 1960. The Leopard’s Spots: Scientific Attitudes towards Race in
America, 1815–1859. Chicago: University of Chicago Press.
Starr, Paul. 1993. “Social Categories and Claims in the Liberal State.” Social Re-
search 59 (2): 263–295.
Statistics Canada and U.S. Bureau of the Census. 1993. Challenges of Measuring
an Ethnic World: Science, Politics and Reality. Washington, DC: U.S. Govern-
ment Printing Office.
Steinberg, Steven. 1981. The Ethnic Myth: Race, Ethnicity, and Class in America.
Boston: Beacon Press.
Stephan, Cookie White. 1992. “Mixed-Heritage Individuals: Ethnic Identity and
Trait Characteristics.” In Racially Mixed People in America, ed. Maria P. P.
Root. Newbury Park, CA: Sage.
Stephens, Thomas M. 1989. Dictionary of Latin American Racial and Ethnic Termi-
nology. Gainesville: University of Florida Press.
Stolzenberg, R. 1982. “Occupational Differences between Hispanics and Non-
Hispanics.” Report to the National Commission for Employment Policy.
Washington, DC: National Commission for Employment Policy.
Straus, Terry Anne. 1991. The Bicentennial Census in a Mixed Neighborhood in
Chicago. Ethnographic Evaluation of the 1990 Decennial Census Report 2. Pre-
pared under Joint Statistical Agreement 89-37 with the Native American
Educational Services College, U.S. Bureau of the Census, Washington, DC.
Strickland, Rennard. 1975. Fire and the Spirits: Cherokee Law from Clan to Court.
Civilization of the American Indian Series. Norman: University of Okla-
homa Press.
Subervi-Vélez, Federico, with Charles Ramírez Berg, Patricia Constantakis-
Valdés, Chon Noriega, Diana I. Ríos, and Kenton T. Wilkinson. 1997. “His-
panic Oriented Media.” In Latin Looks: Images of Latinas and Latinos in the
U.S. Media., ed. Clara E. Rodríguez. Boulder, CO: Westview Press.
Sundiata, Ibrahim. 1987. “Late Twentieth Century Patterns of Race Relations in
Brazil and the United States.” Phylon 48 (1): 62–76.
Takaki, Ronald. 1989. Strangers from a Different Shore: A History of Asian Ameri-
cans. Boston: Little, Brown.
———. 1993. A Different Mirror: A History of Multicultural America. Boston: Lit-
tle, Brown.
———. 1994. From Different Shores: Perspectives on Race and Ethnicity in America.
2d ed. New York: Oxford University Press.
Taylor-Gibbs, Jewelle, and Alice M. Hines 1992. “Negotiating Ethnic Identity:
Issues for Black-White Biracial Adolescents.” In Racially Mixed People in
America,. ed. Maria P. P. Root. Newbury Park, CA: Sage.
Tamayo Lott, Juanita. 1992. “Policy Purposes of Race and Ethnicity: A Re-
assessment of Federal Racial and Ethnic Categories.” Paper presented at
R E F E R E N C E S
253

the Third Women’s Policy Research Conference, Institute for Women’s Pol-
icy Research, Washington, DC, May 16.
Tamayo Lott, Juanita. 1997. Asian Americans: From Racial Category to Multiple
Identities. Walnut Creek, CA: Alta Mira Press.
Telles, Edward E. 1992. “Residential Segregation by Skin Color in Brazil.” Amer-
ican Sociological Review 57: 187–197.
———. 1993. “Racial Distance and Region in Brazil: The Case of Marriage
among Color Groups.” Latin American Research Review 28: 141–62.
———. 1994. “Industrialization and Racial Inequality in Employment: The
Brazilian Example.” American Sociological Review 59 (February): 46–63.
Telles, Edward E., and Nelson Lim. 1998. “Does Who Classifies Race Matter?
Self vs. Social Classification of Race and Racial Income Inequality in
Brazil.” Demography 34:4:465–474.
Telles, Edward E., and Edward Murguía. 1990. “Phenotypic Discrimination and
Income Differences among Mexican Americans.” Social Science Quarterly
71(4) (December): 683–696.
Thomas, Nicholas. 1989. “The Force of Ethnology: Origins and Significance of
the Melanesia/Polynesia Division.” Current Anthropology 30: 27–41.
Thomas, Piri. 1967. Down These Mean Streets. New York: Knopf.
Thompson, Lloyd A. 1989. Romans and Blacks. Norman: University of Oklahoma
Press.
Thornton, Russell. 1987. American Indian Holocaust and Survival: A Population
History since 1492. Norman: University of Oklahoma Press.
Tienda, M., and V. Ortiz. 1986. “‘Hispanicity’ and the 1980 Census.” Social Sci-
ence Quarterly 67 (March): 3–20.
Tizard, Barbara, and Ann Phoenix. 1993. Black, White or Mixed Race: Race and
Racism in the Lives of Young People of Mixed Parentage. London: Routledge &
Kegan Paul.
Torres, Andrés. 1992. “Nativity, Gender, and Earnings Discrimination.” Hispanic
Journal of Behavioral Sciences 14 (1) (February): 124–143.
———. 1995. Between Melting Pot and Mosaic. Philadelphia: Temple University
Press.
Torres, Andrés, and Clara E. Rodríguez. 1991. “Latino Research and Policy:
The Puerto Rican Case.” In Hispanics in the Labor Force, ed. Edwin Melén-
dez, Clara E. Rodríguez, and Janis Barry-Figueroa. New York: Plenum
Press.
Torres, Arlene, and Norman E. Whitten Jr., eds. 1998. Blackness in Latin America
and the Caribbean. Vol. 2. Bloomington: Indiana University Press.
Torres, Joseph. 1996. “Report Says Combining Race and Ethnicity in Census
Lowers Latino Response. Hispanic Link Weekly Report, June 3, p. 4.
Torres-Saillant, Silvio. 1998. “The Tribulations of Blackness: States in Dominican
Racial Identity.” Latin American Perspectives 25 (4) (May): 126–146. Issue 100
254
R E F E R E N C E S

entitled “Race and National Identity in the Americas” and edited by Helen
Safa.
Treviño, F. M. 1987. “Standardized Terminology for Standardized Populations.”
American Journal of Public Health 77: 69–72.
Tucker, Clyde, Ruth McKay, Brian Kojetin, Roderick Harrison, Manuel de la
Puente, Linda Stinson, and Ed Robison. 1996. “Testing Methods of Collect-
ing Racial and Ethnic Information: Results of the Current Population Sur-
vey Supplement on Race and Ethnicity.” Statistical Note no. 40, Statistical
Note Series. Washington, DC: Bureau of Labor Statistics.
Tumin, Melvin, and Arnold Feldman. 1961. Social Class and Social Change in
Puerto Rico. Princeton, NJ: Princeton University Press.
United Nations 1980. Principles and Recommendations for Population and Housing
Censuses. New York: Department of International Economic and Social Af-
fairs, Statistical Office, Statistical Papers, ser. M, no. 67.
———. 1985. Demographic Yearbook, 1983. 35th issue. New York: Department of
International Economic and Social Affairs.
———. 1989. Handbook of Population and Housing Censuses. New York: Depart-
ment of International Economic and Social Affairs, Studies in Methods, ser.
F, no. 49.
———. 1992. Handbook of Population and Housing Censuses, Part II: Demographic
and Social Characteristics. New York: Department of International Economic
and Social Affairs, Studies in Methods, ser. F, no. 54.
United Nations Educational, Scientific, and Cultural Organization (UNESCO).
1952. The Race Concept: Results of an Inquiry. Paris: United Nations Educa-
tional, Scientific, and Cultural Organization.
U.S. Bureau of the Census. 1932. Census of the Population: 1930, vol. 3, Population,
part 1. Washington, DC: U.S. Government Printing Office.
———. 1943. Census of the Population: 1940, vol. 2, Population: Characteristics of the
Population. Washington, DC: U.S. Government Printing Office.
———. 1953. Census of the Population: 1950. Population, vol. 2, Characteristics of the
Population, part I. Washington, DC: U.S. Government Printing Office.
———. 1963. Census of the Population: 1960, vol. 1, Characteristics of the Population.
Washington, DC: U.S. Government Printing Office.
———. 1967. A Century of Population Growth: From the First Census of the U.S. to
the Twelfth, 1790–1900. Baltimore: Genealogical Publishing.
———. 1972. 1970 Census of the Population, Subject Report Series, Persons of
Spanish Origin, PC(2)-1C. Washington, DC: U.S. Government Printing
Office.
———. 1973. Census of the Population: 1970. Subject Reports. Final Report PC(2)-
1A, National Origin and Language, appendix C: Definitions and Explana-
tions of Subject Characteristics. Washington, DC: U.S. Government Print-
ing Office.
R E F E R E N C E S
255

U.S. Bureau of the Census. 1978. Twenty Censuses: Population and Housing Ques-
tions, 1790–1980. Washington, DC: Superintendent of Documents, U.S.
Government Printing Office, October.
———. 1982. Persons of Spanish Origin by State: 1980 (Supplementary Report
PC80-S1-7, August). Washington, D.C.: U.S. Government Printing Office.
———. 1989. 200 Years of U.S. Census Taking: Population and Housing Questions,
1790–1990. Washington, DC: U.S. Government Printing Office.
———. 1990. “Census of Population and Housing, Content Determination Re-
ports, Race and Ethnic Origin, 1990.” CDR-1-13, Washington, DC: U.S.
Government Printing Office.
———. 1991. “Census Bureau Releases 1990 Census Counts on Hispanic Popu-
lation Groups.” Press release, June 12, Washington, DC.
———. 1992. Exploring Alternative Race-Ethnic Comparison Groups in Current Pop-
ulation Surveys. Current Population Reports, P23-182. Washington, DC:
U.S. Government Printing Office.
———. 1993a. 1990 Census of Population: Social and Economic Characteristics. 1990
CP-2-1.
———. 1993b. Persons of Hispanic Origin in the United States, 1990. Census of
Population, CP-3-3. Washington, DC: U.S. Government Printing Office.
———. 1993c. We, the American . . . Hispanics. Ethnic and Hispanic Statistics
Branch, Population Division, November. Washington, DC: U.S. Govern-
ment Printing Office.
———. 1996a. “Findings on Questions on Race and Hispanic Origin Tested in
the 1996 National Content Survey.” Staff of the Special Population Statis-
tics, Population Division Working Paper no. 16. Washington, DC: Econom-
ics and Statistics Administration.
———. 1996b. Population Projections on the United States by Age, Sex, Race, and
Hispanic Origin: 1995 to 2050. P25-1130, Current Population Reports.
Washington, DC: U.S. Dept. of Commerce, Economics and Statistics
Administration.
———. 1997. “Report to Congress—The Plan for Census 2000.” Washington,
DC: U.S. Government Printing Office.
U.S. Census Office. 1901. Population, Part I, Census Reports, Volume I, Twelfth Cen-
sus of the United States, Taken in the Year 1900. William R. Merriam, Director,
prepared under the supervision of William C. Hunt, Chief Statistician for
Population. Washington, DC: U.S. Census Office.
U.S. Department of Commerce. 1995. “1996 Race and Ethnic Targeted Test; No-
tice.” Federal Register, 60:231:62010–62014. December 1. Washington, DC:
U.S. Government Printing Office.
U.S. Department of Commerce, Bureau of the Census. 1921. Population, 1920,
Volume III, Fourteenth Census of the United States, Taken in the Year 1920. Num-
ber and Distribution of Inhabitants. Prepared under the supervision of
256
R E F E R E N C E S

William C. Hunt, Chief Statistician for Population. Washington, DC: U.S.
Government Printing Office.
———. 1922. Population, 1920, Volume III, Fourteenth Census of the United States,
Taken in the Year 1920 Composition and Characteristics of the Population by
States. Prepared under the supervision of William C. Hunt, Chief Statisti-
cian for Population. Washington, DC: U.S. Government Printing Office.
———. 1993. We the American . . . Foreign Born. Ethnic and Hispanic Statistics
Branch, report no. 350-631. Washington, DC: U.S. Government Printing
Office.
———. 1997. Report to Congress—The Plan for Census 2000. Originally issued
July, revised and reissued August. Washington, DC: U.S. Government
Printing Office.
U.S. Department of Education, National Center for Education Statistics. 1996.
Racial and Ethnic Classifications Used by Public Schools. NCES 96-092. Wash-
ington, DC: U.S. Government Printing Office.
U.S. Department of Labor, Bureau of Labor Statistics. 1995. “A CPS Supple-
ment for Testing Methods of Collecting Racial and Ethnic Information:
May, 1995.” Bureau of Labor Statistics Statistical Working Papers series,
November.
U.S. Department of State. 1832a. Abstract of the Fifth Census of the United States:
1830. City of Washington: Printed at the Globe Office by F. P. Blair.
———. 1832b. Abstract of the Returns of the Fifth Census Showing the Number of
Free People, the Number of Slaves, the Federal or Representative Number and the
Aggregate of Each County of Each State of the United States. Prepared by the
Clerk of the House of Representatives, Washington, DC: Duff Green.
———. 1835. Statistical View of the Population of the United States: From 1790 to
1830 Inclusive. Washington, DC: Duff Green.
———. 1842. Sixth Census Enumeration of the Inhabitants of the United States as
Corrected at the Department of State in 1840 (Aggregate Amount of Each De-
scription of Persons within the United States and Their Territories Accord-
ing to the Census of 1840. As corrected at the Department of State, From the
Returns of the Marshals of the Several Districts). No publisher given. Mi-
crofilm available at the Science, Industry and Business Library, New York
City.
U.S. General Accounting Office (GAO). 1990. Immigration Reform, Employer
Sanctions, and the Question of Discrimination. Washington, DC: U.S. Govern-
ment Printing Office.
———. 1992. “Federal Data Collection: Agencies’ Use of Consistent Race and
Ethnic Definitions.” Report to the Chairman, Committee on Government
Operations, House of Representatives, December, GAO/GGD-93-25.
———. 1993. “Census Reform: Early Outreach and Decisions Needed on Race
and Ethnic Questions.” January, GAO/GGD-93-36.
R E F E R E N C E S
257

U.S. General Accounting Office (GAO). 1997. “Collection and Reporting of Race
and Ethnicity Data.” Statement of Bernard L. Ungar, Associate Director,
Federal Management and Workforce Issues, General Government Divi-
sion, April 23, GAO/T-GGD-97-92.
U.S. House Committee on Post Office and Civil Service. 1994a. Opening State-
ment, April 14, 1993: Hearings of the Subcommittee on Census, Statistics and
Postal Personnel, 103d Cong., 1st sess., April 14, 1993, ser. no. 103-7. Wash-
ington, DC: U.S. Government Printing Office.
———. 1994b. Prepared Statement of Arthur A. Fletcher, Chairperson, U.S. Commis-
sion on Civil Rights: Hearings before the Subcommittee on Census, Statistics and
Postal Personnel, 103 Cong., 1st sess., November 3, 1993, ser. no. 103-7, pp.
248–261. Washington, DC: U.S. Government Printing Office.
———. 1994c. Prepared Statement of Tony E. Gallegos, Chairman, U.S. Equal Em-
ployment Opportunity Commission: Hearings before the Subcommittee on Cen-
sus, Statistics and Postal Personnel, 103d Cong., 1st sess., November 3, 1993,
ser. no. 103–7, pp. 285–286. Washington, DC: U.S. Government Printing
Office.
———. 1994d. Statement of Billy J. Tidwell, Director of Research, National Urban
League: Hearings before the Subcommittee on Census, Statistics and Postal Per-
sonnel, 103d Cong., 1st sess., July 29, 1993, ser. no. 103-7, pp. 229–237. Wash-
ington, DC: U.S. Government Printing Office.
———. 1994e. Statement of Carlos Fernández, President of the Association of Multi-
ethnic Americans: Hearings before the Subcommittee on Census, Statistics and
Postal Personnel, 103d Cong., 1st sess., June 30, 1993, ser. no. 103–7, pp.
127–157. Washington, DC: U.S. Government Printing Office.
———. 1994f. Statement of Harry A. Scarr, Acting Director, Bureau of the Census:
Hearings before the Subcommittee on Census, Statistics and Postal Personnel,
103d Cong., 1st sess., June 30, 1993, ser. no. 103-7, pp. 3–17. Washington,
DC: U.S. Government Printing Office.
———. 1994g. Statement of Helen Hatab Samhan, Deputy Director, Arab American
Institute: Hearings before the Subcommittee on Census, Statistics and Postal Per-
sonnel, 103d Cong., 1st sess., July 29, 1993, ser. no. 103-7, pp. 185–196. Wash-
ington, DC: U.S. Government Printing Office.
———. 1994h. Statement of Hon. Norman Y. Mineta, Representative in Congress
from California: Hearings before the Subcommittee on Census, Statistics and
Postal Personnel, 103d Cong., 1st sess., June 1993, ser. no. 103-7, pp. 208–231.
Washington, DC: U.S. Government Printing Office.
———. 1994i. Statement of Leonard J. Biermann, Acting Director, Office of Federal
Contract Compliance Programs, Employment Standards Administration, U.S.
Department of Labor: Hearings before the Subcommittee on Census, Statistics and
Postal Personnel, 103d Cong., 1st sess., November 3, 1993, ser. no. 103–7, pp.
282–285. Washington, DC: U.S. Government Printing Office.
258
R E F E R E N C E S

———. 1994j. Statement of Manning Feinlieb, Director of the National Center for Ed-
ucation Statistics: Hearings before the Subcommittee on Census, Statistics and
Postal Personnel, 103 Cong., 1st sess., April 14, 1993, ser. no. 103-7, pp. 70–83.
Washington, DC: U.S. Government Printing Office.
———. 1994k. Statement from the Mexican American Legal Defense and Education
Fund Representative: Hearings before the Subcommittee on Census, Statistics and
Postal Personnel, on Review of Federal Measurements of Race and Ethnicity, 103d
Cong., 1st sess., June 30, 1993, ser. no. 103–7, pp. 178–182. Washington, DC:
U.S. Government Printing Office.
———. 1994l. Statement of Rachel A. Joseph, Interim Executive Director, National
Congress of American Indians: Hearings before the Subcommittee on Census, Sta-
tistics and Postal Personnel, 103d Cong., 1st sess., July 29, 1993, ser. no. 103-
7, pp. 237–245. Washington, DC: U.S. Government Printing Office.
———. 1994m. Statement of Reynolds Farley, Research Scientist, Population
Studies Center, University of Michigan: Hearings before the Subcommittee on
Census, Statistics and Postal Personnel, 103 Cong., 1st sess., April 14, 1993,
ser. no. 103-7, pp. 47–70. Washington, DC: U.S. Government Printing
Office.
———. 1994n. Statement of Sally Katzen, Administrator, Office of Information and
Regulatory Affairs, Office of Management and Budget: Hearings before the Sub-
committee on Census, Statistics and Postal Personnel, 103d Cong., 1st sess., July
29, 1993, ser. no. 103-7, pp. 213–220. Washington, DC: U.S. Government
Printing Office.
———. 1994o. Statement of Senator Daniel K. Akaka, Senator in Congress from the
State of Hawaii: Hearings before the Subcommittee on Census, Statistics and
Postal Personnel, 103d Cong., 1st sess., July 29, 1993, ser. no. 103-7, pp.
185–196. Washington, DC: U.S. Government Printing Office.
———. 1994p. Statement of Sonia Pérez, Senior Policy Analyst, National Council of
La Raza: Hearings before the Subcommittee on Census, Statistics and Postal Per-
sonnel, 103d Cong., 1st sess., June 30, 1993, ser. no. 103-7, pp. 171–178.
Washington, DC: U.S. Government Printing Office.
———. 1994q. Statement of Susan Graham, Executive Director of Project RACE:
Hearings before the Subcommittee on Census, Statistics and Postal Personnel, of
the Committee on Post Office and Civil Service, House of Representatives,
103d Cong., 1st sess., June 30, 1993, ser. no. 103-7, pp. 105–127. Washington,
DC: U.S. Government Printing Office.
———. 1994r. Testimony and Prepared Statement of Henry Der of the National Coali-
tion for an Accurate Count of Asians and Pacific Islanders: Hearings before the
Subcommittee on Census, Statistics and Postal Personnel, 103d Cong., 1st sess.,
June 30, 1993, ser. no. 103-7, pp. 92–105. Washington, DC: U.S. Government
Printing Office.
U.S. House of Representatives. 1883. The Miscellaneous Documents of the House of
R E F E R E N C E S
259

Representatives for the Second Session of the Forty-Seventh Congress, 1882–‘83.
Vol. 13. Washington, DC: U.S. Government Printing Office.
U.S. House of Representatives. 1895. The Miscellaneous Documents of the House of
Representatives for the First Session of the Fifty-Second Congress, (1895),
1891–‘92. Vol. 50, part 8. Washington, DC: U.S. Government Printing Office.
———. 1994. Committee on Post Office and Civil Service, Subcommittee on
Census, Statistics and Postal Personnel. Hearings on the Review of Federal
Measurements of Race and Ethnicity, 103d Cong., 1st sess., April 14, June 30,
July 29, and November 3, 1993, ser. no. 103-7. Washington, DC: U.S. Gov-
ernment Printing Office.
U.S. Immigration Commission, 1907–1910. 1911. [Also known as the Dillingham
Commission.] Washington, DC: U.S. Government Printing Office.
U.S. Office of Management and Budget (OMB). 1995. “Standards for the Classi-
fication of Federal Data on Race and Ethnicity; Notice.” Federal Register,
part 6, vol. 60, no. 166, pp. 44674–44693, August 28.
———. 1997a. “Recommendations from the Interagency Committee for the Re-
view of the Racial and Ethnic Standards to the Office of Management and
Budget Concerning Changes to the Standards for the Classification of Fed-
eral Data on Race and Ethnicity; Notice.” Federal Register, 62: 131:36874–
36946, July 9.
———. 1997b. “Revisions to the Standards for the Classification of Federal
Data on Race and Ethnicity; Notices.” Federal Register, 62:210:58782–58790,
October 30.
———. 1999. “Provisional Guidance on the Implementation of the 1997
Standards for the Collection of Federal Data on Race and Ethnicity.”
Prepared by Tabulation Working Group, Interagency Committee for the
Review of Standards for Data on Race and Ethnicity, Washington, DC,
February 17.
U.S. Secretary of the Interior. 1852. History and Statistics of the State of Maryland:
According to the Returns of the Seventh Census of the United States: 1850. Pre-
pared by Jos. C. G. Kennedy, Superintendent of Census, Washington, DC:
Printed by Gideon and Co.
———. 1853a. The Seventh Census of the United States: 1850 Embracing a Statisti-
cal View of Each of the States and Territories Arranged by County, Towns, Etc. J.
D. B. De Bow, Superintendent of the United States Census, Washington,
DC: Robert Armstrong, Public Printer.
———. 1853b. The Seventh Census: Report of the Superintendent of the Census for
December 1, 1852 (to Which Is Appended the Report for December 1, 1851).
Printed by Order of the House of Representatives of the United States.
Washington, DC: Robert Armstrong, Public Printer.
———. 1872a. A Compendium of the Ninth Census (June 1, 1870). Concurrent Res-
olution of Congress and under the Direction of the Secretary of the Interior,
260
R E F E R E N C E S

Francis Walker, Superintendent of Census, Washington, DC: U.S. Govern-
ment Printing Office.
———. 1872b. The Statistics of the Population of the United States Embracing the Ta-
bles of Race, Nationality, Sex, Selected Ages, and Occupations, Ninth Census—
Volume I., to Which Are Added the Statistics of School Attendance and Illiteracy,
of Schools, Libraries, Newspapers and Periodicals, Churches, Pauperism and
Crime, and of Areas, Families, and Dwellings. Compiled from the Original Re-
turns of the Ninth Census (June 1, 1870) under the Direction of the Secre-
tary of the Interior, Francis Walker, Superintendent of Census, Washington,
DC: U.S. Government Printing Office.
U.S. Statutes at Large. 1856. U.S. Statutes at Large, 6th–12th Cong., 1799–1813.
Vol. 2, ed. Richard Peters, Esq.. Boston: Little, Brown.
———. 1963. Vol. 3, ed. Richard Peters, Esq. Buffalo, NY: Dennis and Co.
Valcarcel, Carmen Luz. 1994. “Growing up Black in Puerto Rico.” In Challenging
Racism and Sexism: Alternatives to Genetic Explanations, ed. Ethel Tobach and
Betty Rosoff. New York: Feminist Press.
Valenzuela, Abel. 1991. “Hispanic Poverty: Is It an Immigrant Problem?” His-
panic Journal of Social Policy 5: 59–82.
Valverde, Kieu-Linh Caroline. 1992. “From Dust to Gold: The Vietnamese Am-
erasian Experience.” In Racially Mixed People in America, ed. Maria P. P.
Root. Newbury Park, CA: Sage.
van den Berghe, Pierre L. 1960. “Hypergamy, Hypergenation, and Miscegena-
tion.” Human Relations 13: 83–91.
———. 1981. The Ethnic Phenomenon. New York: Elsevier.
Vobejda, Barbara. 1991. “Categorizing the Nation’s Millions of ‘Other Race.’”
Washington Post, April 29, p. A9.
———. 1998. “Hispanic Youths Outnumber Blacks: Federal Report Reveals
Crest of Wave That Will Reshape U.S. Demographic Mosaic,” Washington
Post, July 15, pp. A02-20.
Wacquant, Loic. 1994. “Review of F. James Davis, Who Is Black? One Nation’s
Definition.” In Theory and Society 23 (6) (December): 9-2-908.
Wade, Peter. 1985. “Race and Class: the Case of South American Blacks.” Ethnic
and Racial Studies 8 (2): 233–249.
Wagley, Charles. 1965. “On the Concept of Social Race in the Americas.” In Con-
temporary Cultures and Societies of Latin America: A Reader in the Social An-
thropology of Middle and South America and the Caribbean, ed. Dwight B.
Heath and Richard N. Adams. New York: Random House.
Wallman, Katherine. 1994. “Concluding Remarks by the Director of the Office
of Information and Regulatory Affairs, Office of Management and Bud-
get.” Paper presented at the Workshop on Race and Ethnicity Classifica-
tion, Committee on National Statistics, National Academy of Sciences,
Washington, DC, February 17–18.
R E F E R E N C E S
261

Wallman, Katherine. 1999. “Draft Provisional Guidance on the Implementation
of the 1997 Standards for the Collection of Federal Data on Race and Eth-
nicity.” Washington, DC: Executive Office of the President, Office of Man-
agement and Budget.
Washburn, S. L. 1963. “The Study of Race.” American Anthropologist 65: 521–531.
Waters, Mary. 1990. Ethnic Options: Choosing Identities in America. Berkeley and
Los Angeles: University of California Press.
———. 1993. “From Majority to Minority Status: Identity Development among
Caribbean Immigrants and Their Children in New York City.” Paper pre-
sented at the American Studies Conferences, Boston, November 6.
Webster’s Collegiate Dictionary. 1898. 1910. 1916. 1931. 1936. 1959. 1963. 1973.
1983. 1990. 1994. (1st–9th eds.). Springfield, MA: Merriam-Webster.
Weissman, Albert. 1990. “Race-Ethnicity: A Dubious Scientific Concept.” Public
Health Reports 105 (1) (January/February): 102–103.
White, Philip H., and David L. Pearce. 1993. “Ethnic Group and the British Cen-
sus.” In Challenges of Measuring an Ethnic World: Science, Politics and Reality,
ed. Statistics Canada and U.S. Bureau of the Census. Washington, DC: U.S.
Government Printing Office.
Williams, Eric. 1984. From Columbus to Castro: The History of the Caribbean,
1492–1969. New York: Random House.
Williams, Teresa Kay. 1992. “Prism Lives: Identity of Binational Amerasians.” In
Racially Mixed People in America, ed. Maria P. P. Root. Newbury Park, CA:
Sage.
Williamson, J. 1984. New People: Miscegenation and Mulattoes in the United States.
New York: New York University Press.
Wills, Christopher. 1994. “The Skin We’re In.” Discover, November, pp. 76–81.
Wilson, Terry P. 1992. “Blood Quantum: Native American Mixed Bloods.” In
Racially Mixed People in America, ed. Maria P. P. Root. Newbury Park, CA:
Sage.
Winant, Howard. 1992. “Rethinking Race in Brazil.” Journal of Latin American
Studies 24: 173–192.
Wingerd, Judith. 1995. “Cognitive Interviews with Foreign Born Blacks: Census
Race and Ancestry Questions.” Final Report submitted to the Statistical Re-
search Division, Center for Survey Methods Research, Bureau of the Cen-
sus. Washington, DC: U.S. Bureau of the Census.
Wood, Joe. 1994. “Fade to Black: Once upon a Time in Multiracial America.” Vil-
lage Voice, December 6, pp. 25–34.
Woodrow-Lafield, Karen A. 1992. “A Consideration of the Effect of Immigration
Reform on the Number of Undocumented Residents in the United States.”
Population and Policy Review 11: 117–144.
———. 1993. “Finding an Upper Limit on Recent Net Undocumented Migra-
tion to the United States.” Revised version of a paper presented at the an-
262
R E F E R E N C E S

nual meeting of the American Sociological Association, August 13–17,
Miami Beach.
Wright, Carroll D. 1956. History and Growth of the United States Census. New
York: 1900 government report reprinted by the Johnson Reprint Co. Place
of publication not indicated.
Wright, Lawrence. 1994. “One Drop of Blood.” New Yorker, July 25, pp. 46–54.
Wright, Winthrop R. 1990. Cafe Con Leche: Race, Class and National Image in
Venezuela. Austin: University of Texas Press.
Yinger, John. 1995. Closed Doors, Opportunities Lost: The Continuing Cost of Hous-
ing Discrimination. New York: Russell Sage Foundation.
Zack, Naomi, ed. 1995. American Mixed Race: The Culture of Microdiversity. Lan-
tham, MD: Rowan & Littlefield.
R E F E R E N C E S
263


About the Author
C L A R A E . RO D R Í G U E Z
is a Professor of Sociology at Fordham Uni-
versity’s College at Lincoln Center. She has been a Visiting Professor at
Columbia Unitersity, MIT, and Yale University. She has also been a Se-
nior Fellow at the Smithsonian Institution’s National Museum of Amer-
ican History and a Visiting Scholar at the Russell Sage Foundation. Pre-
viously, she was the Dean of Fordham University’s College of Liberal
Studies. Her most recent book is Latin Looks: Images of Latinas and Lati-
nos in the U.S. Media (Boulder, CO: Westview Press, 1997).
283
Wyszukiwarka
Podobne podstrony:
Poland, 1918 1945, An Interpretive and Documentary History of the Second Republic
History of the United States' War on Drugs
The Special Relationship?tween the United States and Great Britain
Copper and Molybdenum?posits in the United States
Confederation And Constitution of the United States
A Brief History of the United States (thru 1880s)
[Mises org]Tausigg,F W Tariff History of The United States
A Content Analysis of Magazine?vertisements from the United States and the Arab World
Egyptain Foreign Policy Toward Israel and the United States doc
History of Wicca in England 1939 to the Present Day Julia Phillips
Penier, Izabella Engendering the National History of Haiti In Edwige Danticat s Krik Krak! (2008)
Warning to Japan Norway and the United States From the Cetaceans (DOLPHIN S CONTACTS)
towards histories of computing in the humanities
Pamela R Frese, Margaret C Harrell Anthropology and the United States Military, Coming of Age in th
David E Levis Presidents and the Politics of Agency Design, Political Insulation in the United Stat
więcej podobnych podstron