
IEEE/ACM TRANSACTIONS ON NETWORKING, VOL. 8, NO. 1, FEBRUARY 2000
87
The ERICA Switch Algorithm for ABR Traffic
Management in ATM Networks
Shivkumar Kalyanaraman, Associate Member, IEEE, Raj Jain, Fellow, IEEE, Sonia Fahmy, Member, IEEE,
Rohit Goyal, and Bobby Vandalore
Abstract—This paper describes the “explicit rate indication for
congestion avoidance” (ERICA) scheme for rate-based feedback
from asynchronous transfer mode (ATM) switches. In ERICA, the
switches monitor their load on each link and determine a load
factor, the available capacity, and the number of currently active
virtual channels. This information is used to advise the sources
about the rates at which they should transmit. The algorithm is
designed to achieve high link utilization with low delays and fast
transient response. It is also fair and robust to measurement er-
rors caused by the variations in ABR demand and capacity. We
present performance analysis of the scheme using both analytical
arguments and simulation results. The scheme is being considered
for implementation by several ATM switch manufacturers.
Index Terms—ATM network, Internet.
I. I
NTRODUCTION
T
HE KEY new feature of asynchronous transfer mode
(ATM) that distinguishes it from other networking
technologies is that it provides very sophisticated traffic man-
agement. ATM networks use connection admission control,
traffic shaping, policing, selective discard, packet discard, and
explicit feedback to manage the traffic. Traffic management is
particularly important at high speeds since even a short-term
overload at these speeds can lead to significant queues and data
loss.
ATM networks provide several services. Of these, the avail-
able bit rate (ABR) service is ideal for data. In this service,
switches use an option to provide an explicit rate feedback to the
sources and sources control their traffic accordingly. The ATM
forum traffic management specification [1] contains detailed
rules for the ABR source and destination end systems. The rules
for switches are also specified. The switch behavior, however, is
Manuscript received December 2, 1997; revised September 14, 1999;
approved by IEEE/ACM T
RANSACTIONS ON
N
ETWORKING
Editor R. Guerin.
This work was supported by the National Science Foundation under Contract
9628438.
S. Kalyanaraman was with the Department of Computer Information Sys-
tems, The Ohio State University, Columbus, OH 43210-1277 USA. He is now
with the Department of Electrical and , Rensselaer Polytechnic Institute, Troy,
NY 12180-3590 USA (e-mail: shivkuma@ecse.rpi.edu).
R. Jain and B. Vandalore are with the Department of CIS, The Ohio State
University, Columbus, OH 43210-1277 USA (e-mail: jain@cis.ohio-state.edu;
vandalor@cis.ohio-state.edu).
S. Fahmy was with the Department of Computer Information Systems, The
Ohio State University, Columbus, OH 43210-1277 USA. He is now with the
Department of Computer Science, Purdue University, West Lafayette, IN 47907
USA (e-mail: fahmy@cis.ohio-state.edu).
R. Goyal was with the Department of CIS, The Ohio State University,
Columbus, OH 43210-1277 USA. He is now with Nexabit Networks (Lucent),
MA USA (e-mail: goyal@cis.ohio-state.edu).
Publisher Item Identifier S 1063-6692(00)01441-2.
only coarsely specified so that various vendors can implement
their own switch rate allocation algorithms and distinguish their
products. The switch rules simply ensure that switches from
different vendors will interoperate, though the operation may
not be optimal. Several switch algorithms have been developed
[2]–[10]. This paper describes one of the earliest of such switch
algorithms.
The explicit rate indication for congestion avoidance
(ERICA) algorithm was presented at the ATM Forum in Feb-
ruary 1995. Since then, its performance has been independently
studied in many papers [5], [6], [8]. Also, we have incorporated
several modifications into the algorithm [10], [11]. This paper
provides a consolidated description and a performance analysis
of the algorithm.
This paper is organized as follows. The next two sections ex-
amine the ABR service and describe the switch model and de-
sign goals. Section IV describes the algorithm and examines the
tradeoffs involved in selecting the algorithm metrics and param-
eters. Section VI presents representative simulations to show the
performance of the scheme under strenuous conditions. We also
present limited analytical arguments of the convergence of the
algorithm in Appendix A.
II. T
HE
ABR C
ONTROL
M
ECHANISM
According to the ATM Forum specifications, ATM networks
currently offer five service categories: constant bit rate (CBR),
real-time variable bit rate (rt-VBR), nonreal-time variable bit
rate (nrt-VBR), available bit rate (ABR), and unspecified bit rate
(UBR). Of these, ABR and UBR are designed for data traffic
exhibiting bursty unpredictable behavior.
The UBR service is simple and does not give sources any
guarantees. The network elements try to improve throughput
and reduce loss using intelligent buffer allocation [17], cell drop
[18], and scheduling. The ABR service provides better service
for data traffic by periodically advising sources about the rates
at which they should be transmitting. The switches monitor their
load and divide the available bandwidth fairly among active
flows. This allows competing sources to get a fair share of the
bandwidth while also allowing the link to be fully utilized. The
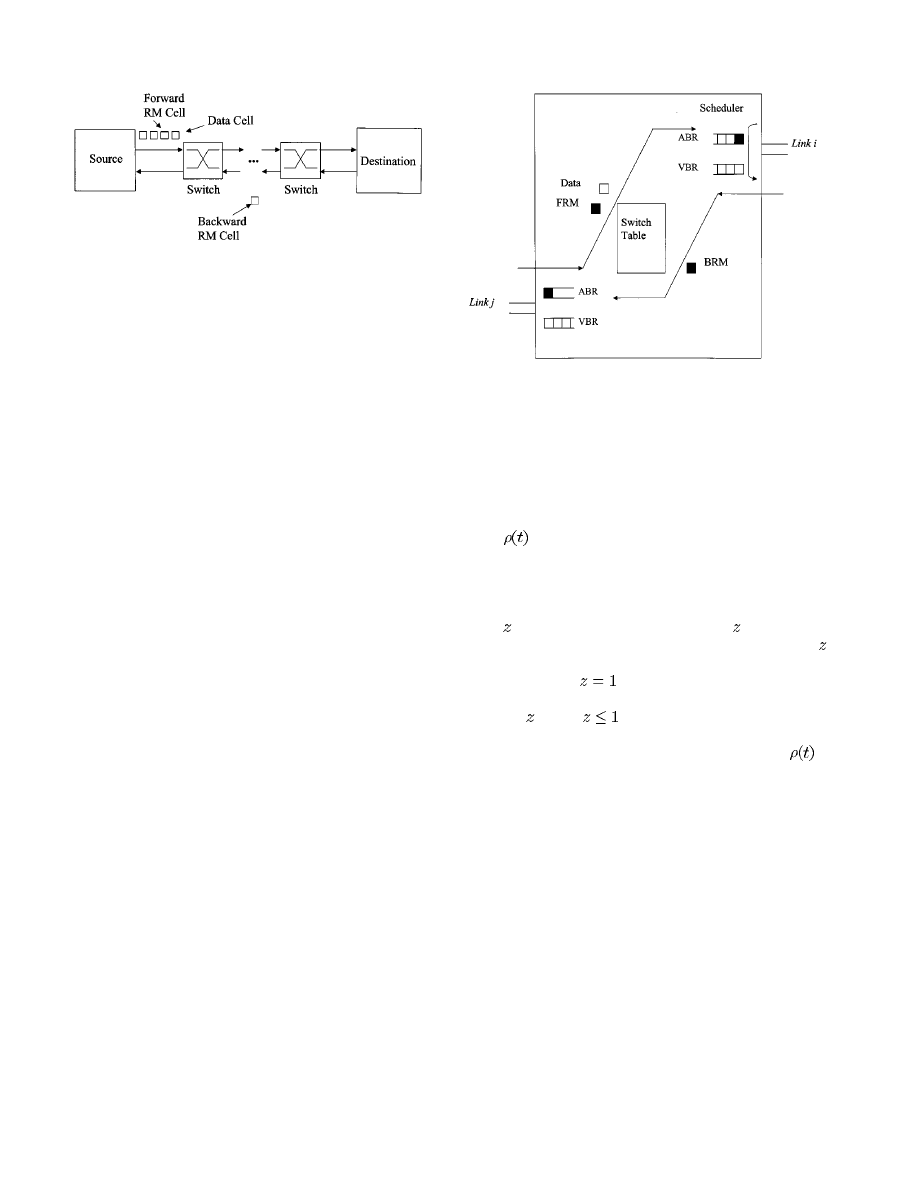
feedback from the switches to the sources is indicated in re-
source management (RM) cells, which are periodically gener-
ated by the sources and turned around by the destinations (refer
to Fig. 1).
The RM cells contain the source’s current cell rate (CCR)
and several fields that can be used by the switches to provide
feedback to the source. These fields are: explicit rate (ER), con-
gestion indication (CI) flag, and no increase (NI) flag. The ER
1063–6692/00$10.00 © 2000 IEEE
88
IEEE/ACM TRANSACTIONS ON NETWORKING, VOL. 8, NO. 1, FEBRUARY 2000
Fig. 1.
RM cell path.
field indicates the rate that the network can support at the par-
ticular instant in time. When starting at the source, the ER field
is usually set to the peak cell rate, and the CI and NI flags are
clear. On the path, each switch reduces the ER field to the max-
imum rate it can support, and sets CI or NI if necessary [13].
The RM cells flowing from the source to the destination
are called forward RM cells (FRM’s) while those returning
from the destination to the source are called backward RM
cells (BRM’s). When a source receives a BRM, it computes its
allowed cell rate (ACR) using its current ACR, the CI and NI
flags, and the ER field of the RM cell [15].
III. S
WITCH
M
ODEL
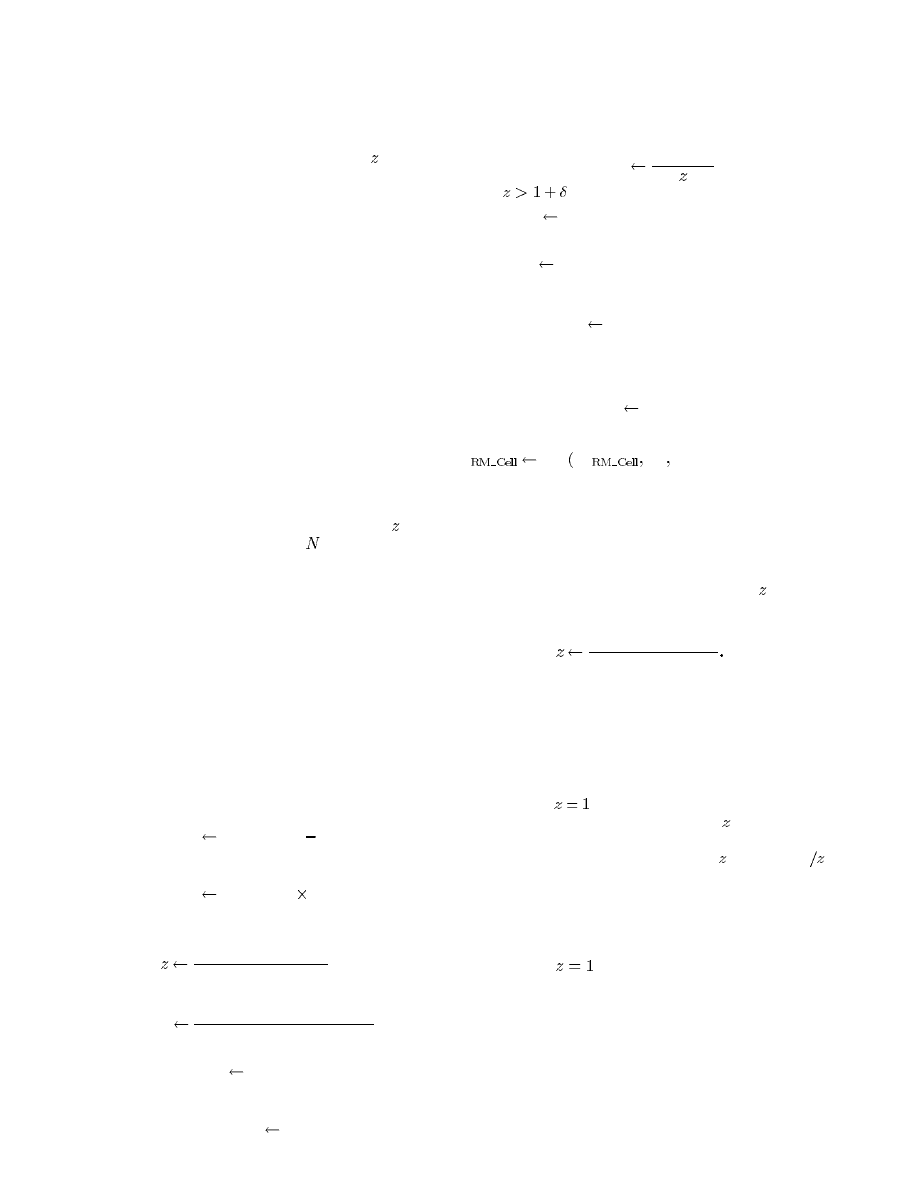
Our switch model is shown in Fig. 2. Each service category
has a separate first-in, first-out (FIFO) output queue, which
feeds to the output link under the control of a scheduling mech-
anism. The ERICA algorithm works at every ABR queueing
point (assumed to be at the output for this paper). For simplicity,
we assume that there are at most two classes (VBR and ABR)
and ABR has the lower priority, i.e., it gets the leftover capacity
after VBR cells are transmitted. We do not consider the case
of ABR virtual connections (VC’s) guaranteeing nonzero
minimum cell rates in this paper. Techniques for adapting a
switch scheme to guarantee such rates are suggested in [19].
Other issues not addressed in this paper include the effect of
more complex queueing strategies like per-VC queueing, net-
work segmentation using the virtual source/virtual destination
(VS/VD) option [1], and multipoint ABR connections. Some
of these issues are addressed in [10] and [21].
In ERICA, the time is divided into consecutive equal-sized
slots called “switch averaging intervals.” As shown in Fig. 2,
the measured load in the forward direction in each slot is used
to provide feedback in the reverse direction in the next slot. The
feedback may be computed at the end of each slot or when a
backward RM cell (BRM) is received.
One of the design features of ERICA is that switches give at
most one feedback value per flow during any averaging interval.
This precludes the switch from giving multiple conflicting feed-
back indications in a single averaging interval using the same
control values.
ERICA gives feedback only in the explicit rate field in the
RM cell. It is possible to additionally throttle or moderate the
sources by setting the CI and NI bits in the RM cell using poli-
cies suggested by several other schemes [5], [19].
Fig. 2.
Switch model.
A. Design Goals
In designing ERICA, our main goals were to maximize link
utilization, minimize queueing delays, achieve fair allocation,
reduce transient response time, and achieve stable and robust
operation. Each of these goals is explained below.
1) Utilization: Our first goal was to maximize the link uti-
lization
. This is done by allocating as much of the avail-
able capacity to active ABR flows as possible. The entire link
capacity that is not used by the higher priority VBR and CBR
service categories is potentially available to ABR.
ERICA tracks ABR utilization using a metric called “load
factor” ( ; refer to Section IV-A). Specifically,
is proportional
to the ratio of the ABR input rate to the ABR capacity. Using ,
the ERICA utilization goal is a steady-state operating point in
the neighborhood of
. In certain configurations, this goal
cannot be realized for all bottlenecks, in which case, the maxi-
mization of
(where
) is desired for those bottlenecks.
2) Queueing Delay: High link utilization can result in large
queues and long delays. The instantaneous utilization
is
unity when a large queue backlog exists at the bottleneck. Our
efficiency goal is to maximize the link utilization while keeping
the steady-state queueing delay under a target maximum
value. The concept of maximizing throughput (utilization) and
minimizing delay is known as “congestion avoidance” [14].
In ERICA, the definition of congestion avoidance has been
broadened to include the goal of reducing the delay. When the
queueing delay is more than the target, allocations are reduced
so that queue size decreases.
3) Fairness: A commonly used criterion for describing fair-
ness is the max–min allocation [7]. Among the allocation vec-
tors (with elements in a descending order) that result in link
utilizations less than or equal to 100%, the lexicographically
largest vector is the max–min allocation. In simple terms, the
goal of max–min allocation is to give equal shares of a resource
to all contending sources. However, if some sources cannot use
their shares (since they are constrained at some other bottle-
neck), they are given the maximum share that they can use, and
the leftover is available for equal allocation to other contending
sources. This process can be shown to lead to max–min allo-
cation, provided the source demands are fixed and noninfinite.
KALYANARAMAN et al.: ERICA SWITCH ALGORITHM
89
Several schemes including ERICA [3], [4], [19] use this method
and search for a “maximum equal share” value to allocate to all
contending sources. In ERICA, fairness is sought only after ef-
ficiency has been achieved, that is, the load factor
is in the
neighborhood of unity. If the load is too high or too low, rates
for all sources are decreased or increased so that efficiency is
rapidly achieved.
In addition to the above “steady state” goals, ERICA aims to
achieve the following goals.
4) Stability and Transient Performance: A stable system is
one that can reestablish its steady state after perturbations. The
transient performance of the scheme determines how quickly
the steady state is reestablished.
5) Robustness: In cases where the system has no steady
state (e.g., due to persistent variation in capacity and demand),
the scheme should be robust. This means that its essential
performance metrics should not degrade to unacceptable levels.
We emphasize that ERICA is an engineering solution which
incorporates these design goals. We provide limited analytical
arguments and simulations to support our performance claims.
IV. T
HE
ERICA A
LGORITHM
The ERICA algorithm periodically monitors the load on each
link and determines the ABR capacity, the load factor ( ), and
the number of active virtual connections (
) during each aver-
aging interval.
The complete pseudocode including all features of ERICA
is given in [10]. Below we present the key steps in ERICA
as a pseudocode. The variable MaxAllocPrevious (or MaxAl-
locPrev., abbreviated) represents the maximum allocation given
during the previous averaging interval to any source transmitting
to this output link. Similarly, MaxAllocCurrent (or MaxAlloc-
Curr., abbreviated) is used to determine the maximum allocation
given to any source so far in the current averaging interval.
Initialization:
MaxAllocPrevious
←
MaxAllocCurrent
←
FairShare
End of Averaging Interval:
Total ABR Cap.
Link Cap.
VBR Cap.
(1)
Target ABR Cap.
Fraction
Tot. ABR Cap.
(2)
ABR Input Rate
Target ABR Cap.
(3)
FairShare
Target ABR Capacity
Number of Active VCs
(4)
MaxAllocPrevious
MaxAllocCurrent
(5)
MaxAllocCurrent
FairShare
(6)
When FRM is received:
CCR[VC]
←
CCR_in_RM_Cell
When a BRM is received:
VCShare
CCR[VC]
(7)
IF (
)
THEN ER
Max (FairShare, VCShare)
(8)
ELSE ER
Max (MaxAllocPrev., VCShare)
(9)
MaxAllocCur.
Max (MaxAllocCur., ER)
(10)
IF (ER > FairShare AND CCR[VC] < Fair-
Share)
THEN ER
FairShare
(11)
ER
Min ER
ER Target ABR Cap.).
(12)
This pseudocode achieves the goals of efficiency, fairness,
and bounded delay, as explained next.
A. Efficiency: Using the Load Factor Metric
The key metric used in ERICA is the load factor ( ), which is
the ratio of the measured input rate at the port to the target ABR
capacity, as given by (3)
ABR Input Rate
Target ABR Capacity
The target ABR capacity is a fraction of the total ABR
capacity [(2)], where the fraction may be determined based
upon queueing delays (refer to Section IV-C). The load factor
is a compact and accurate congestion indicator, and is arguably
better for rate-based schemes than using queue length alone [9].
The load factor is used in ERICA with the goal of driving
the system toward an efficient operating point, defined as the
neighborhood of
. The simplest way to achieve efficiency
is to reduce each VC’s activity by a factor of . In other words,
each VC’s allocation (“VCShare” in the pseudocode above) is
set to the VC CCR divided by the load factor , or CCR[VC]
.
Here, CCR is the estimate of the source current rate. CCR may
be read from the forward RM cells of the VC or measured by
the switch. Either way, the CCR value is stored in a table and
used for this calculation. The analytical arguments given in the
Appendix show that this technique does drive the system to the
neighborhood of
.
Though VCShare can be used to achieve efficiency, it may
not be a fair allocation. A mechanism is required to equalize the
rate allocations while ensuring that the bottleneck load factor
remains in the neighborhood of unity. This is the topic of the
following section.
B. Max–Min Fairness—Equalizing Allocations
One way to equalize allocations is to calculate the maximum
of the VCShare values and assign this maximum value to all
90
IEEE/ACM TRANSACTIONS ON NETWORKING, VOL. 8, NO. 1, FEBRUARY 2000
sources. This can result in sharp load changes (and extended
periods of overload). For example, consider the case when the
allocation of
sources are (
), where and
are negligibly small. The load factor is close to unity (assuming
no prior queue buildups). The maximum of these allocations is
, which we call “MaxAllocPrevious,” referring to the fact
that the maximum is calculated in the previous cycle and used
in the next cycle. In the next cycle, the allocations based upon
this maximum value would be (
),
leading to a load factor of almost . To avoid this, ERICA uses
a two-step process. A variable “FairShare” is computed as the
ratio of the target ABR capacity and the number of active con-
nections. If a VC is initially sending at a rate below FairShare,
it is not allowed to increase its rate to MaxAllocPrevious in the
current cycle. In particular, all sources sending below the Fair-
Share are allowed to rise to FairShare, and those sending above
FairShare are allowed to rise to MaxAllocPrevious. Therefore,
a VC sending at a rate below FairShare would take two cycles
(steps) to reach the maximum possible allocation.
These features and mechanisms (VCShare, rate equalization,
at least FairShare, at most FairShare if rate is low) are incorpo-
rated into the ERICA algorithm as presented in (7)–(11). The
parameter
is used for the equalization of allocations [(9)] and
defines the “neighborhood of unity.”
C. Queue Control
In Section IV-A, we noted that the Target ABR Ca-
pacity is a fraction of the Total ABR Capacity. This fraction
can be a function of the current queue length
, i.e.,
Target ABR Capacity
Total ABR Capacity.
The function
, called the “queue control function,” al-
lows only a specified fraction of the available capacity to be
allocated to the sources. Such a function should not artificially
restrict the system utilization to a value smaller than 100%, and
it should compensate for errors in measurement (which manifest
as queues). Further, given a fixed number of persistent sources
of traffic, it should allow the system to achieve a queueing delay
target. A control-theoretic definition of these steady-state and
robust stability conditions is given in Ozbay et al. [24], and an
analysis of queue management techniques for ABR while main-
taining max–min fairness is presented by Ma and Ramakrishnan
[23]. A simple queue control function such as a constant func-
tion used in earlier versions of ERICA and the OSU scheme
[called “Target Utilization” ( )] does not meet these require-
ments.
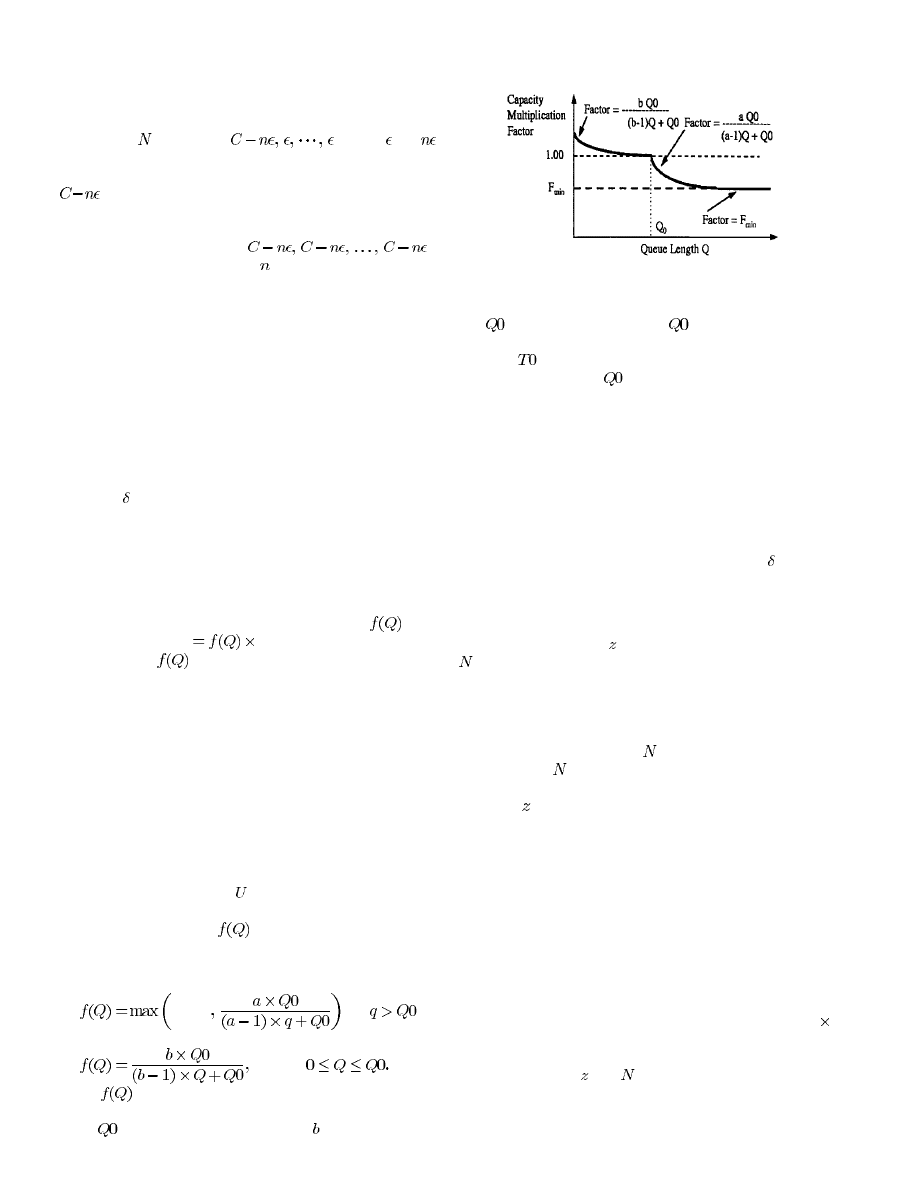
The alternative is for
to vary depending upon the
queueing delay. A number of such functions can be designed
[23], [29]. One of the functions that worked particularly well is
the following (also refer to Fig. 3):
QDLF
for
and
for
Here,
is a truncated rectangular hyperbola assuming
values between 1 and queue drain limit factor (QDLF) in the
range
to infinity, and values between
and 1 in the range
Fig. 3.
The queue control function in ERICA.
0 to
. Both curves intersect at
, where the value is 1.
To emphasize the control of queueing delay, ERICA uses a
parameter
(target queueing delay), which is converted into
the target queue length
parameter before performing the
calculation given above. The parameter settings are discussed
in Section V.
V. P
ARAMETER
C
HOICES AND
R
OBUSTNESS
I
SSUES
The robustness and performance of ERICA are significantly
dependent upon how measurements are performed and param-
eters are chosen. ERICA parameters may be classified into: 1)
parameters related to measurement and averaging; 2) queue con-
trol parameters; and 3) max–min fairness parameter .
A. Measurement and Averaging Related Parameters
As previously mentioned, the essential metrics used in
ERICA, i.e., load factor ( ) and number of active connections
(
, for FairShare calculation) are measured during consecutive
switch averaging intervals. Variation in demand, available
capacity, and number of currently active connections could
lead to errors in the estimation of these metrics, which, in
turn, would lead to errors in feedback. ERICA is particularly
sensitive to underestimation of
because FairShare (which is
calculated using
) is the minimum allocation given to sources.
ERICA is also sensitive to oscillations in estimation of the
load factor
during alternating periods of demand activity and
inactivity, and in the presence of higher priority VBR traffic.
Therefore, the choice of the switch averaging interval is critical
to the performance of ERICA.
To determine a reliable averaging interval, observe that
the activity of any source is determined within a round-trip
time (RTT). Moreover, the maximum time for feedback
from any switch to reach a source, and the resultant ac-
tivity to be experienced at the switch (called the “feedback
delay”) is the maximum RTT (max RTT) plus the maximum
inter-RM-cell-time (max inter-RM-cell-time). Allowing time
for transient loads between averaging intervals to subside, a
reliable value for the switch averaging interval is at least 2
(max RTT + max inter-RM-cell-time).
Choosing averaging intervals smaller than max RTT poses
the risk of errors in
and
(due to temporary inactivity of
sources), and choosing intervals smaller than max inter-RM-
cell-time poses the risk of not giving feedback to some sources
in every measurement interval. In fact, intervals smaller than the
KALYANARAMAN et al.: ERICA SWITCH ALGORITHM
91
maximum inter-cell-time would guarantee that
is underesti-
mated.
One solution to the problem of estimation errors with small
intervals is to use separate averaging intervals for
and
to
allow reliable estimation of each, and give feedback in every
-interval, which would be the smaller of the two. ERICA em-
ploys an alternate method. The method is to use a single base av-
eraging interval and optionally use exponential averaging tech-
niques to improve reliability and reduce variance in the mea-
surements. The base averaging interval is chosen statically in
the range [5 ms, 20 ms] for an OC-3 bottleneck link (used in
our simulations) and may be scaled by the ratio of OC-3 (155
Mbps) speed to the given bottleneck link speed for slower or
faster links.
Exponential averaging can be applied for the load factor
using the formula:
= [exponential average of input
rate)/
exponential average of available capacity)],
where the exponential average of input rate or available ca-
pacity (denoted as ) is calculated as
. Our
simulations indicate that an
value of 0.8 is sufficient given a
base averaging interval choice in the range [5 ms, 20 ms]. This
value gives significant weight to the latest sample of input
rate or available capacity. Our simulations use OC-3 bottleneck
links and encompass LAN/WAN/satellite configurations with
significant variation in demand and available capacity [10].
Averaging the number of active VC’s,
, is performed in a
different manner. The problem is that when not even one cell of
an “active” VC is seen in the base averaging interval, it would
be counted as inactive. This error would result in an increase in
FairShare, which is the minimum allocation given to VC’s, and
could lead to instability (manifested as unbounded queues). This
problem can be simply addressed by using a separate interval for
measuring
and set this interval to
{
, 1/(minimum
rate allocation)} of any VC. Since this is not possible, we ap-
proximate it though this procedure. We first define the “activity
level” of a VC as a real number between 0 and 1. The activity
level is initialized to 1 whenever any cell from the VC is seen
and decayed by a multiplicative parameter DecayFactor in each
successive interval in which a VC is inactive. At the end of each
interval, the sum of all activity levels would give the value of
(which is now a real number). Setting DecayFactor to a value
sufficiently close to unity would ensure that the error in esti-
mation due to the exponential decay would be small. We have
observed that a value of DecayFactor in the range [0.9, 0.95] is
sufficient given our base averaging interval choice in the range
[5 ms, 20 ms].
B. Queue Control Parameters
Recall that the queue control function
used in ERICA
(Section IV-C) is one of several possible functions [29], and has
four parameters:
QDLF
, and . The parameter
, which
specifies the target queueing delay, is affected by several other
system parameters such as the available buffer size, the bottle-
neck link speed, and the maximum round trip time (or the base
averaging interval length).
also affects the decrease function
component of
in conjunction with the parameters
and
. The decrease function affects how quickly excess queues are
drained. The combination of these factors makes the choice of
important.
A heuristic used in ERICA ensures that the maximum os-
cillation of queues in the steady state will be no larger than
. As described in Appendix A, in steady state, the maximum
deviation of the load factor is determined by the parameter .
Specifically, assuming that queueing deviations are corrected in
one averaging interval, we have the relationship:
Base Averaging Interval. Given that our choice of
is 0.1 (refer
to next section) and the base averaging interval lies between
[5 ms, 20 ms], then
lies between [0.5 ms, 2 ms].
The parameter QDLF (queue drain limit factor) limits the
amount of available capacity that can be allocated as drain ca-
pacity to clear excess queues, and determines the effectiveness
of the queue control policy in reacting to transient queues. When
the aggregate input rate is equal to the available capacity (i.e.,
a balanced load), QDLF also determines the minimum value of
the load factor . The range of determines the range of possible
feedback values or the maximum possible oscillations in feed-
back (a stability concern). We have found that a QDLF choice
of 0.5 balances these conflicting concerns for a wide range of
configurations and loads.
The parameters
and , in conjunction with
, determine
the slope of the rectangular hyperbolas. The steeper the slope,
the more sensitive the scheme is to small variations in queue
length. Further larger difference in the slopes of the two hyper-
bolas accentuates the effect of the discontinuity of
at
leading to larger oscillations around
in the steady state (if
one exists and is reached). Since
and
affect these slopes, the
choice must be made considering these issues as well.
To be consistent with the steady-state queue fluctuation
heuristic for choosing
, the ideal choice for
is 1, which
eliminates the -hyperbola. In practice, a value between [1,
1.05] can be chosen where a larger value of
allows the
steady-state queueing delay to be closer to the target, at the risk
of incurring steady-state oscillations. For the parameter , we
have found that a value in the range [1.10, 1.25] sufficiently
differentiates the ERICA queue control function from simple
step or linear functions. Larger values of
make the function
closer to a step function with the possibility of larger queue
oscillations, and smaller values make the function closer to a
linear function with a small slope, which limits the speed of
response to transient queues.
C. The Max–Min Fairness Parameter
The max–min fairness parameter
defines the steady-state
operating region toward which ERICA attempts to drive the
system. Specifically, in ERICA, we consider the system be
max–min fair when the load factor
is in the range
and all allocations are equal. We use this weaker definition of
max–min fairness because converging to
exactly is not
guaranteed in ERICA. Further, when
, we consider the
system allocations to be “infeasible” (i.e., we estimate average
load to be larger than average capacity that is unsustainable)
[7], [23], and therefore not max–min fair. When
, the
allocations cannot be max–min fair by definition [7].
92
IEEE/ACM TRANSACTIONS ON NETWORKING, VOL. 8, NO. 1, FEBRUARY 2000
TABLE I
P
ARAMETER
V
ALUES
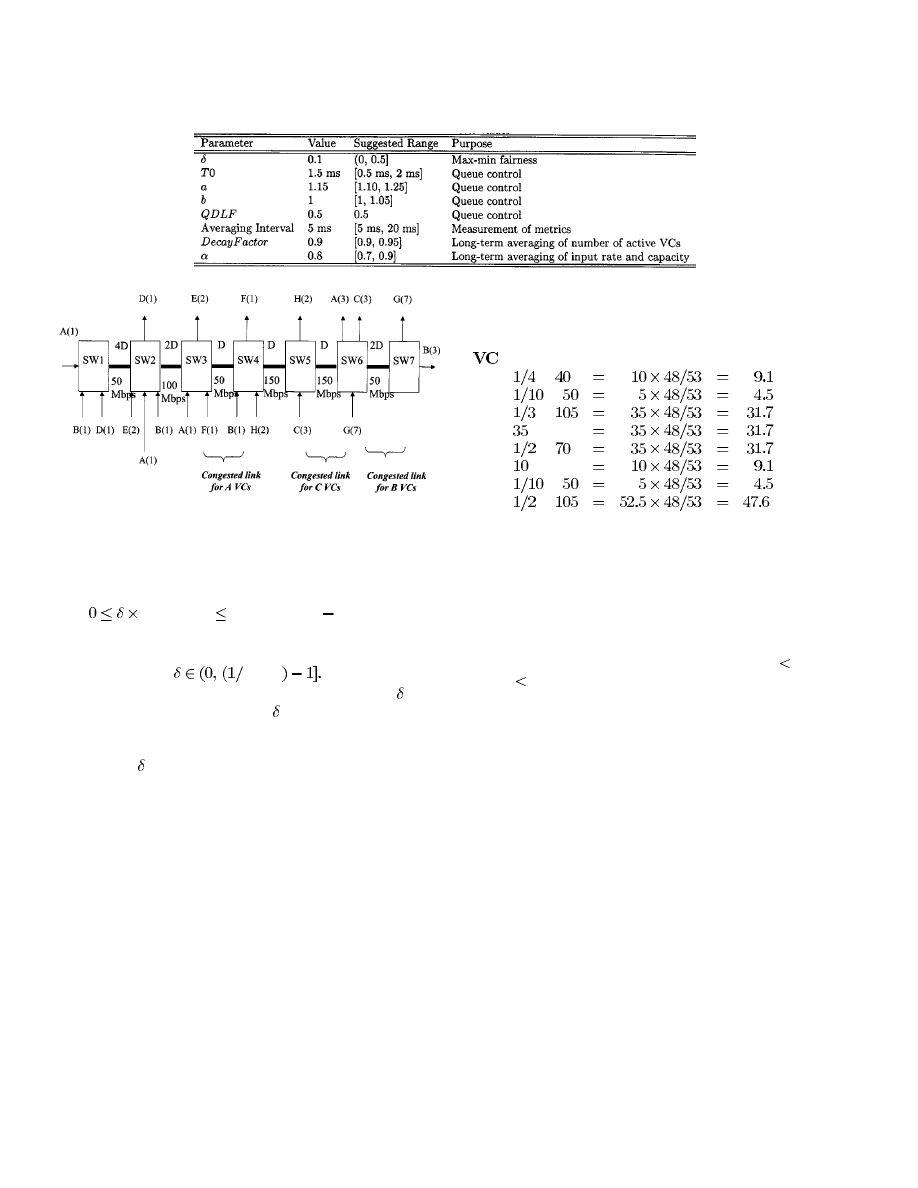
Fig. 4.
The Generic Fairness Configuration-2. Note: Entry/exit links of length
D and speed 150 Mbps. D = 1000 km ) max RT T = 130 ms.
Observe that in the steady state, the minimum drain capacity
is determined by the relation
Target Cap.
Available Cap.
Target Cap.
Rearranging the terms and applying the relationship that target
capacity is at least QDLF × Available Capacity, we have
QDLF
For QDLF of 0.5, this gives us a range of (0, 0.5] for . The
upper bound is a weak one since a
value of 0.5 would result
in minimal drain capacity and possibly large transient queues
(due to the equalization of rates to the maximum allocation).
The value of
chosen in ERICA is 0.1, which allows sufficient
drain capacity and leaves a nontrivial zone for rate equalization
to improve convergence toward max–min fairness.
VI. P
ERFORMANCE
E
VALUATION OF
E
RICA
In this section, we present simulations to verify the perfor-
mance of ERICA under strenuous conditions not considered in
the analytical arguments in Appendix A. Our simulations use all
the features of the ERICA algorithm.
The parameter set used in our simulations is shown in Table I.
A. Max–Min Fairness
We use the popular Generic Fairness Configuration-2
(GFC-2) to test the utilization, queue lengths and fairness
of the scheme. The configuration (illustrated in Fig. 4) has
multiple bottlenecks and connections with different round-trip
times. This configuration was selected by the ATM Forum
traffic management working group as the test configuration to
compare various schemes.
The following are the expected rate allocations as per the
max–min fairness criterion. Note that the link bandwidth is ad-
justed by 48/53 to get an expected application throughput:
Fair Share Calculation
Fairshare
A
of
Mbps
B
of
Mbps
C
of
Mbps
D
Mbps
E
of
Mbps
F
Mbps
G
of
Mbps
H
of
Mbps.
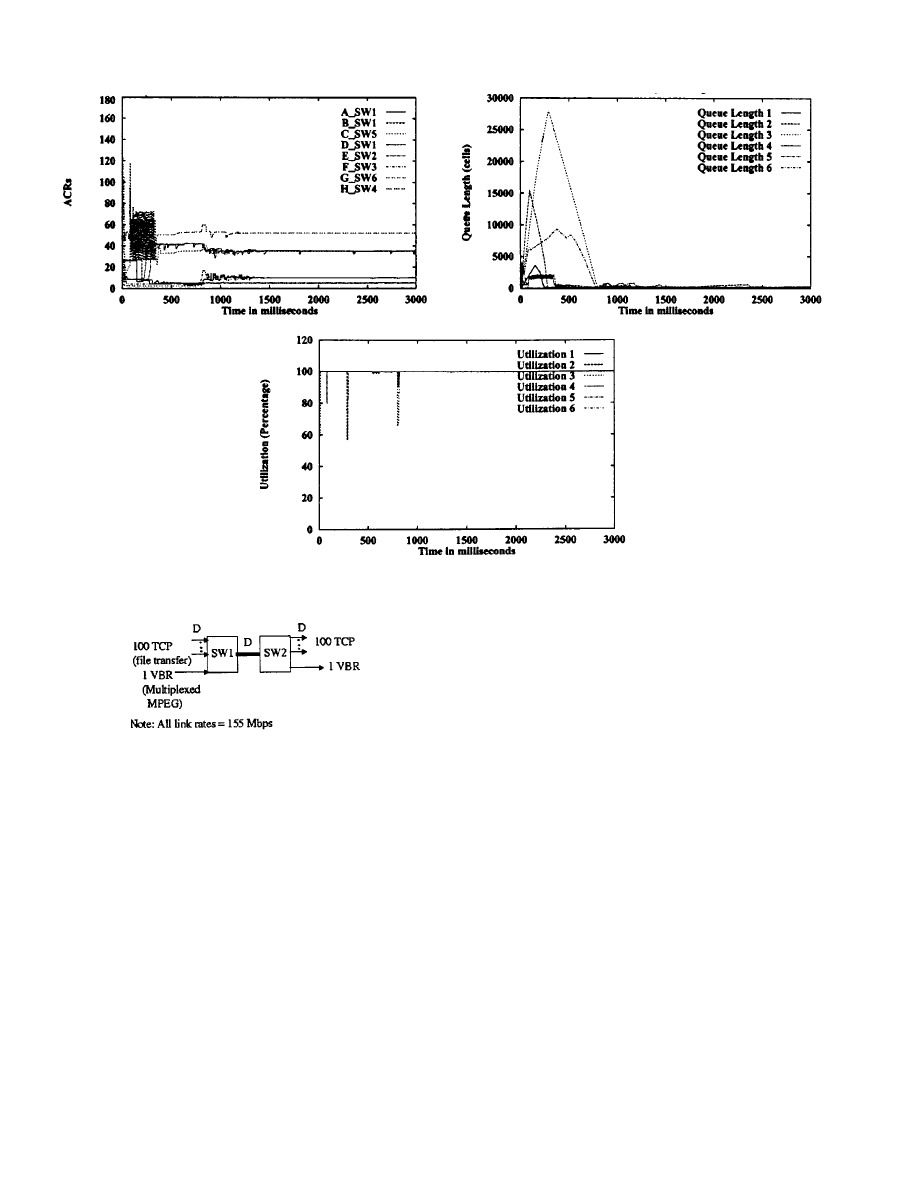
Simulation results are shown in Fig. 5. Fig. 5(a) shows the al-
lowed cell rates (ACR’s) of the sources. Fig. 5(b) shows the queue
lengths at the ports connected to the next switch for the first six
switches. Fig. 5(c) shows the link utilizations of the links con-
necting two switches. The optimal allocations are achieved in
under 400 ms (under four round trips), and the queues are drained
within 800 ms (under seven round trips). During the transient pe-
riod, the link utilizations are close to 100% and the queue lengths
are controlled to reasonable values (maximum queue is
30 000
cells, i.e.,
270 ms or two round-trip times at 50-Mbps bottle-
neck rate). The steady-state utilizations are close to 100%, and the
queue lengths are kept close to zero. The minimal oscillations in
the steady state are due to the small variation in queueing delays.
The initial rate assignment for each source in this simulation was
picked randomly. For reasonable confidence, we repeated this ex-
periment with other random values, which gave similar results.
B. Robustness
For testing the robustness of the scheme, we need a configu-
ration which attacks the weaknesses of the scheme, namely, its
dependency upon measurements. Variation in load and capacity
could lead to measurement and feedback errors, resulting in un-
bounded queues or low average utilization. The TCP and VBR
configuration (refer to Fig. 6) is designed to test this case.
The configuration simulates capacity variation by using a
higher priority VBR virtual circuit, which carries traffic mul-
tiplexed from fifteen long-range dependent sources [10]. The
traffic generated by this VC (and as a result, the ABR capacity)
is highly variable, as shown in Fig. 7(a). The configuration
simulates load variation by using TCP sources carrying infinite
ftp traffic. The load variation is caused by the startup dynamics
of TCP. The TCP slow start protocol begins with small window
sizes, and the amount of data it sends is limited by the window
size (window-limited), rather than a network-assigned rate.
As a result, the load offered by an individual TCP connection
KALYANARAMAN et al.: ERICA SWITCH ALGORITHM
93
(a)
(b)
(c)
Fig. 5.
Simulation results with the GFC-2 configuration: (a) allowed cell rate, (b) bottleneck queue lengths, and (c) bottleneck link utilizations.
Fig. 6.
TCP + VBR configuration.
is bursty, i.e., it consists of active and idle periods. As the
TCP window size grows, the active periods become longer.
Assuming no packet losses, the TCP source eventually appears
to be the same as a persistent source, and its load is controlled
by network-assigned rates (rate-limited). The queues build up
when both demand variation and capacity variation exist in the
system. We use 100 sources and synchronize them such that
the load phases (idle and active periods) of multiple sources
coincide to create a worst case scenario.
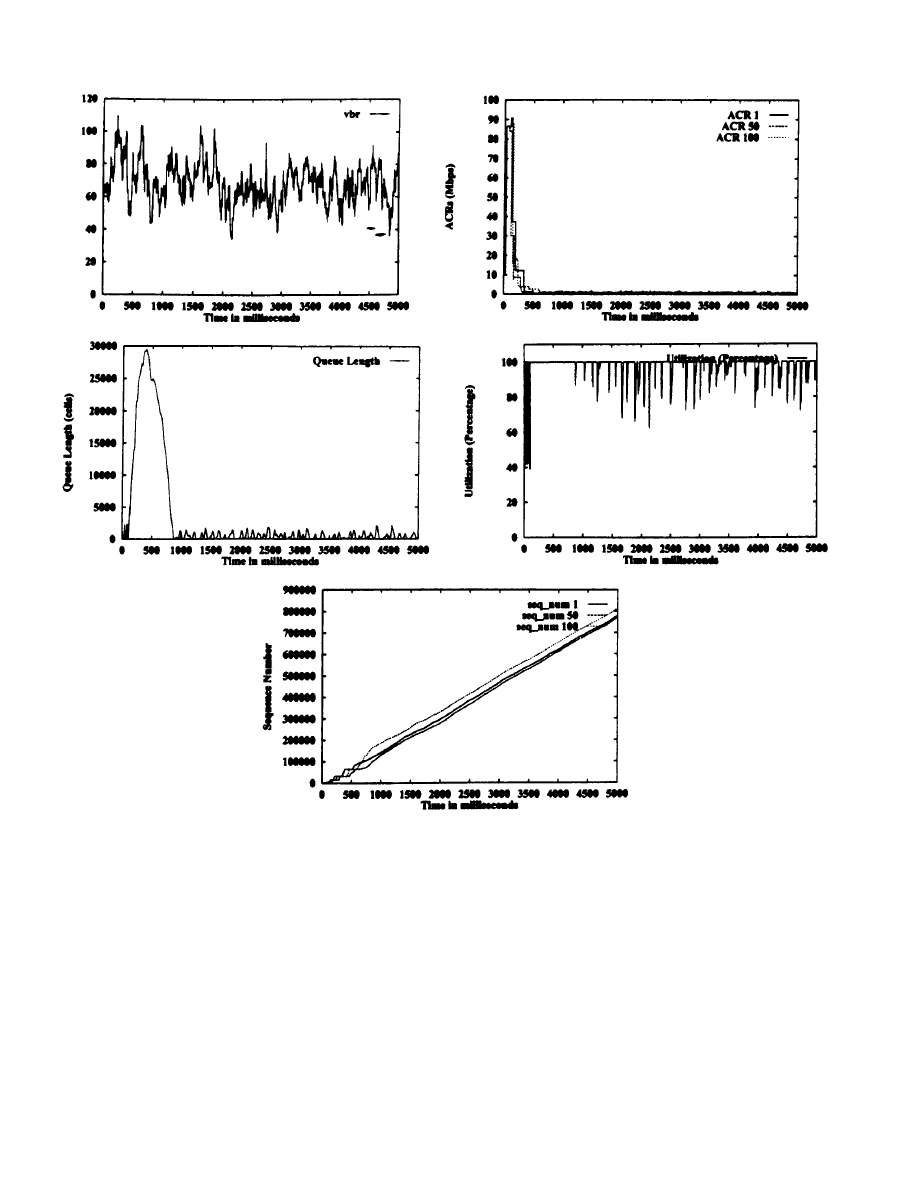
Fig. 7(b)–(d) show ATM level metrics (ACR’s of sources 1,
50, and 100; queue length at output port of switch 1; link utiliza-
tion of bottleneck link), while Fig. 7(e) and (f) show the TCP-
level metrics (congestion windows and sender sequence num-
bers of sources 1, 50, and 100). The graphs show that ERICA
successfully controls the TCP sources once they become rate-
limited. As a result, the buffer requirement at the bottleneck
is not a linear function of the number of sources. Though the
system does not have a steady state (VBR traffic is always vari-
able), ERICA controls the maximum and average queues and
keeps utilization high (consistent with the priorities assigned
in Section III-A). The congestion window and sender sequence
number graphs show that the allocations to contending sources
are fair despite the variation in load and capacity.
VII. C
ONCLUDING
R
EMARKS
In this paper, we have described the design and evaluation
of the ERICA switch algorithm for ATM ABR congestion con-
trol. We presented a simple switch model and explained design
goals. The key design goals are max–min fair steady-state op-
eration with controlled queueing delays, stability, and robust-
ness to variation in ABR load and capacity. We then presented
the ERICA algorithm, showing how the goals and simplicity re-
quirements determine every step in the algorithm.
The scheme requires that the switches periodically monitor
their load on each link and determine a load factor, the available
capacity, the queue length, and the number of currently active
virtual connections. This information is used to calculate a fair
and efficient allocation of the available bandwidth to all con-
tending sources. The measurement aspects that determine the
robustness of the algorithm are treated in depth.
A limited analysis of the convergence properties is given in
Appendix A. In addition, we present simulation results illus-
trating that the scheme meets the desired goals, including good
steady-state behavior (high utilization, controlled queueing
delay, max–min fairness), rapid convergence from network
transients, and robustness to load and capacity variations.
In conclusion, we note that the promise of explicit rate con-
trol is higher fidelity control in terms of a number of objectives
94
IEEE/ACM TRANSACTIONS ON NETWORKING, VOL. 8, NO. 1, FEBRUARY 2000
(a)
(b)
(c)
(d)
(e)
Fig. 7.
Simulation results with the 100 TCP and VBR configuration: (a) VBR rate, (b) allowed cell rate (ACR), (c) bottleneck queue length, (d) bottleneck link
utilization, and (e) TCP send sequence numbers.
(fairness, utilization, queueing delays). But the addition of prov-
able robustness as a goal, especially with the uncertainty in a large
number of parameter dimensions (like time delays, load, capacity,
number of active sources), and extension to multiple bottleneck
cases with independent controllers makes it a nontrivial control
problem. ERICA represents an engineering tradeoff.
A
PPENDIX
A
A
NALYTICAL
A
RGUMENT OF
C
ONVERGENCE TO
M
AX
–M
IN
F
AIRNESS
In this Appendix, we give a limited analytical argument
for the convergence of a single bottleneck node implementing
ERICA toward max–min fair rate allocations. Some model
assumptions in this argument are unrealistic, but they simplify
the analysis considerably. This section should be used only to
get further insights into the engineering decisions taken in the
ERICA algorithm. We have not published an extension of this
argument for a multiple-bottleneck system but are exploring it
under a new effort to cast such nonlinear rate-based algorithms
in a control-theoretic framework [24]. The general proof of
convergence, stability, and robustness (under assumptions of
multiple bottlenecks, queueing delay targets and asynchrony)
of rate-based algorithms is currently an open problem studied
by several researchers [24]–[27].
Our modeling assumptions are the following.
• There is only one bottleneck node.
KALYANARAMAN et al.: ERICA SWITCH ALGORITHM
95
• The “core” ERICA algorithm (defined in Section IV-B) is
used with two exceptions.
1) We ignore the effect of the queue control function.
2) We ignore the moderation step [(11)]
IF (ER
FairShare)
THEN ER
FairShare
• Sources are persistent (always have data to send), though
some (not all) might be source-bottlenecked at low rates.
• Round-trip times of various sources are different (the case
of equal round-trip times is a special case of this).
• The effect of any transient queueing between intervals is
ignored (unrealistic).
• Switch averaging interval is at least the twice the sum of
a) the largest RTT of any VC though the bottleneck, and b)
the maximum time required to see at least one RM cell of
every active source (maximum inter-RM cell time). This
means that measurements are reliable, and transient loads
caused by asynchrony can be ignored. We call such an
averaging interval a “cycle.”
• Load factor
ER
Link Rate, and for any source
CCR < Link Rate. The last condition is satisfied since
ATM signaling ensures that the “peak cell rate” (PCR)
parameter is never larger than any link rate along the path.
• Source-bottleneck behavior (if any) does not change
during the convergence period.
Notation:
• Rate of source in cycle
(CCR) is
.
• MaxAllocPrevious in cycle
is
.
• The ER for source
in cycle
is the same as the rate of
source in cycle
, i.e.,
.
•
= overload factor measured in th cycle (and used in
th cycle).
•
: Target ABR capacity of the bottleneck.
•
: Sum of the rates of bottlenecked sources, also equal to
.
•
: Number of active sources.
Definition: A source is said to be satisfied at a given rate if
it is bottlenecked elsewhere and cannot utilize higher rate allo-
cations.
To Prove: That for the system described above, the ERICA
algorithm causes it to converge toward max-min operation in at
most
number of cycles.
Proof: The proof methodology used here was proposed in
reference [12]. We first prove a set of safety (closure) properties,
which show that the system remains within a closed state space
. The closed state space
is
Then we prove a set of convergence properties, which show
that the system reaches and remains in a target state space,
.
The target convergence state space
is
AND Allocations are Max–Min fair
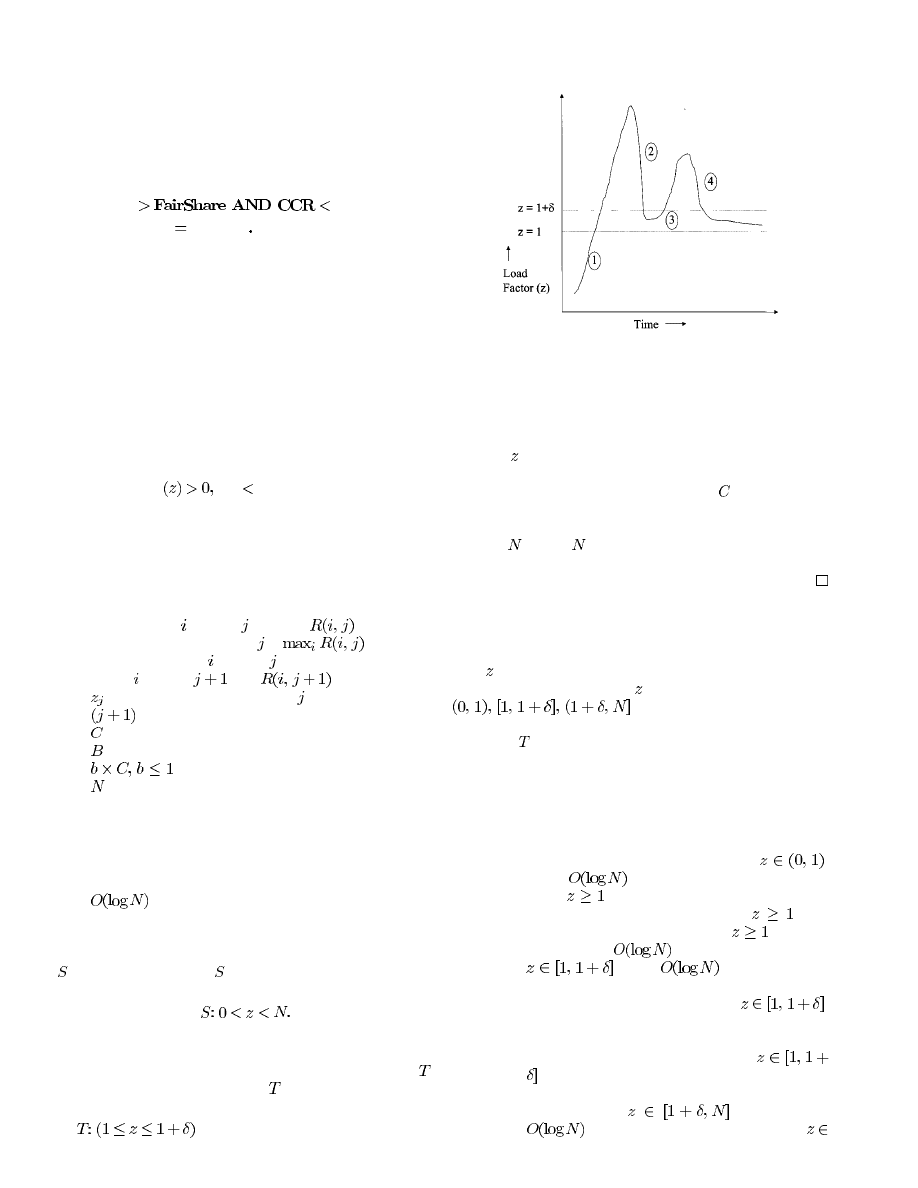
Fig. 8.
Movement of single bottleneck controlled by ERICA toward max–min
fairness.
where the term “Max–Min fair” implies that contending sources
are allocated the highest possible equal rates, satisfying the con-
dition on .
Closure Properties:
Lemma 0: Given that the maximum rate ( ) of any VC is at
most the target link rate (condition imposed during ATM sig-
naling and connection setup), the overload factor lies between
zero and
, where
is the number of VC’s set up (assumed
active).
Trivial based upon the assumptions.
Convergence Properties: Fig. 8 shows how ERICA con-
verges to max–min fairness under these model assumptions.
It should be noted that this convergence property is what
motivated the design of the components of the algorithm, based
upon
and FairShare.
Specifically, the load factor ( ) can fall into one of three zones
. The goal is to reach the second
zone while ensuring that the rate allocations are equal, i.e., the
state space
. The convergence unfolds in five stages as follows
(of which stages 1–4 are shown in the figure):
Stage 0) Irrespective of the initial rates, each source is given
a chance to reach FairShare (C/N) in one cycle
(Lemma 1).
Stage 1) Assuming stage 0 is the initialization of the algo-
rithm, if the bottleneck is in the zone:
,
within
cycles the system reaches a state
where
(Lemma 2).
Stage 2) Once the system is in a state where
, then
the switch remains in such a state
, and con-
verges within
cycles to the state where
within
steps. (Lemma 3,
parts A and B).
Stage 3) When the system is the state where
,
the contending sources get an equal rate allocation.
(Lemma 3, part C).
Stage 4) The system may now stay in the state
, in which case max–min fairness is achieved
(Lemma 3, Part C, Note 1). Alternatively it may
move to a state
, from where in
additional cycles it reaches the state
96
IEEE/ACM TRANSACTIONS ON NETWORKING, VOL. 8, NO. 1, FEBRUARY 2000
, but now since rate allocations are equal,
rate allocations are unchanged and max–min fair-
ness is achieved (Lemma 3, Part C, Note 1, and
Theorem 1).
The details of the proof are presented below.
Lemma 1: ERICA takes one cycle to satisfy sources bottle-
necked at rates below equal FairShare (
).
Proof: In every cycle, ERICA allocates at least FairShare
= “
” =
to every source. If there exist sources which
are bottlenecked such that they cannot utilize rate allocations
above
, the system satisfies such sources in one cycle. This
first cycle is called “initialization cycle” in what follows.
Note 1: During convergence, there is at most one initializa-
tion cycle for any configuration.
Note 2: After the VC’s below
are satisfied, the unused
capacity (if any) will be reflected in the value of the overload
factor,
(which is the ratio of the total load and the target ca-
pacity).
Note 3: The following lemmas assume that the initialization
cycle is completed, and that there is at least one “greedy” or
“unconstrained” source going through each bottleneck which
can utilize any bandwidth allocated to it.
Lemma 2: If a switch is underloaded, i.e.,
, then in
cycles, either the system converges to the target state
space,
, or the load factor increases to reach a value greater
than unity.
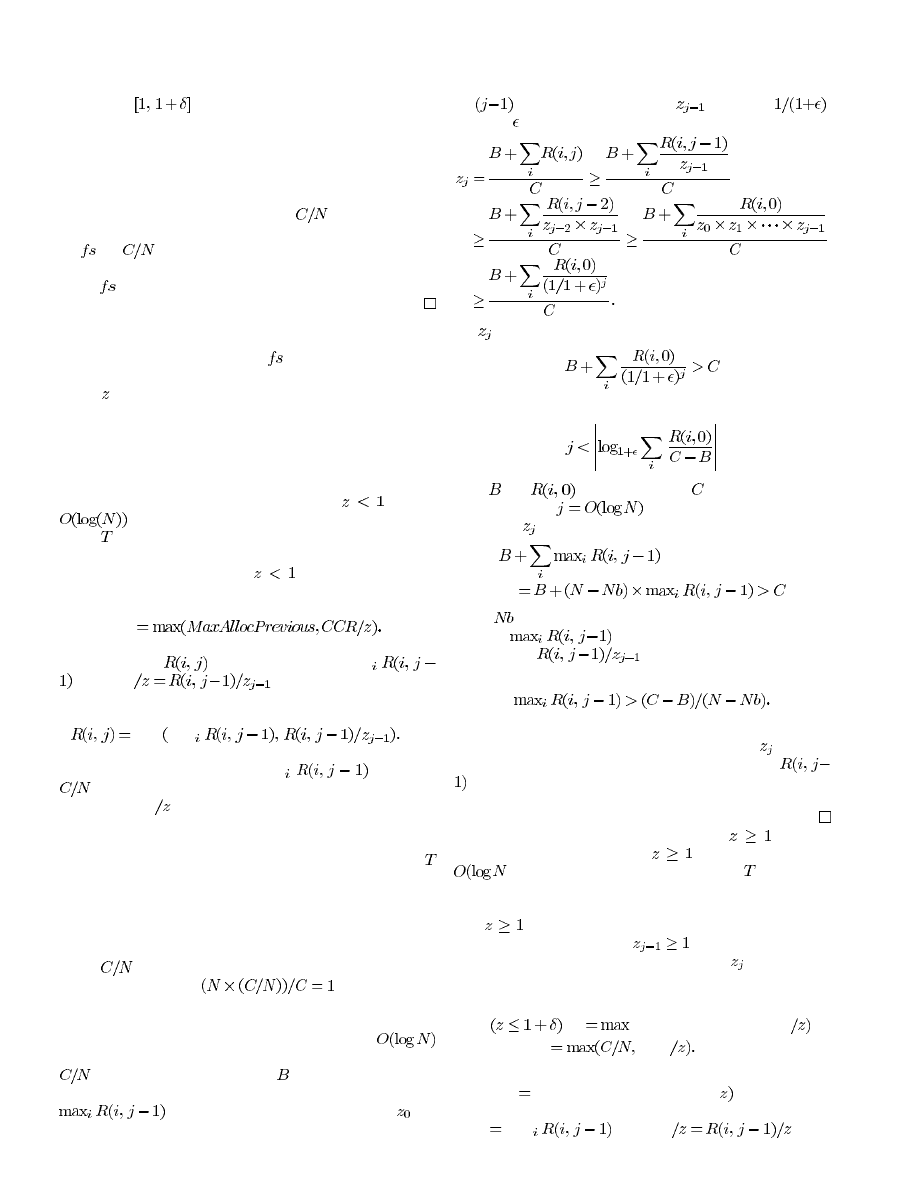
Proof: During underload (
), ERICA uses the fol-
lowing formula to allocate rates:
ER
Recall that ER =
, MaxAllocPrevious = Max
, and CCR
Hence, the ERICA formula
can be rephrased as
Max Max
(13)
Note that MaxAllocPrevious (Max
) is at least
(equal to the maximum of the allocations in the previous
cycle) and CCR
is greater than CCR. As a result, the alloca-
tion of every unsatisfied source increases.
If all sources are greedy and initially equal, the new load
factor is unity, with all sources equal. In this case the target
is achieved in a single cycle.
In the case that source rate allocations are unequal and/or
some sources are satisfied, the behavior of the system is dif-
ferent. Satisfied sources stay constant and the overload factor
increases in the next cycle. If all sources are greedy, they get a
rate of
in the first cycle. As a result, the new load factor is
at least load/capacity =
. In this case, the
load factor becomes greater than unity in a single cycle
We now show that even if the above special conditions do not
hold, the load factor becomes greater than unity in
cycles. Assume that some sources at bottlenecked at rates below
, and the sum of their rates is
. The remaining sources
get at least the maximum allocation of the previous cycle, i.e.,
. Starting from an initial load factor of
, the
system increases its load factor in every cycle. Assume that, in
the
st cycle the overload factor,
is less than
,
for small . Now
from (13)
For
to become greater than 1, it is sufficient that
i.e.,
since
and
are constants, and
is upper bounded by
the link capacity
in the worst case.
Note 1:
can also become greater than 1 when
where
is the number of bottlenecked sources. Here, we have
taken the
term in the ERICA step given in (13)
instead of the
term which is used in the above
proof. This new inequality reduces to:
Observe that the right-hand side of the above inequality is the
target max–min rate allocation, which means that
becomes
greater than unity in one cycle when any one of the rates
is greater than the final max–min allocation. Note that this
assumes that the moderation step (see list of assumptions) has
been ignored.
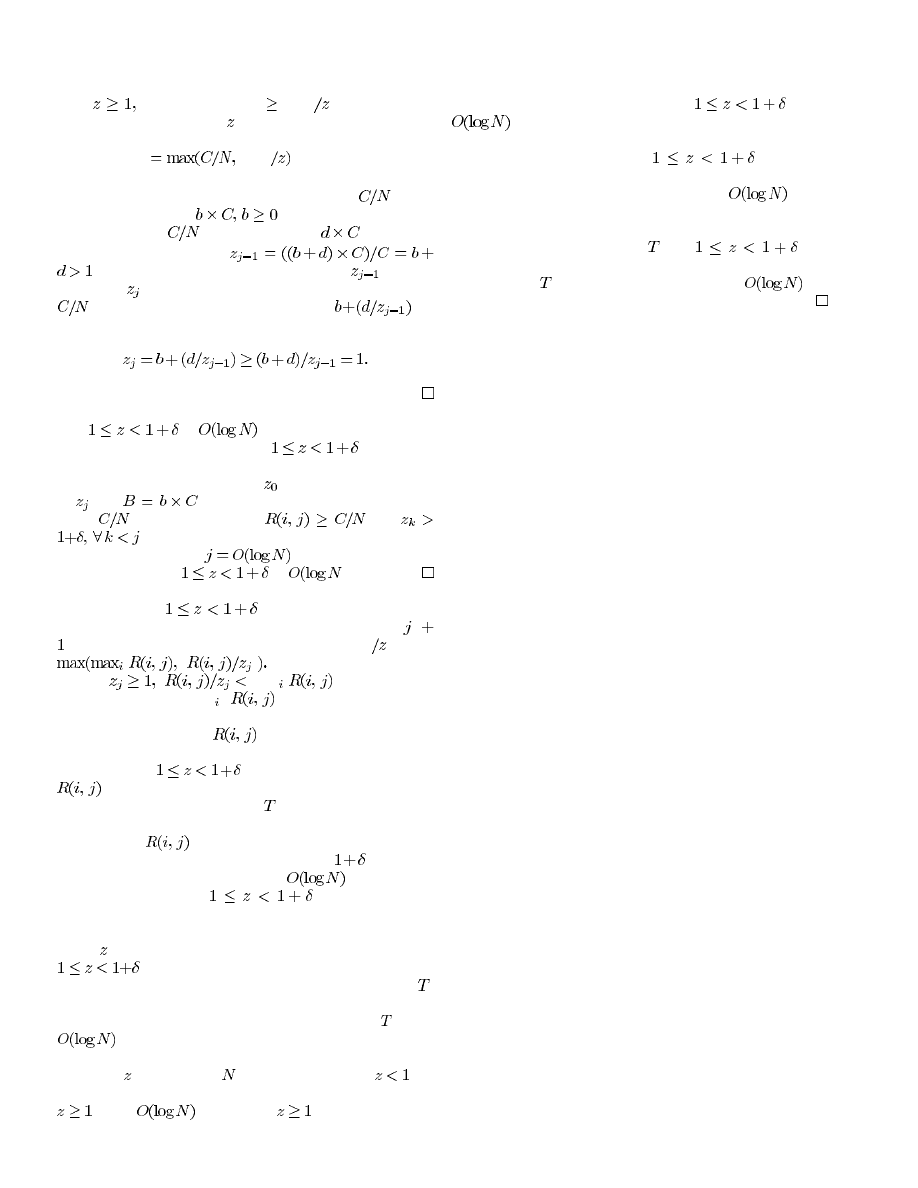
Lemma 3: If a switch is overloaded, i.e.,
, then the
switch remains overloaded, i.e.,
, and converges within
) cycles to the desired operating region
.
Proof: We split the proof into three parts.
Part A: We first prove that the system remains in the re-
gion
.
With the system starting at
, we show that the min-
imum value of the new load factor after a cycle
is greater than
or equal to unity.
The ERICA code segment used for this proof is
IF
ER
( MaxAllocPrevious, CCR
ELSE ER
CCR
We argue that the ER value obtained by the assignment state-
ment ER = Max( MaxAllocPrevious, CCR/
does not reduce
the load factor below its current value. Recall that MaxAllocPre-
vious
Max
and CCR
. Now,
KALYANARAMAN et al.: ERICA SWITCH ALGORITHM
97
since
MaxAllocPrevious
CCR
. As a result, this
term is not going to reduce . Therefore, we simply deal with
the second assignment statement in the ERICA code segment
above, i.e., ER
CCR
.
Split the set of sources into two categories:
1) sources bottlenecked at rates equal to or below
, which
have a total rate of
;
2) sources above
, with a total rate of
.
The current load factor is
. If all sources were to divide their rates by
, the new
load factor
would be unity. In our case, only sources above
reduce their rates. The new load factor is
. To
complete the proof of part A, note that
Part B: In the worst case, the system first reaches the re-
gion
in
cycles.
If the system is already in region
, the proof is
trivial.
Else, let the initial load factor be
and the current load factor
be
. Let
be the sum of bottlenecked rates at or
below
. The remaining rates
, and
. A technique similar to the one shown in Lemma 2
can be used to prove that
, i.e., the system reaches
the operating region
in
) cycles.
Part C: The contending sources get an equal rate alloca-
tion in the region
.
The ERICA allocation in this region (in the
th
cycle)
is:
Max(MaxAllocPrevious,
CCR
),
i.e.,
Since
Max
, and the ERICA
allocation is simply Max
for all sources. In other
words, the rate allocations to all sources in this region are equal.
Note 1: Observe that if
’s were already equal, the load
factor would be unchanged in subsequent cycles, i.e., the system
would remain at
, and rates of contending sources
are equalized, leading to max–min fair allocations. That
is, the system has reached the state,
, and stays in this state until
new input changes occur.
If the rates
are not equal before this “equalization
cycle,” the new load factor can be greater than
. As proved
in part B, the system requires at most
cycles to con-
verge to the state where
. However note that
at every cycle of this aforementioned convergence process, all
rate allocations remain equal since they are scaled by the same
factor ( ). This implies that the system has reached a state where
AND all rate allocations of unconstrained sources
are equal. But this state is the same as the target state space,
.
Theorem 1: From an arbitrary initial state, the ERICA algo-
rithm brings the system to the target operating region
within
cycles.
An arbitrary initial state can be characterized by a value of the
load factor
between 0 and
(closure, Lemma 0). If
, we
have shown in Lemma 2 that the system reaches a state where
within
cycles. Once
, we have shown that
the load factor does not reduce below unity (Lemma 3, part A).
Further, the system moves to the region
within
cycles (Lemma 3, part B) and the rates are equalized
in a single in this region (Lemma 3, part C). The system may
now remain stable in the region
, with equal
rates (i.e., max–min fair allocations), or move out of the region
and converge back and remain in this region in
cycles
with the rates being equal at every cycle during this convergence
process (Lemma 3, part C, note 1). This final region of stability
is in fact the target state space,
, i.e.,
, and
allocations are max–min fair. The maximum number of cycles
to converge to
from an arbitrary initial state is
.
R
EFERENCES
[1] ATM Forum Traffic Management. (1996, Apr.) The ATM Forum
Traffic Management Specification Version 4.0. [Online]. Available:
ftp://ftp.atmforum.com/pub/approved-specs/af-tm-0056.000.ps.
[2] L. Kalampoukas, A. Varma, and K. K. Ramakrishnan, “An efficient rate
allocation algorithm for ATM networks providing max–min fairness,”
in Proc. 6th IFIP Int. Conf. High Performance Networking, Sept. 1995.
[3] K. Siu and T. Tzeng, “Intelligent congestion control for ABR service
in ATM networks,” Comput. Commun. Rev., vol. 24, no. 5, pp. 81–106,
Oct. 1995.
[4] L. Roberts, “Enhanced PRCA (proportional rate-control algorithm,”,
Rep. AF-TM 94-0735R1, Aug. 1994.
[5] Y. Afek, Y. Mansour, and Z. Ostfeld, “Phantom: A simple and effective
flow control scheme,” in Proc. ACM SIGCOMM, Aug. 1996.
[6] D. Tsang and W. Wong, “A new rate-based switch algorithm for ABR
traffic to achieve max–min fairness with analytical approximation
and delay adjustment,” in Proc. IEEE INFOCOM, Mar. 1996, pp.
1174–1181.
[7] A. Charny, D. D. Clark, and R. Jain, “Congestion control with explicit
rate indication,” in Proc. ICC’95, Jun. 1995.
[8] A. Arulambalam, X. Chen, and N. Ansari, “Allocating fair rates for
available bit rate service in ATM networks,” IEEE Commun. Mag., vol.
34, no. 11, pp. 92–100, Nov. 1996.
[9] R. Jain, S. Kalyanaraman, and R. Viswanathan, “The OSU scheme for
congestion avoidance in ATM networks: Lessons learnt and extensions,”
Perform. Eval. J., vol. 31, pp. 1–2, Dec. 1997.
[10] S. Kalyanaraman, “Traffic management for the available bit rate (ABR)
service in asynchronous transfer mode (ATM) networks,” Ph.D. dis-
sertation, Dept. of Computer and Information Science, The Ohio State
Univ., Aug. 1997.
[11] R. Jain, S. Kalyanaraman, R. Viswanathan, R. Goyal, and S. Fahmy,
“ERICA—Explicit rate indication for congestion avoidance in ATM net-
works,” U.S. Patent 5 805 577, Sept. 8, 1998.
[12] A. Arora and M. Gouda, “Closure and convergence—A foundation
of fault-tolerant computing,” IEEE Trans. Software Eng., vol. 19, pp.
1015–1027, Oct. 1993.
[13] R. Jain, “Congestion control and traffic management in ATM networks:
Recent advances and a survey,” Comput. Networks ISDN Syst., Oct.
1996.
[14] R. Jain and K. K. Ramakrishnan, “Congestion avoidance in computer
networks with a connectionless network layer: Concepts, goals, and
methodology,” in Proc. IEEE Computer Networking Symp., Apr. 1988,
pp. 134–143.
[15] R. Jain, S. Kalyanaraman, S. Fahmy, and R. Goyal, “Source behavior for
ATM ABR traffic management: An explanation,” IEEE Commun. Mag.,
Nov. 1996.
[16] S. Kalyanaraman, R. Jain, S. Fahmy, R. Goyal, and J. Jiang,
“Performance of TCP over ABR on ATM backbone and with var-
ious VBR traffic patterns,” in Proc. ICC’97, Jun. 1997; see also
http://www.cis.ohio-state.edu/
∼
jain/papers/tcp_vbr.htm.
[17] R. Goyal, R. Jain, S. Kalyanaraman, S. Fahmy, B. Vandalore,
and S. Kota, “TCP selective acknowledgments and UBR drop
policies to improve ATM-UBR performance over terrestrial and
satellite networks,” in Proc. ICCCN’97, Sept. 1997; see also
http://www.cis.ohio-state.edu/
∼
jain/papers/ic3n97.htm.
[18] A. Romanov and S. Floyd, “Dynamics of TCP traffic over ATM net-
works,” IEEE J. Select. Areas Commun., vol. 13, May 1996.
98
IEEE/ACM TRANSACTIONS ON NETWORKING, VOL. 8, NO. 1, FEBRUARY 2000
[19] F. M. Chiussi, Y. Xia, and V. P. Kumar, “Dynamic max rate control al-
gorithm for available bit rate service in ATM networks,” in Proc. IEEE
Globecom, vol. 3, Nov. 1996, pp. 2108–2117.
[20] R. Goyal, X. Cai, R. Jain, S. Fahmy, and B. Vandalore, “Per-VC rate
allocation techniques for ATM-ABR virtual source virtual destination
networks,” in Proc. Globecom, Nov. 1998; see also http://www.cis.ohio-
state.edu/
∼
jain/papers/globecom98.htm.
[21] S. Fahmy, R. Jain, R. Goyal, B. Vandalore, S. Kalyanaraman,
S. Kota, and P. Samudra, “Feedback consolidation algorithms
for ABR point-to-multipoint connections in ATM networks,” in
Proc. IEEE Infocom, vol. 3, Apr. 1998, pp. 1004–1013; see also
http://www.cis.ohio-state.edu/
∼
jain/papers/cnsldt.htm.
[22] N. Plotkin and J. Sydir, “Behavior of multiple ABR flow control algo-
rithms operating concurrently within an ATM network,” in Proc. IEEE
Infocom, Apr. 1997.
[23] Q. Ma and K. K. Ramakrishnan, “Queue management for explicit rate
based congestion control,” in Proc. ACM Sigmetrics’97, Seattle, WA,
Jun. 1997, pp. 39–51.
[24] H. Özbay, S. Kalyanaraman, and A. ˙Iftar, “On rate-based congestion
control in high speed networks: Design of an
H based flow controller
for a single bottleneck,” in Proc. Amer. Control Conf., 1998; see also
http://www.ecse.rpi.edu/Homepages/shivkuma/.
[25] E. Altman, T. Basar , and R. Srikant, “Multi-user rate-based flow con-
trol with action delays: A team-theoretic approach,” in Proc. 36th Conf.
Decision and Control, Dec. 1997, pp. 2387–2392.
[26] L. Benmohamed and S. M. Meerkov, “Feedback control of congestion
in packet switching networks: The case of a single congested node,”
IEEE/ACM Trans. Networking, vol. 1, pp. 693–707, 1993.
[27] C. Rohrs and R. Berry, “A linear control approach to explicit rate feed-
back in ATM networks,” in Proc. INFOCOM ’97, Apr. 1997.
[28] R. Jain, The Art of Computer Systems Performance Analysis.
New
York: Wiley, 1991.
[29] B. Vandalore, R. Jain, R. Goyal, and S. Fahmy, “Design and analysis
of queue control functions for explicit rate switch schemes,” in Proc.
IC3N, Oct. 1998; see also http://www.cis.ohio-state.edu/
∼
jain/pa-
pers/qctrl_bv.htm.
[30] S. Kalyanaraman, R. Jain, S. Fahmy, R. Goyal, and B.. Vandalore, “An-
alytical arguments for the convergence of the ERICA switch algorithm
to max–min fairness: Single and multiple bottleneck cases,” Ohio State
Univ., Tech. Rep., 1998.
Shivkumar Kalyanaraman (S’95–A’97) received the B.Tech. degree from the
Indian Institute of Technology, Madras, in 1993 and the M.S. and Ph.D. de-
grees in computer and information sciences from The Ohio State University,
Columbus, in 1994 and 1997, respectively.
He is an Assistant Professor in the Department of Electrical, Computer and
Systems Engineering, Rensselaer Polytechnic Institute, Troy, NY. His research
interests include traffic management, multicast, Internet pricing, multimedia
networking, and performance analysis of distributed systems. He is a Coinventor
in two patents (the ERICA and OSU schemes for ATM traffic management). He
is a coauthor of several papers, IETF drafts, and ATM forum contributions.
Prof. Kalyanaraman is a member of the IEEE Computer Society and ACM.
Raj Jain (S’74–M’78–SM’86–F’93) received the
B.E. degree in electrical engineering from A.P.S.
University, Rewa, India, in 1972, the M.E. degree
in automation from the Indian Institute of Science,
Bangalore, in 1974, and the Ph.D. degree in com-
puter science from Harvard University, Cambridge,
MA, in 1978.
He is a Professor of computer and information sci-
ence at The Ohio State University, Columbus. He is
on the editorial boards of Computer Networks: The
International Journal of Computer and Telecommu-
nications Networking, Computer Communications (UK), Journal of High Speed
Networks (USA), and Mobile Networks and Applications. He is on the Board
of Directors of MED-I-PRO Systems, LLC, Pamona, CA, and on the Board of
Technical Advisors to Nexabit Networks Westboro, MA. He is also a Consul-
tant to several networking companies.
Prof. Jain is a Fellow of ACM. He was on the editorial board of IEEE/ACM
T
RANSACTIONS ON
N
ETWORKS
, was an ACM Lecturer, and was an IEEE Dis-
tinguished Visitor.
Sonia Fahmy (M’95) received the Ph.D. degree in computer and information
science from The Ohio State University, Columbus, in 1999.
She is an Assistant Professor in the Department of Computer Sciences,
Purdue University, West Lafayette, IN. Her primary research interests are in the
areas of network architectures and protocols, multicasting, traffic management,
and quality-of-service provision. She is the author of several journal and
conference papers and ATM Forum contributions.
Rohit Goyal received the B.S. degree in computer science from Denison Uni-
versity, Granville, OH, and the M.S. and Ph.D. degrees in computer and infor-
mation science from The Ohio State University, Columbus.
He is a Senior Software Engineer in the Core Routing Division of Lucent
Technologies InterNetworking Systems, formerly Nexabit Networks. His main
areas of interest are MPLS, traffic engineering, QoS, and traffic management.
He has several technical journal, conference, and standards publications in these
areas. He is an active member of the ATM Forum’s traffic management working
group and the Internet Engineering Task Force.
Bobby Vandalore received the B.Tech. degree from the Indian Institute of Tech-
nology, Madras, in 1993 and the M.S. degree from The Ohio State University,
Columbus, in 1995, both in computer science. He is currently pursuing the Ph.D.
degree at The Ohio State University.
His main research interests are in the areas of quality of service, multimedia
communications, traffic management, and performance analysis. He is the au-
thor of several journal and conference papers and ATM Forum contributions. He
is a student member of the ACM and the IEEE Communications and Computer
Societies.
Wyszukiwarka
Podobne podstrony:
Implement a QoS Algorithm for Real Time Applications in the DiffServ aware MPLS Network
exploring the social ledger negative relationship and negative assymetry in social networks in organ
Distributed Algorithm for the Layout of VP based ATM Networks
Applications and opportunities for ultrasound assisted extraction in the food industry — A review
76 1075 1088 The Effect of a Nitride Layer on the Texturability of Steels for Plastic Moulds
KasparovChess PDF Articles, Sergey Shipov The Best One Qualifies for the World Championship!
Development of wind turbine control algorithms for industrial use
The Creature as a Reflection for personal Self Destruction
the creature as a reflection for personal self destruction IPNHG57EKFZNLLEVY6OHQDUFE4SCWNGUDOTRKJY
The algorithm of solving differential equations in continuous model of tall buildings subjected to c
Programming (ebook PDF) Efficient Algorithms For Sorting and Synchronization
RES , Out of hospital airway management in the United States
Applications and opportunities for ultrasound assisted extraction in the food industry — A review
The Girl 02 The Girl Worth Fighting For Julia Goda
The Best Small Antennas For MW, LW, And SW rev 2
The Fiqh of Hajj for Women
The Sahara was ‘green’ for over 6,000 years and had 10 times more rain than now
więcej podobnych podstron