
Original article
Development of CoMFA and CoMSIA models of affinity and selectivity for
indole ligands of cannabinoid CB1 and CB2 receptors
Guilherme B.L. De Freitas
a
,
b
, Leandro L. da Silva
a
, Nelilma C. Romeiro
a
, Carlos A.M. Fraga
a
,
b
,
*
a
Laborato
´rio de Avaliaça
˜o e Sı´ntese de Substaˆncias Bioativas (LASSBio), Faculdade de Farma´cia, Universidade Federal do Rio de Janeiro (UFRJ), Rio de Janeiro, P.O. Box 68023,
Rio de Janeiro 21941-902, Brazil
b
Programa de Po
´s-Graduaça
˜o em Quı´mica, Instituto de Quı´mica, Universidade Federal do Rio de Janeiro (UFRJ), Rio de Janeiro, Rio de Janeiro 21941-909, Brazil
a r t i c l e
i n f o
Article history:
Received 5 August 2008
Received in revised form
17 December 2008
Accepted 15 January 2009
Available online 3 February 2009
Keywords:
Cannabinoid receptors
3D-QSAR
CoMFA selectivity model
CoMFA affinity model
CoMSIA
Indole ligands
CB1 receptor
CB2 receptor
a b s t r a c t
This paper describes CoMFA and CoMSIA studies for affinity and selectivity of a series of indole ligands to
cannabinoid CB1 and CB2 receptors. The developed models have proven to be predictive, with average q
2
of 0.675 and average r
2
of 0.855, demonstrating a good statistical validation. The obtained results have
helped us to understand the structural motifs that are responsible for the affinity and selectivity of some
of these derivatives towards each subtype of cannabinoid receptor and have demonstrated that the
exploited 3D-QSAR methods could be useful tools for the design of new safer analogues presenting better
affinity and selectivity profiles.
Ó
2009 Elsevier Masson SAS. All rights reserved.
1. Introduction
The emerging role of the lipid signaling endocannabinoid system
in the regulation of several central or peripheral physiological
functions has stimulated the search of new therapeutically useful
tools able to modulate it selectively at bioreceptor level, as agonists
or antagonists. At present, two cannabinoid receptor types, denoted
as CB1 and CB2, have been determined and the distinction between
them is based on the differences in their amino acid sequences, their
signaling mechanisms, and their tissue distribution
[1]
.
Recent publications have demonstrated that the orphan
receptor GPR55 responds to a similar series of fatty-acid ethano-
lamides and related compounds as do the cannabinoid receptors
[2,3]
. Regarding their distribution and functionality, CB1 receptors
are predominantly located in the central nervous system, and they
are probably responsible for most of the overt pharmacological
effects of cannabinoid ligands
[4–6]
. The CB2 receptor is found in
peripheral tissues, such as spleen, tonsils and immunocytes
[7]
.
Both CB1 and CB2 are seven-transmembrane (7TM) receptors
that belong to the rhodopsin-like family class A of G-protein
coupled receptors (GPCRs) and control a wide variety of multiple
intracellular signal transduction pathways. GPCRs are important
targets for drug discovery. Till date, over 30% of the clinically
marketed drugs are active at this receptor family. GPCRs are integral
membrane proteins that characteristically have seven R-helices
spanning a membrane bridged by three intracellular and three
extracellular loops
[8]
.
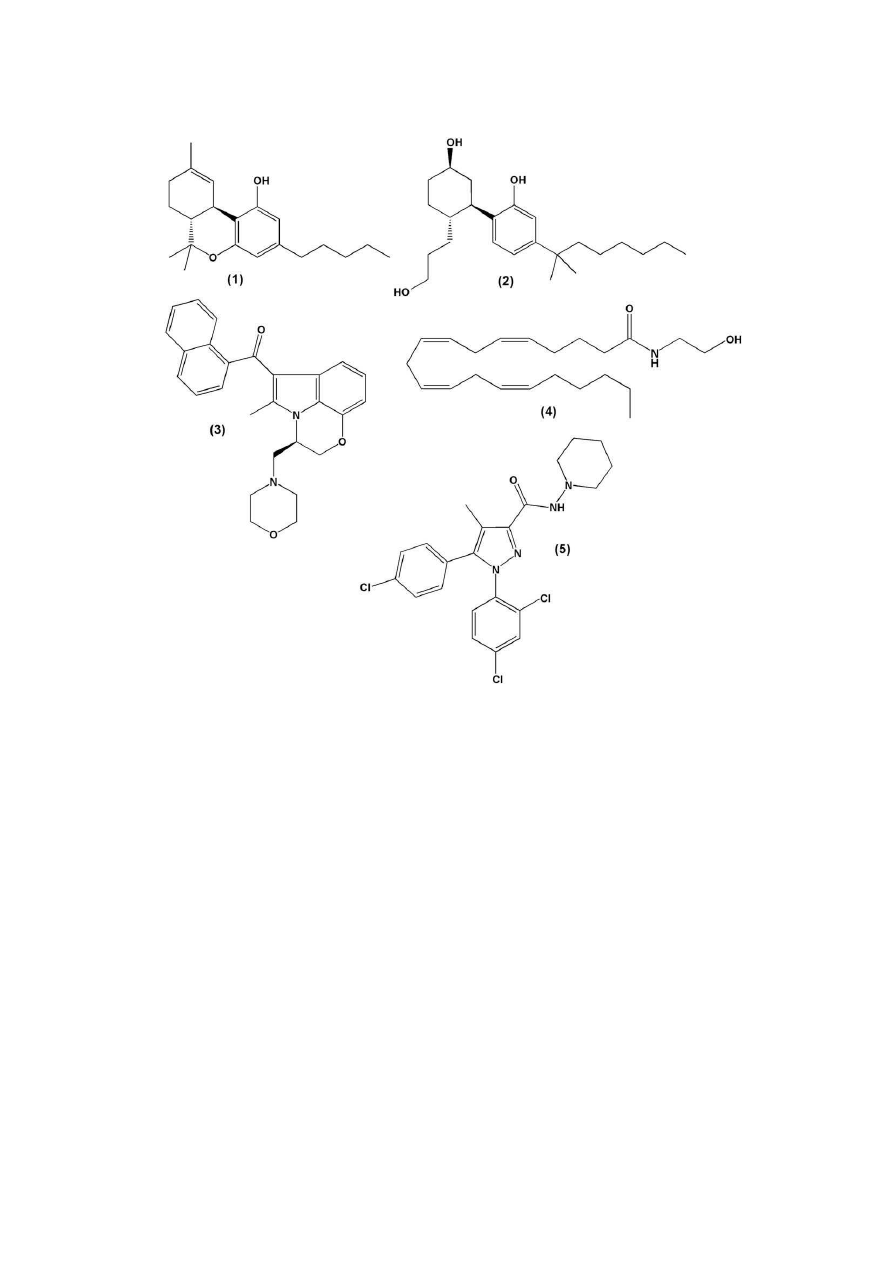
Cannabinoid receptor agonists can be divided into four struc-
turally distinct classes of compounds (
Fig. 1
). These include classical
cannabinoids, like
D
9
-tetrahydrocannabinol (
D
9
-THC, 1) as the
principal psychoactive constituent of marijuana, non-classical
cannabinoids developed by Pfizer, represented by DMH ¼ 1,1-
dimethylheptyl (CP-55,940, 2), aminoalkylindoles, such as WIN-
55,212-2 (3) considered to be the first example of this class of
cannabinoid receptor ligands, and endogenous cannabinoids such
as arachidonylethanolamide, also called anandamide (AEA, 4)
[9]
.
Both CB1 and CB2 agonists inhibit adenyl cyclase by activation of
a pertussis toxin-sensitive G-protein
[10]
. Moreover CB1 activation
inhibits some types of calcium channels and activates inwardly
* Corresponding author. Laborato´rio de Avaliaça˜o e Sı´ntese de Substaˆncias Bio-
ativas (LASSBio), Faculdade de Farma´cia, Universidade Federal do Rio de Janeiro
(UFRJ), Rio de Janeiro, P.O. Box 68023, RJ 21941-902, Brazil. Tel.: þ55 21 2562 6503;
fax: þ55 21 2562 6478.
E-mail address:
cmfraga@pharma.ufrj.br
(C.A.M. Fraga).
Contents lists available at
ScienceDirect
European Journal of Medicinal Chemistry
j o u r n a l h o m e p a g e : h t t p : / / w w w . e l s e v i e r . c o m / l o c a t e / e j m e c h
0223-5234/$ – see front matter Ó 2009 Elsevier Masson SAS. All rights reserved.
doi:10.1016/j.ejmech.2009.01.026
European Journal of Medicinal Chemistry 44 (2009) 2482–2496
rectifying potassium channels
[9,11]
. Cannabinoid agonists have
been suggested to have potential therapeutic uses as appetite
stimulants in wasting syndromes, as analgesics, as anti-emetics for
the attenuation of the nausea and vomiting in cancer chemo-
therapy, as antidiarrheals for decreased intestinal motility, as
antispasmodics for relief from muscle spasms/spasticity in multiple
sclerosis, as anti-proliferative agents of glioma growth, as anti-
glaucoma agents for reduction of intraocular pressure and as agents
for the treatment of diseases associated with inappropriate reten-
tion of aversive memories such as post-traumatic stress disorders
and phobias
[12–16]
. Untoward side effects accompanying canna-
binoid agonist therapeutic responses include alterations in cogni-
tion and memory, dysphoria/euphoria, and sedation
[17]
. During
the last decade there has been a growing interest towards the
modulation of the cannabinoid CB1 receptor. The identification of
CB1 cannabinoid receptor antagonists has been one of the major
advances in cannabinoid research, since the discovery of the first
cannabinoid receptor antagonist, rimonabant (SR-141716A) by
Sanofi in 1994
[18]
. Thus, the development of these ligands has
opened new therapeutic applications.
Aminoalkylindole (1) derivatives are structurally dissimilar
from other agonist classes, and site-directed mutagenesis has
revealed that the amino acids set important for their binding
differs significantly from those of the other classes of ligands,
indicating that the binding site of this kind of ligand is probably
different from the other agonists
[11]
. Regarding the CB1 receptor
more
specifically,
mutation
studies
have
reported
that
a K3.28(192)A mutation results in a greater loss in affinity for AEA
(4) and CP-55,940 (2), while the affinity of WIN-55,212-2 (3)
remains
unchanged
[19]
.
Additionally,
the
mutation
of
F3.36(191)A, W5.43(279)A, and W6.48(356)A in the CB1 receptor
determined a loss of affinity only for WIN-55,212-2 (3), whereas
the AEA (4) and CP-55,940 (2) affinities were unaffected
[20]
.
Regarding the CB2 receptor, Song and co-workers reported that
the mutation of F5.46(197)V determined a 14-fold decrease in CB2
affinity for WIN-55,212-2 (3), while the CP-55,940 (2) and AEA (4)
affinities were unaltered
[21]
.
The knowledge of the 3D structure of cannabinoid receptors
could be of great help in the task of understanding their func-
tion and in the rational design of specific and selective ligands.
So far, many computational 3D-QSAR
[22–31]
, homology
modeling and docking studies
[20–34]
with cannabinoid ligands
have been carried out on CB1 and CB2 receptors. Among the 3D-
QSAR studies described in the literature, there are models for
classic, non-classic, endocannabinoid, pyrazole and indole
ligands. Nevertheless, none of these studies have addressed
models of affinity and selectivity of ligands towards both
subtypes of receptors (CB1 and CB2) using 3D-QSAR methods.
According to Song et al.
[19,21]
and McAllister et al.
[20]
studies
the indole derivatives bind in a different place within the active
sites of CB1 and CB2 compared to the other classes of agonists
(classic cannabinoids, non-classic ligands and endocannabi-
noids). Following these results, in the present study, compara-
tive molecular field analysis (CoMFA) and comparative
Fig. 1.
Molecular structures of representative cannabinoid agonists (1–4) and antagonist (5).
G.B.L. De Freitas et al. / European Journal of Medicinal Chemistry 44 (2009) 2482–2496
2483
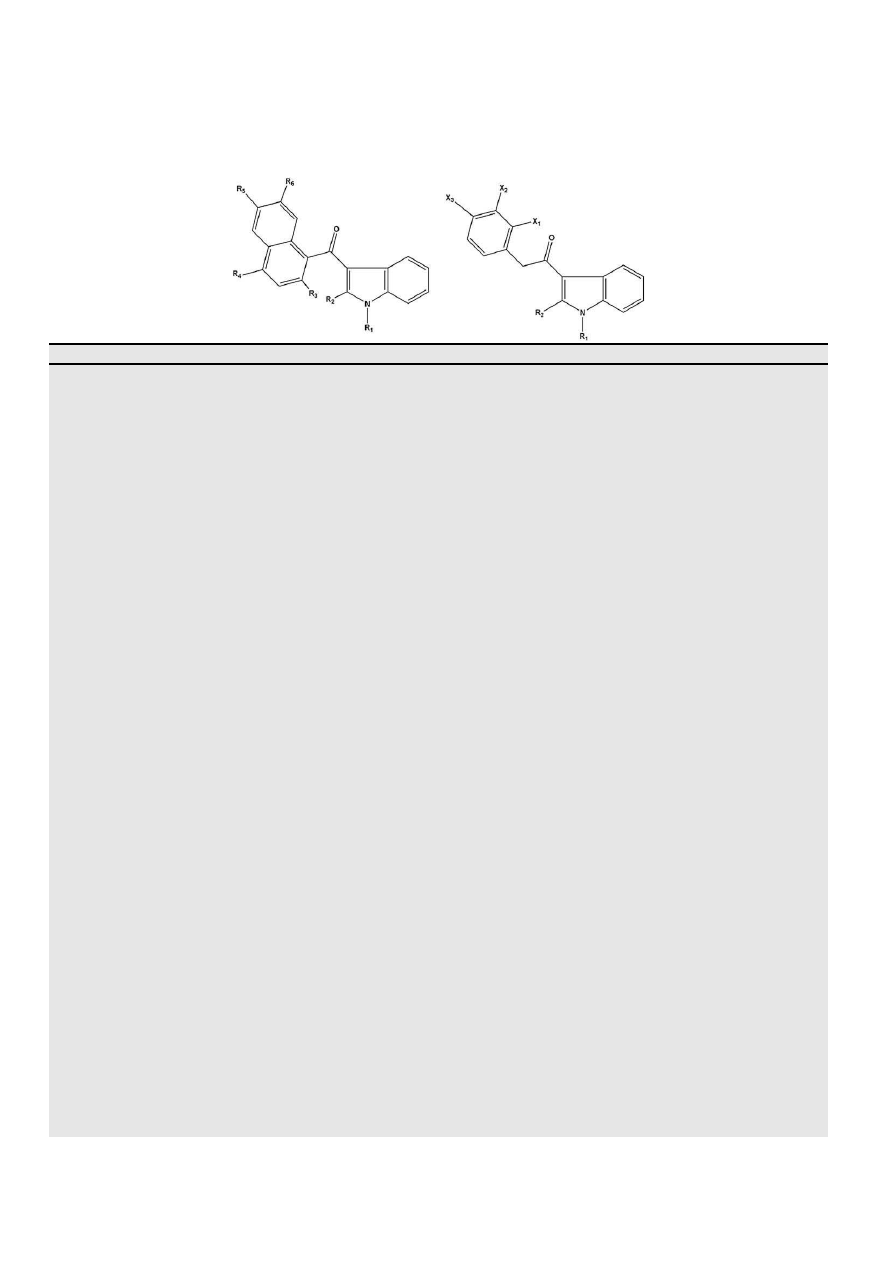
Table 1
Molecular structures, binding affinity (pKi) and CB1/CB2 pKi ratio of indole analogues used in the construction of CoMFA and CoMSIA models. The molecules used as test set are
highlighted with an asterisk (*).
Compound
R
1
R
2
R
3
R
4
R
5
R
6
X
1
X
2
X
3
CB1
CB2
CB1/CB2 pKi ratio
1
) JWH-007
n
C
5
H
11
CH
3
H
H
H
H
–
–
–
8.022
8.538
0.940
2
) JWH-015
n
C
3
H
7
CH
3
H
H
H
H
–
–
–
6.785
7.860
0.863
3
) JWH-018*
n
C
5
H
11
H
H
H
H
H
–
–
–
8.045
8.538
0.942
4
) JWH-046
n
C
3
H
7
CH
3
H
H
H
CH
3
–
–
–
6.464
7.796
0.829
5
) JWH-048
n
C
5
H
11
CH
3
H
H
H
CH
3
–
–
–
7.970
9.310
0.856
6
) JWH-072
n
C
3
H
7
H
H
H
H
H
–
–
–
5.978
6.770
0.883
7
) JWH-076
n
C
3
H
7
H
H
H
H
CH
3
–
–
–
6.669
6.975
0.956
8
) JWH-079
n
C
3
H
7
H
H
OCH
3
H
H
–
–
–
7.200
7.495
0.961
9
) JWH-081
n
C
5
H
11
H
H
OCH
3
H
H
–
–
–
8.920
7.907
1.128
10
) JWH-094
n
C
3
H
7
CH
3
H
OCH
3
H
H
–
–
–
6.322
7.013
0.901
11
) JWH-098
n
C
5
H
11
CH
3
H
OCH
3
H
H
–
–
–
8.346
8.721
0.957
12
) JWH-120
n
C
3
H
7
H
H
CH
3
H
H
–
–
–
5.977
8.215
0.728
13
) JWH-122
n
C
5
H
11
H
H
CH
3
H
H
–
–
–
9.161
8.921
1.027
14
) JWH-148
n
C
3
H
7
CH
3
H
CH
3
H
H
–
–
–
6.910
7.854
0.880
15
) JWH-149*
n
C
5
H
11
CH
3
H
CH
3
H
H
–
–
–
8.301
9.137
0.909
16
) JWH-153*
n
C
5
H
11
CH
3
H
H
OCH
3
H
–
–
–
6.602
7.959
0.830
17
) JWH-159
n
C
5
H
11
CH
3
H
H
H
OCH
3
–
–
–
7.346
7.983
0.920
18
) JWH-160
n
C
3
H
7
CH
3
H
H
H
OCH
3
–
–
–
5.804
6.356
0.913
19
) JWH-163
n
C
3
H
7
H
H
H
OCH
3
H
–
–
–
5.627
6.860
0.820
20
) JWH-164
n
C
5
H
11
H
H
H
H
OCH
3
–
–
–
8.180
8.161
1.002
21
) JWH-165
n
C
3
H
7
H
H
H
H
OCH
3
–
–
–
6.690
7.149
0.936
22
) JWH-166*
n
C
5
H
11
H
H
H
OCH
3
H
–
–
–
7.356
8.721
0.843
23
) JWH-180
n
C
3
H
7
H
H
n
C
3
H
7
H
H
–
–
–
7.585
8.018
0.946
24
) JWH-181
n
C
5
H
11
CH
3
H
n
C
3
H
7
H
H
–
–
–
8.886
9.208
0.965
25
) JWH-182*
n
C
5
H
11
H
H
n
C
3
H
7
H
H
–
–
–
9.187
8.959
1.025
26
) JWH-189
n
C
3
H
7
CH
3
H
n
C
3
H
7
H
H
–
–
–
7.283
7.921
0.919
27
) JWH-210
n
C
5
H
11
H
H
C
2
H
5
H
H
–
–
–
9.337
9.161
1.019
28
) JWH-211
n
C
3
H
7
CH
3
H
C
2
H
5
H
H
–
–
–
7.154
7.921
0.903
29
) JWH-212
n
C
3
H
7
H
H
C
2
H
5
H
H
–
–
–
7.481
8.000
0.935
30
) JWH-213
n
C
5
H
11
CH
3
H
C
2
H
5
H
H
–
–
–
8.823
9.377
0.941
31
) JWH-234
n
C
5
H
11
H
H
H
H
C
2
H
5
–
–
–
8.075
8.420
0.959
32
) JWH-235
n
C
3
H
7
H
H
H
H
C
2
H
5
–
–
–
6.471
6.910
0.936
33
) JWH-236
n
C
3
H
7
CH
3
H
H
H
C
2
H
5
–
–
–
5.869
6.620
0.887
34
) JWH-239
n
C
3
H
7
H
H
n
C
4
H
9
H
H
–
–
–
6.465
7.284
0.888
35
) JWH-240
n
C
5
H
11
H
H
n
C
4
H
9
H
H
–
–
–
7.853
8.143
0.964
36
) JWH-241
n
C
3
H
7
CH
3
H
n
C
4
H
9
H
H
–
–
–
6.832
7.310
0.935
37
) JWH-242
n
C
5
H
11
CH
3
H
n
C
4
H
9
H
H
–
–
–
7.376
8.187
0.901
38
) JWH-258
n
C
5
H
11
H
H
OC
2
H
5
H
H
–
–
–
8.337
7.979
1.045
39
) JWH-259*
n
C
3
H
7
H
H
OC
2
H
5
H
H
–
–
–
6.657
7.131
0.934
40
) JWH-260
n
C
5
H
11
CH
3
H
OC
2
H
5
H
H
–
–
–
7.537
7.602
0.991
41
) JWH-261
n
C
3
H
7
CH
3
H
OC
2
H
5
H
H
–
–
–
6.115
6.656
0.919
42
) JWH-262
n
C
5
H
11
CH
3
H
H
H
C
2
H
5
–
–
–
7.552
8.252
0.915
43
) JWH-265
n
C
3
H
7
H
OCH
3
H
H
H
–
–
–
5.421
7.097
0.764
44
) JWH-267
n
C
5
H
11
H
OCH
3
H
H
H
–
–
–
6.419
8.143
0.788
45
) JWH-268*
n
C
5
H
11
CH
3
OCH
3
H
H
H
–
–
–
5.860
7.398
0.792
46
) JWH-167
n
C
5
H
11
H
–
–
–
–
H
H
H
7.045
6.799
1.036
47
) JWH-201
n
C
5
H
11
H
–
–
–
–
H
H
OCH
3
5.973
6.352
0.940
48
) JWH-202*
n
C
5
H
11
CH
3
–
–
–
–
H
H
OCH
3
5.775
6.190
0.933
49
) JWH-203
n
C
5
H
11
H
–
–
–
–
Cl
H
H
8.096
8.154
0.993
50
) JWH-204
n
C
5
H
11
CH
3
–
–
–
–
Cl
H
H
7.886
7.602
1.037
51
) JWH-205*
n
C
5
H
11
CH
3
–
–
–
–
H
H
H
6.906
6.744
1.024
52
) JWH-206*
n
C
5
H
11
H
–
–
–
–
H
H
Cl
6.410
6.302
1.017
53
) JWH-207
n
C
5
H
11
CH
3
–
–
–
–
H
H
Cl
5.796
5.429
1.068
54
) JWH-208
n
C
5
H
11
H
–
–
–
–
H
H
CH
3
6.747
6.244
1.081
55
) JWH-209
n
C
5
H
11
CH
3
–
–
–
–
H
H
CH
3
6.127
5.868
1.044
56
) JWH-237
n
C
5
H
11
H
–
–
–
–
H
Cl
H
7.420
6.974
1.064
57
) JWH-248*
n
C
5
H
11
H
–
–
–
–
H
H
Br
5.988
6.182
0.969
58
) JWH-249
n
C
5
H
11
H
–
–
–
–
Br
H
H
8.075
7.698
1.049
59
) JWH-250
n
C
5
H
11
H
–
–
–
–
OCH
3
H
H
7.958
7.481
1.064
60
) JWH-251
n
C
5
H
11
H
–
–
–
–
CH
3
H
H
7.537
6.835
1.103
G.B.L. De Freitas et al. / European Journal of Medicinal Chemistry 44 (2009) 2482–2496
2484
molecular similarity indices analysis (CoMSIA) 3D-QSAR models
of affinity and selectivity of a series of indole ligands for the
cannabinoid receptors CB1 and CB2 were built and refined. The
developed 3D-QSAR models correlate variations in the affinity
and selectivity for both subtypes of receptors using 71 indole
derivatives previously described in the literature
[35–37]
.
2. Methods
2.1. Data set selection
The data set used in this study was chosen from a series of
ligands with both CB1 and CB2 receptor affinities. Literature was
reviewed and we selected only those publications where the
binding affinity of these compounds was measured by pharmaco-
logical protocols with the same radioligand, the non-classical
cannabinoid, CP-55,940 (2). However CB1 was tested in homoge-
nates of rat brain
[38]
and CB2 in preparations of cloned human
receptors
[39]
. The structurally related indole analogues selected to
compose our database could be split into two groups, those pre-
senting a substituted naphthyl
a
-carbonyl group attached to posi-
tion 3 of the heterocyclic ring (
Table 1
) and some simplified
analogues presenting substituted benzylcarbonyl groups at C-3
(
Table 1
). The affinity of all the 71 compounds used in this study
was measured as Ki and was expressed in negative logarithmic
units, log Ki or pKi (
Table 1
). The training and the test sets rep-
resented by 56 and 15 compounds (
Table 1
), respectively, were
selected randomly
[35–37]
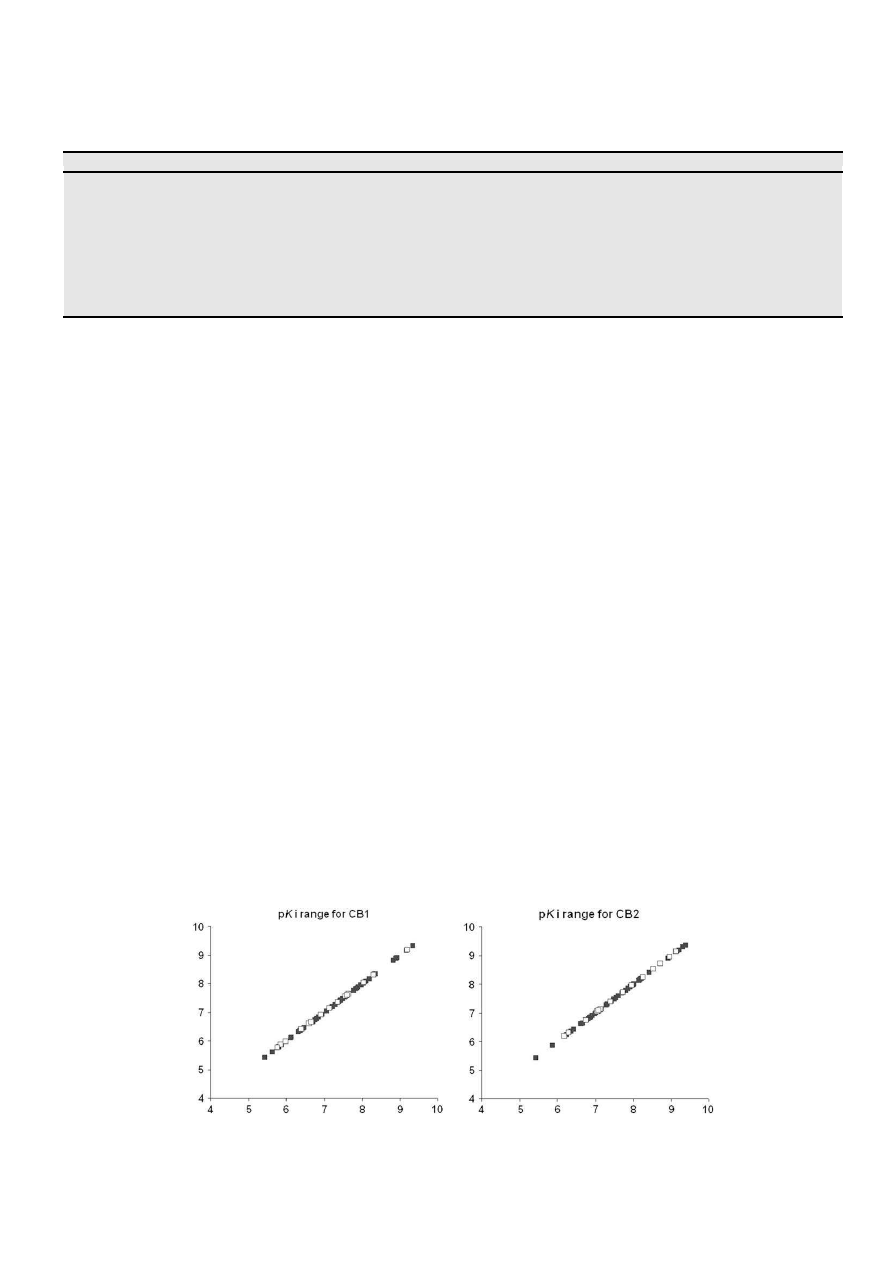
, and the distribution of CB1 and CB2 pKi
values for the training and test sets is shown in
Fig. 2
. The elected
indole ligands showed good structural variation and affinities (pKi)
ranging from 5.627 to 9.376 and 5.429 to 9.376 (
Fig. 2
) for the CB1
and CB2 receptors, respectively, making them suitable for 3D-QSAR
studies.
2.2. Molecular modeling
2.2.1. General procedures
Initially, the structures were built using PC Spartan Pro 1.0 for
Windows XP
[40]
, and the conformer distribution of each one was
calculated by molecular mechanics with the Merck molecular force
field (MMFF)
[41]
. Subsequently, the lowest-energy conformation
found for each structure was submitted to optimization with the
semi empirical AM1 method. This energy was then compared with
that obtained from the conformation previously described in the
literature
[32,20]
as the bioactive conformation, using the single
point energy by AM1. 3D-QSAR studies were performed using
SYBYL software version 7.3
[42]
. For further calculations with
CoMFA/CoMSIA, Gasteiger–Hu¨ckel charges were also assigned to all
molecules using SYBYL.
2.3. Alignment of molecules
One of the most important adjustable parameters in CoMFA is
the relative alignment of all the compounds to one another so that
they have a comparable conformation and a similar orientation of
pharmacophoric groups in space. In agreement to Akamatsu’s
guidelines
[43]
the proposed alignment for the studied compounds
has been done following their common pharmacophores. In this
study, the most active molecule of the database (JWH-210, 27) was
used as a template for superimposition, assuming that its bioactive
conformation represents the most probable conformation of the
indole analogues at the putative receptor
[32,20]
. Two atom-based
alignments were manually carried out using the Fit Atoms tool in
SYBYL 7.3 software. (a) Alignment 1: atoms 1, 3 and 5 of the indole
ring, the carbonylic carbon and atom 1
0
of the naphthyl ring were
selected and highlighted (
Fig. 3
); (b) Alignment 2: 7 atoms were
selected for the alignment of all compounds. These atoms are also
Table 1
(continued )
Compound
R
1
R
2
R
3
R
4
R
5
R
6
X
1
X
2
X
3
CB1
CB2
CB1/CB2 pKi ratio
61
) JWH-252*
n
C
5
H
11
CH
3
–
–
–
–
CH
3
H
H
7.638
7.721
0.989
62
) JWH-253
n
C
5
H
11
CH
3
–
–
–
–
H
OCH
3
H
7.207
7.075
1.019
63
) JWH-302
n
C
5
H
11
H
–
–
–
–
H
OCH
3
H
7.769
7.050
1.102
64
) JWH-303
n
C
5
H
11
CH
3
–
–
–
–
H
Cl
H
6.931
6.860
1.010
65
) JWH-305
n
C
5
H
11
CH
3
–
–
–
–
Br
H
H
7.823
7.537
1.038
66
) JWH-306*
n
C
5
H
11
CH
3
–
–
–
–
OCH
3
H
H
7.602
7.086
1.073
67
) JWH-311
n
C
5
H
11
H
–
–
–
–
F
H
H
7.638
7.408
1.031
68
) JWH-312*
n
C
5
H
11
H
–
–
–
–
H
F
H
7.142
7.040
1.014
69
) JWH-313
n
C
5
H
11
H
–
–
–
–
H
H
F
6.374
6.437
0.990
70
) JWH-314
n
C
5
H
11
CH
3
–
–
–
–
F
H
H
7.408
7.119
1.041
71
) JWH-315
n
C
5
H
11
CH
3
–
–
–
–
H
F
H
6.366
6.739
0.945
Fig. 2.
Distribution of binding affinity (pKi) values of the molecules used to compose the training and the test sets for CB1 and CB2 receptors. The 56 compounds elected as training
set are highlighted in black and the 15 compounds used as test set are highlighted in white.
G.B.L. De Freitas et al. / European Journal of Medicinal Chemistry 44 (2009) 2482–2496
2485
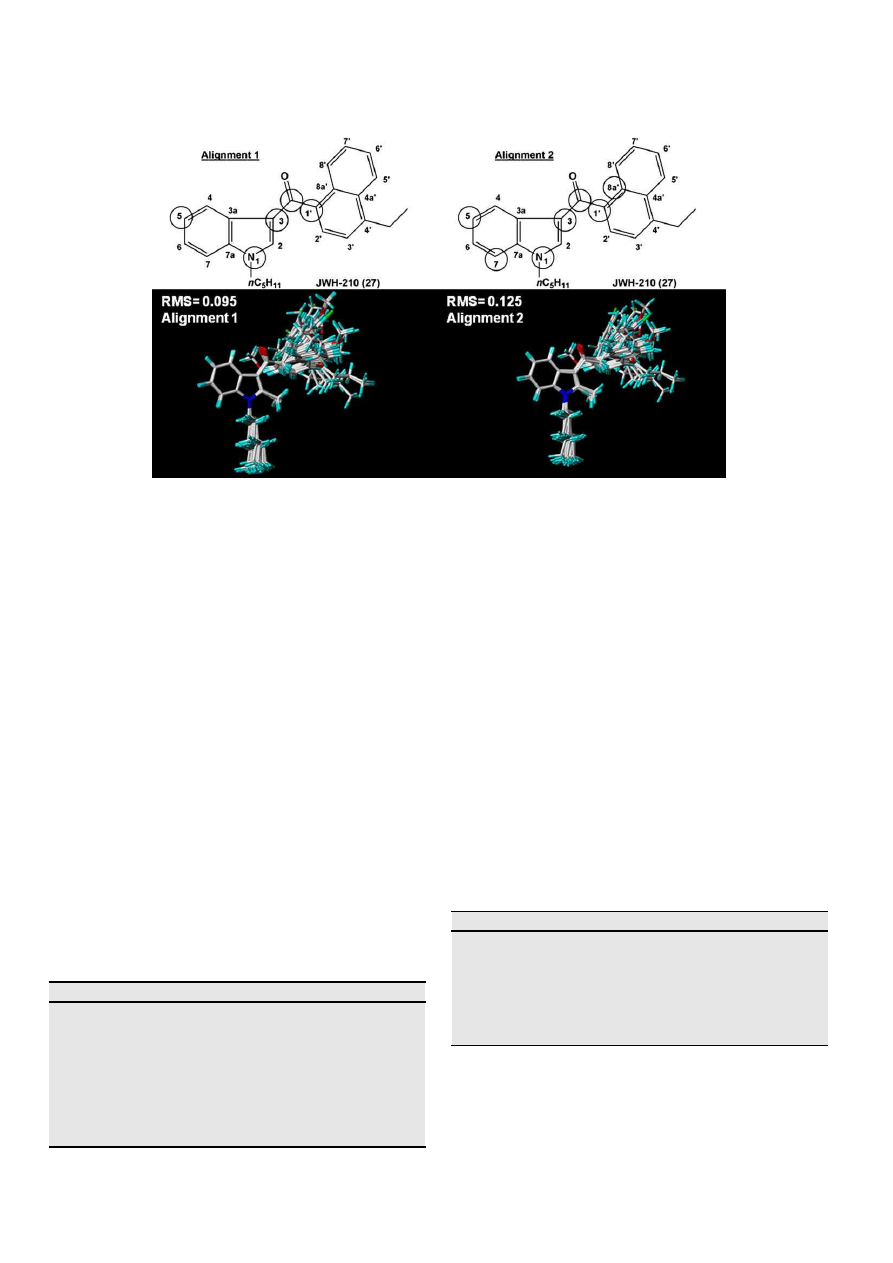
highlighted in
Fig. 3
and include not only atoms previously selected
for the alignment 1 but also atoms 7 and 8a
0
of the indole and
naphthyl rings, respectively. JWH-210 (27) was used as the refer-
ence compound for atom numbering (
Table 1
) and its graphical
representation depicts the best root-mean-square (RMS) value
obtained with alignment 1, which justifies its use in the study.
2.4. CoMFA studies
CoMFA studies were performed with the QSAR module of SYBYL
7.3 program for each combination of steric and electrostatic
molecular fields, which were sampled at each point of regularly
spaced grids of 1.0, 1.5, and 2.0 Å. The steric and electrostatic fields
were calculated using the default probe, an sp
3
carbon atom with
a charge of þ1. CoMFA calculates steric fields using a Lennard-Jones
potential and electrostatic field using a Coulomb potential
[44]
.
Different cutoff combinations of the steric and electrostatic fields
were tested (
Table 2
).
2.5. CoMSIA studies
In the CoMSIA methodology, the alignment that generated
the most predictive CoMFA models was used. Also, five physico-
chemical properties, k (steric, electrostatic, hydrophobic, and
hydrogen-bond donor and acceptor) were evaluated using
a Gaussian function. The steric/electrostatic, hydrophobic,
hydrogen-bond donor and acceptor contributions were calculated
separately. The attenuation factor was set at the default value
of 0.3.
2.6. PLS analysis
CoMFA field values for the training set were correlated with
affinity (pKi) and selectivity (CB1/CB2 or CB2/CB1 pKi ratio) values
using PLS. The optimum number of components to use was
determined by leave-one-out cross-validation (LOO)
[41]
using
a maximum of 10 principal components for each response at
a time. To avoid over fitted 3D-QSAR, the optimum number of
components (N) used in the model derivation was chosen from
the analysis with the highest q
2
value for the training set. This
procedure speeds up analysis and reduces noise. In the above
stage, the robustness of the ‘best’ correlation model was
determined.
Fig. 3.
Atom definition and superposition of the indole analogues following alignments 1 and 2.
Table 2
Different cutoff combinations of the steric and electrostatic fields applied in the
development of the 3D-QSAR models for indole ligands of cannabinoid receptors.
Steric (kcal mol
1
)
Electrostatic (kcal mol
1
)
30.00
30.00
35.00
30.00
30.00
35.00
25.00
30.00
30.00
25.00
20.00
30.00
30.00
20.00
25.00
35.00
35.00
25.00
40.00
30.00
30.00
40.00
Table 3
Statistical results for the best CoMFA and CoMSIA models of affinity towards CB1 and
CB2 receptors obtained for the training set and test set.
q
2
a
N
b
SEP
c
r
2
d
SEE
e
F
f
r
2
pred
g
CB1
CoMFA std
0.785 6
0.472
0.926 0.276 102.532 0.909
CoMSIA steric þ electrostatic 0.743 7
0.521
0.908 0.312
67.681 0.820
CoMSIA hydrophobic
0.716 6
0.554
0.907 0.317
57.230 0.406
CB2
CoMFA std
0.751 6
0.455
0.898 0.293
71.707 0.901
CoMSIA steric þ electrostatic 0.755 5
0. 449 0.869 0.328
66.452 0.812
CoMSIA hydrophobic
0.713 5
0.486
0.868 0.329
65.998 0.782
a
Cross-validation correlation coefficient.
b
Number of components.
c
Standard error of prediction.
d
Correlation coefficient.
e
Standard error of estimation.
f
F
-ratio.
g
Correlation coefficient between the observed and predictive activities of the test
set.
G.B.L. De Freitas et al. / European Journal of Medicinal Chemistry 44 (2009) 2482–2496
2486

Table 4
Observed and predicted binding affinity values, given in pKi (pKi ¼ log [Ki]) obtained by applying the CoMFA (steric/electrostatic) and CoMSIA (hydrophobic) models for
cannabinoid CB1 and CB2 receptor ligands and the difference between the observed versus CoMFA and CoMSIA predicted binding affinity values towards CB1 and CB2 receptors.
Compound
a
CB1
a
CB1
d
CB1
c
CB1
e
CB1
a
CB2
b
CB2
d
CB2
c
CB2
a
CB2
1
) JWH-007
8.022
7.819
0.203
7.952
0.070
8.538
8.559
0.021
8.619
0.081
2
) JWH-015
6.785
6.087
0.698
6.265
0.520
7.860
7.244
0.616
7.378
0.482
3
) JWH-018
*
8.045
8.242
0.197
8.417
0.372
8.538
8.510
0.028
8.683
0.145
4
) JWH-046
6.464
6.153
0.311
6.229
0.235
7.796
7.462
0.334
7.291
0.505
5
) JWH-048
7.970
7.886
0.084
7.917
0.053
9.310
8.777
0.533
8.533
0.777
6
) JWH-072
5.978
6.510
0.532
6.730
0.752
6.770
7.195
0.425
7.441
0.671
7
) JWH-076
6.669
6.576
0.093
6.694
0.025
6.975
7.416
0.441
7.355
0.380
8
) JWH-079
7.200
7.170
0.030
6.861
0.339
7.495
7.091
0.404
7.052
0.443
9
) JWH-081
8.920
8.903
0.017
8.549
0.371
7.907
8.406
0.499
8.294
0.387
10
) JWH-094
6.322
6.486
0.164
6.314
0.008
7.013
7.086
0.073
6.995
0.018
11
) JWH-098
8.346
8.229
0.117
7.996
0.350
8.721
8.442
0.279
8.235
0.486
12
) JWH-120
5.977
7.019
1.042
7.109
1.132
8.215
7.889
0.326
7.942
0.273
13
) JWH-122
9.161
8.752
0.409
8.797
0.364
8.921
9.204
0.283
9.183
0.262
14
) JWH-148
6.910
6.595
0.315
6.645
0.265
7.854
7.936
0.082
7.878
0.024
15
) JWH-149
*
8.301
8.328
0.027
8.332
0.031
9.137
9.251
0.114
9.120
0.017
16
) JWH-153
*
6.602
7.324
0.722
7.510
0.908
7.959
8.464
0.505
8.392
0.433
17
) JWH-159
7.346
7.522
0.176
7.392
0.046
7.983
7.880
0.103
7.850
0.133
18
) JWH-160
5.804
5.787
0.017
5.762
0.042
6.356
6.515
0.159
6.630
0.274
19
) JWH-163
5.627
5.722
0.095
5.778
0.151
6.860
7.101
0.241
6.754
0.106
20
) JWH-164
8.180
8.144
0.036
8.309
0.129
8.161
8.141
0.020
8.026
0.135
21
) JWH-165
6.690
6.608
0.082
6.539
0.151
7.149
7.014
0.135
6.765
0.384
22
) JWH-166
*
7.356
7.251
0.105
7.626
0.270
8.721
8.229
0.492
8.052
0.669
23
) JWH-180
7.585
7.204
0.381
7.414
0.171
8.018
7.785
0.233
7.116
0.902
24
) JWH-181
8.886
8.902
0.016
7.366
1.520
9.208
9.105
0.103
7.908
1.300
25
) JWH-182
*
9.187
8.937
0.250
8.921
0.266
8.959
9.099
0.140
9.123
0.164
26
) JWH-189
7.283
7.163
0.120
9.053
1.770
7.921
7.958
0.037
9.149
1.228
27
) JWH-210
9.337
9.306
0.031
7.264
2.073
9.161
9.259
0.098
8.084
1.077
28
) JWH-211
7.154
7.172
0.018
5.963
1.191
7.921
8.143
0.222
6.883
1.038
29
) JWH-212
7.481
7.494
0.013
5.405
2.076
8.000
8.121
0.121
6.789
1.211
30
) JWH-213
8.823
8.804
0.019
7.836
0.987
9.377
9.484
0.107
7.624
1.753
31
) JWH-234
8.075
8.182
0.107
8.183
0.108
8.420
8.387
0.033
7.417
1.003
32
) JWH-235
6.471
6.449
0.022
6.722
0.251
6.910
7.073
0.163
6.738
0.172
33
) JWH-236
5.869
6.025
0.156
6.230
0.361
6.620
7.118
0.498
5.427
1.193
34
) JWH-239
6.465
6.407
0.058
5.830
0.635
7.284
7.037
0.247
5.361
1.923
35
) JWH-240
7.853
7.810
0.043
6.655
1.198
8.143
8.087
0.056
6.024
2.119
36
) JWH-241
6.832
6.915
0.083
6.254
0.578
7.310
7.000
0.310
5.957
1.353
37
) JWH-242
7.376
7.473
0.097
9.299
1.923
8.187
8.130
0.057
9.087
0.900
38
) JWH-258
8.337
8.291
0.046
7.458
0.879
7.979
7.898
0.081
8.149
0.170
39
) JWH-259
*
6.657
6.902
0.245
7.362
0.705
7.131
7.114
0.017
7.963
0.832
40
) JWH-260
7.537
8.057
0.520
8.586
1.049
7.602
8.140
0.538
9.141
1.539
41
) JWH-261
6.115
6.275
0.160
8.118
2.003
6.656
6.735
0.079
8.218
1.562
42
) JWH-262
7.552
8.021
0.469
6.430
1.122
8.252
8.573
0.321
6.976
1.276
43
) JWH-265
5.421
5.238
0.183
5.965
0.544
7.097
6.769
0.328
6.912
0.185
44
) JWH-267
6.419
6.649
0.230
7.550
1.131
8.143
7.937
0.206
6.931
1.212
45
) JWH-268
*
5.860
6.313
0.453
6.283
0.423
7.398
7.922
0.524
7.086
0.312
46
) JWH-167
7.045
7.211
0.166
7.928
0.883
6.799
7.119
0.320
8.220
1.421
47
) JWH-201
5.973
5.572
0.401
6.910
0.937
6.353
6.071
0.282
7.496
1.143
48
) JWH-202
*
5.775
5.540
0.235
7.524
1.749
6.190
6.059
0.131
8.157
1.967
49
) JWH-203
8.096
8.049
0.047
8.881
0.785
8.155
7.734
0.421
7.011
1.144
50
) JWH-204
7.886
7.582
0.304
8.165
0.279
7.602
7.161
0.441
7.961
0.359
51
) JWH-205
*
6.906
7.128
0.222
7.511
0.605
6.745
7.166
0.421
7.088
0.343
52
) JWH-206*
6.410
6.457
0.047
7.932
1.522
6.303
5.869
0.434
7.628
1.325
53
) JWH-207
5.796
6.065
0.269
7.555
1.759
5.429
5.806
0.377
7.555
2.126
54
) JWH-208
6.747
6.740
0.007
7.198
0.451
6.244
6.063
0.181
7.059
0.815
55
) JWH-209
6.127
6.343
0.216
8.359
2.232
5.869
5.998
0.129
8.180
2.311
56
) JWH-237
7.420
7.597
0.177
6.574
0.846
6.975
7.273
0.298
7.026
0.051
57
) JWH-248
*
5.988
6.152
0.164
8.035
2.047
6.182
6.471
0.289
8.208
2.026
58
) JWH-249
8.075
7.839
0.236
6.238
1.837
7.699
7.453
0.246
6.933
0.766
59
) JWH-250
7.958
7.845
0.113
7.849
0.109
7.481
7.217
0.264
8.294
0.813
60
) JWH-251
7.537
7.584
0.047
5.041
2.496
6.836
7.239
0.403
7.116
0.280
61
) JWH-252
*
7.638
7.308
0.330
6.741
0.897
7.721
7.264
0.457
8.344
0.623
62
) JWH-253
7.207
6.996
0.211
6.350
0.857
7.076
6.916
0.160
8.279
1.203
63
) JWH-302
7.769
7.788
0.019
7.547
0.222
7.051
7.110
0.059
7.047
0.004
64
) JWH-303
6.931
6.885
0.046
6.998
0.067
6.860
7.031
0.171
7.075
0.215
65
) JWH-305
7.823
7.915
0.092
7.515
0.308
7.538
7.595
0.057
7.317
0.221
66
) JWH-306
*
7.602
7.595
0.007
6.580
1.022
7.086
7.092
0.006
6.638
0.448
67
) JWH-311
7.638
7.687
0.049
7.461
0.177
7.409
7.231
0.178
7.097
0.312
68
) JWH-312
*
7.142
7.184
0.042
7.040
0.102
7.041
7.013
0.028
6.907
0.134
69
) JWH-313
6.374
6.259
0.115
6.500
0.126
6.438
6.375
0.063
6.468
0.030
70
) JWH-314
7.408
7.300
0.108
7.044
0.364
7.119
7.221
0.102
7.032
0.087
71
) JWH-315
6.366
6.798
0.432
6.622
0.256
6.740
7.006
0.266
6.842
0.102
a
Observed binding affinity values
b
Predicted binding affinity values in pKi (pKi ¼ log [Ki]) obtained by applying the CoMFA (steric/electrostatic) model.
c
Predicted binding affinity values in pKi (pKi ¼ log [Ki]) obtained by applying the CoMSIA (hydrophobic) model.
d
Difference between the observed versus CoMFA binding affinity values.
e
Difference between the observed versus CoMSIA binding affinity values.
*
Molecule from the test set.
2.7. Statistical analysis of CoMFA and CoMSIA models
The statistical robustness of CoMFA and CoMSIA models was
evaluated based on q
2
, the cross-validated leave-one-out correla-
tion coefficient. Models were considered to be robust when q
2
was
greater than 0.5. Moreover, the standard deviation of the residuals
of fit (SD
res
) was calculated, in order to assess the predictive ability
of the derived models. Compounds with residuals (s) greater than
twice the standard deviation of the residuals have been considered
as outliers, that is, compounds whose predicted activity was under-
or overestimated by the model, considering the training set
(internal predictivity) and the test set (external predictivity). As
a whole, this methodology evaluates the robustness of the gener-
ated 3D-QSAR models and also gives deep insight into the full SAR
of the compounds of this study.
3. Results and discussion
CoMFA and CoMSIA techniques were used to develop models
for CB1 and CB2 receptor affinities and CB1/CB2 and CB2/CB1
receptor selectivities. The hypothetic bioactive conformer
reported in the literature was used in this work
[32,20]
. Using
the molecules of the training set, 3D-QSAR models were gener-
ated and validated with an external test set comprising 15
molecules (
Table 1
). CoMFA and CoMSIA 3D-QSAR models were
derived for a set of 56 structurally related indole ligands of
cannabinoid receptors by using alignment 1 due to lower
values of RMS compared to alignment 2 (
Fig. 3
). A total of 12
models, 4 using CoMFA and 8 using CoMSIA were generated
(
Tables 3 and 5
).
3.1. CoMFA studies using affinity data for CB1
The best CoMFA affinity model for CB1 ligands showed a q
2
value of
0.785 with a number of the optimal components equal to 6 and
a combination of cutoff values of 25 and 35 kcal mol
1
for the steric
and electrostatic field contributions, respectively. A non-cross-vali-
dated r
2
of 0.926 with F of 102.532 was also observed with this model.
Table 3
shows PLS statistics of the best CoMFA affinity model for CB1.
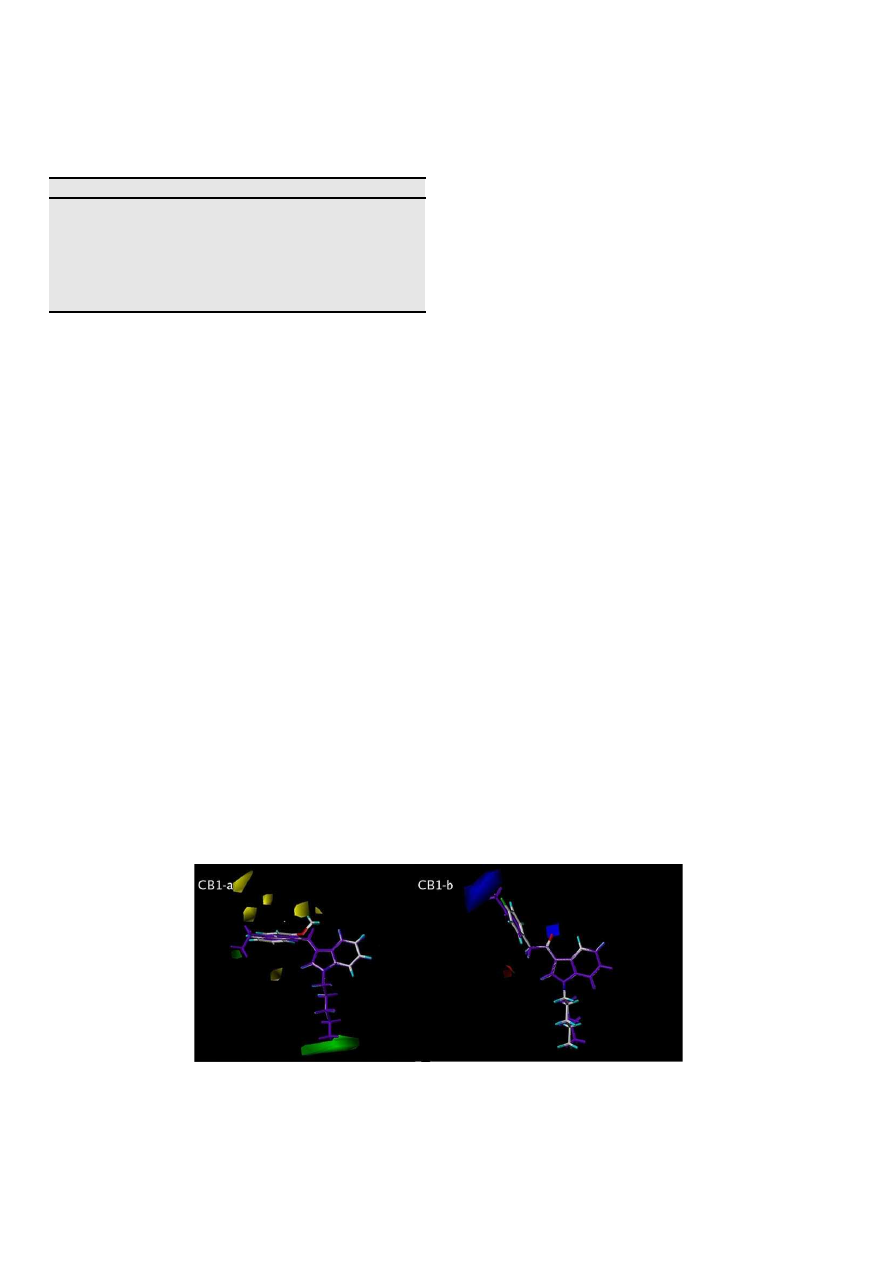
3.1.1. Visual inspection of 3D contour maps generated by CoMFA
with affinity data for CB1 receptors
CoMFA steric and electrostatic fields for CB1 affinity based on
PLS analysis were represented as 3D contour plots in
Fig. 4
a and b,
using compounds with the highest and lowest affinities of the
training set, JWH-210 (27, in purple) and JWH-265 (43), respec-
tively, as reference structures (
Table 1
). The steric contour map
shows a green region (sterically favored) surrounding both the
ethyl group present in the R
4
position of the naphthyl ring and the
n
-pentyl substituent attached to the indole nitrogen of JWH-210
(27). Inversely, compound JWH-265 (43) presents an unfavorable
interaction of the methoxy group in the R
3
position of the naphthyl
ring, lying in a sterically forbidden yellow region of the contour
map. Besides, JWH-265 (43) does not show any favorable interac-
tions with the substituent at the R
1
position of the indole ring,
which further explains the low affinity of this compound (
Fig. 4
a).
The visual inspection of the steric contour maps of the best
CoMFA affinity model (
Fig. 4
a) towards CB1 reveals that
compounds that bear hydrogen in the R
4
position of the naphthyl
ring, an n-propyl chain instead of n-pentyl in the R
1
position and
a methyl in the R
2
position of the indole ring tend to have reduced
binding affinity for CB1. These data suggest that the substitution
pattern in those positions of the molecular skeleton is very
important for optimization of interactions with receptor CB1. This
can be better exemplified when we compare compounds JWH-072
(6, pKi
CB1
¼
5.978) and JWH-018 (3, pKi
CB1
¼
8.045) that bear an
n
-propyl and an n-pentyl group in the R
1
position of the indole ring,
respectively. In the latter case, the addition of two methylene
groups, transforming the propyl chain in pentyl, promotes
Table 5
Statistical results for the best CoMFA and CoMSIA models of selectivity obtained for
the training set and test set.
q
2
a
N
b
SEP
c
r
2
d
SEE
e
F
f
r
2
pred
g
CB1
CoMFA std
0.649 7
0.055 0.853 0.035 39.932 0.839
CoMSIA steric þ electrostatic 0.603 5
0.057 0.813
0.039 43.565 0.886
CoMSIA hydrophobic
0.597 6
0.058 0.822 0.039
37.802
0.431
CB2
CoMFA std
0.645 6
0.063 0.814
0.046 35.703 0.870
CoMSIA steric þ electrostatic 0.577
6
0.069 0.795 0.048
31.746
0.880
CoMSIA hydrophobic
0.567 8
0.072 0.798 0.049 23.266 0.490
a
Cross-validation correlation coefficient.
b
Number of components.
c
Standard error of prediction.
d
Correlation coefficient.
e
Standard error of estimation.
f
F
-ratio.
g
Correlation coefficient between the observed and predictive activities of the test
set.
Fig. 4.
Steric (a) and electrostatic (b) contour maps of the best CoMFA affinity model for CB1 receptors are represented by compounds with the highest pKi value, JWH-210 (in
purple) and the lowest pKi value, JWH-265 superposed in the steric contour plot, and the compounds JWH-208 (in purple) and JWH-313, respectively, superposed in the elec-
trostatic contour plot. Steric contour plots: green contours (80% contribution) indicate regions where an increase in steric bulk will enhance affinity, whereas yellow contours (20%
contribution) indicate sterically disfavored regions. Electrostatic contour plots: blue contours (80% contribution) and red contours (20% contribution) correspond to regions where
an increase in positive or negative charge, respectively, is favorable for binding properties. (For interpretation of the references to colour in this figure legend, the reader is referred
to the web version of this article.)
G.B.L. De Freitas et al. / European Journal of Medicinal Chemistry 44 (2009) 2482–2496
2488
a difference in binding affinity of 116-fold (Ki values), confirming
the pharmacophoric importance of these substituents for molec-
ular recognition by the target CB1 receptor.
Additionally, ligands that present an n-pentyl chain in the R
1
position along with –CH
3
, –C
2
H
5
, –C
3
H
7
, –OCH
3
and –OC
2
H
5
in the
R
4
position of the naphthyl ring, e.g. JWH-122 (13, pKi
CB1
¼
9.161),
JWH-149 (15, pKi
CB1
¼
8.301), JWH-210 (27, pKi
CB1
¼
9.337), JWH-
213 (30, pKi
CB1
¼
8.823), JWH-182 (25, pKi
CB1
¼
9.187), JWH-181
(24, pKi
CB1
¼
8.886), JWH-081 (9, pKi
CB1
¼
8.920), JWH-098 (11,
pKi
CB1
¼
8.346), JWH-258 (38, pKi
CB1
¼
8.337) and JWH-260 (40,
pKi
CB1
¼
7.537) are part of a group of compounds that have the
highest affinity values for CB1. Among them, compounds JWH-260
(40), JWH-098 (11), JWH-181 (24), JWH-213 (30) and JWH-149 (15),
which presented a methyl group in the R
2
position of the indole
ring, have demonstrated good affinity values for the CB1 receptor,
in spite to be frequently associated with decreasing receptor
binding affinity. However, structure–activity analysis of these
derivatives suggests that substitution in R
4
and R
1
positions of the
naphthyl and the indole ring, respectively, represents the most
important pharmacophoric subunits, justifying the good binding
profile of these compounds.
We may hypothesize that, in some compounds, the methyl
group attached to the R
2
position of the indole ring would lead to
a conformational change of the vicinal naphthyl ring, adequately
orientating the side chains and improving molecular recognition
within the CB1 receptor. This behavior could be evidenced through
the comparison of the binding affinity profile of ligands that also
bear an n-propyl chain in the R
1
position of the indole ring, e.g.
JWH-072 (6, pKi
CB1
¼
5.978) and JWH-015 (2, pKi
CB1
¼
6.785).
Besides, para-substituted (X
3
) analogues from benzylcarbonyl
series show a decreased affinity for CB1 receptor when compared to
substitutions in other positions (X
1
and X
2
). This deleterious effect
is emphasized when the ligand also has a methyl group in the R
2
position of the indole ring, e.g. compounds JWH-209 (55,
pKi
CB1
¼
6.127), JWH-202 (48, pKi
CB1
¼
5.775) and JWH-207 (53,
pKi
CB1
¼
5.796).
Visual inspection of the CoMFA steric contour map (
Fig. 4
a)
shows that groups in the X
3
position lie in a yellow field, which
does not favor large substituents (bigger than hydrogen). Addi-
tionally, in the analysis of the CoMFA electrostatic contour map
(
Fig. 4
b), these groups also lie in a blue field, which is unfavor-
able for the presence of electron-rich groups, such as p-F, p-Cl,
p
-Br and p-OCH
3
. These observations justify the low pKi values
for the binding at CB1 receptor subtype through the comparison
of the compounds JWH-208 (54, pKi
CB1
¼
6.747, in purple) and
JWH-313 (69, pKi
CB1
¼
6.374). In the CoMFA electrostatic model,
compound JWH-208 (54) presents a greater affinity for the CB1
receptor, when compared to the ligand with the pKi value
demonstrated by the compound JWH-313 (69). This may be
explained by the presence of an electron-rich group in the X
3
position of the benzylcarbonyl subunit of JWH-313 (69) which
decreases its affinity for CB1 in comparison with compound
JWH-208 (54) that bears a methyl group in the corresponding
position.
The predicted pKi values for the compounds exploited in our
database using the CoMFA affinity model for CB1 receptors are
given in
Table 4
.
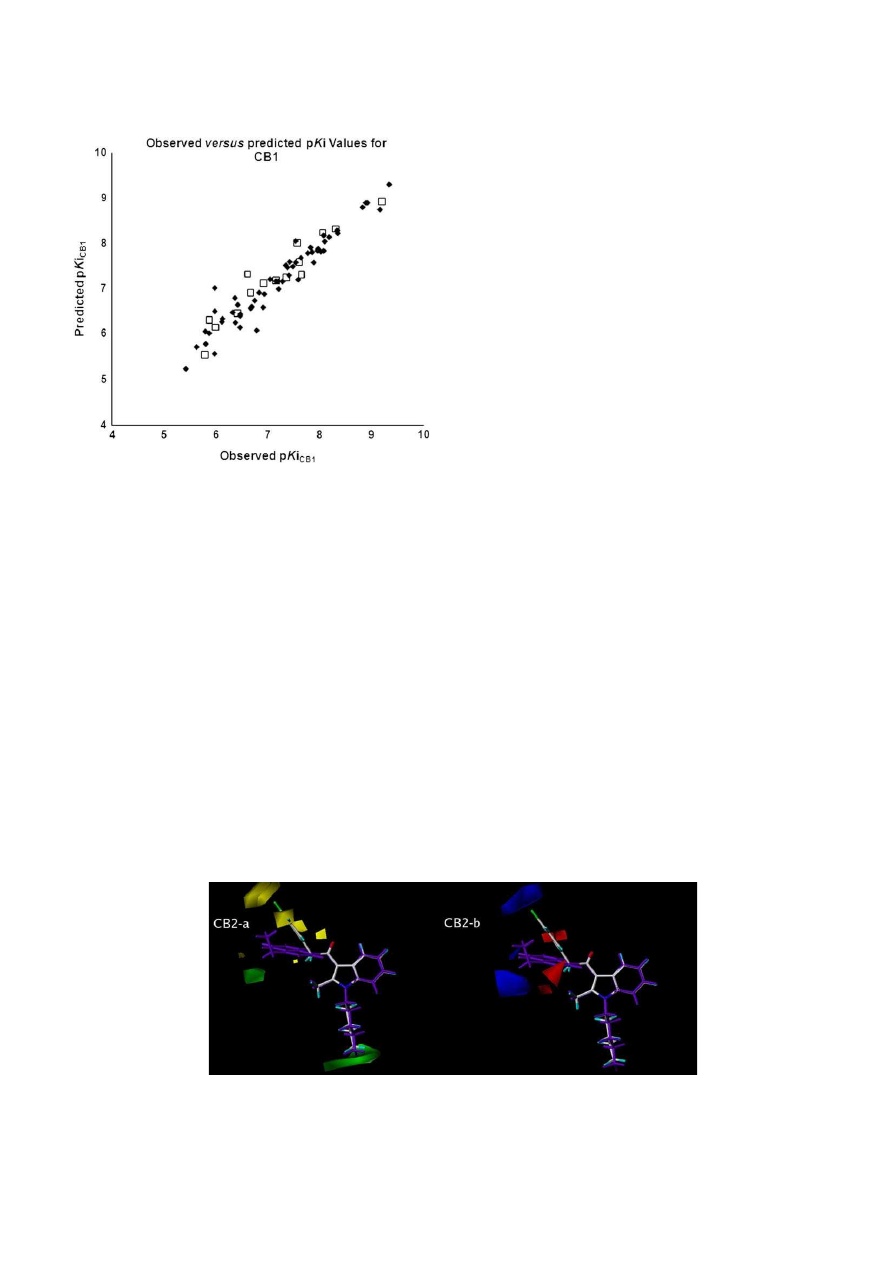
Fig. 5
shows the plot of observed versus predicted
pKi values obtained from the best CoMFA affinity model for CB1,
highlighting the training and the test sets.
3.2. CoMFA studies using affinity data for CB2
The best CoMFA affinity model obtained for indole ligands of
CB2 receptors showed a good q
2
of 0.751 using 6 components.
A non-cross-validated r
2
of 0.898 with an F value of 71.707 was also
observed with this model (
Table 3
).
Fig. 5.
Plot of predicted versus observed pKi values derived from the steric/electrostatic
CoMFA affinity model of the training (in black) and test (in white) sets of CB1 ligands.
Fig. 6.
Steric (a) and electrostatic (b) contour maps of the best CoMFA affinity model for CB2 receptor ligands. Compounds JWH-213 (in purple) and JWH-207 are shown inside the
fields. Steric contour plots: green contours (80% contribution) indicate regions where an increase in steric bulk will enhance affinity, whereas yellow contours (20% contribution)
indicate sterically disfavored regions. Electrostatic contour plots: blue contours (80% contribution) and red contours (20% contribution) correspond to regions where an increase in
positive or negative charge, respectively, is favorable for binding properties. (For interpretation of the references to colour in this figure legend, the reader is referred to the web
version of this article.)
G.B.L. De Freitas et al. / European Journal of Medicinal Chemistry 44 (2009) 2482–2496
2489
3.2.1. Visual inspection of 3D contour maps generated by CoMFA
with affinity data for CB2 receptors
The CoMFA steric and electrostatic contour maps of the
developed affinity model towards CB2 receptors are depicted in
Fig. 6
a and b with the compounds JWH-213 (30, pKi
CB2
¼
9.377, in
purple) and JWH-207 (53, pKi
CB2
¼
5.429) as reference structures
(
Table 1
). Compound JWH-213 (30) is the molecule within the
database that shows the highest affinity for CB2 receptors and this
profile could be justified by favorable interactions demonstrated
in the CoMFA steric map, where the ethyl group in R
4
position of
the naphthyl ring and the n-pentyl chain attached to the indolic
nitrogen (R
1
) show favorable interactions in green fields of the
model (
Fig. 6
a).
Moreover, the visual inspection of compound JWH-207 (53),
which has the lowest affinity for CB2 among the compounds of our
database (
Table 1
), shows the chlorine substituent in the X
3
posi-
tion of the benzylcarbonyl subunit and the aromatic ring itself in
a position close to a yellow field of the steric contour map, unfa-
vorable for the binding affinity at CB2 receptors (
Fig. 6
a). Addi-
tionally, the chlorine atom of JWH-207 (53) is also close to a blue
field in the CoMFA electrostatic contour map, which is unfavorable
for electron-rich substituents (
Fig. 6
b).
The visual inspection of the CoMFA steric contour map obtained
for CB2 receptor ligands shows that, contrary to the contour map
obtained for CB1 receptors (
Fig. 4
a), substitution in the R
2
position
of the indole ring by a methyl group does not influence binding
affinity as much as it does upon binding to CB1. This is corroborated
by the lack of steric contour maps around the methyl group at R
2
position in the model obtained for CB2 (
Fig. 6
a). This fact is sup-
ported by the comparison between JWH-164 (20, pKi
CB2
¼
8.161)
and JWH-159 (17, pKi
CB2
¼
7.982), which bear a hydrogen and
a methyl group in R
2
position of the indole ring, respectively, since
the difference in binding affinity between them is only 0.179, while
the difference in pKi for CB1 is 0.261 (
Table 2
).
The CoMFA electrostatic contour map for ligands of CB2 recep-
tors (
Fig. 6
b) has demonstrated few favorable regions for interac-
tion with electron-rich groups (red contour map), as it has been
observed in the model for CB1 receptors. This result is expected,
since docking studies with homology models of both CB1 and CB2
receptors have shown that the active site is mostly composed of
hydrophobic amino acid residues that interact through aromatic
stacking
[11,20]
.
Other similarities with the model that has been built for CB1 are
the presence of two sterically favored regions (green) around
substituents in the R
4
and R
1
positions of the naphthyl and indole
rings, respectively. An additional unfavorable (yellow) steric
contour map around the X
3
position of the benzylcarbonyl subunit
characterizes itself as affinity-decreasing for both CB1 (
Fig. 4
a) and
CB2 (
Fig. 6
a) receptors. Also, the analogues in which the secondary
aryl ring is ortho substituted (X
1
position) have shown highest
affinity for both CB1 and CB2, as exemplified by compounds JWH-
250 (59, pKi
CB1
¼
7.958 and pKi
CB2
¼
7.481), JWH-306 (66,
pKi
CB1
¼
7.602 and pKi
CB2
¼
7.086), JWH-251 (60, pKi
CB1
¼
7.537 and
pKi
CB2
¼
6.836), JWH-252 (61 pKi
CB1
¼
7.638 and pKi
CB2
¼
7.721),
JWH-203 (49, pKi
CB1
¼
8.096 and pKi
CB2
¼
8.155), JWH-204 (50,
pKi
CB1
¼
7.886 and pKi
CB2
¼
7.602), JWH-249 (58, pKi
CB1
¼
8.075 and
pKi
CB2
¼
7.699), JWH-305 (65, pKi
CB1
¼
7.823 and pKi
CB2
¼
7.538),
which can be explained through the visual inspection of the CoMFA
steric contour maps that lack unfavorable (yellow) fields (
Fig. 6
a).
The same is not true for the analogues presenting substituents at X
2
and X
3
positions, e.g. compounds JWH-208 (54, pKi
CB1
¼
6.747 and
pKi
CB2
¼
6.244), JWH-209 (55, pKi
CB1
¼
6.127 and pKi
CB2
¼
5.869),
JWH-312 (68, pKi
CB1
¼
7.142 and pKi
CB2
¼
7.041), JWH-315 (71,
pKi
CB1
¼
6.366 and pKi
CB2
¼
6.740), JWH-313 (69, pKi
CB1
¼
6.374 and
pKi
CB2
¼
6.438).
The predicted activities using the CoMFA affinity model for CB2
are given in
Table 4
and
Fig. 7
shows the plot of observed versus
predicted pKi for the training set and the test set obtained through
quantitative analysis of the model.
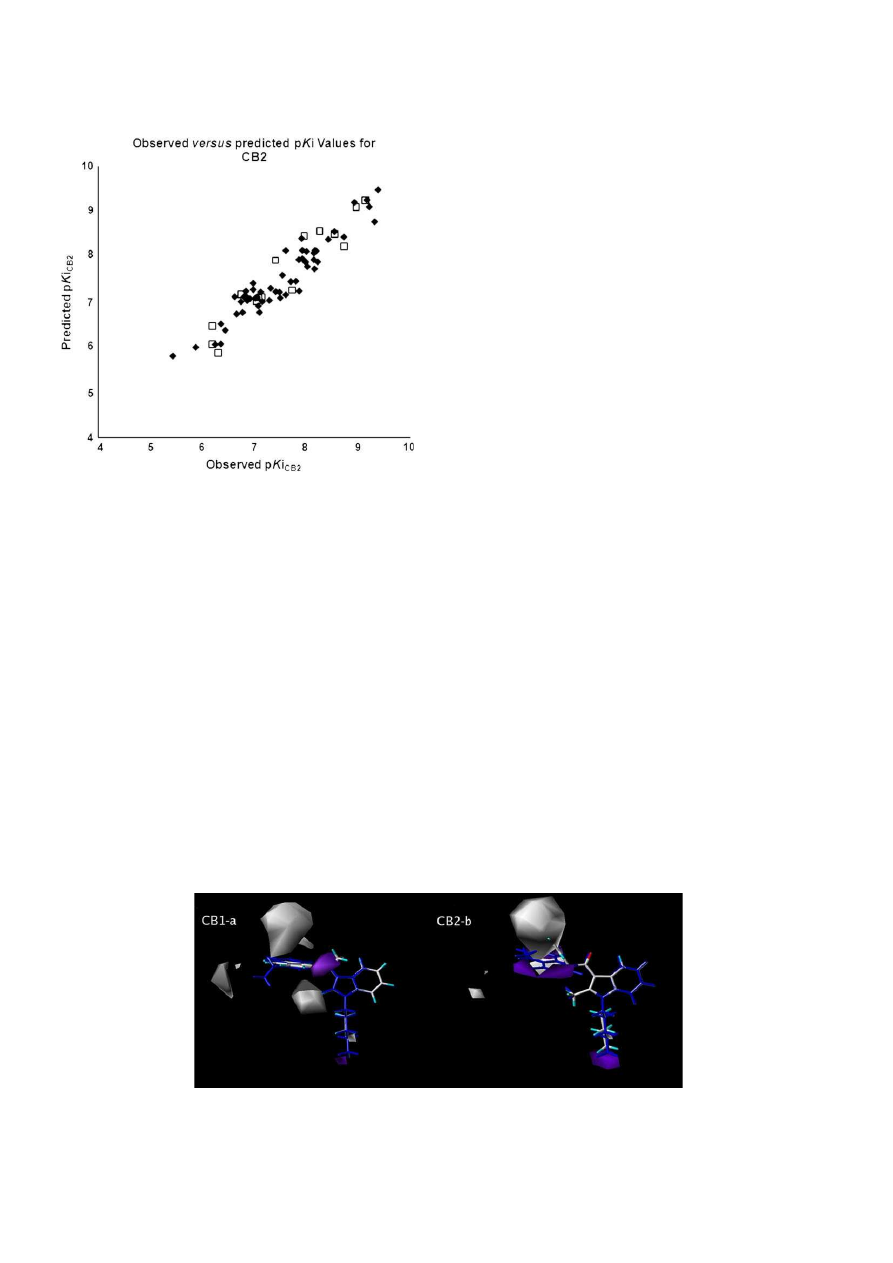
Fig. 7.
Observed versus predicted pKi values derived from the steric/electrostatic
CoMFA affinity model of the training (in black) and test (in white) sets of CB2 ligands.
Fig. 8.
CoMSIA hydrophobic contour maps for the affinity of indole ligands to CB1 (a) and CB2 (b) receptors. Compounds JWH-210 (in blue)/JWH-265 and JWH-213 (in blue)/JWH-
207 are shown inside the fields of the models (a) and (b), respectively. Purple regions (80% contribution) indicate areas where hydrophobic groups increase activity and white
regions (20% contribution) indicate areas where hydrophobic groups decrease activity. (For interpretation of the references to colour in this figure legend, the reader is referred to
the web version of this article.)
G.B.L. De Freitas et al. / European Journal of Medicinal Chemistry 44 (2009) 2482–2496
2490
3.3. CoMSIA studies using affinity data for CB1 and CB2
To enhance the assessment made by CoMFA steric and electro-
static contour maps, we built models with the same properties
previously evaluated as well as hydrophobic, hydrogen bonding
acceptor and donor properties, using CoMSIA method. The CoMSIA
steric and electrostatic models corroborated the results previously
obtained by CoMFA, which represent a positive result in the validation
of the developed 3D-QSAR models. The best affinity models for CB1
and CB2 receptors generated q
2
values of 0.743 and 0.759, respec-
tively. Also, the models showed non-cross-validated r
2
values of 0.908
and 0.879 and F values of 67.681 and 59.199, respectively (
Table 3
).
The visual inspection, along with the statistics of the hydrogen
bonding contour maps revealed that this property did not generate
good models, as expected from the previous bad performance of the
electrostatic contour maps (data not labeled). Thus, this property
has been discarded from our structure–activity relationship (SAR)
studies. However, the great advantage of CoMSIA in our study was
the construction of hydrophobic contour maps which have shown to
be highly correlated to the steric contour maps created by CoMFA
and have proven to be an excellent tool used in our SAR analysis. This
result was expected due to the mainly hydrophobic nature of the
interactions of cannabinoid ligands with the receptors
[40]
.
The predicted activities using the CoMSIA steric/electrostatic
models of affinities towards CB1 receptors, and the residue values
of the training and the test sets as well as the plot of observed
versus
predicted pKi for the training and the test were very similar
to those obtained by CoMFA. The CoMSIA hydrophobic contour
maps of affinity showed q
2
values of 0.716 and 0.713 for CB1 and
CB2, respectively (
Table 3
). Besides, consistent r
2
values of the non-
cross-validation equal to 0.907 and 0.868 with low values of stan-
dard error of estimate (SEE) below 0.330 for both and Fischer test
values of 57.230 and 65.998 for CB1 and CB2 affinities, respectively,
have been obtained (
Table 3
).
The CoMSIA hydrophobic contour maps of affinity for cannabi-
noid CB1 and CB2 receptors are depicted in
Fig. 8
, demonstrating
compounds JWH-210 (27, in blue) and JWH-265 (43) inside the
map (a) and JWH-207 (53) and JWH-213 (30, in blue) inside the
map (b), respectively. In the CB1 model (
Fig. 8
a), there is a lack of
unfavorable interactions made by the ligand with the highest
affinity of our database. In addition, compound JWH-210 (27) also
has its n-pentyl chain in a region that allows the presence of
hydrophobic groups. However, two unfavorable interactions have
been observed with compound JWH-265 (43). One of them is
caused by the oxygen atom of the methoxy group in the R
3
position
of the naphthyl ring in a region favorable to the presence of
hydrophobic groups and the other involves the n-propyl chain at R
1
position that lies close to a contour map unfavorable to the pres-
ence of hydrophobic groups. These data justify its lower affinity in
comparison to compound JWH-210 (27) (
Table 1
).
The analysis of the hydrophobic contour maps of the best affinity
model towards CB2 receptor (
Fig. 8
b) showed that the ligand with
the highest affinity, JWH-213 (30, in blue), does not have any unfa-
vorable interaction with the maps, and yet shows the ethyl group in
the R
4
position of the naphthyl ring close to the region that is
favorable to the presence of hydrophobic groups, in opposition to
what was observed for compound JWH-207 (53), that despite having
a para-Cl substituent lying close to an unfavorable hydrophobic field
(gray,
Fig. 8
b), had its pKi value overestimated by the model in 2.16
logarithmic units. This result may be due to the proximity of the n-
pentyl chain in the R
1
position to a region that is favorable to the
interaction with hydrophobic groups, which seems to be statistically
more significant to the affinity for CB2 receptors (
Fig. 8
b).
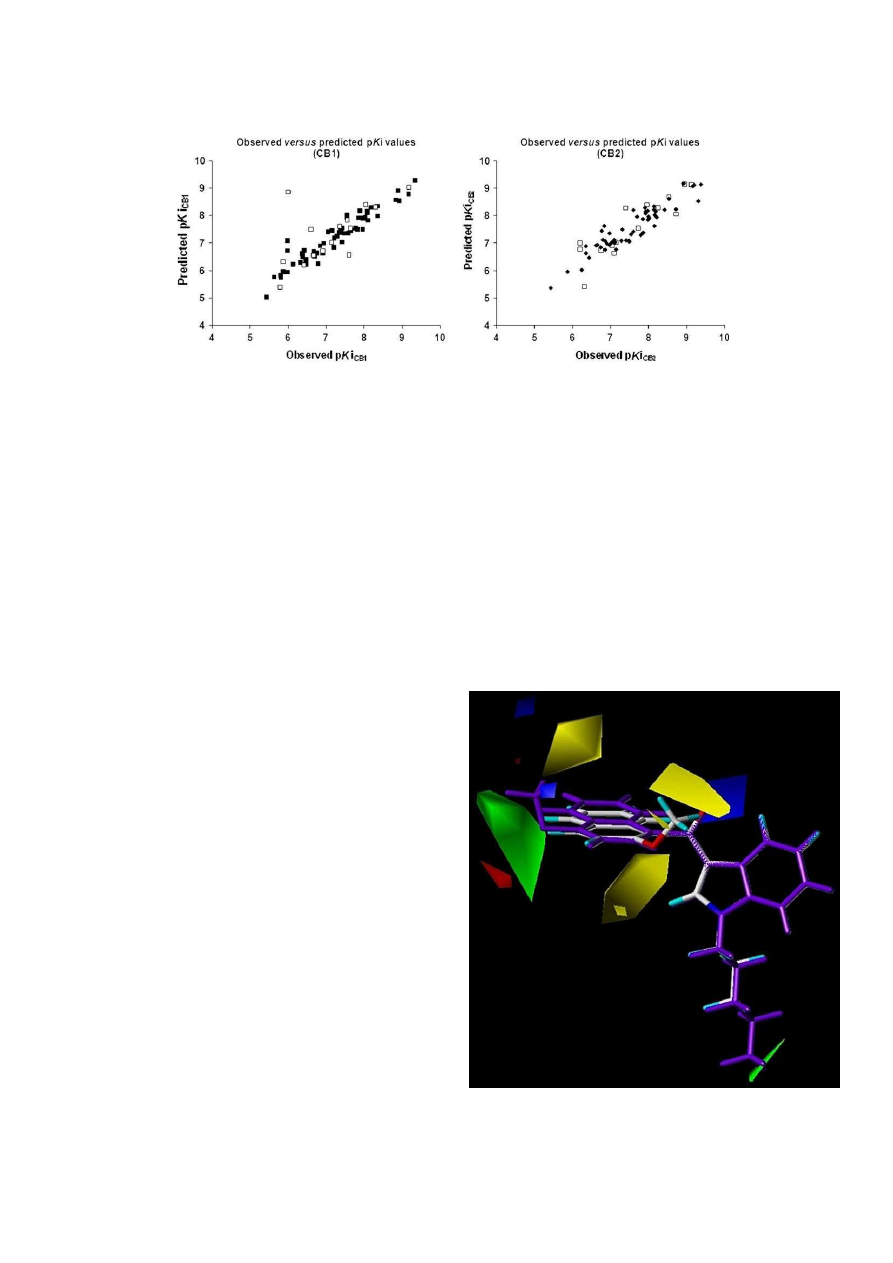
Fig. 9.
Observed versus predicted pKi values derived from the CoMSIA hydrophobic affinity model of the training (in black) and test (in white) sets of CB1 and CB2 ligands.
Fig. 10.
Steric and electrostatic contour maps from the best CoMFA model of selectivity
towards CB1 receptors. Compounds JWH-081 (in purple) and JWH-265 are shown
inside the fields. (For interpretation of the references to colour in this figure legend, the
reader is referred to the web version of this article.)
G.B.L. De Freitas et al. / European Journal of Medicinal Chemistry 44 (2009) 2482–2496
2491

Table 6
Observed and predicted binding selectivity values, given in pKi (pKi ¼ log [Ki]) obtained by applying the CoMFA (steric/electrostatic) and CoMSIA (hydrophobic) models for
cannabinoid CB1 and CB2 receptor ligands and the difference between the observed versus CoMFA and CoMSIA predicted selectivity values towards CB1 and CB2 receptors.
Compound
a
CB1
b
CB1
d
CB1
c
CB1
e
CB1
a
CB2
b
CB2
d
CB2
c
CB2
e
CB2
1
) JWH-007
0.939
0.907
0.032
0.920
0.019
1.064
1.115
0.051
1.093
0.029
2
) JWH-015
0.863
0.845
0.018
0.851
0.012
1.158
1.181
0.023
1.174
0.016
3
) JWH-018
*
0.942
0.961
0.019
0.969
0.027
1.061
1.062
0.001
1.037
0.024
4
) JWH-046
0.829
0.853
0.024
0.848
0.019
1.205
1.167
0.038
1.166
0.039
5
) JWH-048
0.856
0.915
0.059
0.917
0.061
1.168
1.101
0.067
1.085
0.083
6
) JWH-072
0.883
0.899
0.016
0.900
0.017
1.132
1.128
0.004
1.119
0.013
7
) JWH-076
0.956
0.906
0.050
0.897
0.059
1.045
1.115
0.070
1.111
0.066
8
) JWH-079
0.960
1.008
0.048
0.977
0.017
1.040
1.008
0.032
1.029
0.011
9
) JWH-081
1.128
1.070
0.058
1.046
0.082
0.886
0.942
0.056
0.948
0.062
10
) JWH-094
0.901
0.903
0.002
0.910
0.009
1.109
1.097
0.012
1.104
0.005
11
) JWH-098
0.957
0.965
0.008
0.979
0.022
1.044
1.032
0.012
1.022
0.022
12
) JWH-120
0.727
0.885
0.158
0.881
0.154
1.374
1.140
0.234
1.147
0.227
13
) JWH-122
1.026
0.947
0.079
0.950
0.076
0.973
1.074
0.101
1.066
0.093
14
) JWH-148
0.879
0.832
0.047
0.833
0.046
1.136
1.193
0.057
1.202
0.066
15
) JWH-149
*
0.908
0.894
0.014
0.901
0.007
1.100
1.127
0.027
1.121
0.021
16
) JWH-153
*
0.829
0.853
0.024
0.917
0.088
1.205
1.190
0.015
1.110
0.095
17
) JWH-159
0.920
0.950
0.030
0.964
0.044
1.086
1.065
0.021
1.051
0.035
18
) JWH-160
0.913
0.889
0.024
0.898
0.015
1.094
1.130
0.036
1.129
0.035
19
) JWH-163
0.820
0.809
0.011
0.874
0.054
1.219
1.224
0.005
1.174
0.045
20
) JWH-164
1.002
1.006
0.004
1.013
0.011
0.997
0.997
0.000
0.990
0.007
21
) JWH-165
0.935
0.940
0.005
0.936
0.001
1.068
1.067
0.001
1.083
0.015
22
) JWH-166
*
0.843
0.874
0.031
0.956
0.113
1.185
1.153
0.032
1.074
0.111
23
) JWH-180
0.946
0.932
0.014
0.944
0.002
1.057
1.075
0.018
1.059
0.002
24
) JWH-181
0.965
0.973
0.008
0.986
0.021
1.036
1.008
0.028
0.999
0.037
25
) JWH-182
*
1.025
0.994
0.031
1.012
0.013
0.975
1.009
0.034
0.977
0.002
26
) JWH-189
0.919
0.899
0.020
0.914
0.005
1.087
1.089
0.002
1.102
0.015
27
) JWH-210
1.019
1.017
0.002
0.982
0.037
0.981
0.971
0.010
1.007
0.026
28
) JWH-211
0.903
0.896
0.007
0.904
0.001
1.107
1.109
0.002
1.084
0.023
29
) JWH-212
0.935
0.935
0.000
0.912
0.023
1.069
1.078
0.009
1.101
0.032
30
) JWH-213
0.941
0.943
0.002
0.932
0.009
1.062
1.065
0.003
1.075
0.013
31
) JWH-234
0.959
0.975
0.016
0.975
0.016
1.042
1.038
0.004
1.016
0.026
32
) JWH-235
0.936
0.913
0.023
0.907
0.029
1.067
1.103
0.036
1.097
0.030
33
) JWH-236
0.886
0.860
0.026
0.858
0.028
1.127
1.155
0.028
1.152
0.025
34
) JWH-239
0.887
0.892
0.005
0.873
0.014
1.126
1.109
0.017
1.147
0.021
35
) JWH-240
0.964
0.953
0.011
0.965
0.001
1.036
1.054
0.018
1.047
0.011
36
) JWH-241
0.934
0.919
0.015
0.908
0.026
1.069
1.076
0.007
1.097
0.028
37
) JWH-242
0.901
0.906
0.005
0.921
0.020
1.109
1.099
0.010
1.097
0.012
38
) JWH-258
1.044
1.048
0.004
1.039
0.005
0.957
0.956
0.001
0.963
0.006
39
) JWH-259
*
0.933
0.984
0.051
0.918
0.015
1.071
1.005
0.066
1.104
0.033
40
) JWH-260
0.991
1.000
0.009
1.010
0.019
1.008
0.994
0.014
0.984
0.024
41
) JWH-261
0.918
0.919
0.001
0.929
0.011
1.088
1.067
0.021
1.077
0.011
42
) JWH-262
0.915
0.939
0.024
0.943
0.028
1.092
1.071
0.021
1.054
0.038
43
) JWH-265
0.763
0.749
0.014
0.731
0.032
1.309
1.318
0.009
1.329
0.020
44
) JWH-267
0.788
0.818
0.030
0.807
0.019
1.268
1.254
0.014
1.240
0.028
45
) JWH-268
*
0.792
0.779
0.013
0.764
0.028
1.262
1.295
0.033
1.289
0.027
46
) JWH-167
1.072
1.025
0.047
1.079
0.007
0.964
0.971
0.007
0.919
0.045
47
) JWH-201
0.928
0.923
0.005
0.924
0.004
1.063
1.065
0.002
1.097
0.034
48
) JWH-202
*
0.879
0.917
0.038
0.878
0.001
1.071
1.067
0.004
1.150
0.079
49
) JWH-203
1.035
1.024
0.011
1.034
0.001
1.007
0.959
0.048
0.966
0.041
50
) JWH-204
1.061
1.038
0.023
1.053
0.008
0.963
0.964
0.001
0.944
0.019
51
) JWH-205
*
1.010
0.998
0.012
1.012
0.002
0.976
0.996
0.020
0.993
0.017
52
) JWH-206
*
1.088
1.073
0.015
1.082
0.006
0.983
0.923
0.060
0.891
0.092
53
) JWH-207
1.044
1.040
0.004
1.039
0.005
0.936
0.961
0.025
0.940
0.004
54
) JWH-208
1.075
1.087
0.012
1.069
0.006
0.925
0.913
0.012
0.918
0.007
55
) JWH-209
1.031
1.054
0.023
1.026
0.005
0.957
0.950
0.007
0.967
0.010
56
) JWH-237
1.069
1.051
0.018
1.066
0.003
0.939
0.960
0.021
0.923
0.016
57
) JWH-248
*
1.239
0.965
0.274
1.235
0.004
1.032
1.051
0.019
0.769
0.263
58
) JWH-249
1.042
1.056
0.014
1.048
0.006
0.953
0.945
0.008
0.947
0.006
59
) JWH-250
1.087
1.065
0.022
1.093
0.006
0.940
0.942
0.002
0.928
0.012
60
‘ JWH-251
1.060
1.080
0.020
1.062
0.002
0.906
0.931
0.025
0.954
0.048
61
) JWH-252
*
1.018
1.043
0.025
1.020
0.002
1.010
0.958
0.052
1.003
0.007
62
) JWH-253
1.032
1.009
0.023
1.037
0.005
0.981
0.974
0.007
0.978
0.003
63
) JWH-302
1.074
1.105
0.031
1.074
0.000
0.907
0.901
0.006
0.935
0.028
64
) JWH-303
0.994
1.004
0.010
0.993
0.001
0.989
1.003
0.014
1.008
0.019
65
) JWH-305
0.998
1.048
0.050
1.005
0.007
0.963
0.947
0.016
0.974
0.011
66
) JWH-306
*
1.015
1.023
0.008
1.020
0.005
0.932
0.979
0.047
0.995
0.063
67
) JWH-311
1.040
1.033
0.007
1.035
0.005
0.969
0.972
0.003
0.969
0.000
68
) JWH-312
*
1.025
1.025
0.000
1.023
0.002
0.985
0.973
0.012
0.976
0.009
69
) JWH-313
1.011
1.004
0.007
1.010
0.001
1.009
0.991
0.018
0.986
0.023
70
) JWH-314
0.994
0.996
0.002
0.990
0.004
0.960
1.011
0.051
1.020
0.060
71
) JWH-315
0.978
0.988
0.010
0.979
0.001
1.058
1.012
0.046
1.026
0.032
a
Observed binding selectivity values.
b
Predicted selectivity values in pKi (pKi ¼ log [Ki]) obtained by applying the CoMFA (steric/electrostatic) model.
c
Predicted selectivity values in pKi (pKi ¼ log [Ki]) obtained by applying the CoMSIA (hydrophobic) model.
d
Difference between the observed versus CoMFA binding selectivity values.
e
Difference between the observed versus CoMSIA binding selectivity values.
*
Molecule from the test set.
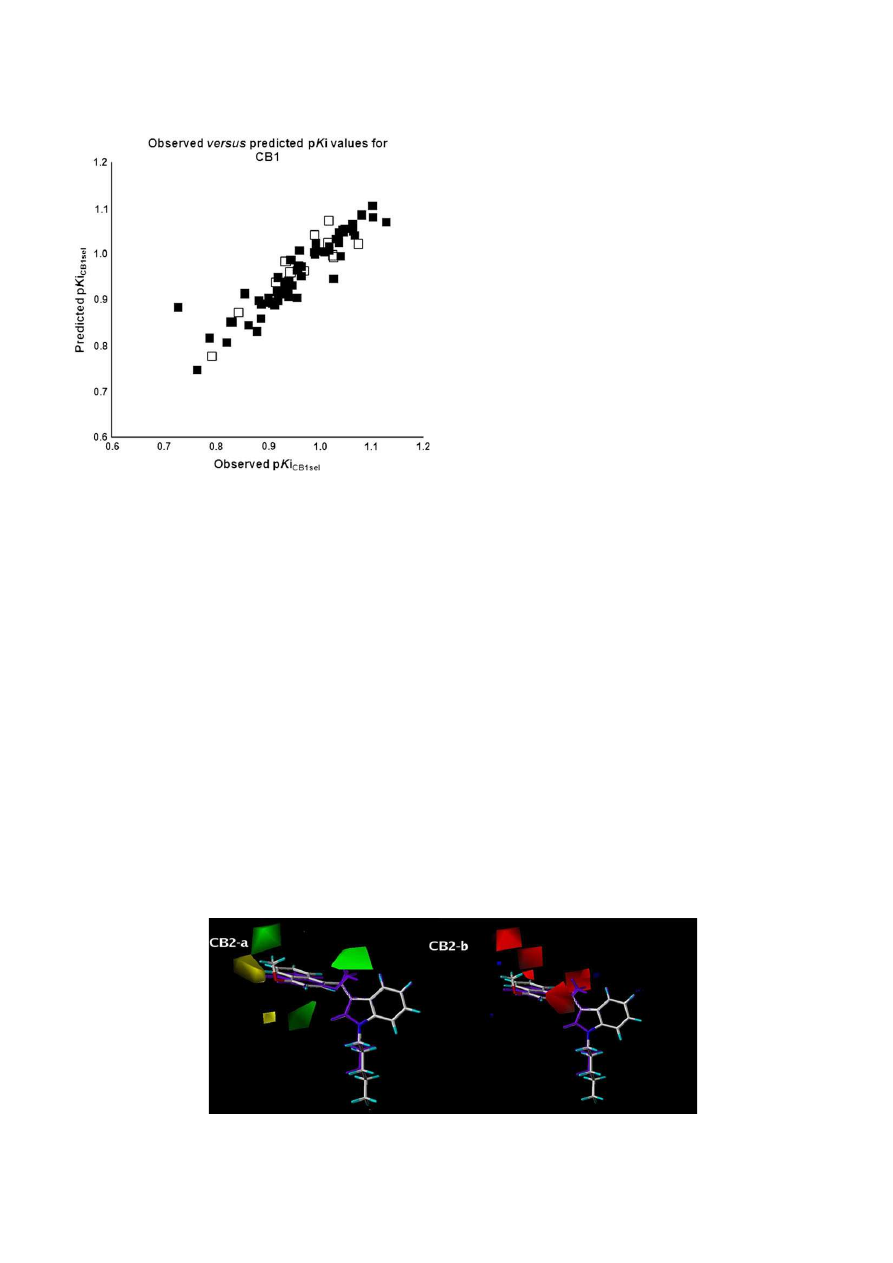
In short, the inspection of the CoMSIA hydrophobic contour
built for CB1 ligands reveals the presence of an unfavorable field
(gray) (
Fig. 8
a) surrounding the R
2
position of the indole ring, in
agreement with results previously discussed from CoMFA steric
model. In the hydrophobic model for CB2 ligands, there were no
fields around the R
2
position (
Fig. 8
b), suggesting that the intro-
duction of substituents at this point is not important for the affinity
of the studied indole ligands to CB2 receptors. Nevertheless, as
already demonstrated by the CoMSIA hydrophobic model obtained
for CB1, the substitution of the X
3
position in the secondary aryl
subunit is unfavorable for hydrophobic substituents such as Cl, Br
and CH
3
. The predicted activities using the CoMSIA hydrophobic
model of affinity for CB2 are given in
Table 4
and
Fig. 9
shows the
plot of observed versus predicted pKi values for the training and the
test sets.
3.4. CoMFA and CoMSIA studies using CB1 and CB2 selectivity data
Selectivity towards a specific bioreceptor is fundamental to
assure that a determined bioactive substance could present mini-
mized side effects resultant from the bind to two or more distinct
therapeutic targets as the cannabinoid CB1 and CB2 receptors.
Keeping that in mind, we built 3D-QSAR models of selectivity to
CB1 and CB2 using CoMFA and CoMSIA methods, mapping steric,
electrostatic and hydrophobic properties with the goal of achieving
a structure–activity relationship of selectivity within the database
of indole ligands.
First, we used the CoMFA methodology in the construction of
steric/electrostatic models of selectivity for both subtypes of
receptors. Since the least selective molecule for CB1, JWH-120 (12,
pKi
CB1sel
¼
0.728) has proven to be an outlier for failing to show
a structure–activity relationship with the database used in the
study of 3D-QSAR, it has been left out of the visual inspection and
the contour maps of the best CoMFA model generated with selec-
tivity data for CB1 surround the second least CB1-selective mole-
cule JWH-265 (43, pKi
CB1sel
¼
0.764) and the most selective
molecule of the data set for CB1, JWH-081 (9, pKi
CB1sel
¼
1.128, in
purple), displayed in
Fig. 10
. Compound JWH-081 (9) showed
favorable interactions in the both steric and electrostatic fields,
involving the ethyl group in the R
4
position of the naphthyl ring and
the n-pentyl group connected to the indole ring.
Unlike the previously mentioned ligand, JWH-081 (9),
compound JWH-265 (43) lacks favorable interactions and makes an
additional unfavorable interaction through the methoxy group
present in the R
3
position of the naphthyl ring (
Fig. 10
). This result
corroborates the difference in selectivity observed between both
ligands, with a CB1/CB2 pKi ratio equal to 0.364 (
Table 1
). Moreover,
the visual inspection of the CoMFA/CoMSIA steric and CoMSIA
hydrophobic models built for CB1 and CB2 ligands has revealed an
unfavorable field around the R
2
position of the indole ring in the
CB1 affinity model that is not present in the model of affinity
towards CB2. Thus, 3D-QSAR studies have shown that the intro-
duction of substituents in that position would decrease affinity to
CB1 receptors. Differently, it has no importance for the affinity of
indole ligands to CB2 receptors. Compounds JWH-149 (15, pKi
CB1/
CB2 ratio
¼
0.909), JWH-148 (14, pKi
CB1/CB2 ratio
¼
0.880), JWH-211
(28, pKi
CB1/CB2 ratio
¼
0.903), JWH-213 (30, pKi
CB1/CB2 ratio
¼
0.941),
JWH-189 (26, pKi
CB1/CB2 ratio
¼
0.919), JWH-241 (36, pKi
CB1/CB2
ratio
¼
0.935), JWH-046 (4, pKi
CB1/CB2 ratio
¼
0.829), JWH-236 (33,
pKi
CB1/CB2 ratio
¼
0.887), JWH-268 (45, pKi
CB1/CB2 ratio
¼
0.792) and
JWH-094 (10, pKi
CB1/CB2 ratio
¼
0.901) are the examples of indole
derivatives that bear a methyl group in the above mentioned
position which, as predicted by the models, have demonstrated
a higher affinity towards CB2 in comparison to CB1. Nevertheless,
this is only true with analogues that have naphthyl and not more
flexible aryl rings bound to the indole nucleus.
We may hypothesize that this effect is due to a larger steric
repulsion between the naphthyl ring and the methyl group at R
2
,
leading to a secondary bioactive conformation that is more favor-
able for recognition by amino acid residues in CB2 than CB1
receptors. Since the side chain with other simplified aryl rings is
Fig. 11.
Plots of observed versus predicted pKi values for the selectivity model towards
CB1 for ligands used as training (in black) and test (in white) sets.
Fig. 12.
Steric (a) and electrostatic (b) contour maps from the best CoMFA selectivity model towards CB2 receptors. Compounds JWH-265 (in purple) and JWH-081 are shown inside
the fields. (For interpretation of the references to colour in this figure legend, the reader is referred to the web version of this article.)
G.B.L. De Freitas et al. / European Journal of Medicinal Chemistry 44 (2009) 2482–2496
2493

more flexible, the referred bioactive conformation may not be so
favored at the target bioreceptor.
The selectivity model for CB1 showed significant statistical
values (
Table 5
), in addition to demonstrating good correlation to
the experimental selectivity obtained using CB1/CB2 pKi ratio. The
observed versus predicted selectivity values are shown in
Table 6
and
Fig. 11
shows the plot of observed versus predicted pKi for the
training set and the test set obtained through quantitative analysis
of the model.
Aiming to correlate and validate the models of selectivity built
using the CB1/CB2 pKi ratio; we also built models inverting the
CB2/CB1 pKi ratio, with the goal of checking if there was a qualita-
tive reversal of the steric and electrostatic contour maps. In this
process, we used the same molecules employed in the model
above. However, this time the second molecule of greater selec-
tivity was JWH-265 (43, in purple) and lowest was JWH-081 (9).
Compound JWH-265 (43) showed favorable interactions in the
both steric (
Fig. 12
a) and electrostatic (
Fig. 12
b) maps with the
methoxy group in the R
3
position of the naphthyl ring. Moreover, it
did not occupy unfavorable regions in the maps, unlike compound
JWH-081 (9) that has the methoxy group in the R
4
position of the
naphthyl ring in an unfavorable region, decreasing its selectivity.
The comparison between selectivity models for CB1/CB2 and
CB2/CB1 has provided a qualitative analysis through the visual
inspection of the contour maps that revealed inverted fields
(
Fig. 12
a and b). That is, in the best CoMFA model for CB1 the
presence of bulky substituents in the R
3
position of the naphthyl
and flexible aryl rings showed to be unfavorable and the same
region turns out to be favorable for naphthyl substitution in the
best CoMFA model for CB2. Therefore, this molecular region is
a probable pharmacophore and may be modified through the
introduction of other different groups aiming at achieving selec-
tivity towards CB2.
This has been observed experimentally with compounds JWH-
265 (43, pKi
CB2/CB1 ratio
¼
1.309) and JWH-268 (45, pKi
CB2/CB1
ratio
¼
1.262), which are significantly selective towards CB2
(
Table 6
). Additionally, the analysis of the CoMFA/CoMSIA electro-
static and CoMSIA hydrophobic models for CB1 ligand affinity
shows few regions that are favorable to the introduction of elec-
tron-rich groups. However, the electrostatic contour map of selec-
tivity for CB2 shows red fields surrounding the X
3
position of the
benzylcarbonyl subunit and the R
2
, R
4
and R
6
positions of the
naphthyl ring, favorable to the introduction of electron-rich groups.
In conclusion, structural variation around these positions may be
modulating selectivity towards CB2 receptor subtype.
The statistical values obtained from the best CoMFA model of
selectivity for CB2, as well as the correlation of the experimental
selectivity obtained using the CB2/CB1 pKi ratio versus predicted
pKi, are presented in
Tables 5 and 6
. The plot of CoMFA steric/
electrostatic selectivity model for CB2 showing the selectivity
values obtained experimentally for the ligands from the training
and test sets correlated to their predicted values is presented in
Fig. 13
.
As we had done in the CoMFA analysis, in the CoMSIA analysis
we built models using CB1/CB2 CB2/CB1 pKi ratio, with the goal of
checking if there was a qualitative reversal of the hydrophobic
contour maps (
Fig. 14
) that could help design selective CB1 or CB2
ligands based on that property.
As observed in the CoMFA analysis and construction of selec-
tivity models for CB1/CB2 and CB2/CB1, the visual inspection of the
hydrophobic contour maps revealed inverted fields (
Fig. 14
a and b).
In the hydrophobic contour map for CB1 (
Fig. 14
a), the same two
compounds described in CoMFA selectivity models are illustrated:
JWH-081 (9) and JWH-265 (43) being the highest and second
lowest selectivity for CB1/CB2, respectively.
The oxygen atom present in the methoxy group at R
4
position of
the naphthyl ring of the ligand JWH-081 (9) is close to a region of
the hydrophobic contour map where the presence of polar groups
increases the selectivity towards CB1. On the contrary, with JWH-
Fig. 13.
Plots of observed versus predicted pKi values for the model of selectivity
towards CB2 for ligands used as training (in black) and test (in white) sets.
Fig. 14.
CoMSIA hydrophobic contour maps of selectivity. (a) Compounds JWH-081, in blue, and JWH-265 for CB1 and (b) JWH-265, in blue, and JWH-081 for CB2 are shown inside
fields. Purple regions (80% contribution) indicate areas where hydrophobic groups increase activity and white regions (20% contribution) indicate areas where hydrophobic groups
decrease activity. (For interpretation of the references to colour in this figure legend, the reader is referred to the web version of this article.)
G.B.L. De Freitas et al. / European Journal of Medicinal Chemistry 44 (2009) 2482–2496
2494
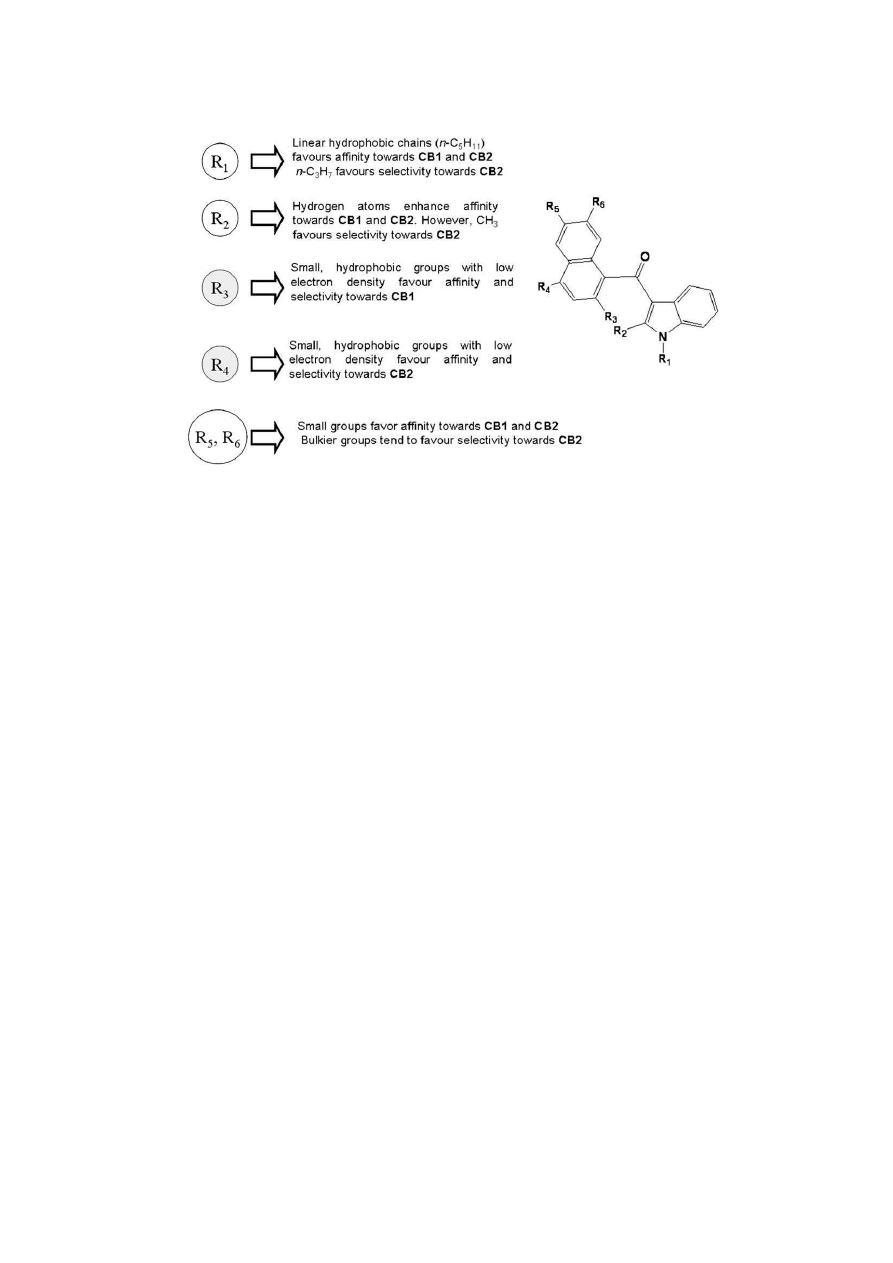
265 (43) the oxygen atom of the methoxy group in R
3
position of
the naphthyl ring is close to a region of the hydrophobic contour
map which is unfavorable to polar groups. This result, in conjunc-
tion to all the other analyses, emphasizes again that the substitu-
tion pattern in the R
2
position of the indole ring may be modulating
ligand selectivity towards CB2 (
Fig. 14
b), as well as the presence of
hydrophobic or hydrophilic substituents in the R
2
and R
4
positions
of the naphthyl ring, respectively.
The statistical values obtained from the best CoMSIA model of
selectivity for CB2, as well as the correlation of the experimental
selectivity obtained using the CB2/CB1 pKi ratio versus predicted
pKi, are presented in
Tables 5 and 6
.
Finally, the work presented herein enabled us to propose the
stereoelectronic regions affecting both affinity and selectivity
towards CB1 and CB2 (
Fig. 15
), which may be relevant for the design
of new indole derivatives selective towards CB1 or CB2 with good
potency and with a safer pharmacotherapeutic profile.
4. Concluding remarks
In the present study, we examined the 3D-QSAR models (CoMFA
and CoMSIA) of affinity and selectivity of a set of CB1 and CB2
ligands belonging to the indole class. The models have proven to be
statistically robust, with average q
2
of 0.675 and average r
2
of 0.855.
Also, as demonstrated in our study, the developed steric/electro-
static and hydrophobic models helped us to understand the
structural features responsible for the affinity and selectivity of the
indole ligands for both CB1 and CB2 receptors and the discussion
enabled us to propose the stereoelectronic regions affecting these
profiles. Finally, the work may be considered as a powerful tool in
the design of new safer and therapeutically useful structurally
related cannabinoid ligand drugs. It is worth to note the fact that
selectivity assessment for these two receptor subtypes has not been
reported in the literature prior to our work.
Acknowledgements
The authors thank CNPq (Br), FAPERJ (Br), PRONEX-2006 (Br),
and IM-INOFAR (Br, #420.015/05-1) for the financial support and
fellowships (to G.B.L., N.C.R. and C.A.M.F.).
References
[1] A.C. Howlett, F. Barth, T.I. Bonner, G. Cabral, P. Casellas, W.A. Devane,
C.C. Felder, M. Herkenham, K. Mackie, B.R. Martin, R. Mechoulam,
R.G. Pertwee, Pharmacol. Rev. 54 (2002) 161–202.
[2] A.J. Brown, Br. J. Pharmacol. 152 (2007) 567–575.
[3] H.A. Overton, A.J. Babbs, S.M. Doel, M.C.T. Fyfe, L.S. Gardner, G. Griffin,
H.C.
Jackson,
M.J.
Procter,
C.M.
Rasamison,
M.
Tang-Christensen,
P.S. Widdowson, G.M. Williams, C. Reynet, Cell Metab. 3 (2006) 167–175.
[4] L.A. Matsuda, S.J. Lolait, M.J. Brownstein, A.C. Young, T.I. Bonner, Nature 346
(1990) 561–564.
[5] J.W. Huffman, J.A.H. Lainton, Curr. Med. Chem. 3 (1996) 101–116.
[6] R.G. Pertwee, Curr. Med. Chem. 6 (1999) 635–664.
[7] S. Galiegue, S. Mary, J. Marchand, D. Dussossoy, D. Carriere, P. Carayon,
M. Bouaboula, D. Shire, G. Le Fur, P. Casellas, Eur. J. Biochem. 232 (1995) 54–61.
[8] A. Wise, K. Gearing, S. Rees, Drug Discov. Today 7 (2002) 235–246.
[9] P.H. Reggio, Curr. Pharm. Des. 9 (2003) 1607–1633.
[10] C.C. Felder, K.E. Joyce, E.M. Briley, J. Mansouri, K. Mackie, O. Blond, Y. Lai,
A.L. Ma, R.L. Mitchell, Mol. Pharmacol. 48 (1995) 443–450.
[11] T. Tuccinardi, P.L. Ferrarini, C. Manera, G. Ortore, G. Saccomanni, A. Martinelli,
J. Med. Chem. 49 (2006) 984–994.
[12] R.G. Pertwee, Prog. Neurobiol. 63 (2001) 569–611.
[13] R.G. Pertwee, Pharmacol. Ther. 95 (2002) 165–174.
[14] R.G. Pertwee, Addiction 94 (1999) 317–320.
[15] R.G. Pertwee, Addict. Biol. 5 (2000) 37–46.
[16] D. Piomelli, A. Giuffrida, A. Calignano, F. Rodriguez de Fonseca, Trends Phar-
macol. Sci. 21 (2000) 218–224.
[17] M.E. Abood, B.R. Martin, Trends Pharmacol. Sci. 13 (1992) 201–206.
[18] M. Rinaldi-Carmona, F. Barth, M. He´aulme, D. Shire, B. Calandra, C. Congy,
S. Martinez, J. Maruani, G. Ne´liat, D. Caput, P. Ferrara, P. Soubrie´, J.C. Brelie`re,
G. Le Fur, FEBS Lett. 350 (1994) 240–244.
[19] Z.H. Song, T.I. Bonner, Mol. Pharmacol. 49 (1996) 891–896.
[20] S.D. McAllister, G. Rizvi, S. Anavi-Goffer, D.P. Hurst, J. Barnett-Norris,
D.L. Lynch, P.H. Reggio, M.E. Abood, J. Med. Chem. 46 (2003) 5139–5152.
[21] Z.H. Song, C.A. Slowey, D.P. Hurst, P.H. Reggio, Mol. Pharmacol. 56 (1999)
834–840.
[22] J.Y. Shim, E.R. Collantes, W.J. Welsh, B. Subramaniam, A.C. Howlett,
M.A. Eissenstat, S.J. Ward, J. Med. Chem. 41 (1998) 4521–4532.
[23] A.R. Keimowitz, B.R. Martin, R.K. Razdan, P.J. Crocker, S.W. Mascarella,
B.F. Thomas, J. Med. Chem. 43 (2000) 59–70.
[24] M.E.Y. Francisco, H.H. Seltzman, A.F. Gilliam, R.A. Mitchell, S.L. Rider,
R.G. Pertwee, L.A. Stevenson, B.F. Thomas, J. Med. Chem. 45 (2002) 2708–2719.
[25] S. Durdagi, A. Kapou, T. Kourouli, T. Andreou, S.P. Nikas, V.R. Nahmias,
D.P. Papahatjis, M.G. Papadopoulos, T. Mavromoustakos, J. Med. Chem. 50
(2007) 2875–2885.
[26] J.Y. Shim, W.J. Welsh, E. Cartier, J.L. Edwards, A.C. Howlett, J. Med. Chem. 45
(2002) 1447–1459.
[27] J.Z. Chen, X.W. Han, Q. Liu, A. Makriyannis, J. Wang, X.Q. Xie, J. Med. Chem. 49
(2006) 625–636.
[28] O.M.H. Salo, J.R. Savinainen, T. Parkkari, T. Nevalainen, M. Lahtela-Kakkonen,
J. Gynther, J.T. Laitinen, T. Ja¨rvinen, A. Poso, J. Med. Chem. 49 (2006) 554–566.
[29] M. Fichera, G. Cruciani, A. Bianchi, G. Musumarra, J. Med. Chem. 43 (2000)
2300–2309.
Fig. 15.
Structure–affinity/selectivity relationships derived from CoMFA/CoMSIA 3D-QSAR studies developed in this work.
G.B.L. De Freitas et al. / European Journal of Medicinal Chemistry 44 (2009) 2482–2496
2495

[30] S. Durdagi, M.G. Papadopoulos, D.P. Papahatjis, T. Mavromoustakos, Bioorg.
Med. Chem. Lett. 17 (2007) 6754–6763.
[31] W. Tong, E.R. Collantes, W.J. Welsh, J. Med. Chem. 41 (1998) 4207–4215.
[32] J.Y. Shim, A.C. Howlett, J. Chem. Inf. Model. 46 (2006) 1286–1300.
[33] C. Montero, N.E. Campillo, P. Goya, J.A. Pa´ez, Eur. J. Med. Chem. 40 (2005) 75–83.
[34] O.M.H. Salo, M. Lahtela-Kakkonen, J. Gynther, T. Ja¨rvinen, A. Poso, J. Med.
Chem. 47 (2004) 3048–3057.
[35] J.W. Huffman, G. Zengin, M.J. Wu, J. Lu, G. Hynd, K. Bushell, A.L.S. Thompson,
S. Bushell, C. Tartal, D.P. Hurst, P.H. Reggio, D.E. Selley, M.P. Cassidy, J.L. Wiley,
B.R. Martin, Bioorg. Med. Chem. 13 (2005) 89–112.
[36] J.W. Huffman, P.V. Szklennik, A. Almond, K. Bushell, D.E. Selley, H. He,
M.P. Cassidy, J.L. Wiley, B.R. Martin, Bioorg. Med. Chem. Lett.15 (2005) 4110–4113.
[37] L.W. Padgett, Life Sci. 77 (2005) 1767–1798.
[38] D.R. Compton, K.C. Rice, B.R. De Costa, R.K. Razdan, L.S. Melvin, M.R. Johnson,
B.R. Martin, J. Pharmacol. Exp. Ther. 265 (1993) 218–226.
[39] V.M. Showalter, D.R. Compton, B.R. Martin, J. Pharmacol. Exp. Ther. 278 (1996)
989–999.
[40] SPARTAN PRO version 1.0.5, Wavefunction Inc., 18401 Von Karman Avenue,
Suite 370 Irvine, CA 92612, USA, 2006.
[41] T.A. Halgren, J. Am. Chem. Soc. 112 (1990) 4710–4723.
[42] SYBYL version 7.3, Tripos Inc., 1699 South Hanley Road, St. Louis, MO 63144,
USA, 2007.
[43] M. Akamatsu, Curr. Top. Med. Chem. 12 (2002) 1381–1394.
[44] R.D. Cramer, J. Am. Chem. Soc. 110 (1988) 5959–5967.
G.B.L. De Freitas et al. / European Journal of Medicinal Chemistry 44 (2009) 2482–2496
2496
Wyszukiwarka
Podobne podstrony:
1 alkyl 2 aryl 4 1 naphthoylpyrroles new high affinity ligands for the cannabinoid CB1 and CB2 recep
influence of the N 1 alkyl chain length of cannabimimetic indoles upon CB1 and CB2 receptor binding
Advanced Methods for Development of Wind turbine models for control designe
Matlab Development of Neural Network Theory for Artificial Life thesis, MATLAB and Java code
Development of Carbon Nanotubes and Polymer Composites Therefrom
Development of a highthroughput yeast based assay for detection of metabolically activated genotoxin
01 [ABSTRACT] Development of poplar coppices in Central and Eastern Europe
Development of wind turbine control algorithms for industrial use
Development of Carbon Nanotubes and Polymer Composites Therefrom
Aspects of the development of casting and froging techniques from the copper age of Eastern Central
EFFECTS OF CAFFEINE AND AMINOPHYLLINE ON ADULT DEVELOPMENT OF THE CECROPIA
Development Of A Single Phase Inverter For Small Wind Turbine
recent developments in the med chem of cannabimimetic indoles pyrroles and indenes curr med chem 12
FIDE Trainers Surveys 2012 08 31 Uwe Bönsch The recognition, fostering and development of chess tale
DESIGN AND DEVELOPMENT OF MICRO TURBINE
więcej podobnych podstron