
Trading with
Trading with
Bollinger Bands
Bollinger Bands
with
with
Toni Turner
Toni Turner
www.
www.
toniturner
toniturner
.com
.com

A Brief Introduction . . .
A Brief Introduction . . .
Toni Turner
Toni Turner
President
President
TrendStar Trading Group, Inc.
TrendStar Trading Group, Inc.
A Beginner’s Guide to Day Trading Online
A Beginner’s Guide to Day Trading Online
A Beginner’s Guide to Short Selling
A Beginner’s Guide to Short Selling
(video)
(video)
A Beginner’s Guide to Short
A Beginner’s Guide to Short
-
-
Term Trading
Term Trading
Website: www.
Website: www.
toniturner
toniturner
.com
.com

How About You?
How About You?
Where are you in your trading career?
Where are you in your trading career?
What time frames do you trade?
What time frames do you trade?
Do you
Do you
use fundamental analysis as a
use fundamental analysis as a
decision support tool?
decision support tool?
Do you use technical analysis as a
Do you use technical analysis as a
primary decision support tool?
primary decision support tool?
Do you currently use Bollinger Bands?
Do you currently use Bollinger Bands?
What additional indicators do you use?
What additional indicators do you use?

Today’s Topic…
Today’s Topic…
Bollinger Bands
Bollinger Bands
Where they are used
Where they are used
Time frames
Time frames
Basic Concepts…how they work
Basic Concepts…how they work
Combining them with other indicators
Combining them with other indicators
What they are
What they are
–
–
Identify price patterns
Identify price patterns
–
–
Confirm trends
Confirm trends
–
–
Locate high
Locate high
-
-
probability setups, entries and
probability setups, entries and
exits
exits

Bollinger Bands
Bollinger Bands
What they are . . .
What they are . . .
Created by John Bollinger in early 1980’s
Created by John Bollinger in early 1980’s
Consist of upper and lower envelopes, or
Consist of upper and lower envelopes, or
bands, plotted in and around the price
bands, plotted in and around the price
pattern of a stock or index
pattern of a stock or index
Expand and contract according to volatility
Expand and contract according to volatility

Bollinger Bands Ask…
Bollinger Bands Ask…
Question: On a relative basis, are
Question: On a relative basis, are
prices high, or low?
prices high, or low?
Answer:
Answer:
–
–
Prices are high at upper band
Prices are high at upper band
–
–
Prices are low at lower band
Prices are low at lower band
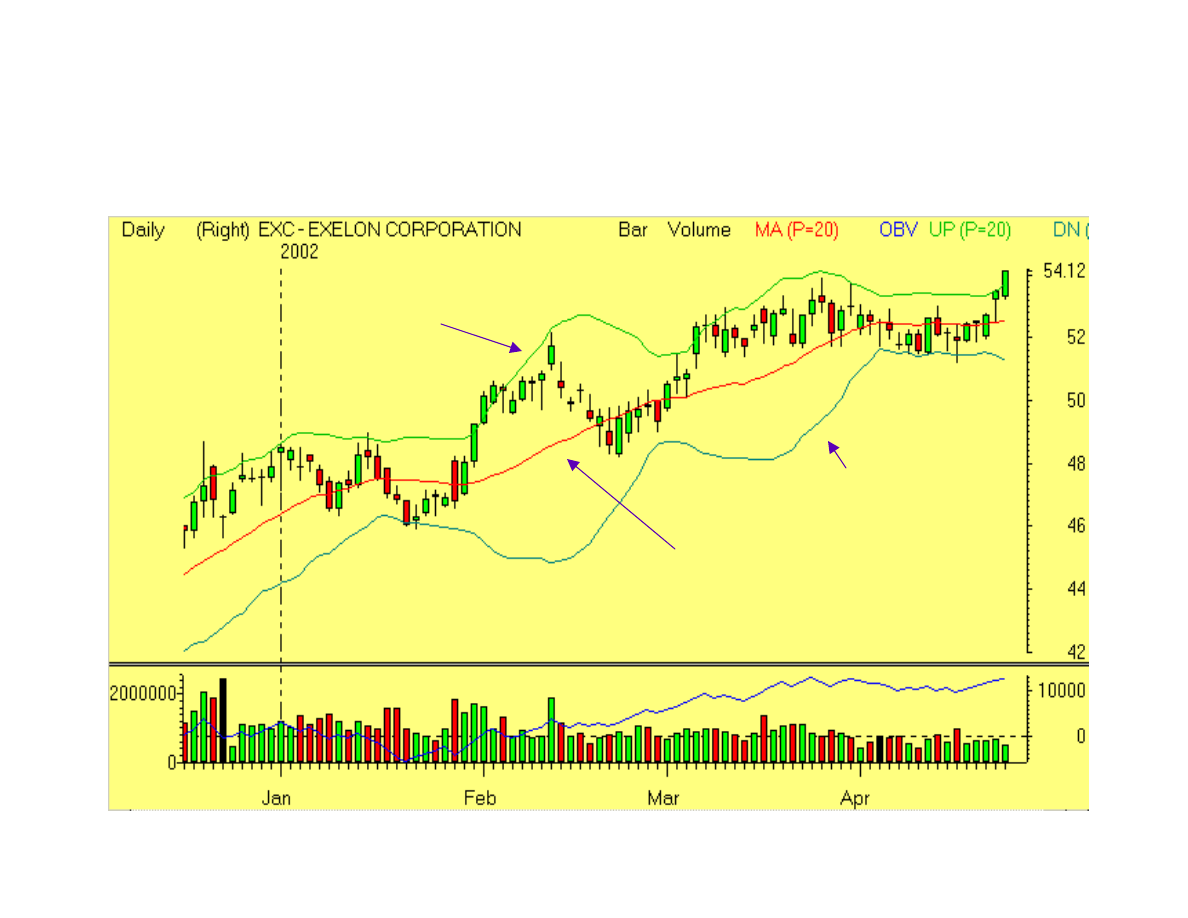
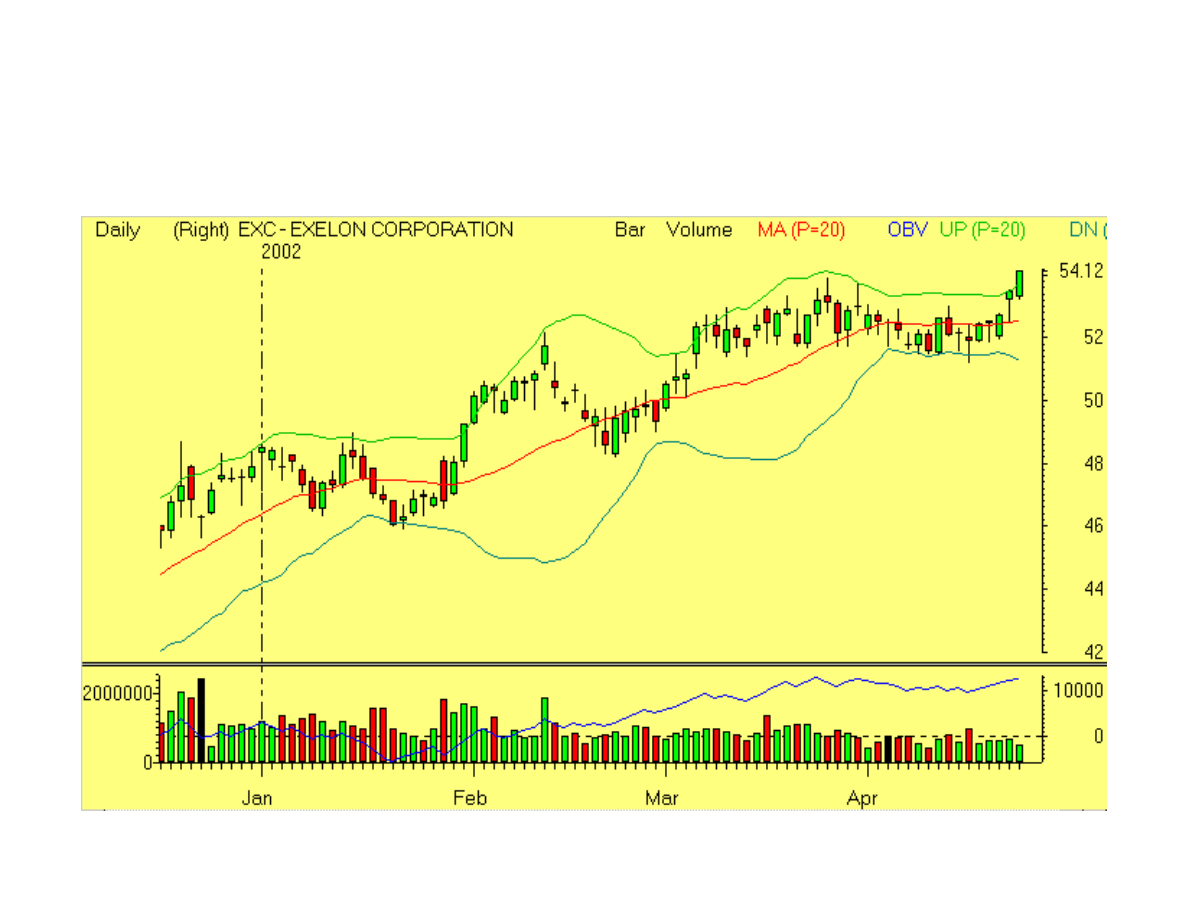
Bollinger Bands
Bollinger Bands
OBV
Upper band
Lower band
20 MA
RealTick graphics used with permission of Townsend Analytics, Ltd. © 1986-2002. All rights reserved.

Bollinger Bands . . .
Bollinger Bands . . .
Base: middle band is usually 20
Base: middle band is usually 20
-
-
period moving
period moving
average.
average.
Upper band: spread above that MA by volatility
Upper band: spread above that MA by volatility
measure known as “standard deviation.” Default
measure known as “standard deviation.” Default
set at 2 standard deviations.
set at 2 standard deviations.
Lower band: middle band less same
Lower band: middle band less same
volatily
volatily
measure.
measure.
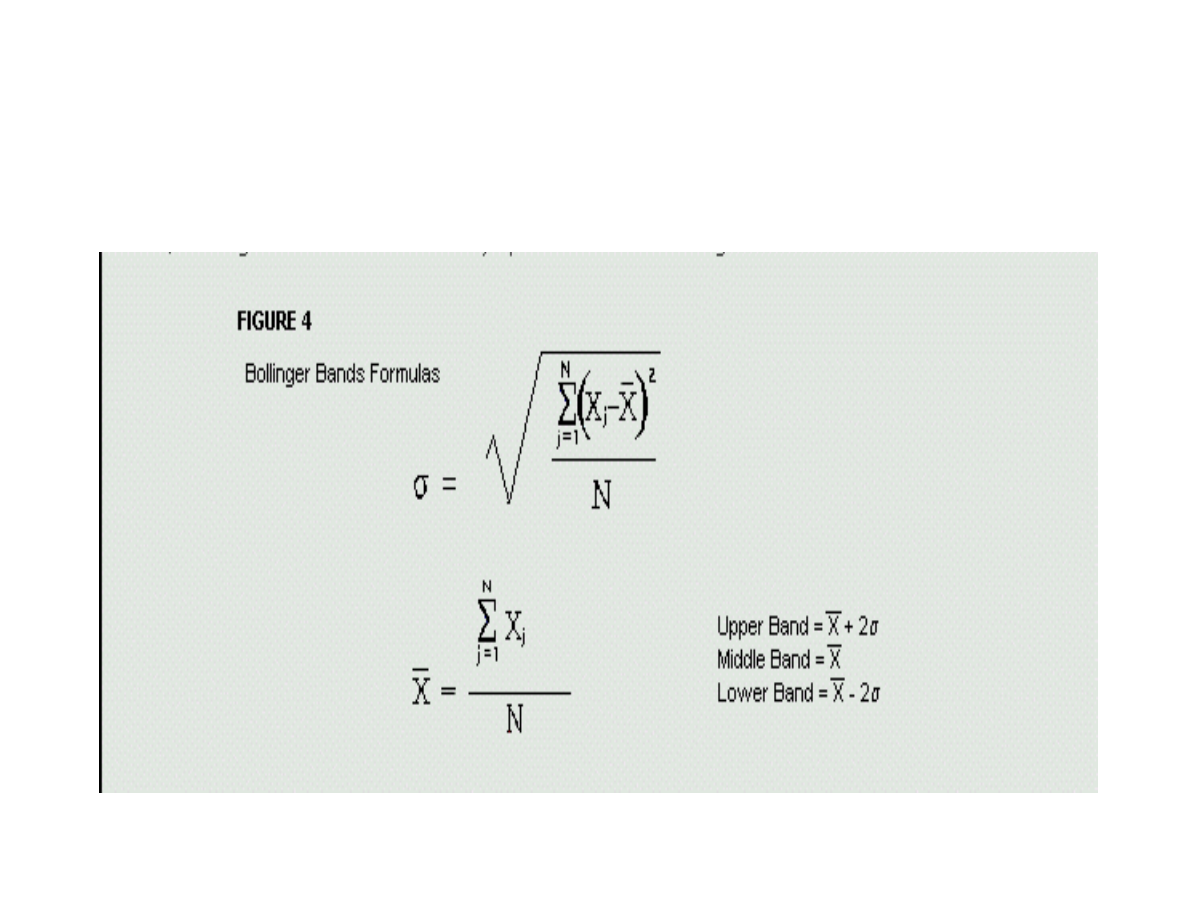
Bollinger Bands…
Bollinger Bands…
the formula
the formula
Let’s Translate That!
Let’s Translate That!
OBV
Upper band
Lower band
Defaults:
• 20-period MA
•Bandwidth = 2 standard deviations
RSI
RealTick graphics used with permission of Townsend Analytics, Ltd. © 1986-2002. All rights reserved.

Bollinger Band Applications . . .
Bollinger Band Applications . . .
Decision Support Tool for: stocks,
Decision Support Tool for: stocks,
indices, options, commodities, financial
indices, options, commodities, financial
futures, currencies, and mutual funds
futures, currencies, and mutual funds
Effective Time Frames: years, quarters,
Effective Time Frames: years, quarters,
months, weeks, days, hours, minutes,
months, weeks, days, hours, minutes,
ticks!
ticks!

Three Primary Uses
Three Primary Uses
Pattern recognition
Pattern recognition
–
–
Recognize double tops, head
Recognize double tops, head
-
-
and
and
-
-
shoulders,
shoulders,
double bottoms
double bottoms
Reversal signals
Reversal signals
–
–
Identify early warning signs of reversals
Identify early warning signs of reversals
Trend analysis
Trend analysis
–
–
Detect trend continuation and conclusion
Detect trend continuation and conclusion

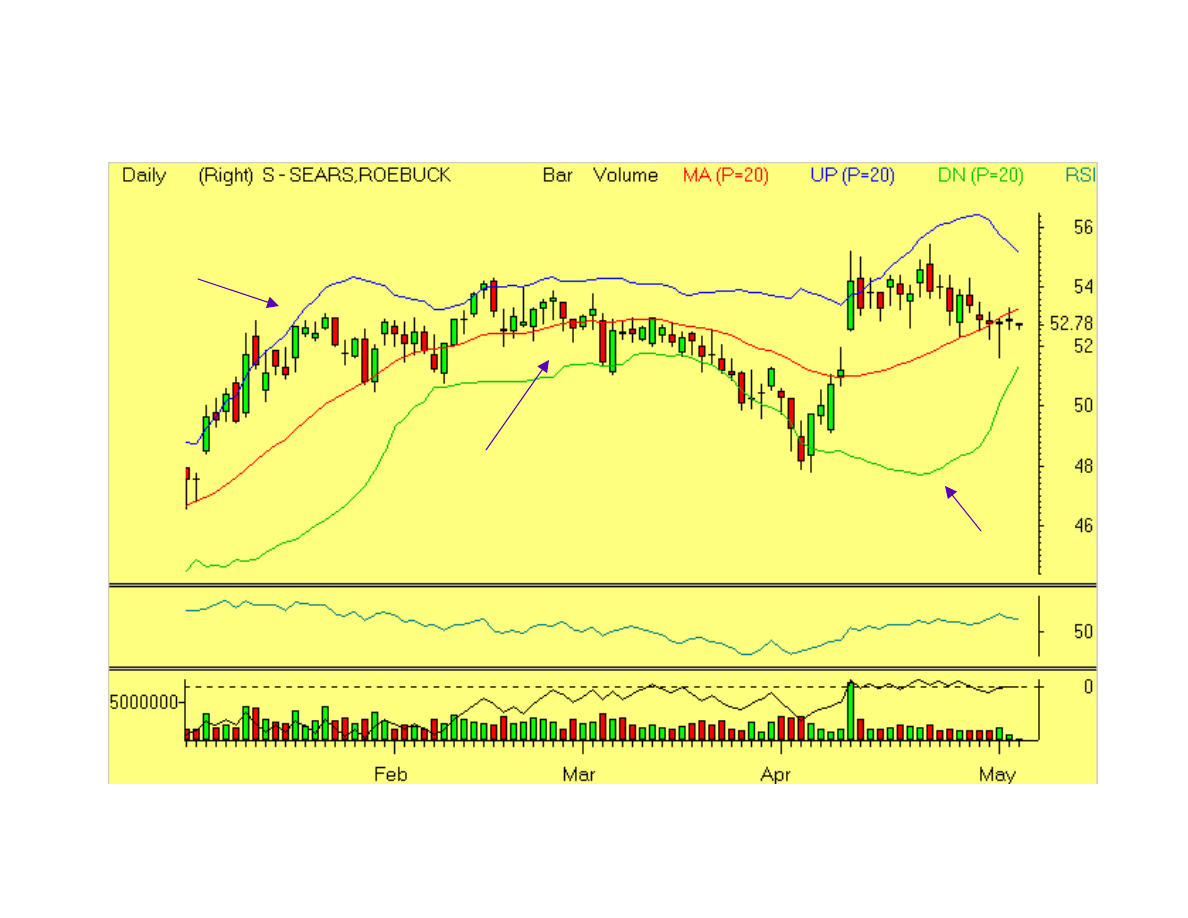
Bollinger Bands (BB)
Bollinger Bands (BB)
Basic Concepts . . .
Basic Concepts . . .
Used to compare price and indicator
Used to compare price and indicator
action to arrive at buy and sell decisions
action to arrive at buy and sell decisions
Confirming indicators should not be
Confirming indicators should not be
directly related to each other
directly related to each other
Price can, and does, walk up the upper BB
Price can, and does, walk up the upper BB
and down the lower BB
and down the lower BB
Basic Concepts
Basic Concepts
RSI
OBV
RealTick graphics used with permission of Townsend Analytics, Ltd. © 1986-2002. All rights reserved.

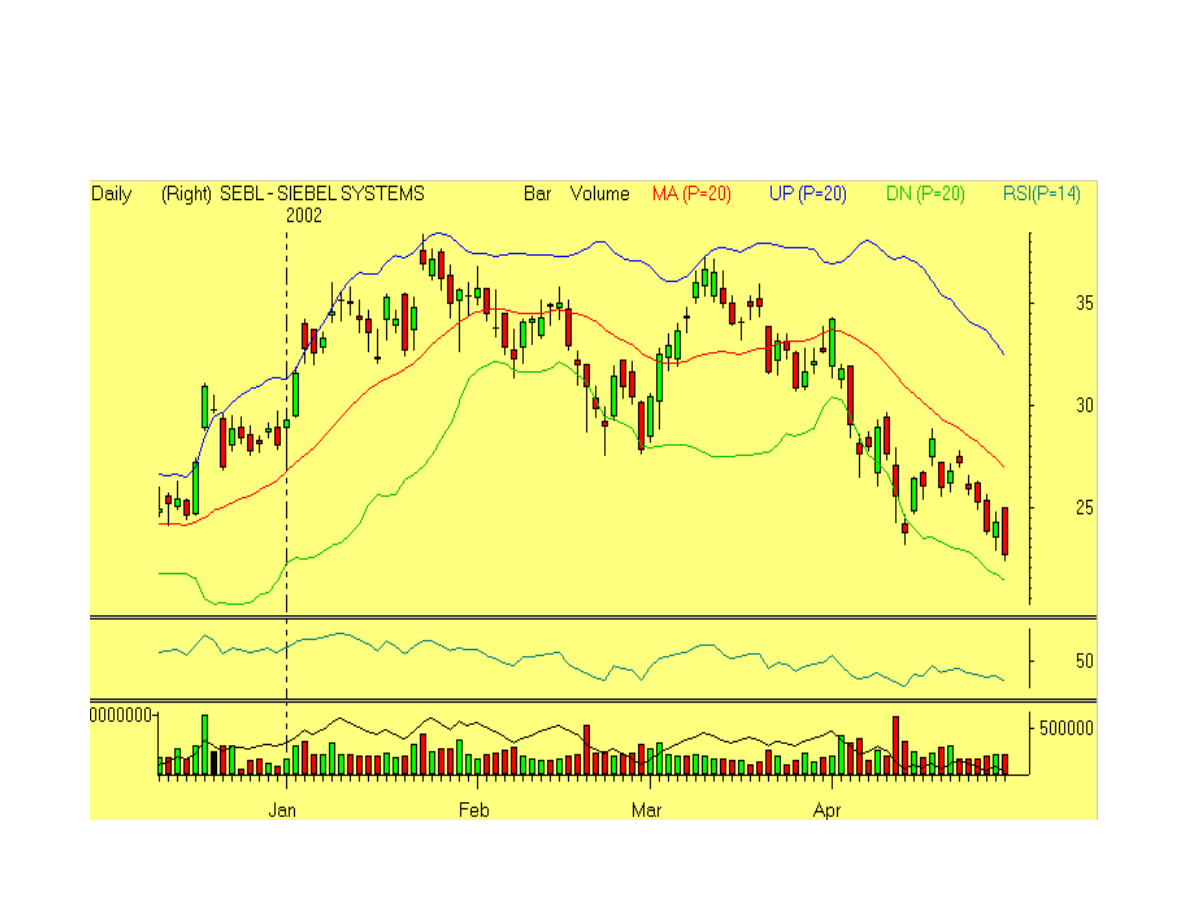
Bollinger Bands (BB)
Bollinger Bands (BB)
Basic Concepts . . . continued
Basic Concepts . . . continued
Tags of bands
Tags of bands
are not necessarily
are not necessarily
buy/sell
buy/sell
signals
signals
Closes outside
Closes outside
BBs
BBs
can be
can be
continuation
continuation
signals
signals
if confirmed by other indicators
if confirmed by other indicators
Contraction (The Squeeze) is followed by
Contraction (The Squeeze) is followed by
Expansion, is followed by Contraction….
Expansion, is followed by Contraction….
Basic Concepts
Basic Concepts
RealTick graphics used with permission of Townsend Analytics, Ltd. © 1986-2002. All rights reserved.

Basic Concepts . . .
Basic Concepts . . .
BBs
BBs
are based on a simple moving
are based on a simple moving
average. Default is 20
average. Default is 20
-
-
period MA with 2
period MA with 2
standard deviations.
standard deviations.
Default contains 95% of price action
Default contains 95% of price action
Works well on most time frames
Works well on most time frames
Longer term: 50
Longer term: 50
-
-
period MA, 2.1 std. dev.
period MA, 2.1 std. dev.
Shorter term: 10
Shorter term: 10
-
-
period MA, 1.9 std. dev.
period MA, 1.9 std. dev.
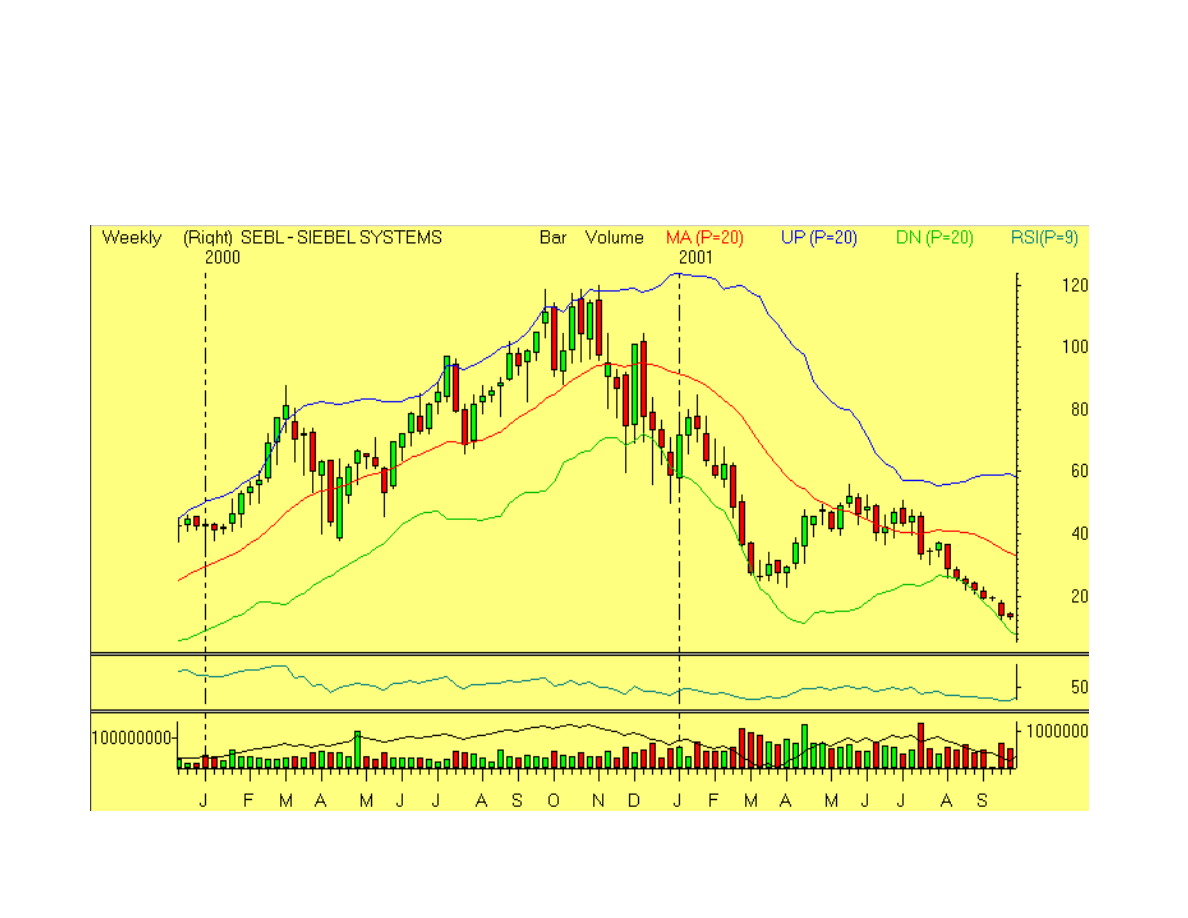
Time Frame: Weekly Chart
Time Frame: Weekly Chart
RealTick graphics used with permission of Townsend Analytics, Ltd. © 1986-2002. All rights reserved.
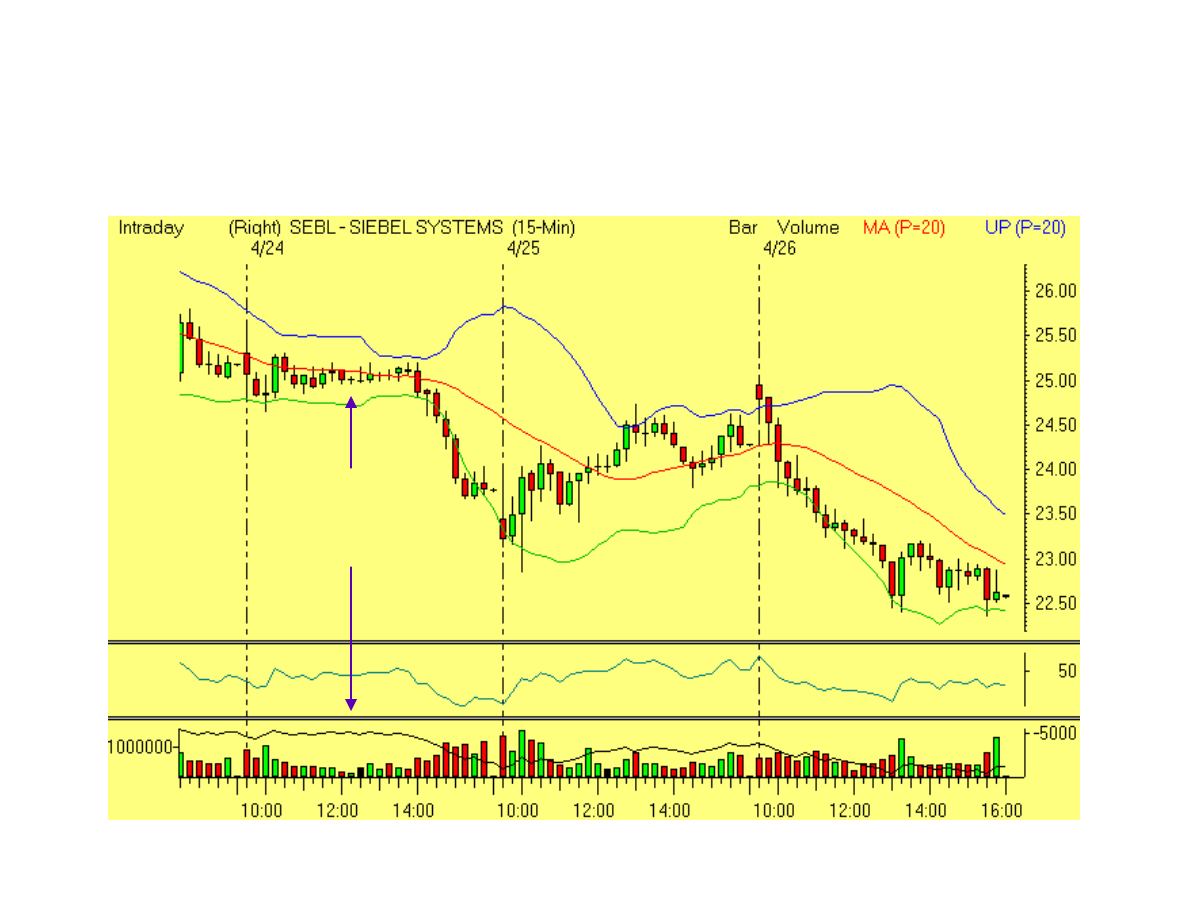
Time Frame: 15
Time Frame: 15
-
-
Minute Chart
Minute Chart
Gulp!
Check out
volume
RealTick graphics used with permission of Townsend Analytics, Ltd. © 1986-2002. All rights reserved.
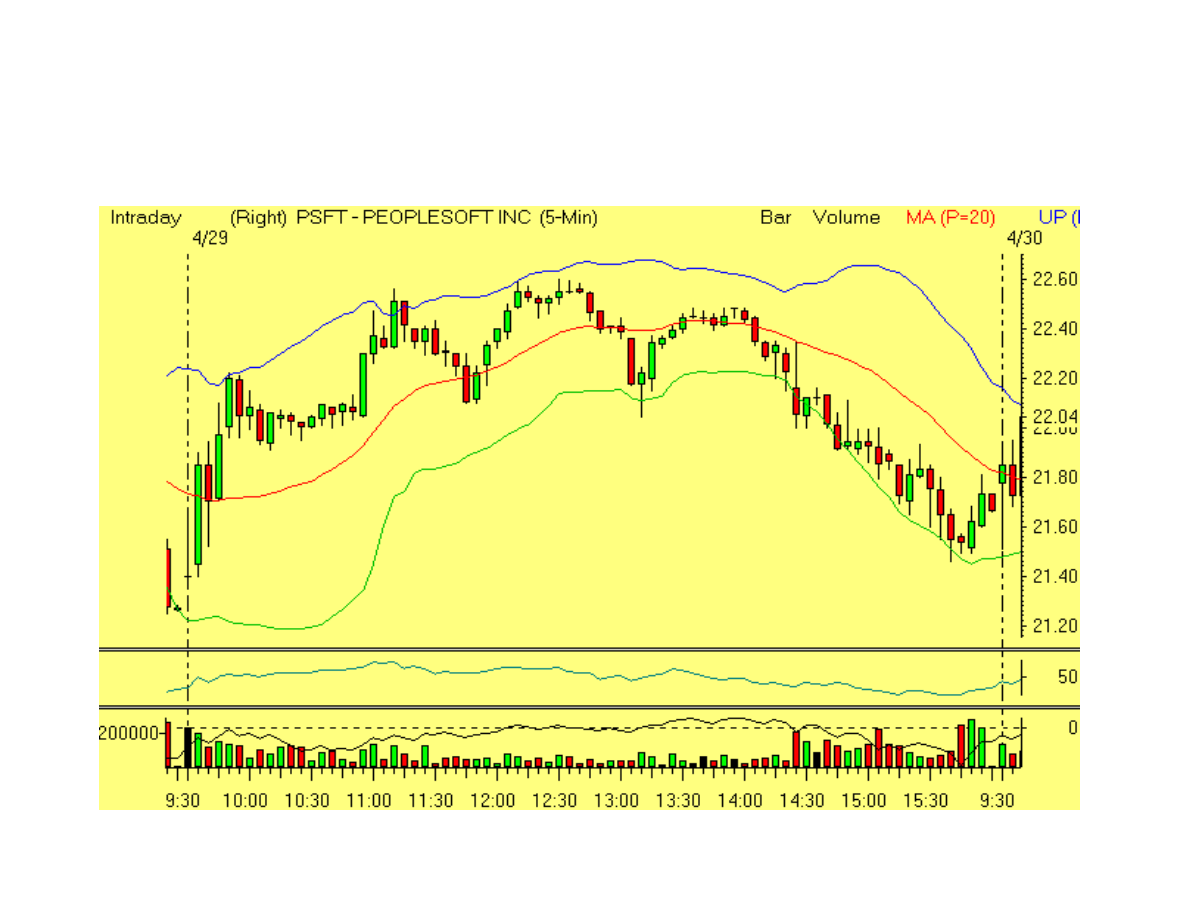
Time Frame: 5
Time Frame: 5
-
-
Minute Chart
Minute Chart
Gulp!
Check out
volume
Head-and-Shoulders
RealTick graphics used with permission of Townsend Analytics, Ltd. © 1986-2002. All rights reserved.

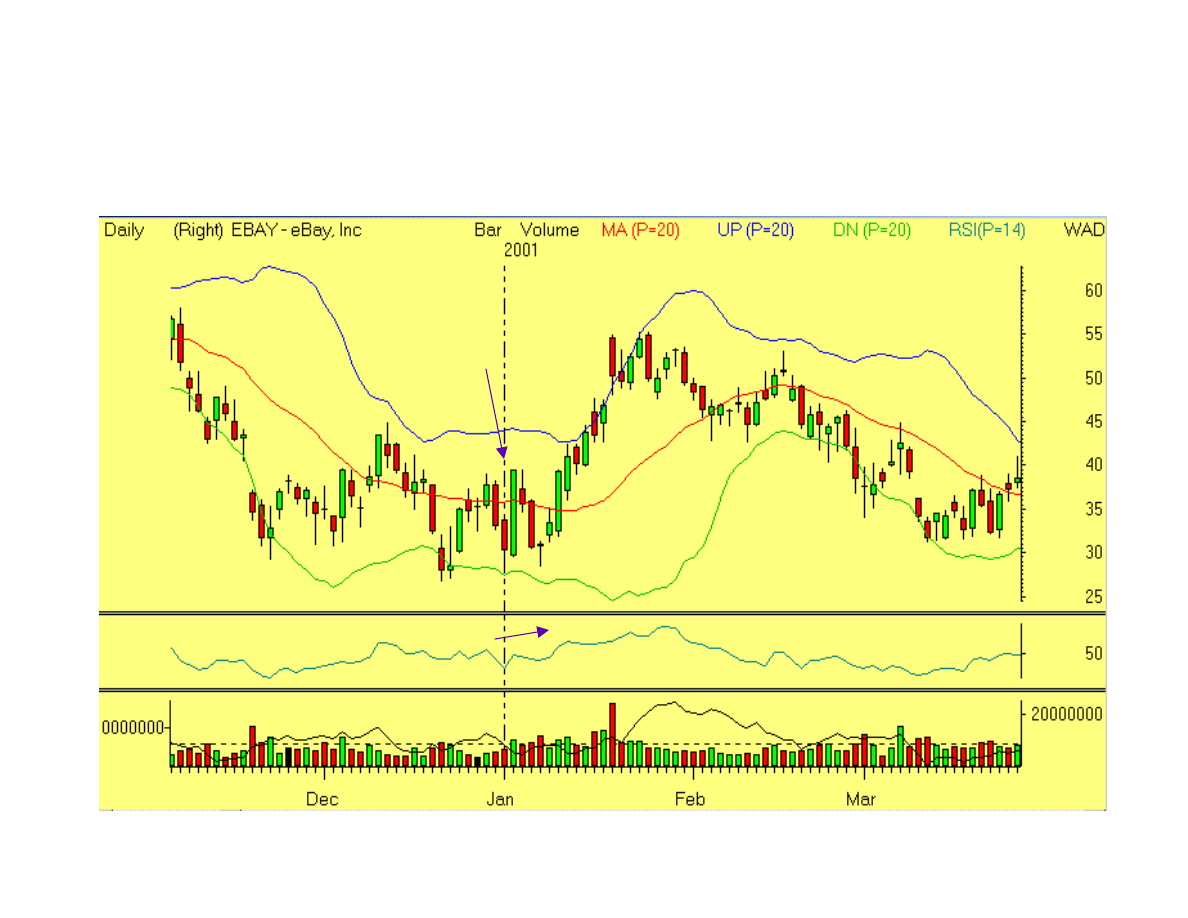
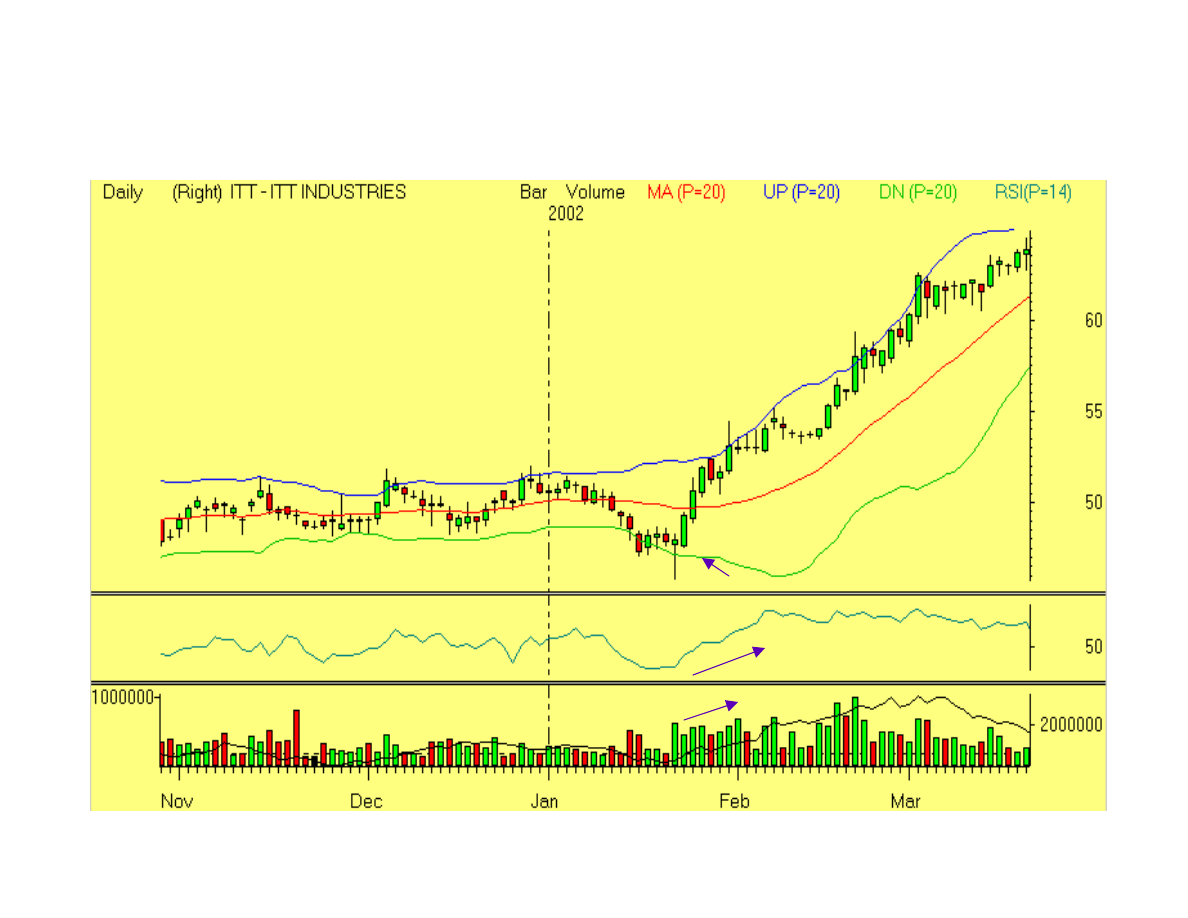
Strategy:
Strategy:
Double Bottom
Double Bottom
-
-
Bottom
Bottom
Fishing
Fishing
Locate stock basing by forming a double
Locate stock basing by forming a double
bottom (time frame
bottom (time frame
—
—
your choice).
your choice).
First bottom may penetrate lower BB.
First bottom may penetrate lower BB.
Second bottom
Second bottom
may be lower
may be lower
than prior
than prior
bottom (!), but
bottom (!), but
may not penetrate
may not penetrate
band.
band.

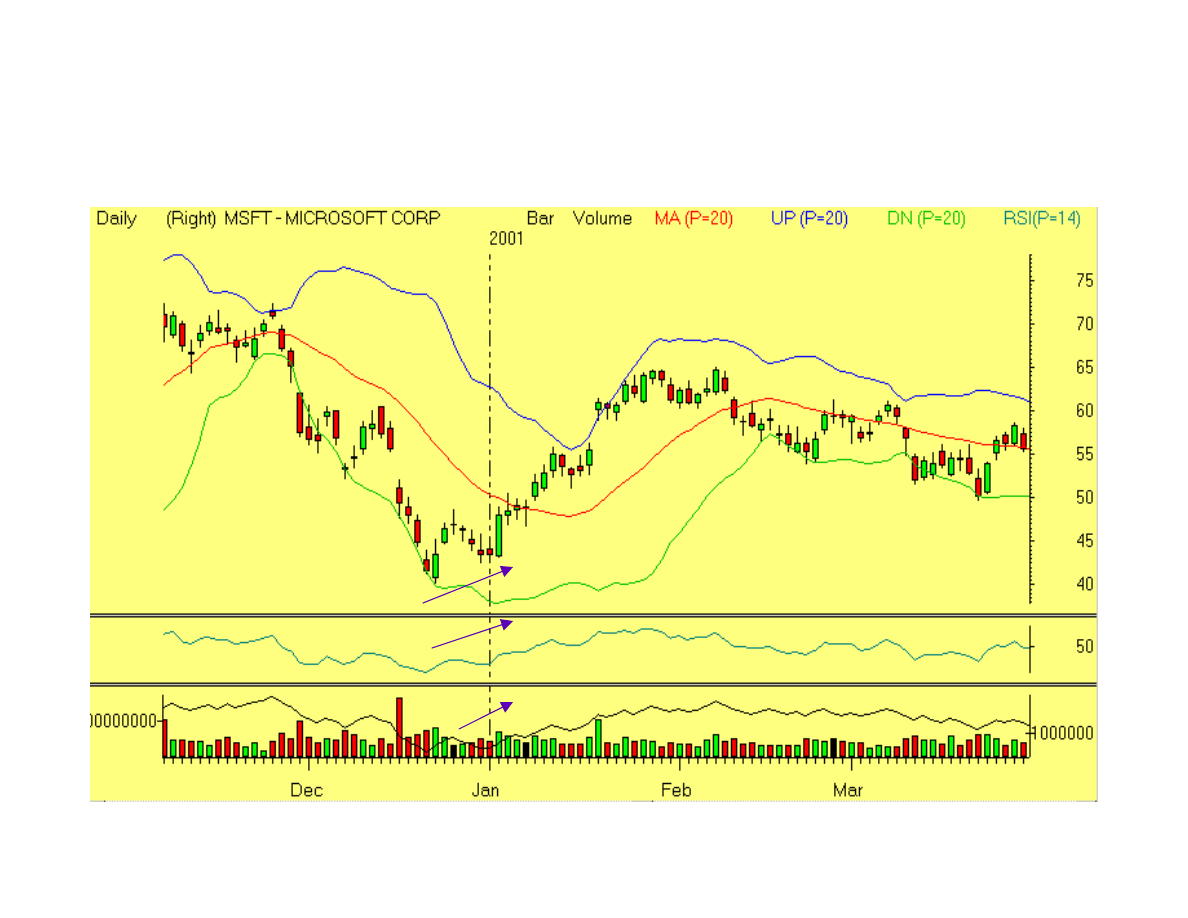
Strategy:
Strategy:
Double Bottom
Double Bottom
-
-
Bottom
Bottom
Fishing
Fishing
Other indicators must show bullish
Other indicators must show bullish
divergence.
divergence.
Confirming break to upside must be on
Confirming break to upside must be on
high volume.
high volume.
Place protective stop just below recent
Place protective stop just below recent
bottom.
bottom.
Double Bottom
Double Bottom
-
-
Bottom Fishing
Bottom Fishing
10 point day!
RealTick graphics used with permission of Townsend Analytics, Ltd. © 1986-2002. All rights reserved.
Double Bottom
Double Bottom
-
-
Bottom Fishing
Bottom Fishing
RealTick graphics used with permission of Townsend Analytics, Ltd. © 1986-2002. All rights reserved.

Shorting Strategy: Double Top
Shorting Strategy: Double Top
Head
Head
-
-
and
and
-
-
Shoulders
Shoulders
Locate stock forming Double (or Triple)
Locate stock forming Double (or Triple)
Top, or Head
Top, or Head
-
-
and
and
-
-
Shoulders
Shoulders
First top, or left shoulder + head, will
First top, or left shoulder + head, will
penetrate upper BB
penetrate upper BB
Second top, or right shoulder,
Second top, or right shoulder,
may not
may not
penetrate
penetrate
upper band
upper band

Shorting Strategy: Double Top
Shorting Strategy: Double Top
Head
Head
-
-
and
and
-
-
Shoulders
Shoulders
Additional indicators show bearish divergence
Additional indicators show bearish divergence
Double Top
Double Top
–
–
Second pivot: Sell short as stock falls below
Second pivot: Sell short as stock falls below
low of
low of
high day
high day
–
–
Final leg: Sell fall of fall below middle pivot of “M,”
Final leg: Sell fall of fall below middle pivot of “M,”
or support area
or support area
–
–
Low risk: Wait for throwback rally to fail
Low risk: Wait for throwback rally to fail
Head
Head
-
-
and
and
-
-
Shoulders
Shoulders
–
–
Sell short as stock breaks neckline
Sell short as stock breaks neckline
–
–
Low risk: Wait for throwback rally to fail
Low risk: Wait for throwback rally to fail
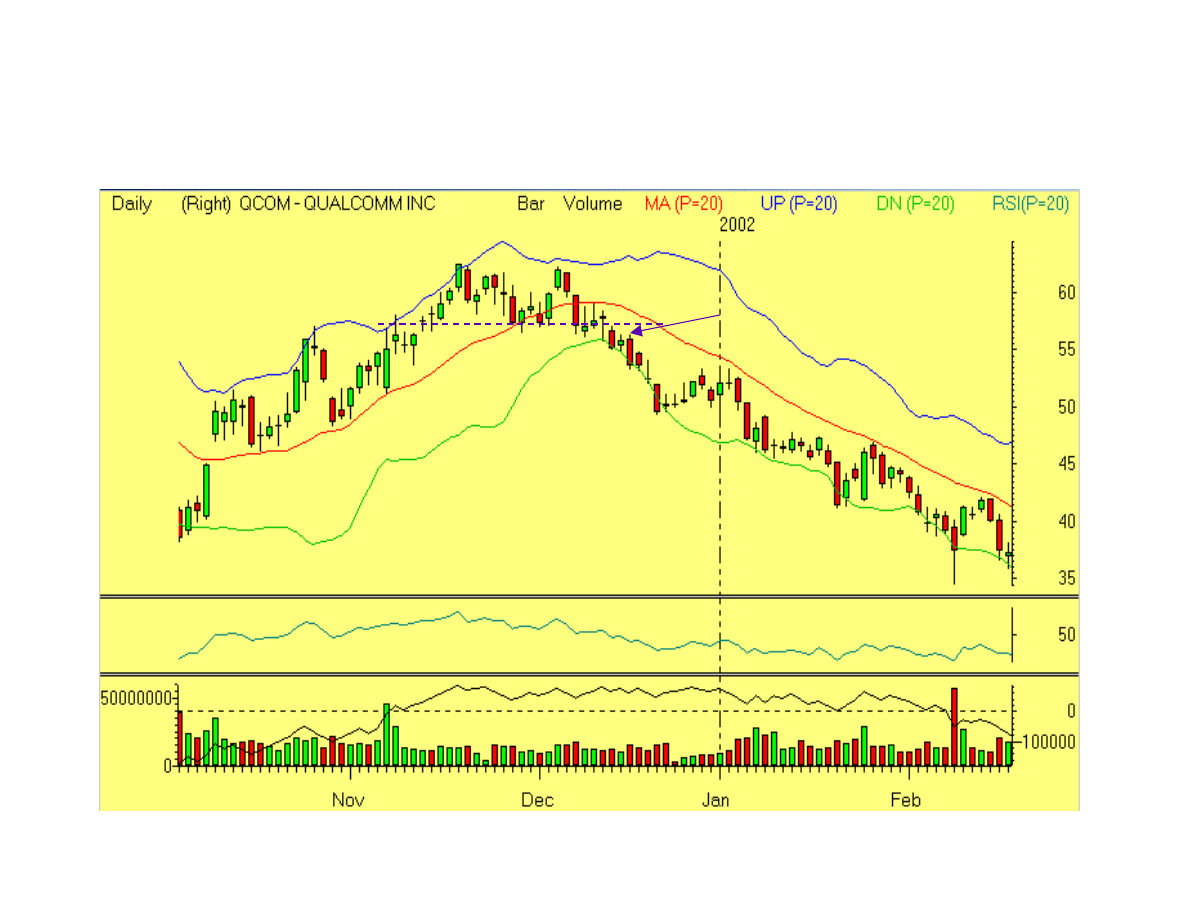
Sell Short Double Top
Sell Short Double Top
Throwback rally
RealTick graphics used with permission of Townsend Analytics, Ltd. © 1986-2002. All rights reserved.
Sell Short Head
Sell Short Head
-
-
and
and
-
-
Shoulders
Shoulders
Tag
No tag
RealTick graphics used with permission of Townsend Analytics, Ltd. © 1986-2002. All rights reserved.
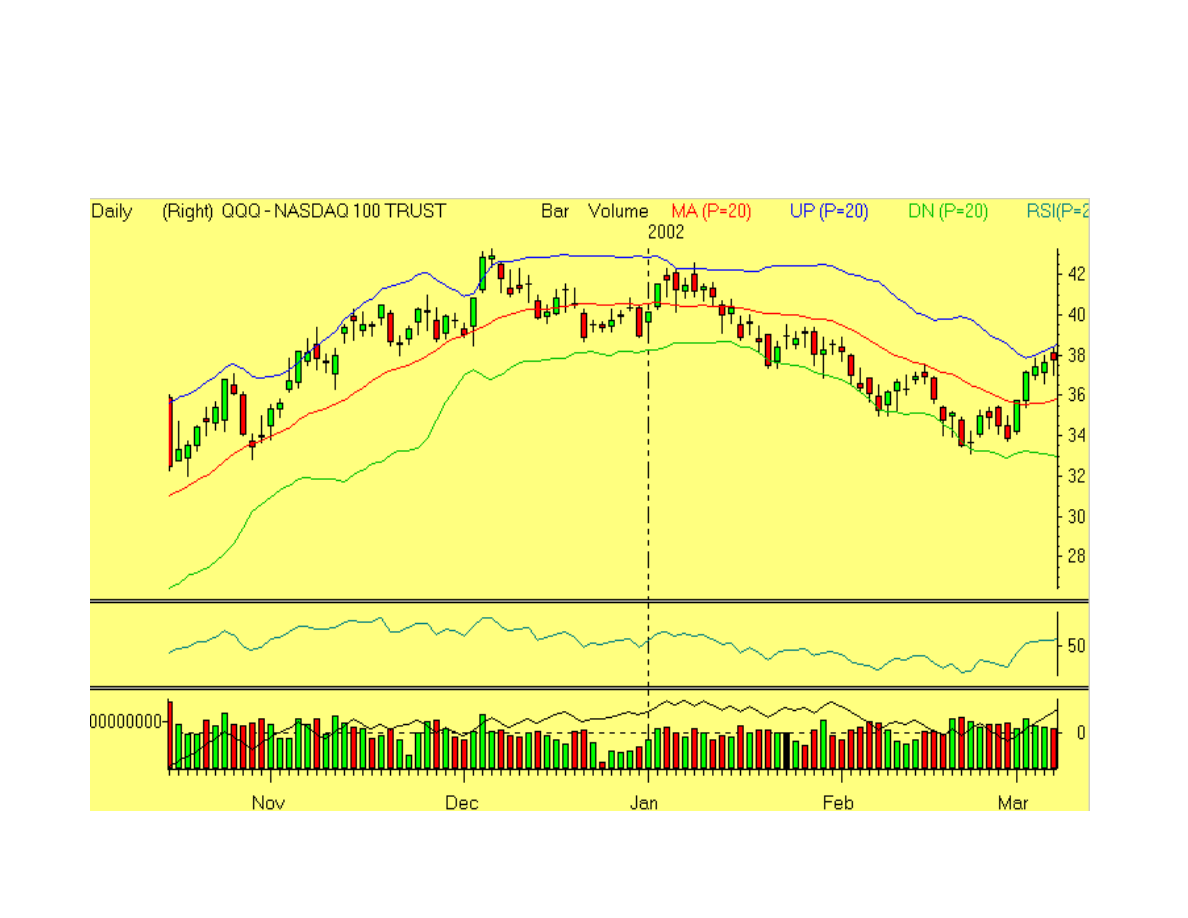
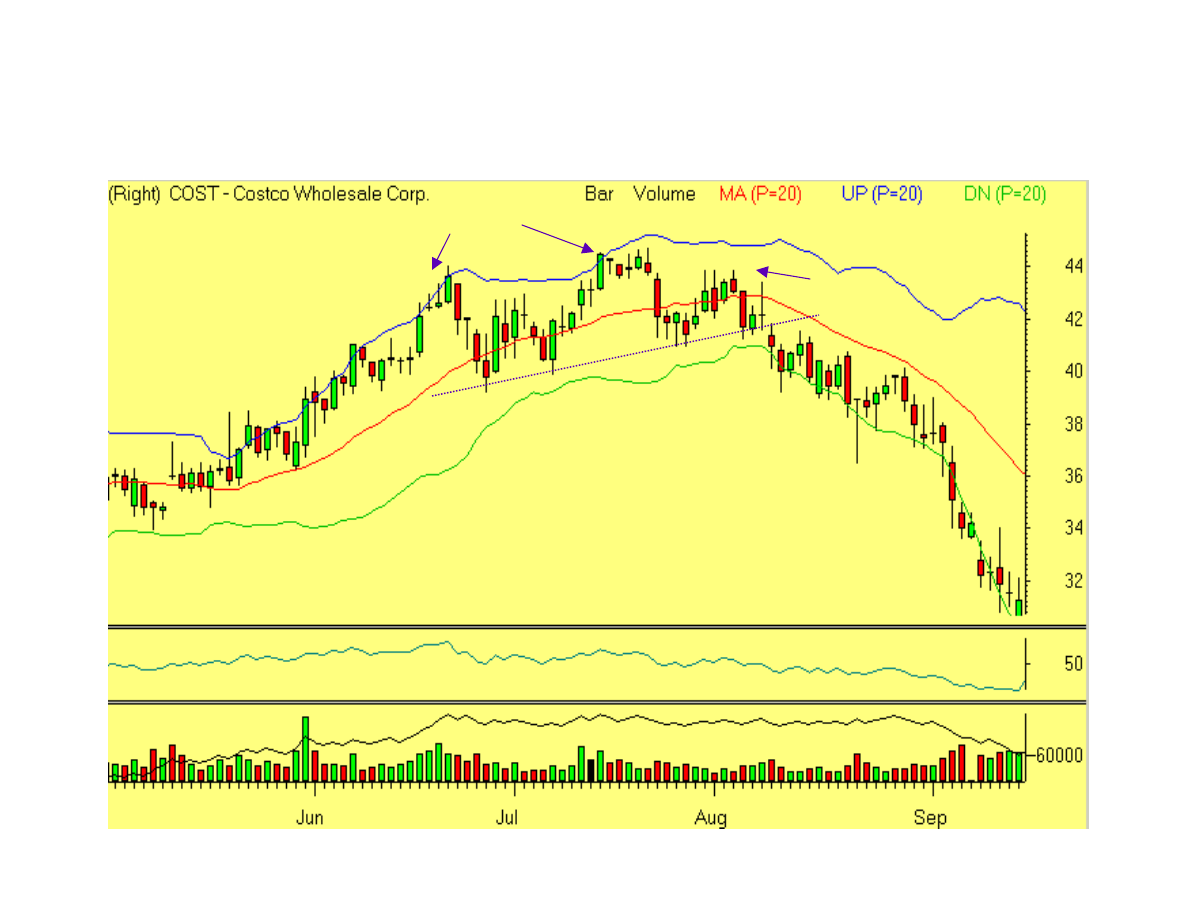
Strategy:
Strategy:
Identify Market Tops
Identify Market Tops
RealTick graphics used with permission of Townsend Analytics, Ltd. © 1986-2002. All rights reserved.

Strategy:
Strategy:
Play “The Squeeze”
Play “The Squeeze”
Locate a stock in a “tight Squeeze”
Locate a stock in a “tight Squeeze”
Identify prevailing trend
Identify prevailing trend
Scan additional indicators to prepare for
Scan additional indicators to prepare for
possible entry
possible entry
Once in, set trailing stop
Once in, set trailing stop
Play “The Squeeze”
Play “The Squeeze”
Head Fake!
Yesssssssss!
RealTick graphics used with permission of Townsend Analytics, Ltd. © 1986-2002. All rights reserved.

In Conclusion . . .
In Conclusion . . .
Bollinger Bands help you, the trader
Bollinger Bands help you, the trader
and/or investor, to identify price patterns,
and/or investor, to identify price patterns,
trend direction, and reversals.
trend direction, and reversals.
This knowledge aids you in placing well
This knowledge aids you in placing well
-
-
thought out, disciplined, low
thought out, disciplined, low
-
-
risk trades.
risk trades.
Remember…your first priority is
Remember…your first priority is
always
always
to
to
conserve your capital!
conserve your capital!
Document Outline
- Trading withBollinger Bands
- A Brief Introduction . . .
- How About You?
- Today’s Topic…Bollinger Bands
- Bollinger Bands What they are . . .
- Bollinger Bands Ask…
- Bollinger Bands
- Bollinger Bands . . .
- Bollinger Bands…the formula
- Let’s Translate That!
- Bollinger Band Applications . . .
- Three Primary Uses
- Bollinger Bands (BB)Basic Concepts . . .
- Basic Concepts
- Bollinger Bands (BB)Basic Concepts . . . continued
- Basic Concepts
- Basic Concepts . . .
- Time Frame: Weekly Chart
- Time Frame: 15-Minute Chart
- Time Frame: 5-Minute Chart
- Strategy: Double Bottom-Bottom Fishing
- Strategy: Double Bottom-Bottom Fishing
- Double Bottom-Bottom Fishing
- Double Bottom-Bottom Fishing
- Shorting Strategy: Double TopHead-and-Shoulders
- Shorting Strategy: Double TopHead-and-Shoulders
- Sell Short Double Top
- Sell Short Head-and-Shoulders
- Strategy: Identify Market Tops
- Strategy: Play “The Squeeze”
- Play “The Squeeze”
- In Conclusion . . .
Wyszukiwarka
Podobne podstrony:
Thomas M Truxes Defying Empire, Trading with the Enemy in Colonial New York (2008)
Pristine Core Trading With Oliver Velez
Alan Farley Pattern Cycles Mastering Short Term Trading With Technical Analysis (Traders Library)
Explosive Forex Trading with Live Forex Trading Examples Udemy
Bandlien Trading with Muslims and the Sami in Med
Dennis D Peterson Developing A Trading System Combining Rsi & Bollinger Bands
Trading with Volume indicator offers the following features
Bollinger Bands, giełda(3)
Pristine Intra day Trading Techniques With Greg Capra
Beating The Bear Short Term Trading Tactics for Difficult Markets with Jea Yu
LEAPS Trading Strategies Powerful Techniques for Options Trading Success with Marty Kearney
Mastering Option Trading Volatility Strategies with Sheldon Natenberg
Pristine Intra day Trading Techniques With Greg Capra
101 Things to Do With Ramen Noodles Toni Patrick
An Introduction To Options Trading Success with James Bittman
Aldo Colombini The Band 13 New Effects With Cards & Rubber Bands
więcej podobnych podstron