image008
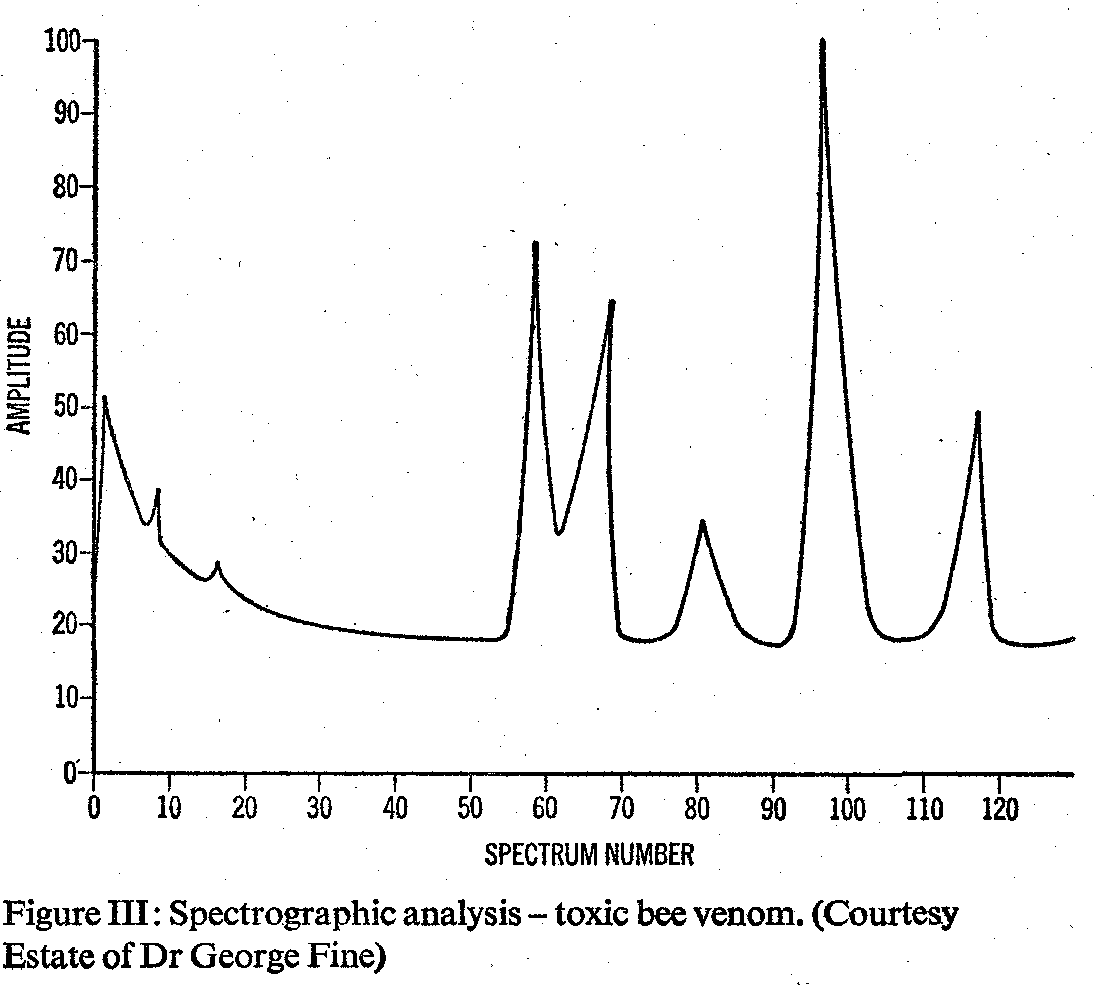
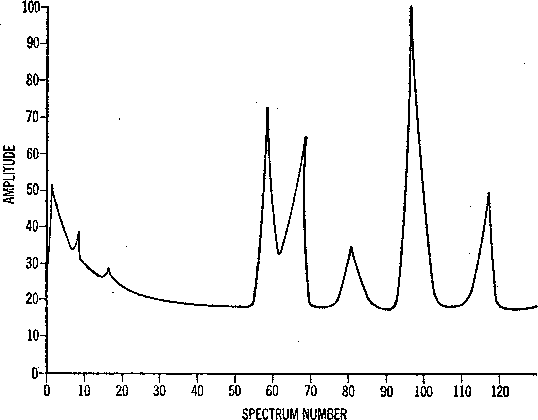
Figurę ELI: Spectrographic analysis - toxic bee venom. (Courte&y Estate of Dr George Fine)
Wyszukiwarka
Podobne podstrony:
image006 Figurę 4: Protoporphyrin IX. Porphyrins bave bcen identified in Ihe Orgual (Inlcrsecllng li
image025 Figurę V: Computer map, 1 August. Major conccntrationsof hostile bccs. (Courtesy Apkultural
Experimental Methods Fluctuating blade stress measurements have been studied using spectral analysis
image002 Figurę I: Distribution and spread of adansonii hybrid in South America. Adapted from Townse
image003 Figurę I: Distri bulion and sprcad of adansonii hybrid in South America. Adapted from Towns
image024 Figurę V: Computer map, 1 August. Major concentrations of hostile bees. (Courtesy Apicultur
FIGURĘ 4-The spectral power distribution of UV-A and UV-B bulbs used in a QUV accelerated weathering
snap 1 O Spectrum Analyser ^eq: Max Resolution 20 kHz Lin 43 Hz Level:
64033 slide0005 image010 Fte Eli Srtiji Heł> J <0 Uoacktoeadh l28Hotfteadb n s«n Aciwil MO )
więcej podobnych podstron