2949775840
72
S. Źróbek, R. Cellmer, J. Kuryj
In the analyses, it was also taken into account that the use of mean adjusting coeffi-cients is not justified in every zonę. This applies particularly to the rapidly developing resi-dential areas or those in which the value of a real estate is most affected by its area. In that case the coefficients calculated individually for each zonę were applied.
The research resulted in drawing up a map of the mean values of land in the city of Olsztyn. A part of this map is shown in Figurę 7.
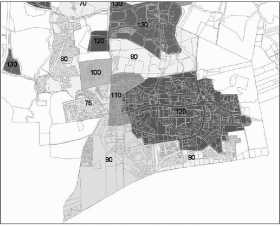
Fig. 7. A part of a map showing land value in the city of Olsztyn Source: own study
4. Summary
Dispersion of the source data in many public registers (real estate cadaster, perpetual registers, tax records, statistical records) makes it difficult to carry out morę comprehensive analyses of the real estate market. Information in various forms, including maps, processed and sent by various means, e.g. via the Internet, is awaited by many users. In Poland, the need has been seen and attempts are underway to meet it.
Nowadays, in this age of rapid information technology development and software Solutions, it is not a problem to process the gathered data, but rather to obtain them and evalu-ate their usefulness. Hence, much attention is devoted in this study to the system of monitoring the real estate market.
The market, which in many segments is in an initial stage and freąuently lacks balance, is not easily described with mathematical formulae. For some time, scientific discussions have been conducted on statistical modelling of the market and explaining the cause-and-ef-fect relationships.
The manner of cartographic representation of the effects taking place in the real estate market can contribute to the progress in the analysis of the preferences of real estate pur-chasers and in the creation of a system of collecting, processing the data concerning the prices and value of real estate and making such data available to those interested.
Wyszukiwarka
Podobne podstrony:
68 S. Źróbek, R. Cellmer, J. Kuryj Among the many methods of graphic presentation of spatial economi
66 S. Źróbek, R. Cellmer, J. Kuryj Based on the analysis, three groups of factors can be established
ipe 37 72 72. Make a fist with one hand and place it in the palm of ihe other
70 S. Źróbek, R. Cellmer, J. Kuryj The following were the basis for the land value map: —
00121 ge08f5e71e20195f362e2605eea9911 122 Simpson & Keats by a trade-off analysis in the region
jff 119 GLOSSARY The use of Japanese terms has been kept to a minimum in this book. It is an imposit
kryzys bułgarski (9) CHAFTER 9 the Serb treaty in its form; it was chiefK a dynastie arrangement wit
D. Prokopowicz, S. Gwoździewicz, An analysis of the security of Information systems protection in th
ERROR: The path /users/xxyyzz/Downloads/Cheatsheet.xlsx is invalid because it is not in the list of
POSTER SESSION. H57 SECOND TRIAD OF H;0: NEW ANALYSIS OF YIBRATION-ROTATION SPECTRA IN THE REGION OF
202 STRESS ANALYSIS Calculation of combining stress in the structure of airplane wings, etc,, by Kar
ROMANIAN SOCIO-POLITICAL TERMS IN THE LANGUAGE OF THE BULGARIAN PERIODICALS ISSUED IN ROMANIA ZAMFIR
<vLet It Be In the Style of George Frederick Handel Slowly Wofds and Musie by Jołin Lermon and Pa
więcej podobnych podstron