6781096812
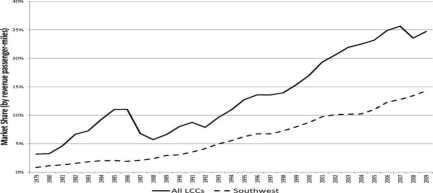
Figurę 6: Domestic Market Share of Low-Cost Carriers
from this figurę. First, LCCs in aggregate have experienced no morę erratic fleet size adjustments despite being less well-established on average.1 2 3 4 In fact, they continued to grow gradually even after 9/11 while remaining much less unprofitable than the legacy carriers, as shown later. If anything, it appears to be the legacy carriers who are morę prone to over-investment relative to the growth of their traffic. Second, the changes in fleet size of the LCCs is dwarfed by the variation of the non-LCC fleet. Because of their smali relative size, LCC investment decisions do not seem to have been the primary driver in industry capacity changes.5
An alternate view of LCCs is that they have been gradually chipping away at the en-trenched positions of legacy carriers that have much higher costs. The change has been gradual, because the legacy carriers are also protected by network marketing programs and other activities that raise barriers to entry by morę efficient firms. Potentially exclu-sionary activities of legacy carriers include frequent-flyer programs and corporate discount programs that exchange discounts for customer loyalty on a portfolio of unrelated routes,6
gin America, Allegiant, USA3000, American Trans Air, Kiwi, National (post-1998), Western Pacific,
World). AU airlines are included in capacity data. Some of the very smali airlines are not included in
the financial and traffic data.
The declines in 1987 and 1988 are caused by the purchases of PSA by US Airways and Air California by American Airlines, in both cases transferring LCC fleets to the control of legacy carriers. Similarly, the decline in 2007 is a result of the US Airways-America West merger.
These figures include entire carrier fleets, some of which are used on international routes, but the conclusion is not changed if the analysis is limited to narrow-body aircraft, which are used primarily for flights within North America.
Borenstein (1996) discusses the potential anti-competitive effects of such repeat-buyer programs in morę
Wyszukiwarka
Podobne podstrony:
Figurę 5: Airline Fleet Sizes III. Entry and expansion of low-cost carriers Many industry observers
74 (43) CrossStitcker Buy the materials you’ll need to stitch five of our favourite projects from th
CimStitcker Buy the materials. you’11 need to stitch four of our favourite projects from this issueH
Kulikowski Nazwiska polskie5 NAZWISKA POLSKIE (2) The group of christening names taken from ihe Ch
57231 Obrazek77 CressStitekerMATERIAŁ PACKS Buy the materials you’ll need to stitch four of our fav
This materiał first appeared in The Miniaturę World of Pressed Flowers published by Search Pres
Figurę 1: Net Income per Available Seat-Mile: U.S. Domestic Markets measured by aircraft and 3.6% pe
Figurę 4: Implied Changes In Domestic Airline Demand Over Time years. Yet, the industry madę money i
55 (174) 5: Deep mycoses Figurę 5:9: Perinasal ulcer in a domestic short hair cal with cryptococcosi
Sojourner Mission Objective: Demonstrate a low-cost way of delivering a set of science instruments a
ESTIMATE ALGORITHM OF DEVELOPMENT COST AND COMBINE WEAR COST INDICATORS ASSOCIATED WITH THE MAR
Experimenting with Raspberry Pi [EN] Experimenting with Raspberry Pi LOW-COST PROJECTS TO HELP YOU G
więcej podobnych podstron