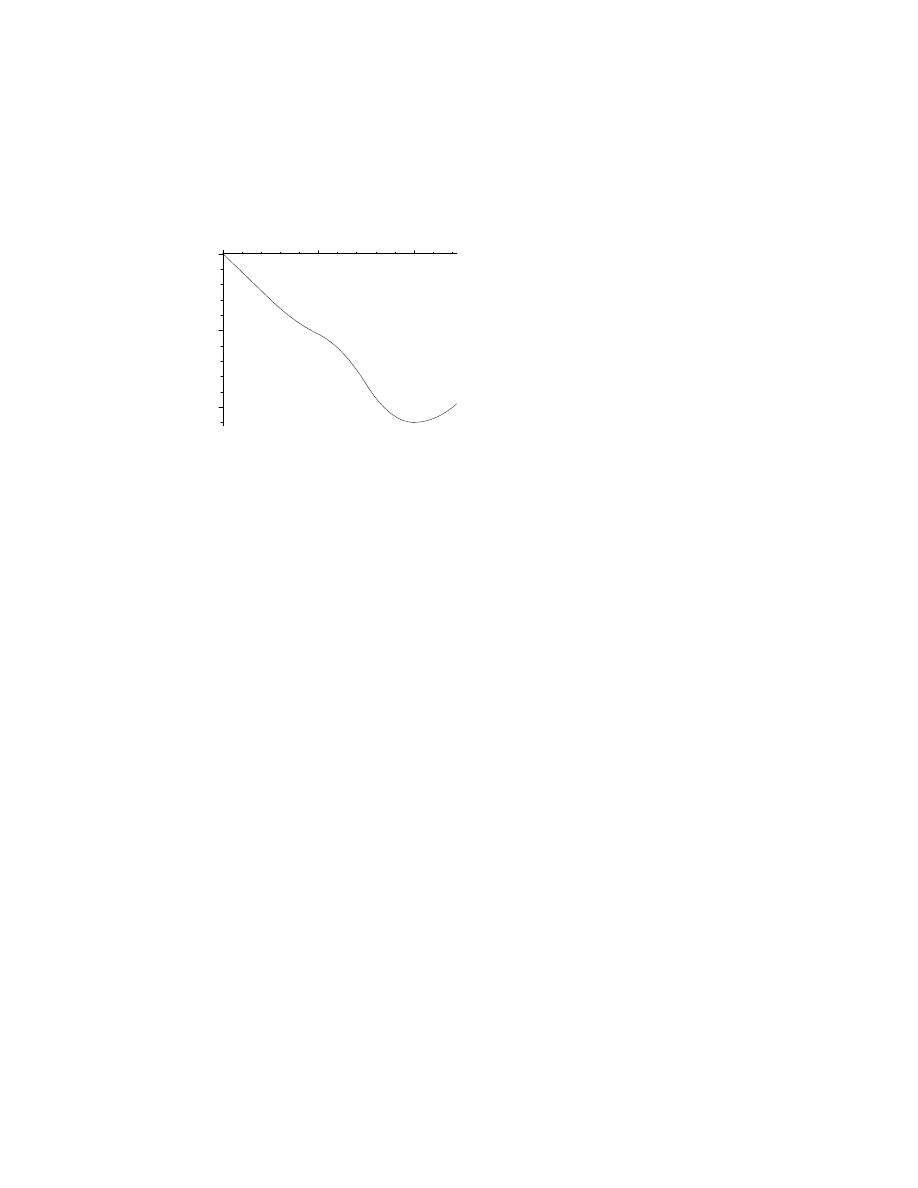
90. The graph is shown below. We assumed each interval described in the problem was one time unit long.
A marks where the curve is steepest and B is where it is least steep (where it, in fact, has zero slope).
x
B
A
–4
–2
0
t
Document Outline
- Main Menu
- Chapter 1 Measurement
- Chapter 2 Motion Along a Straight Line
- 2.1 - 2.10
- 2.1
- 2.2
- 2.3
- 2.4
- 2.5
- 2.6
- 2.7
- 2.8
- 2.9
- 2.10
- 2.11 - 2.20
- 2.11
- 2.12
- 2.13
- 2.14
- 2.15
- 2.16
- 2.17
- 2.18
- 2.19
- 2.20
- 2.21 - 2.30
- 2.21
- 2.22
- 2.23
- 2.24
- 2.25
- 2.26
- 2.27
- 2.28
- 2.29
- 2.30
- 2.31 - 2.40
- 2.31
- 2.32
- 2.33
- 2.34
- 2.35
- 2.36
- 2.37
- 2.38
- 2.39
- 2.40
- 2.41 - 2.50
- 2.41
- 2.42
- 2.43
- 2.44
- 2.45
- 2.46
- 2.47
- 2.48
- 2.49
- 2.50
- 2.51 - 2.60
- 2.51
- 2.52
- 2.53
- 2.54
- 2.55
- 2.56
- 2.57
- 2.58
- 2.59
- 2.60
- 2.61 - 2.70
- 2.61
- 2.62
- 2.63
- 2.64
- 2.65
- 2.66
- 2.67
- 2.68
- 2.69
- 2.70
- 2.71 - 2.80
- 2.71
- 2.72
- 2.73
- 2.74
- 2.75
- 2.76
- 2.77
- 2.78
- 2.79
- 2.80
- 2.81 - 2.90
- 2.81
- 2.82
- 2.83
- 2.84
- 2.85
- 2.86
- 2.87
- 2.88
- 2.89
- 2.90
- 2.91 - 2.100
- 2.91
- 2.92
- 2.93
- 2.94
- 2.95
- 2.96
- 2.97
- 2.98
- 2.99
- 2.100
- 2.101 - 2.110
- 2.101
- 2.102
- 2.103
- 2.104
- 2.105
- 2.106
- 2.107
- 2.108
- 2.109
- 2.110
- 2.1 - 2.10
- Chapter 3 Vectors
- Chapter 4 Motion in Two and Three Dimensions
- Chapter 5 Force and Motion I
- Chapter 6 Force and Motion II
- Chapter 7 Kinetic Energy and Work
- Chapter 8 Potential Energy and Conservation of Energy
- Chapter 9 System of Particles
- Chapter 10 Collisions
- Chapter 11 Rotation
- Chapter 12 Rolling, Torque, and Angular Momentum
- Chapter 13 Equilibrium and Elasticity
- Chapter 14 Gravitation
- Chapter 15 Fluids
- Chapter 16 Oscillations
- Chapter 17 Waves—I
- Chapter 18 Waves—II
- Chapter 19 Temperature, Heat, and the First Law of Thermodynamics
- Chapter 20 The Kinetic Theory of Gases
- Chapter 21 Entropy and the Second Law of Thermodynamics
- Chapter 22 Electric Charge
- Chapter 23 Electric Fields
- Chapter 24 Gauss’ Law
- Chapter 25 Electric Potential
- Chapter 26 Capacitance
- Chapter 27 Current and Resistance
- Chapter 28 Circuits
- Chapter 29 Magnetic Fields
- Chapter 30 Magnetic Fields Due to Currents
- Chapter 31 Induction and Inductance
- Chapter 32 Magnetism of Matter: Maxwell’s Equation
- Chapter 33 Electromagnetic Oscillations and Alternating Current
- Chapter 34 Electromagnetic Waves
- Chapter 35 Images
- Chapter 36 Interference
- Chapter 37 Diffraction
- Chapter 38 Special Theory of Relativity
- Chapter 39 Photons and Matter Waves
- Chapter 40 More About Matter Waves
- Chapter 41 All About Atoms
- Chapter 42 Conduction of Electricity in Solids
- Chapter 43 Nuclear Physics
- Chapter 44 Energy from the Nucleus
- Chapter 45 Quarks, Leptons, and the Big Bang
Wyszukiwarka
Podobne podstrony:
p02 071
p02 004
p02 034
p02 066
p02 076
p02 094
p02 108
p02 068
p02 041
12 2005 090 093
mat bud 090 (Kopiowanie) (Kopiowanie)
090 - Jesień - Dobranoc, ⊱✿JESIENNE POZDROWIENIA⊱✿
p02
p02 053
p02 005
08 2005 088 090
2 roz 090 112
więcej podobnych podstron