
PHYSICS
HIGHER LEVEL
PAPER 1
Friday 10 November 2000 (afternoon)
1 hour
N00/430/H(1)
INTERNATIONAL BACCALAUREATE
BACCALAURÉAT INTERNATIONAL
BACHILLERATO INTERNACIONAL
880-226
24 pages
INSTRUCTIONS TO CANDIDATES
! Do not open this examination paper until instructed to do so.
! Answer all the questions.
! For each question, choose the answer you consider to be the best and indicate your choice on the
answer sheet provided.

1.
When an ideal gas in a thermally insulated chamber is compressed the volume V and pressure P are
related by the equation
constant
PV
γ
=
where
γ
is a constant.
Which one of the following plots would produce a straight-line graph?
A.
P against
1
V
B.
log P against log V
C.
P against log V
D.
log P against V
2. The
power
P dissipated in a resistor of resistance R in which there is a current I is given by
P = I R
2
The uncertainty in the value of resistance of a particular resistor is !10% and the uncertainty in the value
of the current in the resistor is !3%. The best estimate for the uncertainty of the power dissipated is
A.
!6%.
B.
!9%.
C.
!16%.
D.
±
19%.
3. When a car is moving at a speed v in a straight line the total force opposing its motion is F. The
product Fv is a measure of the
A.
power developed by the car.
B.
rate of change of momentum of the car.
C.
work done by the car against the frictional forces.
D.
rate of change of kinetic energy of the car.
– 2 –
N00/430/H(1)
880-226
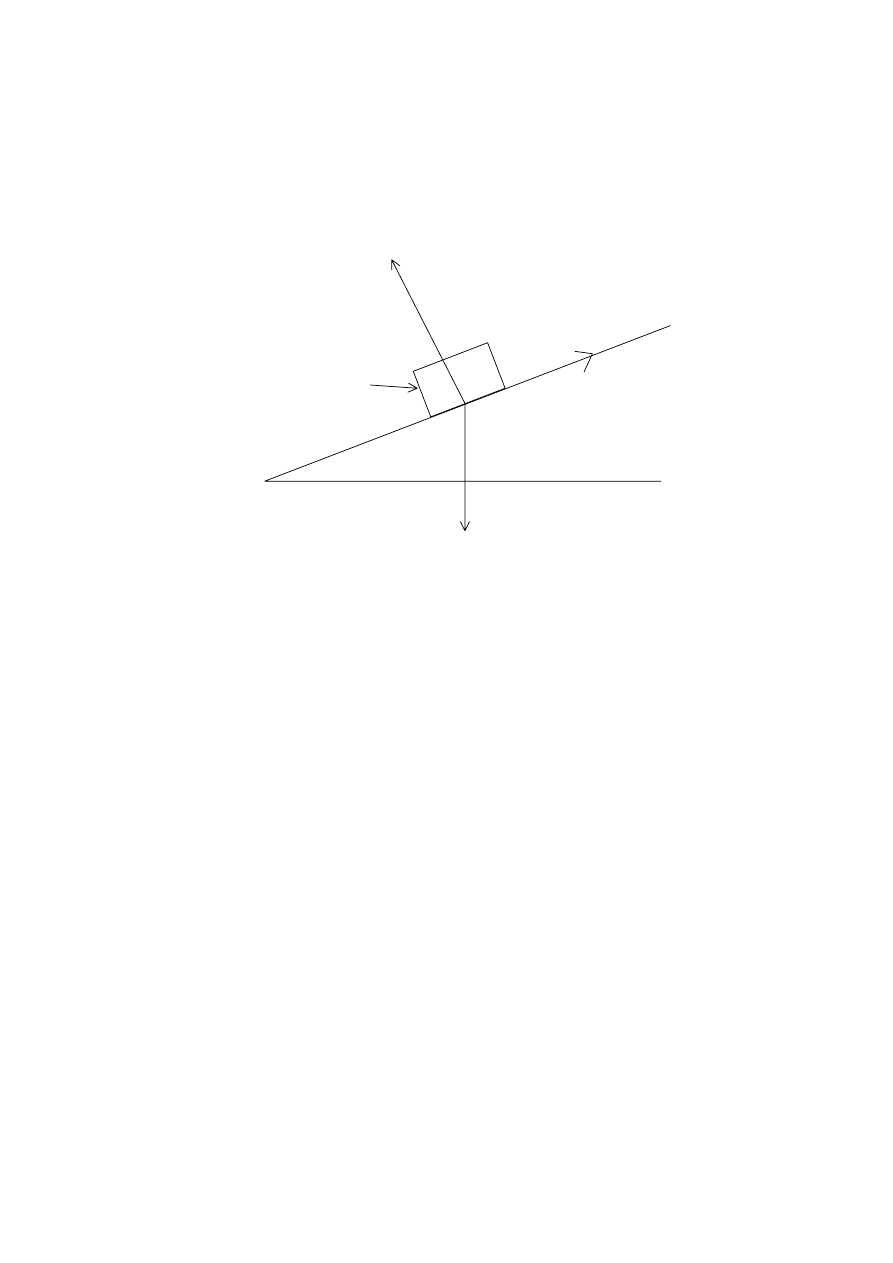
4.
In the diagram a wooden block is resting on an inclined plane. The weight of the block is W and the
normal reaction between the block and the plane is N and the frictional force acting on the block is F .
f
Angle
θ
is the maximum angle of the plane before the block starts to slide down the plane. The
coefficient of static friction between the block and the plane is
µ
.
wooden
block
W
F
N
θ
f
Which one of the following relationships between W and N is correct?
A.
W =
µ
N
B.
W cos
θ
=
µ
N
C.
W sin
θ
=
µ
N
D.
W sin
θ
= N
– 3 –
N00/430/H(1)
880-226
Turn over
5.
The diagram shows a glider travelling on a friction-free linear air track.
a pump
air holes
vehicle
opaque card
air from
buffer
buffer
air track
Which one of the following graphs best represents the variation of velocity with time as the glider
bounces back and forth between the elastic buffers?
velocity
velocity
velocity
velocity
time
time
time
time
Graph B
Graph A
Graph D
Graph C
– 4 –
N00/430/H(1)
880-226
6.
The diagrams show the direction and speed u of a ball before it strikes a vertical wall and its direction and
speed v after striking the wall.
wall
before
u
wall
after
v
The ball is in contact with the wall for a time
∆
t.
The magnitude of the average force F exerted on the ball by the wall is given by
A.
.
mu
mv
F
t
−
=
∆
B.
.
(
)
F
mu
mv
t
=
−
∆
C.
.
mu
mv
F
t
+
=
∆
D
.
.
(
)
F
mu
mv
t
=
+
∆
7.
A particle of mass m moves with constant speed v in a circle of radius r. The work done on the particle
by the centripetal force in one complete revolution is
A.
.
2
2π
m v
B.
.
2
2 v
m
π
C.
.
2
2 m
v
π
D.
zero.
– 5 –
N00/430/H(1)
880-226
Turn over
8.
A block of mass M is pushed along a horizontal, frictionless surface by a force of magnitude F. The force
makes an angle
θ
with the horizontal.
θ
M
F
The magnitude of the acceleration of the block is
A.
zero.
B.
.
cos
F
M
θ
C.
.
sin
F
M
θ
D.
.
F
M
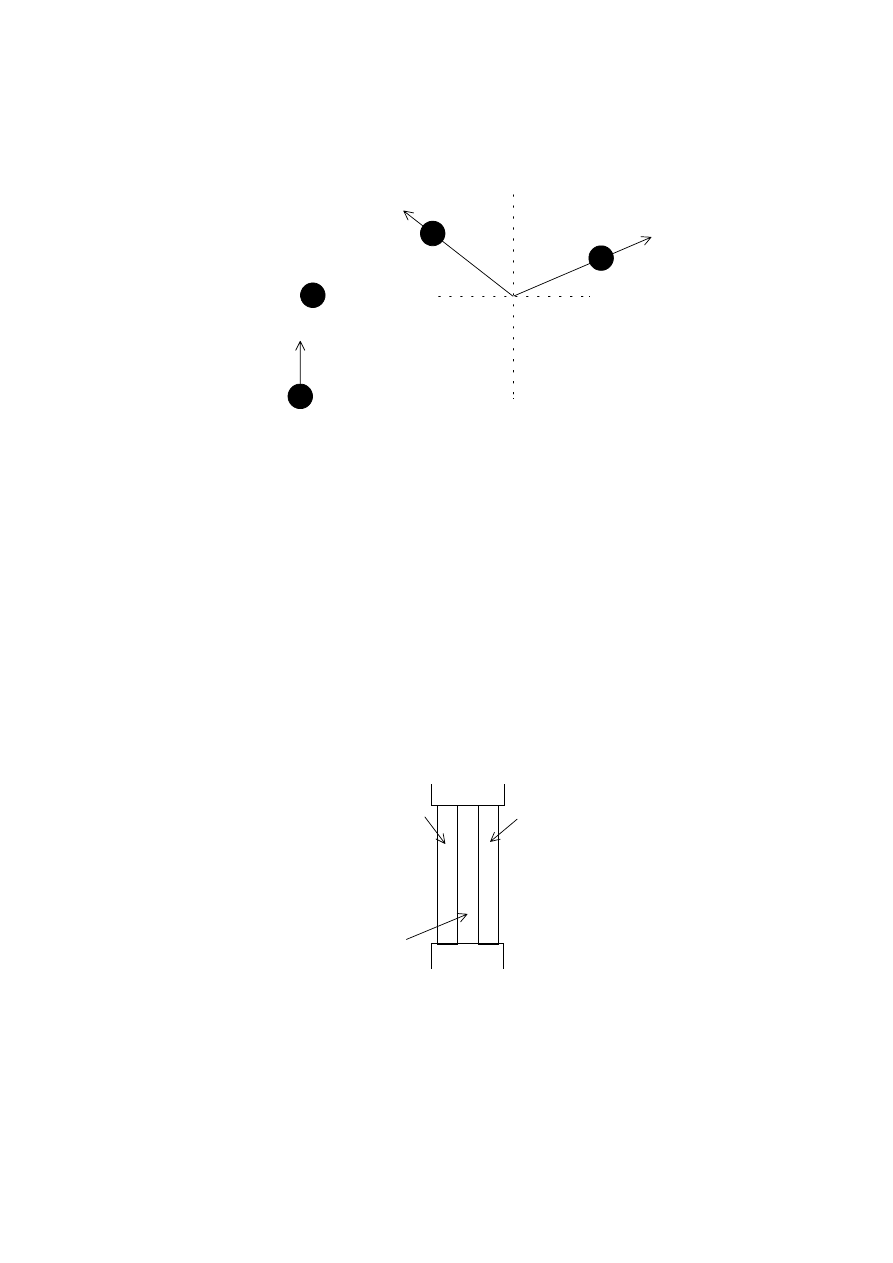
9.
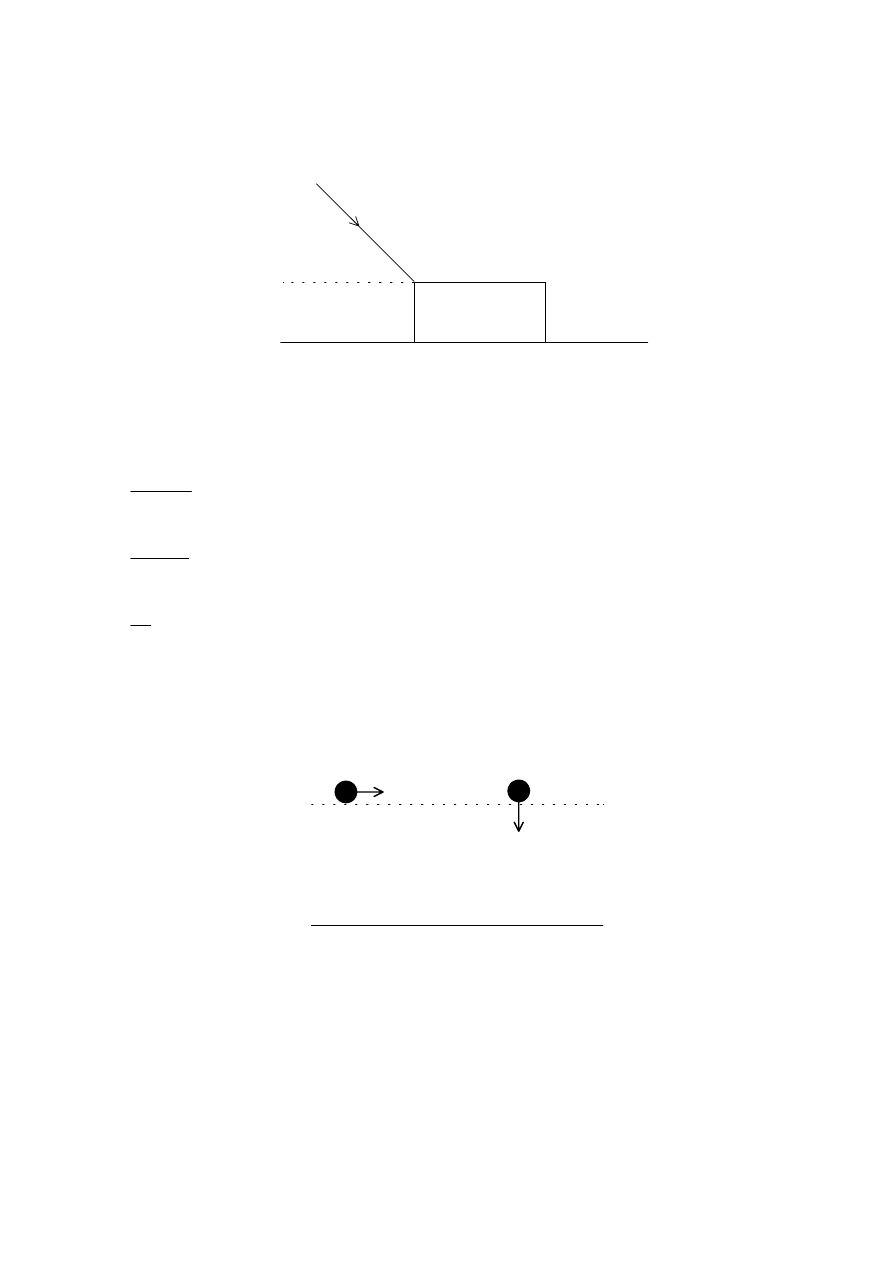
The diagram shows two balls P and Q at the same height above the ground. Ball P is projected
horizontally and at the same instant ball Q is allowed to fall vertically.
P
Q
ground
Which one of the following statements is true?
A.
Both balls hit the ground with the same velocity.
B.
Both balls take the same time to reach the ground.
C.
Both balls hit the ground with the same speed.
D.
The balls have different accelerations whilst falling.
– 6 –
N00/430/H(1)
880-226

10. A mass is suspended from a spring and set into vertical oscillation with a frequency f. Because of
frictional forces the mass will eventually stop oscillating. At some time during the oscillations the
amplitude of oscillation is equal to half its initial amplitude. At this point the frequency of oscillation is
A.
.
2
f
B.
f.
C.
.
2
f
D.
2f.
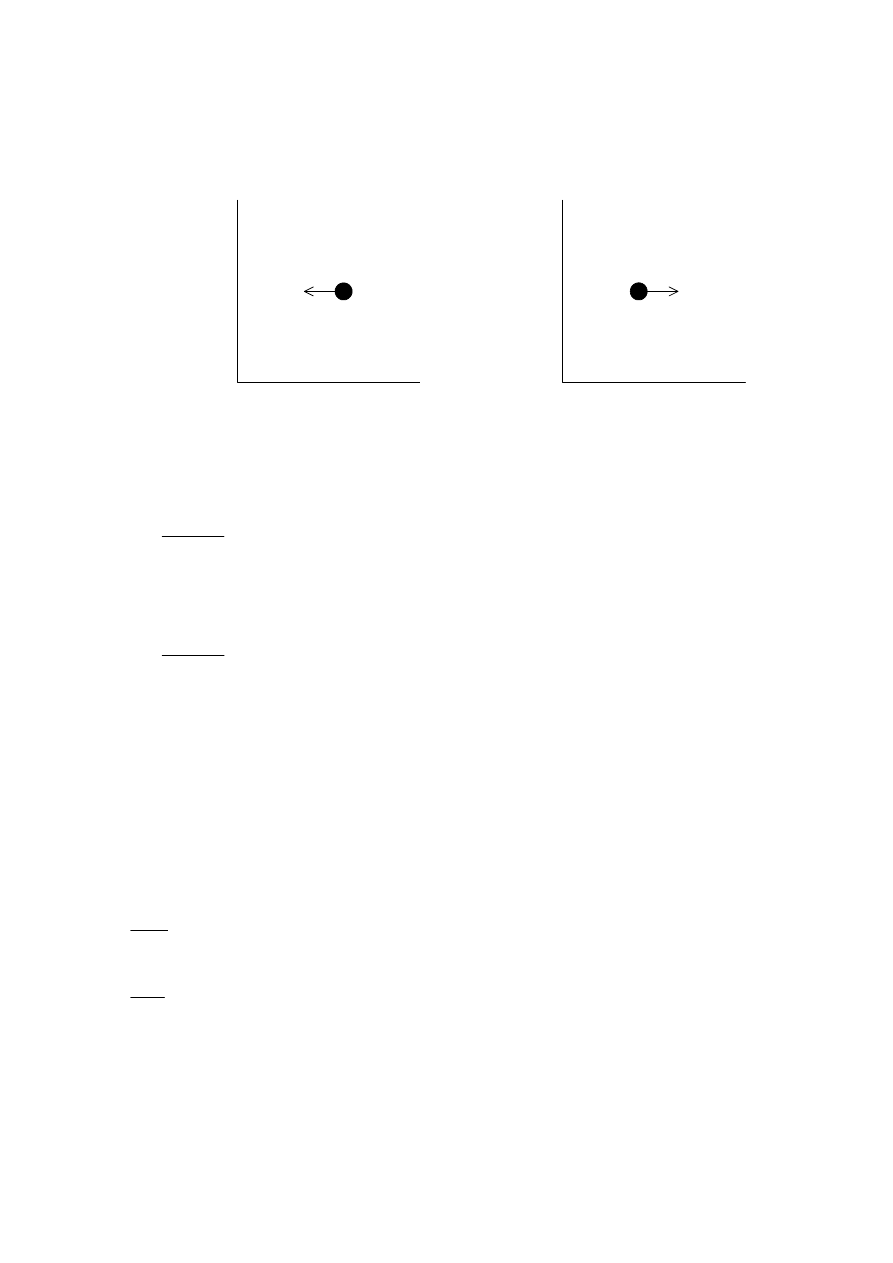
11. Two satellites P and Q of equal mass are in orbit about the Earth. Satellite P is further away from the
Earth than Q.
Q
P
Earth
Which one of the following quantities will be greater for P than for Q?
A.
The gravitational potential energy.
B.
The speed.
C.
The acceleration.
D.
The gravitational force.
– 7 –
N00/430/H(1)
880-226
Turn over

12. The diagram shows two planets X and Y.
R
2R
Planet X
Planet Y
Planet X and planet Y have the same mean density.
The radius of planet X is half that of planet Y.
The ratio
is
gravitational field at the surface of planet X
gravitational field at the surface of planet Y
A.
2
.
2
B.
2.
C.
.
2
D.
.
1
2
– 8 –
N00/430/H(1)
880-226
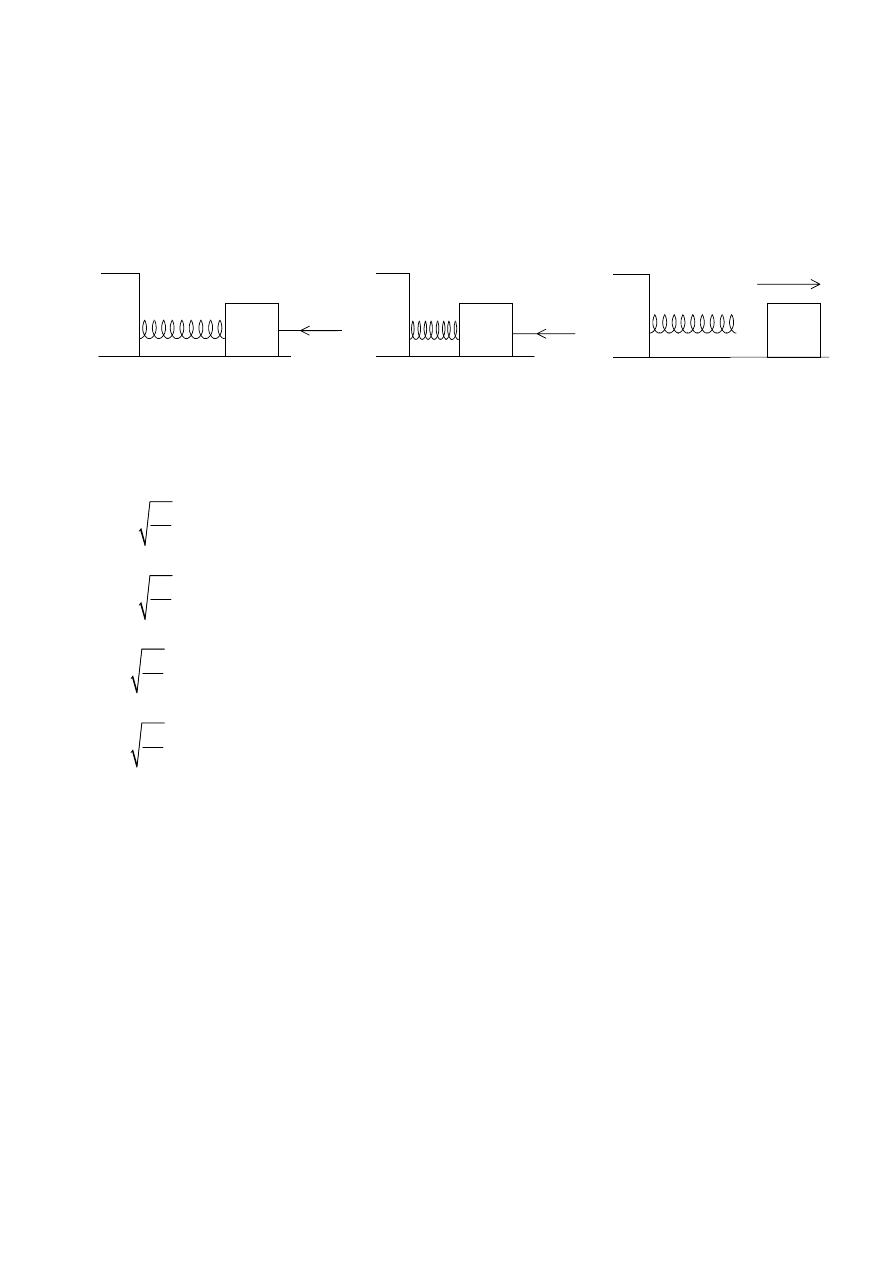
13. In the diagrams the block of mass M is pushed along a frictionless, horizontal surface such that it
compresses the spring S. The compression spring constant is k.
When the spring has been compressed by an amount e the block is held stationary and then the pushing
force is removed from the block.
M
S
start of compression
pushing force has
been removed
v
M
S
spring compressed
by an amount e
M
S
The speed v of the block when it is no longer in contact with the spring will be
A.
.
k
e
M
B.
.
M
e
k
C.
.
ke
M
D.
.
M
ke
– 9 –
N00/430/H(1)
880-226
Turn over
14. Ball A travelling with speed V in the direction shown makes a glancing collision with another ball B of
the same mass. After collision the balls move off with speeds V
and V in the directions shown.
A
B
V
A
B
V
after
before
A
V
B
A
B
✎
α
)
(
Which one of the following is true?
A.
V cos
α
= V cos
β
A
B
B.
V = V cos
α
+ V cos
β
A
B
C.
V sin
α
= V sin
β
A
B
D.
V = V + V
A
B
15. The diagram shows a section of double glazed window. The panes of glass are separated by an air gap
that is of the same thickness as the two panes of glass. The room temperature is greater than the outside
temperature and both temperatures are constant.
glass
air
room
outside
glass
Which one of the following statements is true?
A.
There is no energy transfer from the room to the outside.
B.
The rate of energy transfer across the glass is the same as that across the air gap.
C.
The rate of energy transfer across the glass is greater than that across the air gap.
D.
The rate of energy transfer across the glass is less than that across the air gap.
– 10 –
N00/430/H(1)
880-226
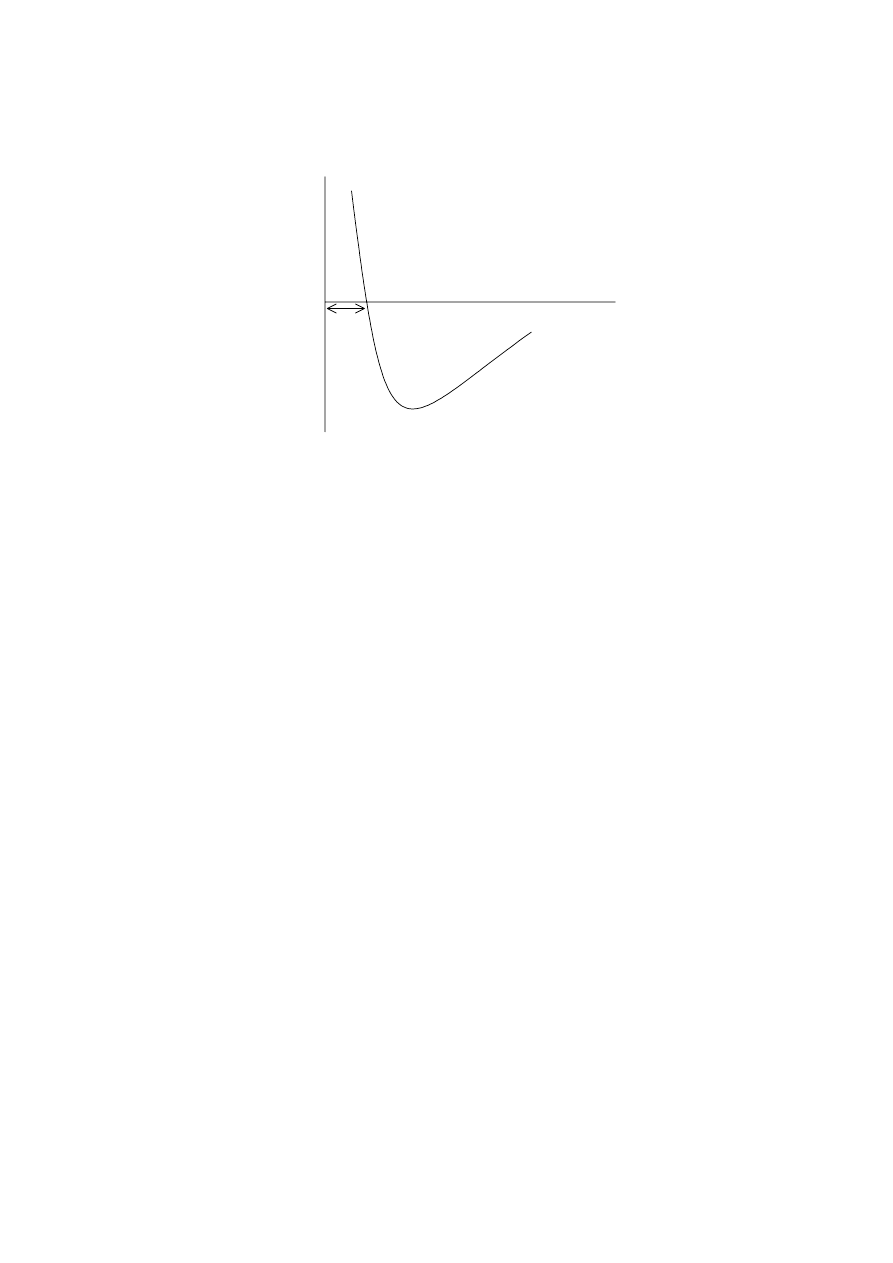
16. The graph shows how the force between two molecules in a solid varies with their separation.
Force
0
R
Separation
When the separation between the molecules is equal to R the potential energy of the molecules is
A.
a maximum.
B.
a minimum.
C.
zero.
D.
infinite.
17. A rod is made from metal that has a coefficient of linear expansion of the order of 10 °C . If the
−
5
−
1
temperature of the rod is raised by 1000 °C then it will increase in length by about
A.
0.1%.
B.
1%.
C.
10%.
D.
100%.
– 11 –
N00/430/H(1)
880-226
Turn over

18. In a given time interval 1200 J of energy is extracted from a refrigerator cabinet and 1800 J of energy is
ejected to the outside. The coefficient of performance of the refrigerator is
A.
0.5
B.
0.7
C.
2
D.
4
19. When light waves travel from air to glass which one of the following happens to the frequency and
wavelength of the light?
decreases
increases
D.
increases
stays the same
C.
increases
decreases
B.
decreases
stays the same
A.
Wavelength
Frequency
– 12 –
N00/430/H(1)
880-226
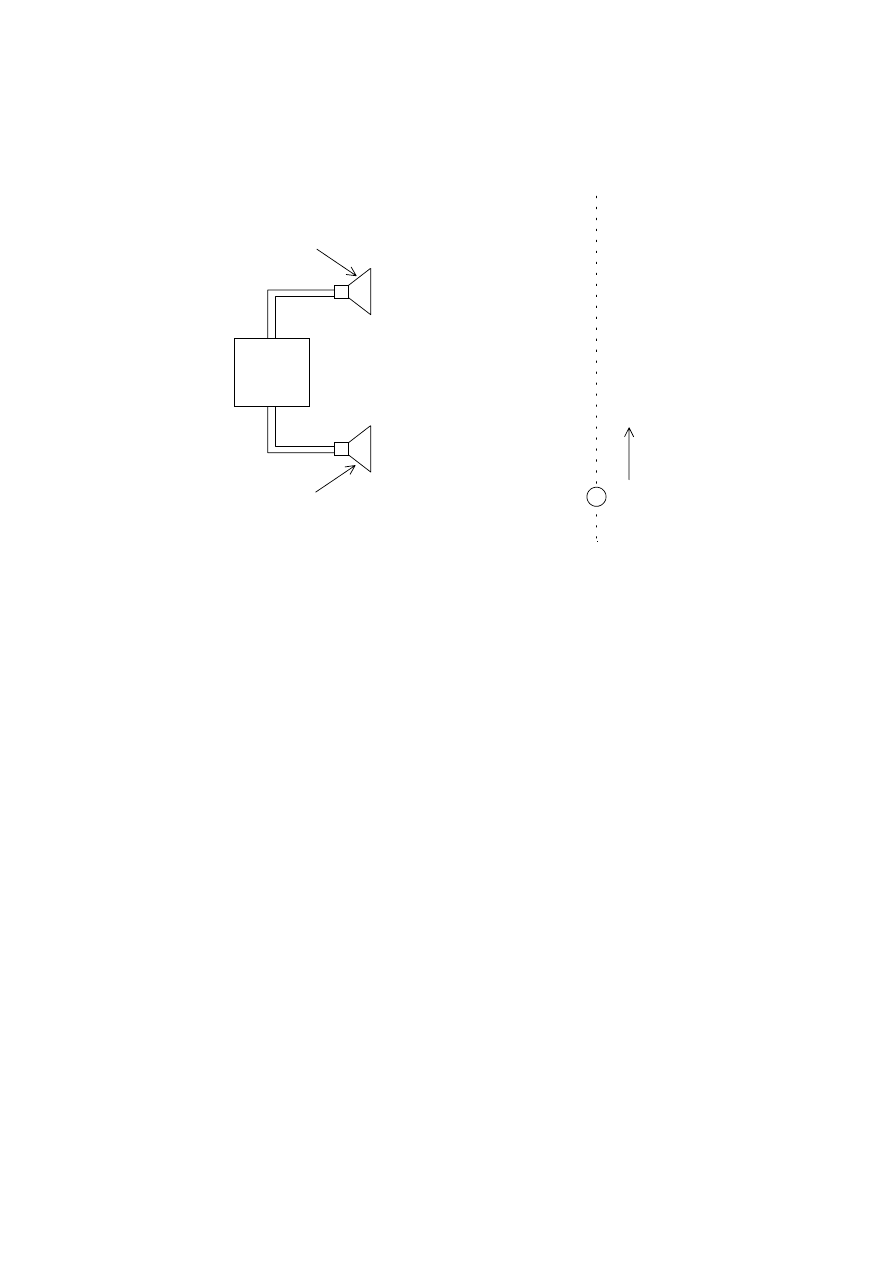
20. The diagram shows two loudspeakers connected to the same signal generator. As a microphone is moved
along the path XY a series of maximum and minimum sound levels is detected.
signal
generator
Microphone
X
loudspeaker
loudspeaker
Y
Which one of the following actions on its own will increase the separation between the maximum and
minimum sound levels?
A.
Moving the speakers closer to the line XY.
B.
Increasing the separation between the speakers.
C.
Increasing the amplitude of the sound waves.
D.
Decreasing the frequency of the sound waves.
21. The frequency of the fundamental note produced by an organ pipe that is open at both ends is 300 Hz.
The frequency of the next harmonic is
A.
400 Hz.
B.
600 Hz.
C.
800 Hz.
D.
900 Hz.
– 13 –
N00/430/H(1)
880-226
Turn over
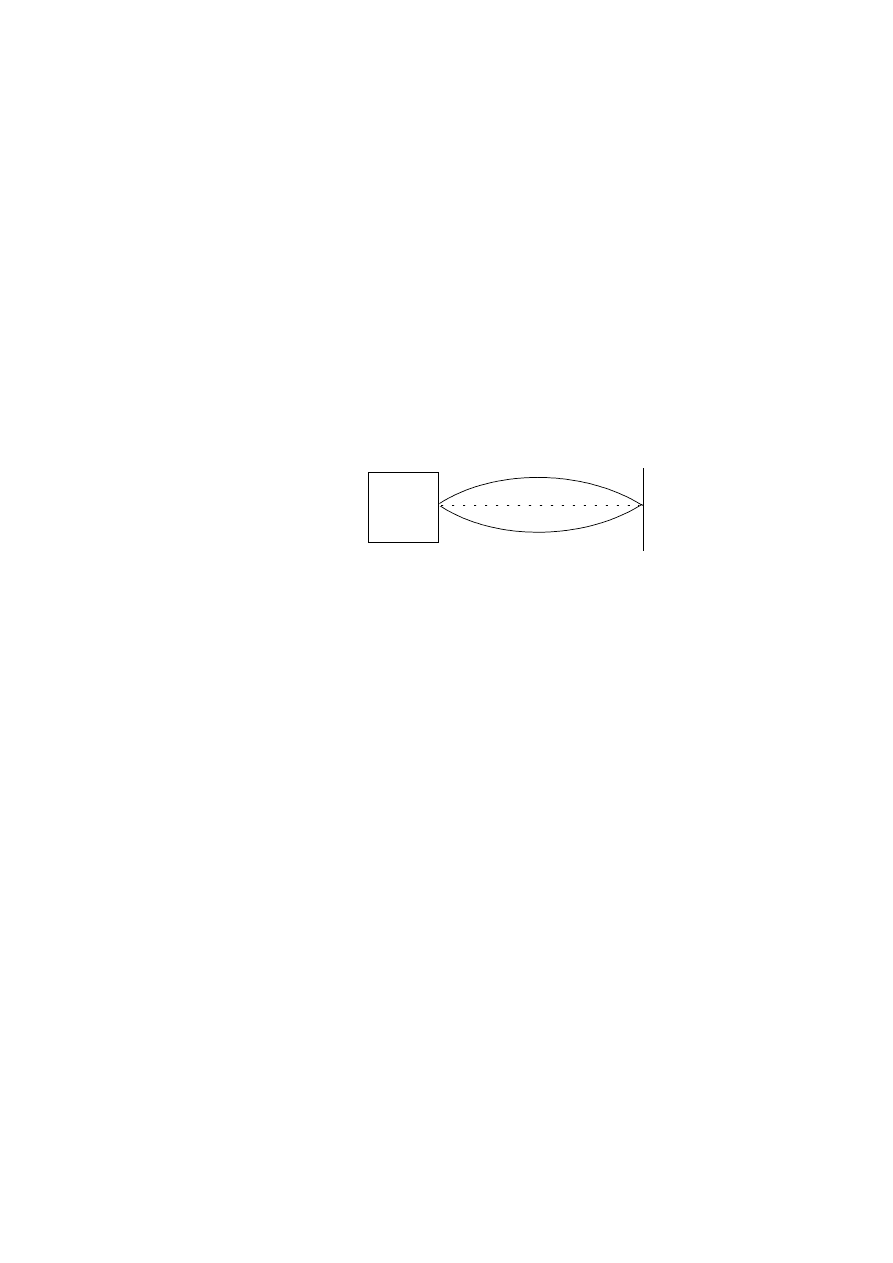
22. Light can be transmitted along a curved optical fibre. Which one of the following phenomena can explain
this?
A.
Dispersion
B.
Diffraction
C.
Total internal reflection
D.
Interference
23. In the diagram a vibrator attached to a string under tension sets up a standing wave. The string vibrates in
the mode shown.
Vibrator
If the frequency of the vibrator is kept constant by what factor must the tension be changed in order that
the next standing wave mode (harmonic) is produced?
A.
¼
B.
½
C.
2
D.
4
24. A sound source emits a note of constant frequency. An observer is travelling in a straight line towards the
source at a constant speed. As she approaches the source she will hear a sound that
A.
gets higher and higher in frequency.
B.
gets lower and lower in frequency.
C.
is of constant frequency but of a frequency higher than that of the sound from the source.
D.
is of constant frequency but of a frequency lower than that of the sound from the source.
– 14 –
N00/430/H(1)
880-226
25. Two resistors of equal resistance are connected in series to a battery with negligible internal resistance.
The current drawn from the battery is 1.0 A.
When the two resistors are connected in parallel to the battery the current drawn will be
A.
0.5 A.
B.
1.0 A.
C.
2.0 A.
D.
4.0 A.
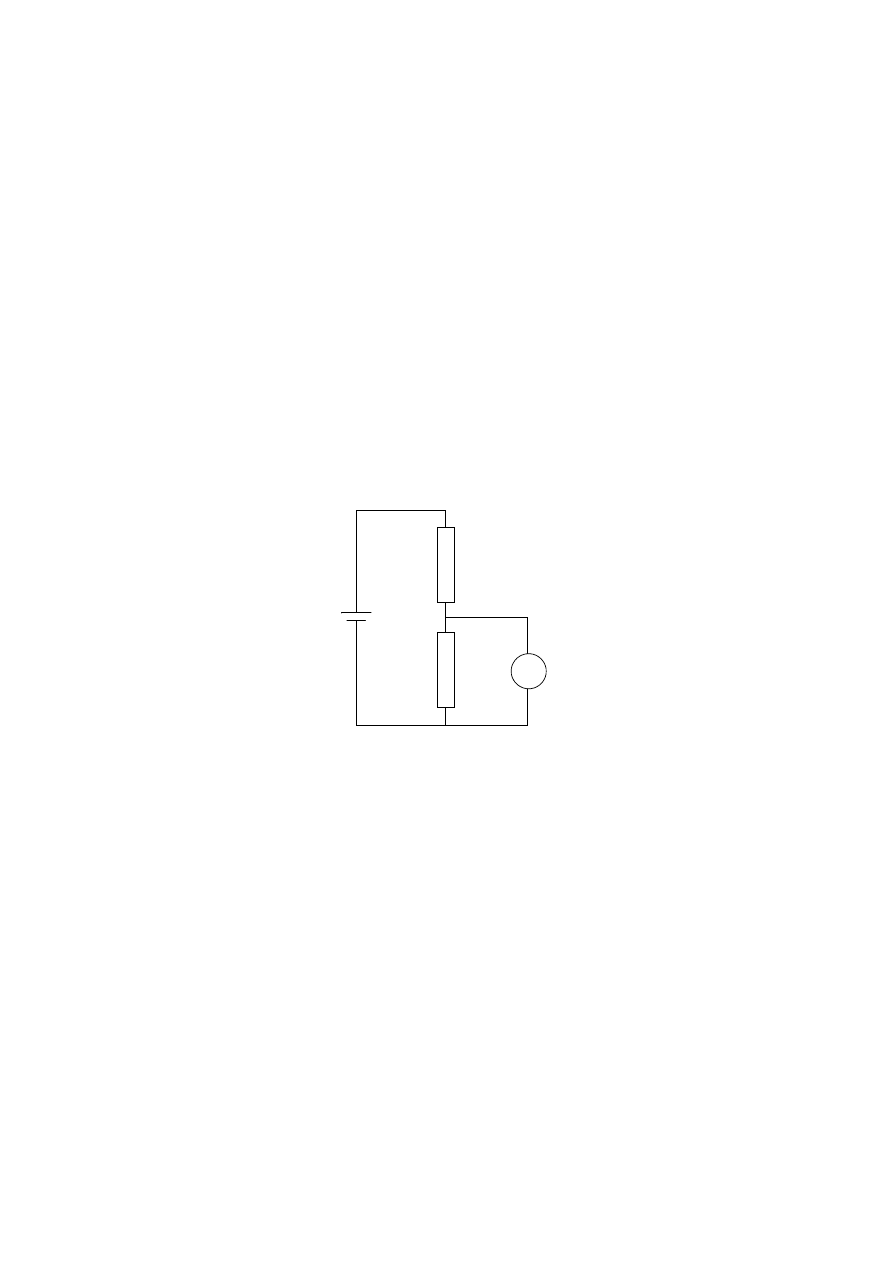
26. In the diagram the voltmeter V has a resistance of 100 k
Ω
and is connected such as to measure the
potential difference across the 100 k
Ω
resistor. The battery has an emf of 5.0 V and negligible internal
resistance.
V
100 k
✡
200 k
✡
100 k
✡
5.0 V
The reading on the voltmeter will be
A.
4.0 V.
B.
2.5 V.
C.
1.0 V.
D.
zero.
– 15 –
N00/430/H(1)
880-226
Turn over
27. Which
one of the graphs best shows how the electrostatic potential due to a charged, hollow metal sphere
of radius a varies with distance from the centre of the sphere?
potential
potential
potential
potential
0
0
distance
distance
distance
distance
0
0
Graph A
Graph B
Graph D
Graph C
✍
✍
✍
✍
– 16 –
N00/430/H(1)
880-226
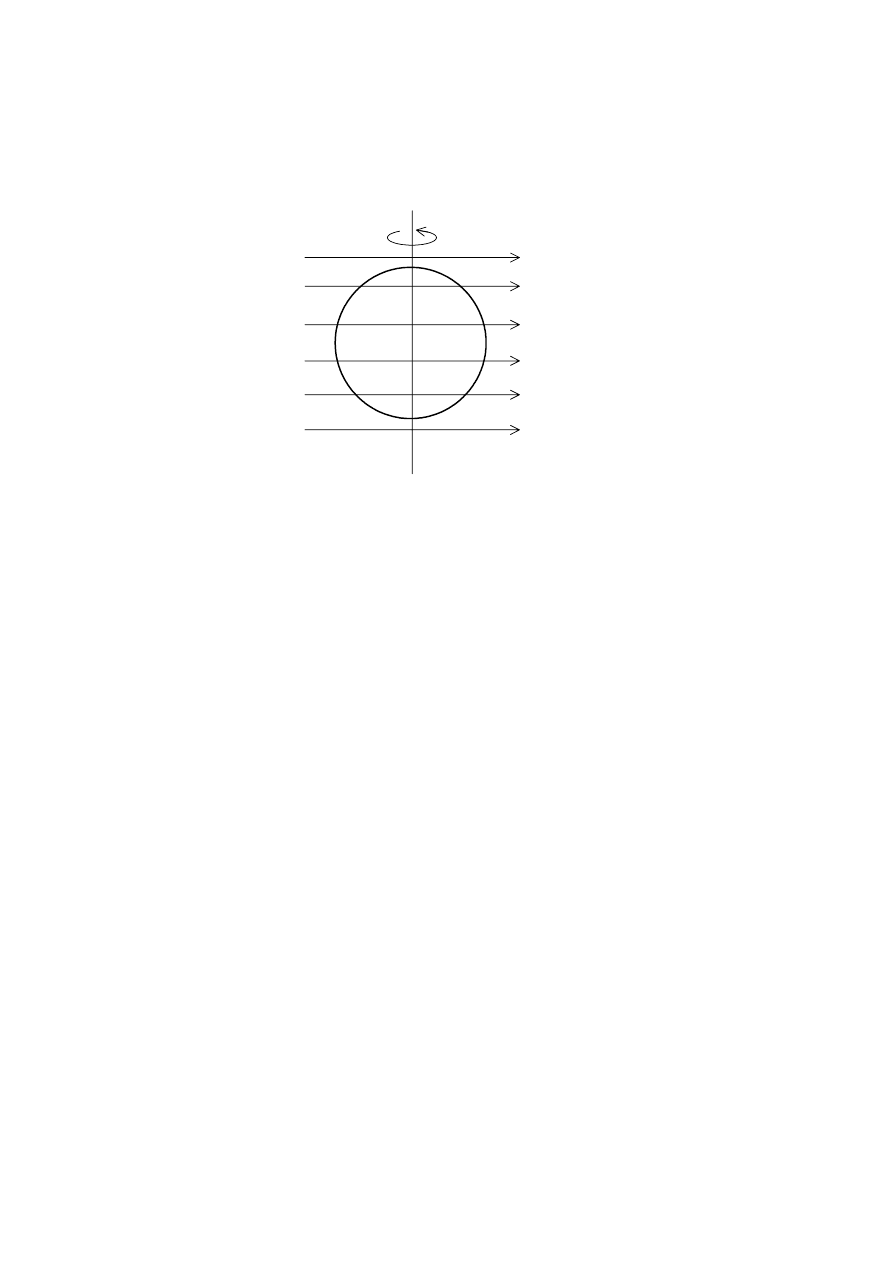
28. A loop made of conducting material is rotated about the vertical axis XY. At all times during the rotation
the loop is in a region of uniform magnetic field
X
Y
loop
uniform field
At a particular instant, in the position shown, the plane of the loop is parallel to the direction of the
magnetic field. At this instant which one of the following about the induced current and the flux is true?
maximum
zero
D.
zero
zero
C.
zero
maximum
B.
maximum
maximum
A.
flux linking the loop
induced current in the loop
– 17 –
N00/430/H(1)
880-226
Turn over
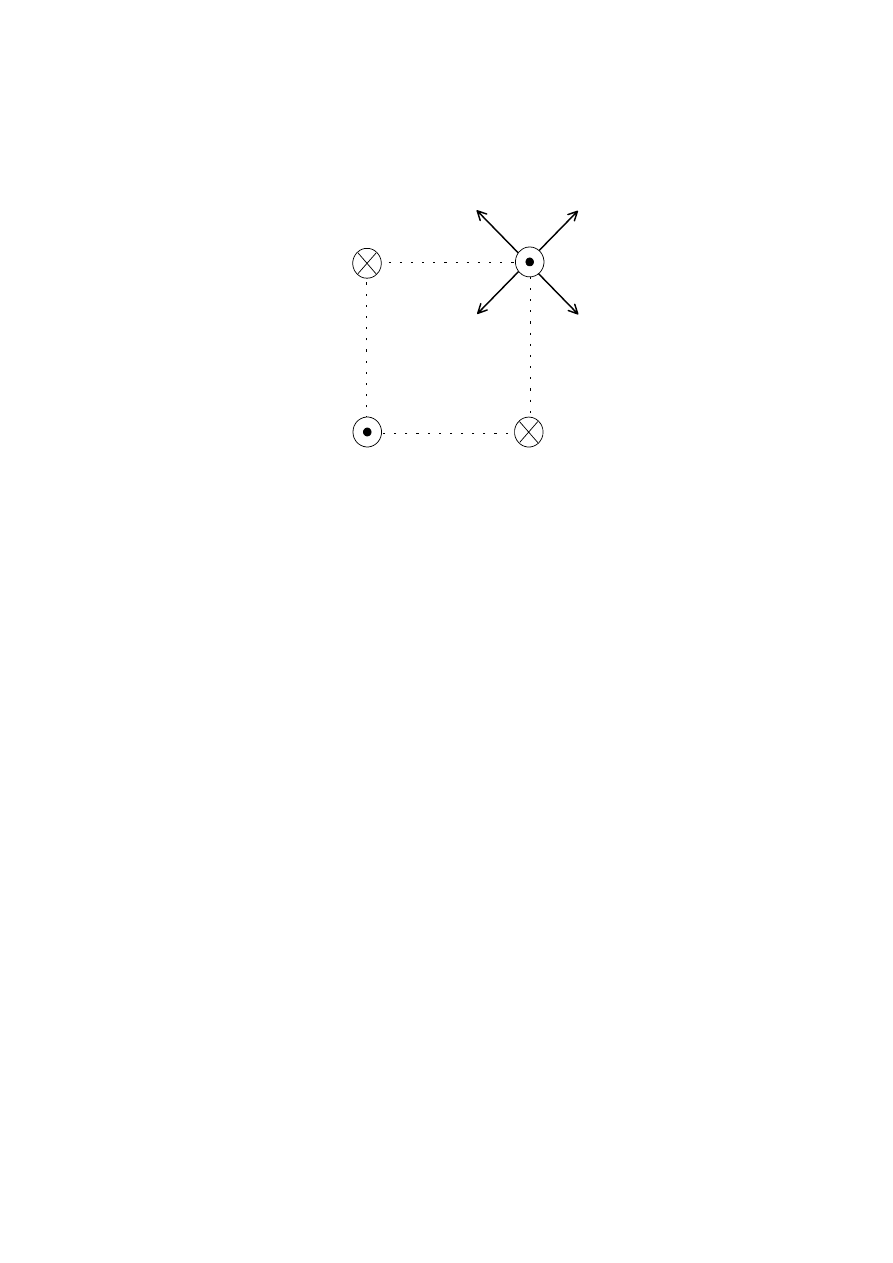
29. In the diagram four long wires are placed at the corner of a square and carry equal currents. The direction
of the current in wires P and R is into the plane of the paper and in wires Q and S is out of the plane of the
paper.
B
C
D
A
Q
P
S
R
Which labelled arrow correctly shows the direction of the resultant force on wire Q?
A.
Arrow A
B.
Arrow B
C.
Arrow C
D.
Arrow D
– 18 –
N00/430/H(1)
880-226
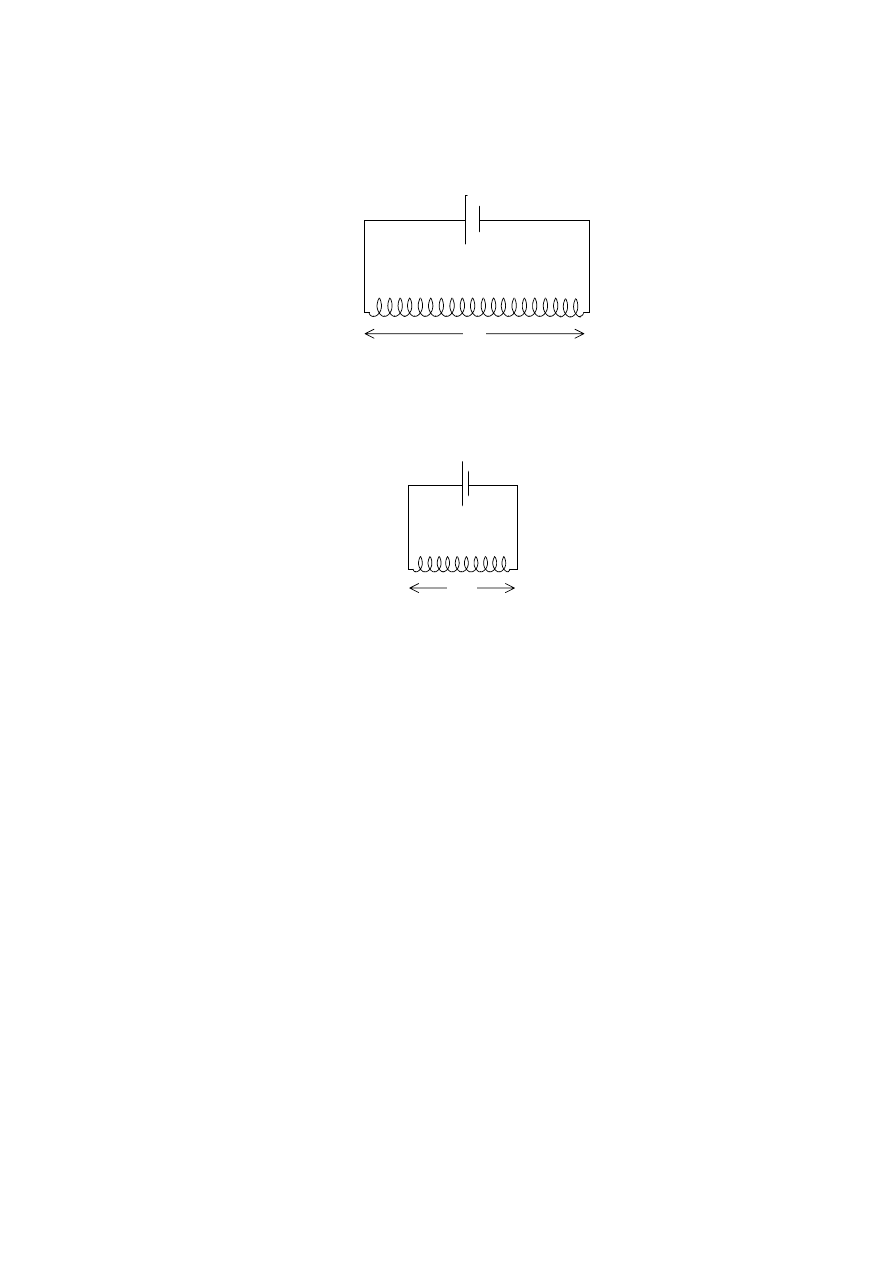
30. The diagram shows a long solenoid of length L connected to a battery of negligible internal resistance.
The magnetic field strength at the centre of the solenoid is T.
L
The solenoid is now disconnected from the battery and cut in half and one of the halves is reconnected to
the battery as shown below.
L/2
The best estimate of the field strength at the centre of this solenoid is
A.
T/2
B.
T
C.
2T
D.
4T
31. The
primary of an ideal transformer has 1000 turns and the secondary 100 turns. The current in the
primary is 2 A and the input power to the primary is 12 W.
Which one of the following about the secondary current and the secondary power output is true?
12 W
20 A
D.
120 W
0.2 A
C.
12 W
0.2 A
B.
1.2 W
20 A
A.
secondary power output
secondary current
– 19 –
N00/430/H(1)
880-226
Turn over
32. A 60 W light bulb is designed to operate from a 240 V rms alternating current mains supply. The
maximum value of the current drawn from the supply will be
A.
A.
1
4
B.
A.
1
2
C.
A.
2
4
D.
A.
4
2
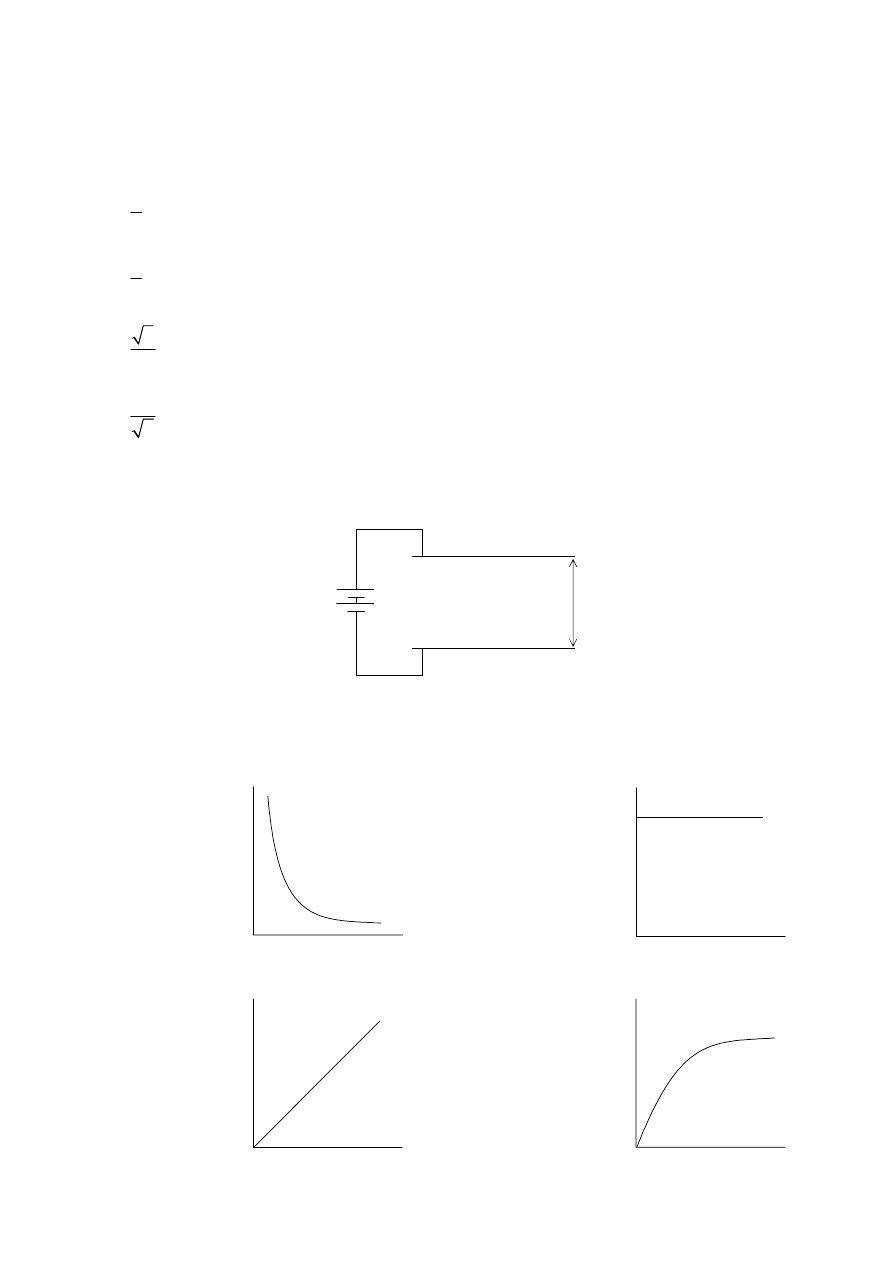
33. Two metal parallel plates are connected to a battery as shown. The separation of the plates is d.
d
Which one of the graphs below best shows how the electric field strength E varies with the separation d
of the plates?
E
Graph A
d
E
Graph B
d
E
Graph C
d
E
Graph D
d
– 20 –
N00/430/H(1)
880-226

34. An alpha particle is fired at a thin piece of gold foil and as a result passes close to a gold nucleus. As it
approaches the gold nucleus which one of the following is true about the potential energy and the
magnitude of the momentum of the alpha particle?
unchanged
increases
D.
decreases
decreases
C.
decreases
increases
B.
unchanged
decreases
A.
momentum
potential energy
35. The isotope Francium–224 has a half-life of 20 minutes. A sample of the isotope has an initial activity of
800 disintegrations s . The approximate activity of the sample an hour later will be
−
1
A.
270 disintegrations
s .
−
1
B.
200 disintegrations
s .
−
1
C.
100 disintegrations s .
−
1
D.
zero.
36. A sample of a radioactive isotope X has the same initial activity as a sample of the isotope Y. The
sample of X contains twice the number of atoms as the sample of Y. If the half-life of X is T then the
half-life of Y is
A.
2T.
B.
1.5T.
C.
T.
D.
0.5T.
– 21 –
N00/430/H(1)
880-226
Turn over
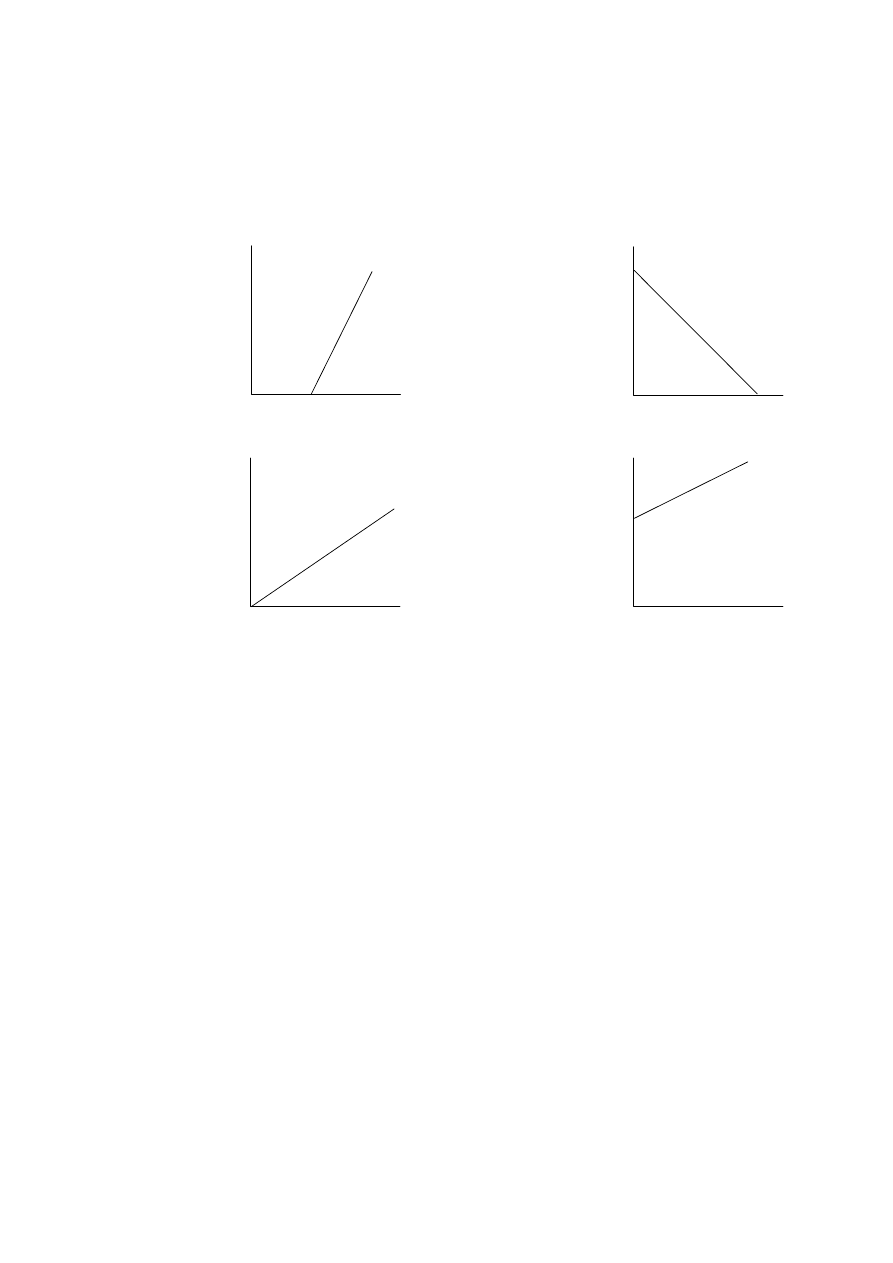
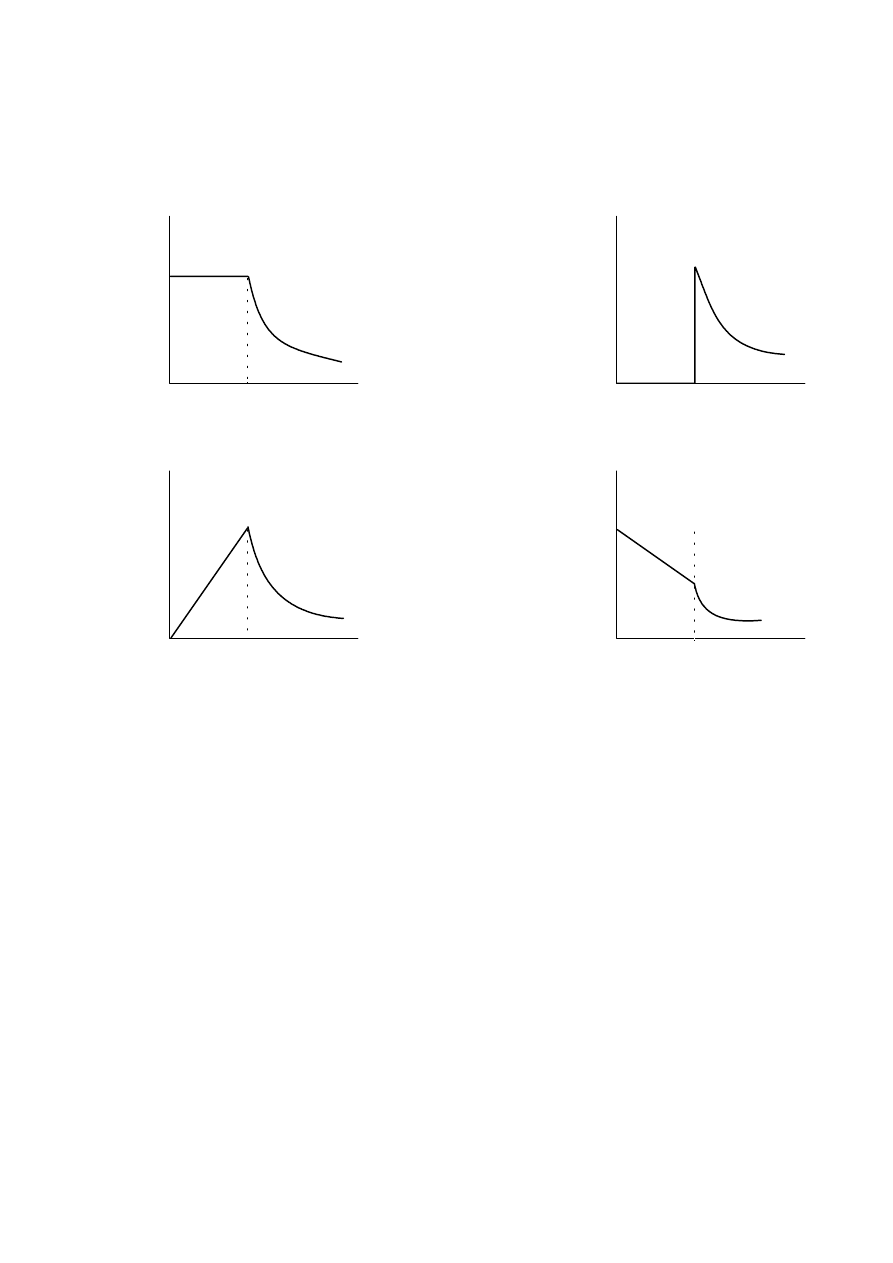
37. When light is shone onto a metal surface electrons can be ejected. Which one of the graphs best shows
the relationship between the maximum kinetic energy E of the ejected electrons and the frequency f of the
incident light?
E
Graph A
f
E
Graph B
f
E
Graph C
f
E
Graph D
f
0
0
0
0
– 22 –
N00/430/H(1)
880-226
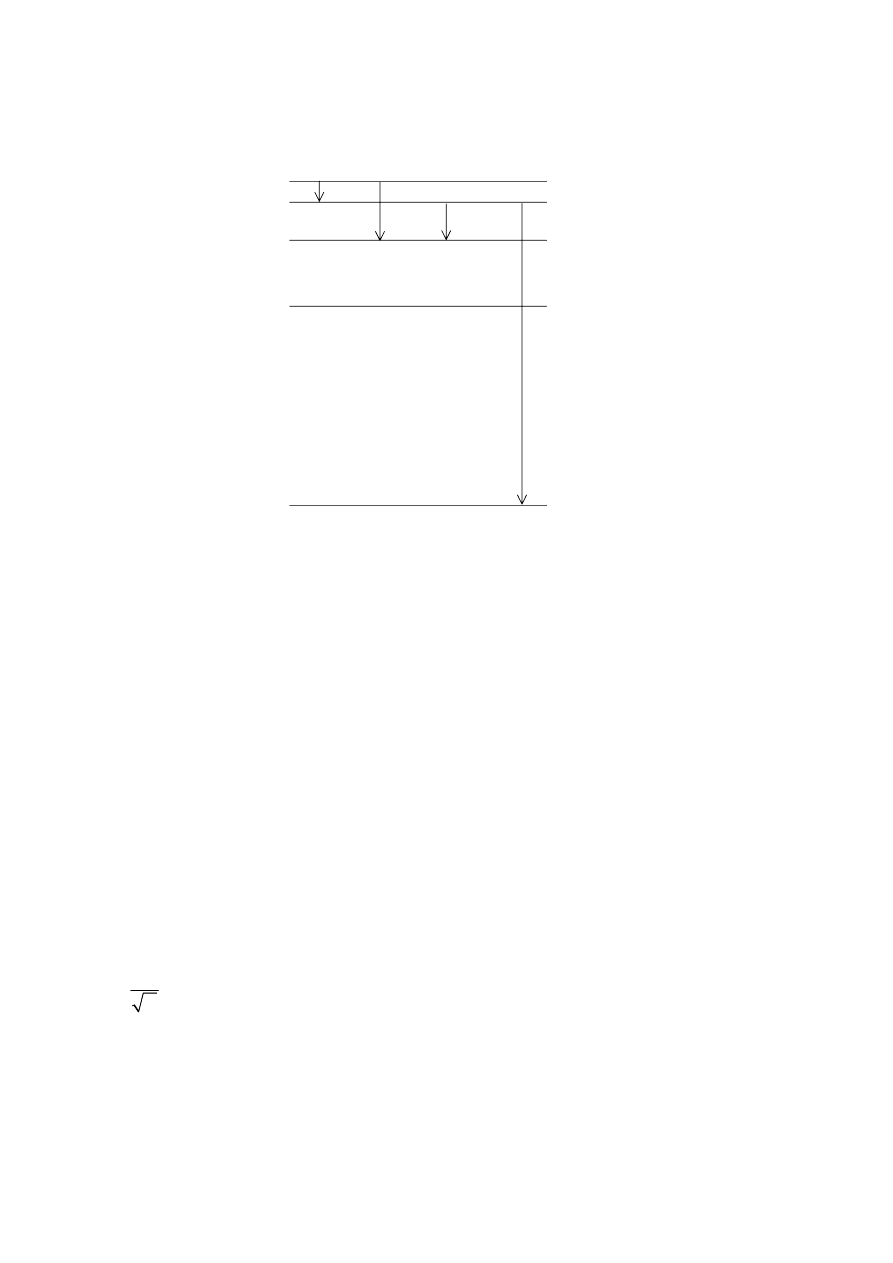
38. The diagram shows five energy levels of the hydrogen atom.
zero
-0.85 eV
-1.5 eV
-3.4 eV
-13.6 eV
A
B
C
D
Which one of the electron transitions shown will give rise to a spectral line in the ultraviolet part of the
electromagnetic spectrum?
A.
Transition A
B.
Transition B
C.
Transition C
D.
Transition D
39. The de Broglie wavelength of an electron after acceleration through a potential difference V is
proportional to
A.
V .
2
B.
V.
C.
.
1
V
D.
1/V.
– 23 –
N00/430/H(1)
880-226
Turn over

40. Nuclear binding energy is a measure of the
A.
energy liberated in the radioactive decay of a nucleus.
B.
total rest mass-energy of a nucleus.
C.
energy released when a nucleus undergoes fission.
D.
energy required to separate a nucleus into individual nucleons.
– 24 –
N00/430/H(1)
880-226
Wyszukiwarka
Podobne podstrony:
PhysHL P1 M02 MS
PhysHL P1 M06 TZ2 M
PhysHL P1 N01
PhysHL P1 M06 TZ1
PhysHL P1 M06 TZ2
PhysHL P1 M03
PhysHL P1 N01 M
PhysHL P1 M05 TZ2 M
PhysHL P1 M01
PhysHL P1 N06 TZ0
PhysHL P1 N06 TZ0 MS
PhysHL P1 N02
PhysHL P1 M04 TZ1
PhysHL P1 M04 TZ2
PhysHL P1 M02
PhysHL P1 M01 MS
PhysHL P1 N04 TZ0
PhysHL P1 M05 TZ2
PhysHL P1 M00 MS
więcej podobnych podstron