
3.1
Chapter Three
Vector Functions
3.1 Relations and Functions
We begin with a review of the idea of a function. Suppose A and B are sets. The
Cartesian product A
B
×
of these sets is the collection of all ordered pairs ( , )
a b such
that a
A
∈
and b
B
∈
. A relation R is simply a subset of A
B
×
. The domain of R is
the set dom R = {
:( , )
}
a
A a b
R
∈
∈
. In case A = B and the domain of R is all of A, we call
R a relation on A. A relation R
A
B
⊂ ×
such that ( , )
a b
R
∈
and ( , )
a c
R
∈
only if b =
c is called a function. In other words, if R is a function, and a
dom R
∈
, there is exactly
one ordered pair ( , )
a b
R
∈
. The second “coordinate” b is thus uniquely determined by a.
It is usually denoted R a
( ) . If R
A
B
⊂ ×
is a relation, the inverse of R is the relation
R
B
A
−
⊂ ×
1
defined by R
b a
a b
R
−
=
∈
1
{( , ):( , )
} .
Example
Let A be the set of all people who have ever lived and let S
A
A
⊂ ×
be the relation
defined by S
a b b
a
=
{( , ):
}
is the mother of
. The S is a relation on A, and is, in fact, a
function. The relation S
−
1
is not a function, and domS
A
−
≠
1
.
The fact that f
A
B
⊂ ×
is a function with dom f = A is frequently indicated by
writing f A
B
:
→
, and we say f is a function from A to B. Very often a function f is
defined by specifying the domain, and giving a recipe for finding f(a). Thus we may
define the function f from the interval [0,1] to the real numbers by f x
x
( )
=
2
. This says
that f is the collection of all ordered pairs ( ,
)
x x
2
in which x
∈
[ , ]
01 .
Exercises

3.2
1 .
Let A be the set of all Georgia Tech students, and let B be the set of real numbers.
Define the relation W
A
B
⊂ ×
by W
a b b
a
=
{( , ):
}
is the weight (in pounds) of
. Is
W a function? Is W
−
1
a function? Explain.
2 .
Let X be set of all states of the U. S., and let Y be the set of all U. S. municipalities.
Define the relation c
X
Y
⊂ ×
by c
x y y
x
=
{( , ):
}
is the capital of
. Explain why c is
a function, and find c(Nevada), c(Missouri), and c(Kentucky).
3 .
With X , Y as in Exercise 2, let b be the function b
x y y
x
=
{( , ):
}
is the largest city in
.
a)What is b(South Carolina)?
b)What is b(California)?
c)Let f
c
b
= ∩
, where c is the function defined in Exercise 2. Find dom f.
4 .
Suppose f
X
Y
⊂
×
and g
X
Y
⊂
×
. If f is a function, is it necessarily true that
f
g
∩
is a function? Prove your answer.
5 .
Suppose f
X
Y
⊂
×
and g
X
Y
⊂
×
. If f and g are both functions, is it necessarily
true that f
g
∪
is a function? Prove your answer.
6 .
Suppose f X
Y
:
→
is a function and the inverse f
−
1
is also a function.
a)What is f
f x
−
1
( ( )) ? Explain.
b)If y
dom f
∈
−
1
, what is f f
y
(
( ))
−
1
? Explain.
3.2 Vector Functions
Our interest now will be focused on functions f X
Y
:
→
in which Y is a set of
vectors. These are called vector functions, or sometimes, vector-valued functions.
Initially, we shall be solely interested in the special case in which X is a “nice” set of real
numbers, such as an interval. As the drama unfolds, we shall see that such functions
provide just the right tool for describing curves in space.
Let’s begin with a simple example. Let X be the entire real line and let the function
f be defined by f
i
j
( )
t
t
t
= +
2
. It should be reasonably clear that if we place the tail of

3.3
f ( )
t (actually,. a representative of f ( )
t ) at the origin, the nose will lie on the curve
y
x
=
2
. In fact, as t varies over the reals, the nose traces out this curve. The function f is
called a vector description of the curve. Let’s look at another example. This time, let
g
i
j
( )
cos
sin
t
t
t
=
+
for 0
4
≤ ≤
t
π
. What is the curve described by this function? First,
note that for all t, we have | ( )|
g t
=
1. The nose of g thus always lies on the circle of radius
one centered at the origin. It’s not difficult to see that, in fact, as t varies from 0 to 2
π
, the
nose moves around the circle once, and as t varies on from 2
π
to 4
π
, the nose traces out the
circle again.
The real usefulness of vector descriptions is most evident when we consider curves
in space. Let f
i
j
k
( )
cos
sin
t
t
t
t
=
+
+
, for all t
≥
0 . Now, what curve is followed by the
nose of f(t)? Notice first that if we look down on this curve from someplace up the
positive third axis (In other words, k is pointing directly at us.), we see the circle described
by cos
sin
t
t
i
j
+
. As t increases, we run around this circle and the third component of our
position increases linearly. Convince yourself now that this curve looks like this:
This curve is called a helix, or more precisely, a right circular helix. The picture was
drawn by Maple. Let’s draw another. How about the curve described by the vector
function g
i
j
k
(t
t
t
t
)
cos
sin
sin(
)
=
+
+
2
? This one is just a bit more exciting. Here’s a
computer drawn picture:
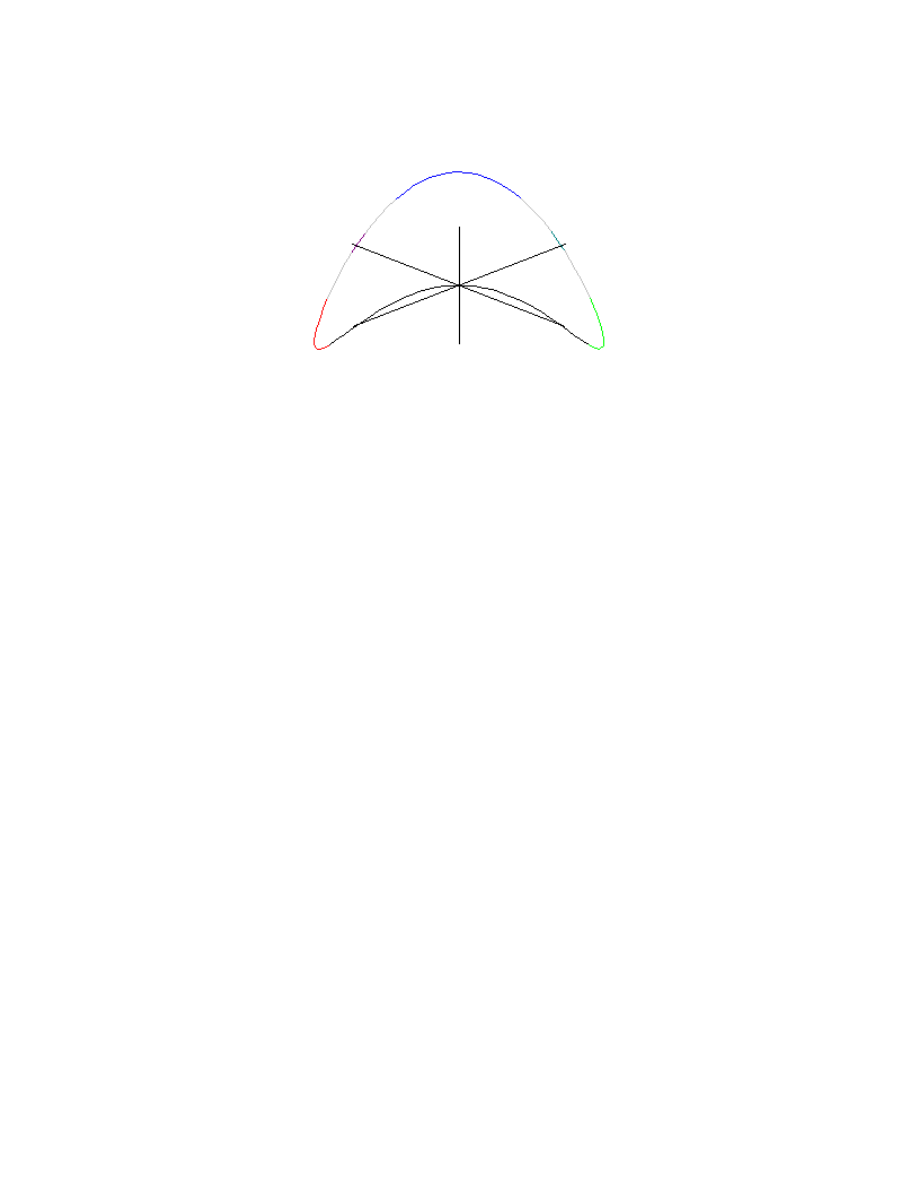
3.4
(This time we put the axes where they are “supposed to be.”)
Observe that in giving a vector description, we are in effect specifying the three
coordinates of points on the curves as ordinary real valued functions defined on a subset of
the reals. Assuming the axes are labeled x, y, and z, the curve described by the vector
function
r
i
j
k
( )
( )
( )
( )
t
f t
g t
h t
=
+
+
is equivalently described by the equations
x
f t
y
g t
z
h t
=
=
=
( )
( )
( )
These are called parametric equations of the curve (The variable t is called the
parameter.).
Exercises
7 . Sketch or otherwise describe the curve given by f
i
k
( )
t
t
t
= +
3
for
− ≤ ≤
1
3
t
.
8 . Sketch or otherwise describe the curve given by f
i
j
( )
(
)
(
)
t
t
t
=
−
+
+
2
3
3
1
.
[Hint: Find an equation in x and y, the graph of which is the given curve.]

3.5
9 . Sketch or otherwise describe the curve given by c
i
j
k
( )
cos
sin
t
t
t
=
+
+
7 .
1 0 .
Sketch
or
otherwise
describe
the
curve
given
by
c
i
j
k
( )
cos(
)
sin(
)
t
t
t
=
+
+
2
2
7
.
1 1 .
Find an equation in x and y, the graph of which is the curve
g
i
j
( )
cos
sin
t
t
t
=
+
3
4
.
1 2 .
a)Find a vector equation for the graph of y
x
x
x
=
+
+ +
3
2
2
5.
b)Find a vector equation for the graph of x
y
y
y
=
+
+ +
3
2
2
5.
1 3 .
Find a vector equation for the graph of x
y
2
3
2
3
1
+
=
.
1 4 .
a)Sketch or otherwise describe the curve given by the function r
a
b
( )
t
t
= +
, where
a
i
j
k
=
− +
2
3 and b
i
j
k
= +
−
3
5 .
b)Express r(t) in the form r
i
j
k
( )
( )
( )
( )
t
f t
g t
h t
=
+
+
.
1 5 .
Describe the curve given by L
i
j
k
( )
(
)
(
)
t
t
t
t
=
+
+ −
+
3
1
1
2
.
1 6 .
Find a vector function for the straight line passing through the point (1,4,-2) in the
direction of the vector v
i
j
k
= − +
2 .
1 7 .
a)Find a vector function for the straight line passing through the points (1,2,4) and
(3,1,5).
b)Find a vector function for the line segment joining the points (1,2,4) and (3,1,5).
18.
Let L be the line through the points (1,5,-2) and (2,2,4); and let M be the line
through the points (2,4,6) and (-3,1,-2). Find a vector description of the line which
passes through the point (1,1,2) and is perpendicular to both L and M.
3.3 Limits and Continuity
3.6
Recall from grammar school what we mean when we say the limit at t
0
of a real-
valued, or scalar, function f is L. The definition for vector functions is essentially the
same. Specifically, suppose f is a vector valued function, t
0
is a real number, and L is a
vector such that for every real number
ε
> 0, there is a
δ >
0
such that | ( )
|
f
L
t
− < ε
whenever 0
0
< − <
|
|
t
t
δ
and t is in the domain of f. This is traditionally written
lim ( )
t
t
t
→
=
0
f
L .
The vector L is called a limit of f at a.
Suppose
α
( )
t is a scalar function for which lim ( )
t
t
t
a
→
=
0
α
, and f is a vector function
for which lim ( )
t
t
t
→
=
0
f
L . It is but a modest exercise to show that
lim( ( ) ( ))
t
t
t
t
a
→
=
0
α
f
L .
To see this, we use the “behold!” method. Let
ε >
0 be given. Choose
δ δ δ
1
2
3
,
,
, and
δ
4
so that
| ( )
|
(
| |)
f
L
t
a
− <
+
ε
3 1
for 0
0
1
< − <
|
|
t
t
δ
;
| ( )
|
f
L
t
− <
ε
3
for 0
0
2
< − <
|
|
t
t
δ
;
| ( )
|
(
| |)
α
ε
t
a
− <
+
3 1 L
for 0
0
3
< − <
|
|
t
t
δ
; and
| ( )
|
α
ε
t
a
− <
3
for 0
0
4
< − <
|
|
t
t
δ
.
Now let
δ
δ δ δ δ
=
min{ ,
,
,
}
1
2
3
4
suppose t is such that 0
0
< − <
|
|
t
t
δ
. Then
| ( ) ( )
| | ( ( )
)
( ( )
)
( ( )
)( ( )
)|
| ( ( )
)| | ( ( )
)| |( ( )
)||( ( )
)|
| |
(
| |)
α
α
α
α
α
ε
ε
ε ε
ε ε ε ε
t
t
a
a
t
t
a
t
a
t
a
t
t
a
t
a
t
f
L
f
L
L
f
L
f
L
L
f
L
L
L
−
=
−
+
− +
−
−
≤
−
+
− +
−
−
+
+
+
< + + =
<
|a|
3(1+|a|)
3 1
3
3
3
3
3

3.7
Or, in other words,
lim( ( ) ( ))
t
t
t
t
a
→
=
0
α
f
L ,
which is what we set out to show.
Now suppose f
i
j
k
( )
( )
( )
( )
t
x t
y t
z t
=
+
+
and L
i
j
k
= + +
a
b
c . Then we see
that lim ( )
t
t
t
→
=
0
f
L if and only if
lim ( )
,
lim ( )
lim ( )
.
t
t
t
t
t
t
x t
a
y t
b
z t
c
→
→
→
=
=
=
0
0
0
, and
It is now easy to show that all the usual nice properties of limits are valid for vector
functions:
lim( ( )
( ))
lim ( )
lim ( ).
t
t
t
t
t
t
t
t
t
t
→
→
→
+
=
+
0
0
0
f
g
f
g
lim( ( )
( ))
(lim
( )) (lim ( ))
t
t
t
t
t
t
t
t
t
t
→
→
→
⋅
=
⋅
0
0
0
f
g
f
g
.
lim( ( )
( ))
(lim
( ))
(lim ( ))
t
t
t
t
t
t
t
t
t
t
→
→
→
×
=
×
0
0
0
f
g
f
g
.
We are now ready to say what we mean by a vector function’s being continuous at
a point of its domain. Suppose t
0
is in the domain of the vector function f. Then we say f
is continuous at t
0
if it is true that lim
t
t
0
→
=
f
f
( )
( )
t
t
0
. It is easy to see that if
f
i
j
k
( )
( )
( )
( )
t
x t
y t
z t
=
+
+
,
then f is continuous at t
0
if and only if each of the everyday scalar functions x t y t
( ), ( ), and
z t
( ) is continuous at t
0
. This shows there is nothing particularly mysterious or exotic
about continuity of vector functions.
If f is continuous at each point of its domain, then we say simply that f is
continuous,
Exercises

3.8
1 9 .
Is it possible for a function f to have more than one limit at t
t
=
0
? Prove your
answer.
2 0 .
Suppose m is a continuous real-valued function and f is a continuous vector-valued
function. Is the vector function h defined by h
f
( )
( ) ( )
t
m t
t
=
also continuous?
Explain.
2 1 .
Let f and g be continuous at t
t
=
0
. Is the function h defined by
h
f
g
( )
( )
( )
t
t
t
=
×
continuous? Explain. How about the function r t
t
t
( )
( )
( )
=
⋅
f
g
?
2 2 .
Let r
i
j
k
( )
t
t
t
t
= +
+
2
1
. Is r a continuous function? Explain.
2 3 .
Suppose r is a continuous function. Explain how you know that the length
function n t
t
( ) | ( )|
=
r
is continuous.
Wyszukiwarka
Podobne podstrony:
więcej podobnych podstron