
For release 10:00 a.m. (EDT) Thursday, August 25, 2011
USDL-11-1247
Technical information:
(202) 691-6170 • iifstaff@bls.gov • www.bls.gov/iif/oshcfoi1.htm
Media contact:
(202) 691-5902 • PressOffice@bls.gov
NATIONAL CENSUS OF FATAL OCCUPATIONAL INJURIES IN 2010
(PRELIMINARY RESULTS)
A preliminary total of 4,547 fatal work injuries were recorded in the United States in 2010, about
the same as the final count of 4,551 fatal work injuries in 2009, according to results from the
Census of Fatal Occupational Injuries (CFOI) program conducted by the U.S. Bureau of Labor
Statistics. The rate of fatal work injury for U.S. workers in 2010 was 3.5 per 100,000 full-time
equivalent (FTE) workers, the same as the final rate for 2009. Over the last 3 years, increases in the
published counts based on information received after the release of preliminary data have averaged
174 fatalities per year or about 3 percent of the revised totals. Final 2010 CFOI data will be released
in Spring 2012.
Economic factors continue to play a role in the fatal work injury counts. Total hours worked were
up slightly in 2010 in contrast to the declines recorded in both 2008 and 2009, but some historically
high-risk industries continued to experience declines or slow growth in total hours worked.
Key preliminary findings of the 2010 Census of Fatal Occupational Injuries:
• The number of fatal work injuries among the self-employed declined by 6 percent to 999
fatalities, more than the decline in their hours worked. The number of fatal injuries among
wage and salary workers increased by 2 percent in 2010.
• Fatal work injuries in the private mining industry rose from 99 in 2009 to 172 in 2010, an
increase of 74 percent. The fatal work injury rate for mining increased from 12.4 per
100,000 FTEs in 2009 to 19.9 per 100,000 in 2010. The multiple-fatality incidents at the
Upper Big Branch Mine and the Deepwater Horizon oil rig are included in these figures.
• Fatal work injuries in the private construction sector declined by 10 percent from 2009 to
2010 and are down nearly 40 percent since 2006.
• Work-related fatalities resulting from fires more than doubled from 53 in 2009 to 109 in
2010--the highest count since 2003.
• Workplace homicides declined 7 percent in 2010 to the lowest total ever recorded by the
fatality census, but workplace homicides involving women increased by 13 percent.
• Fatal work injuries among non-Hispanic black or African-American workers declined by 9
percent in 2010 while fatalities among non-Hispanic white workers were higher by 2
percent. Fatal work injuries involving Hispanic or Latino workers were down 4 percent in
2010.
• The number of fatal workplace injuries among police officers increased by 40 percent, from
96 in 2009 to 134 in 2010.
2
Profile of 2010 fatal work injuries by type of incident
The number of fatal work injuries resulting from fires and explosions rose from 113 in 2009 to 187
in 2010, an increase of 65 percent. The increase was led by an increase of 106 percent in fatalities
resulting from fires which rose from 53 in 2009 to 109 in 2010. Of the 187 fatalities involving fires
and explosions, 82 occurred in multiple fatality incidents.
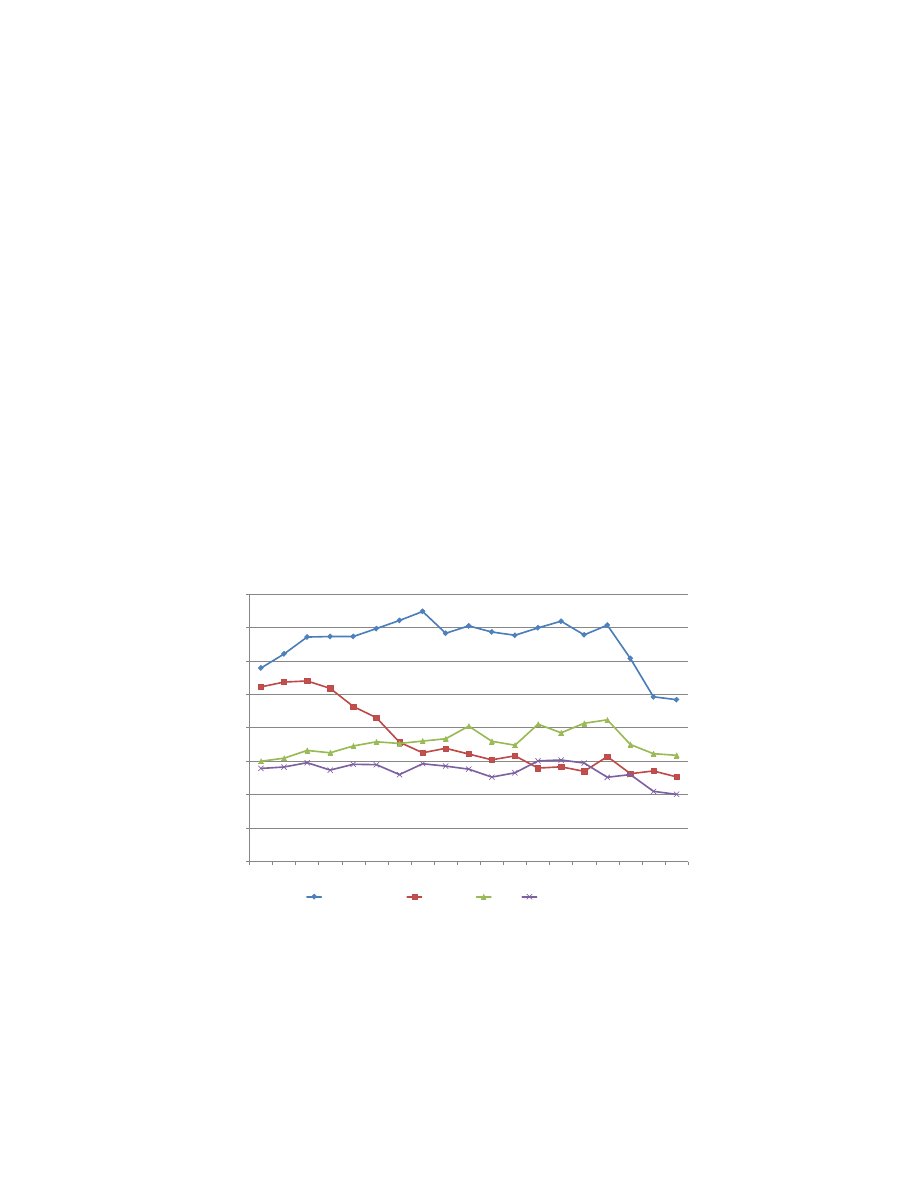
Workplace homicides fell by 7 percent in 2010. The preliminary workplace homicide total for 2010
(506 cases) represents a decline of more than 50 percent from the high of 1,080 homicides reported
in 1994. (See Chart 1.) Despite the overall decline, workplace homicides involving women were up
13 percent in 2010. Workplace suicides declined slightly from the series high of 263 cases in 2009
to 258 cases in 2010. Even with the decline, the 2010 preliminary count of workplace suicides is the
third highest annual total for the fatal work injury census.
Fatal falls declined 2 percent in 2010 (from 645 in 2009 to 635 in 2010). Overall, fatal falls are
down 25 percent from the series high of 847 fatal falls reported in 2007. Since 2007, fatal falls in
the private construction industry have decreased by 42 percent. Fatal injuries resulting from being
struck by objects or equipment were also lower, down 4 percent in 2010 to 402. Fatal work injuries
involving exposure to harmful substances or environments were up slightly, but electrocutions
declined.
1,158
1,242
1,343 1,3461,346
1,393
1,442
1,496
1,365
1,409
1,3731,353
1,3981,4371,356
1,414
1,215
985 968
1,044
1,074
1,080
1,036
927
860
714
651
677
643
609
632
559 567 540
628
526
542 506
600 618
665
651
691 716
706
721 734
810
719 696
822
770
827 847
700
645 635
557 565
591
547
582 579
520
585 571 553
505 531
602 607 589
504 520
420 402
0
200
400
600
800
1,000
1,200
1,400
1,600
1992 1993 1994 1995 1996 1997 1998 1999 2000 2001 2002 2003 2004 2005 2006 2007 2008 2009 2010
Highway incidents
Homicides
Falls
Struck by object
Chart 1. Four most frequent work-related fatal injury events, 1992–2010*
*Data for 2010 are preliminary. Data for prior years are revised and final.
NOTE: Data from 2001 exclude fatal work injuries resulting from the September 11 terrorist attacks. Transportation counts are expected to rise when updated 2010 data are
released in Spring 2012 because key source documentation on specific transportation-related incidents has not yet been received.
SOURCE: U.S. Bureau of Labor Statistics, U.S. Department of Labor, 2011.
Number of fatal work injuries
Transportation incidents decreased slightly in 2010 relative to 2009, but still accounted for nearly 2
out of every 5 fatal work injuries in 2010. Nonhighway incidents, such as an off-road tractor
overturn, were higher in 2010 (up 4 percent) as were transportation incidents involving pedestrians
and railways. Fatal occupational injuries involving water vehicle incidents and aircraft incidents
3
were both lower in 2010. (Note that transportation counts presented in this release are expected to
rise when updated 2010 data are released in Spring 2012 because key source documentation
detailing specific transportation-related incidents has not yet been received.)
For more detailed information on fatal injuries by incident, see the 2010 tables at
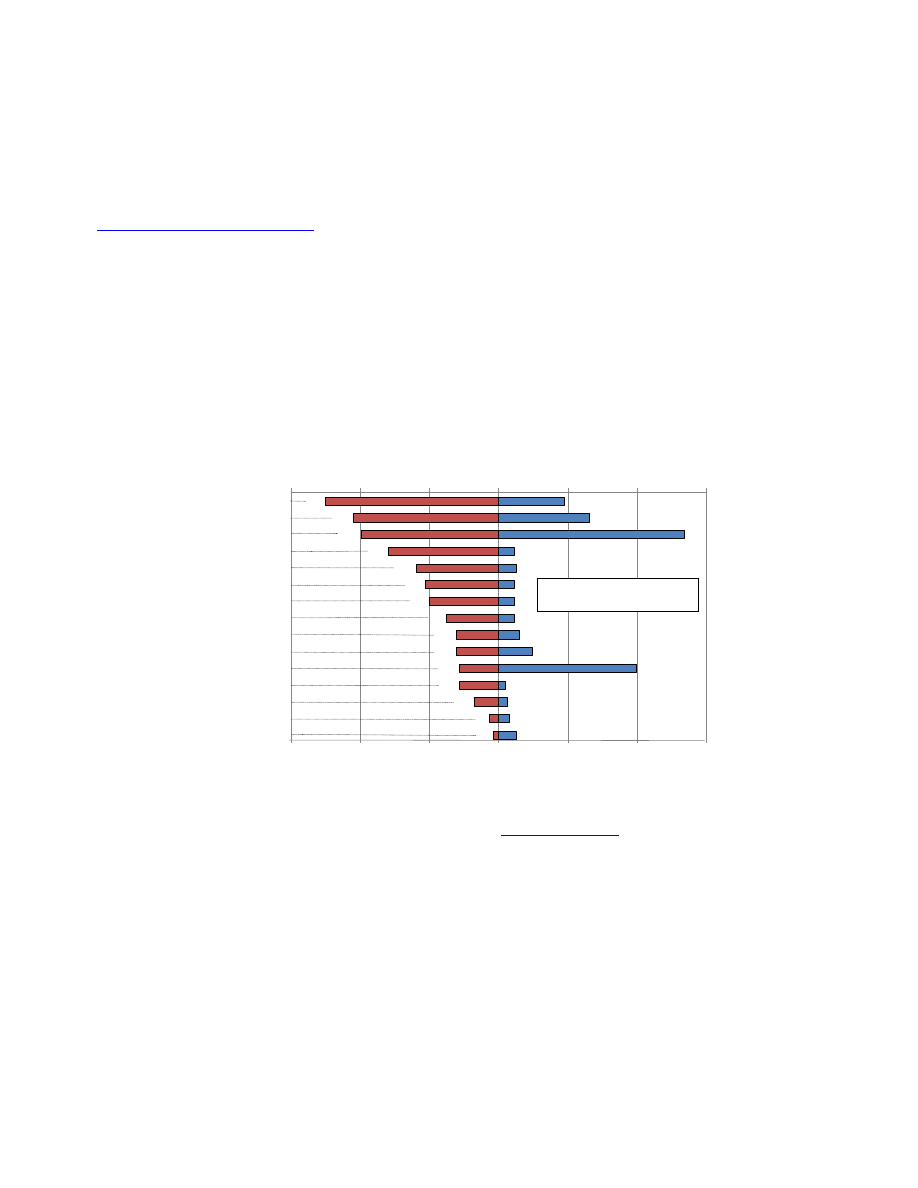
Profile of fatal work injuries in 2010 by industry sector
Private sector mining fatalities were up 74 percent in 2010, increasing from 99 cases in 2009 to 172
cases in 2010. Fatal work injuries were sharply higher both in mining activities other than oil and
gas (up 110 percent) and also in support activities for mining (up 71 percent). Multiple-fatality
incidents in this industry were a major factor in the increased fatality total in mining. The Upper Big
Branch mining disaster claimed 29 workers and 11 workers died in the Deepwater Horizon oil rig
explosion.
*Data for 2010 are preliminary.
NOTE: All industries shown are private with the exception of government, which includes fatalities to workers employed by governmental organizations regardless of industry.
Fatal injury rates exclude workers under the age of 16 years, volunteers, and resident military. The number of fatal work injuries represents total published fatal injuries before
the exclusions. For additional information on the fatal work injury rate methodology changes please see
http://www.bls.gov/iif/oshnotice10.htm
.
SOURCE: U.S. Bureau of Labor Statistics, U.S. Department of Labor, 2011.
Manufacturing
Other services (exc.
public admin.)
Professional and
business services
Utilities
Wholesale trade
Leisure and hospitality
Government
Construction
Mining
Agriculture, forestry,
fishing, and hunting
Transportation and
warehousing
Retail trade
Information
Educational and health
services
Chart 2. Number and rate of fatal occupational injuries, by industry sector, 2010*
20
0
300
172
301
186
356
229
320
596
631
751
42
185
108
169
24
9.5
13.1
26.8
2.2
2.2
2.5
2.2
2.2
3.0
1.2
4.8
19.8
0.9
2.5
1.5
Financial activities
Fatal work injury rate
(per 100,000 full-time equivalent workers)
Number of fatal work injuries
600
900
477
10
Total fatal work injuries = 4,547
All-worker fatal injury rate = 3.5
30
The number of fatal work injuries in the private industry construction sector declined by 10 percent
in 2010. Fatal work injuries in construction have declined every year since 2006 and are down
nearly 40 percent over that time. Economic conditions may explain much of this decline with total
hours worked having declined another 6 percent in construction in 2010, after declines in both 2008
and 2009. Even with the lower fatal injury total, construction accounted for more fatal work injuries
than any other industry in 2010. (See Chart 2.)
Among service-providing industries in the private sector, fatal work injuries in transportation and
warehousing accounted for 631 fatalities, about the same as the count in 2009 (633 fatalities).
However, the number of fatal injuries in truck transportation, the largest subsector within

4
transportation and warehousing in terms of employment, increased by 2 percent in 2010, led by a 17
percent increase in specialized freight trucking. Among other transportation subsectors, fatal work
injuries in air and rail transportation were higher, but fatalities in water transportation declined in
2010.
Fatal work injuries in the professional and business services sector were down 16 percent, led by a
decline in fatalities in landscape services from 168 in 2009 to 130 in 2010. Fatal injuries in the
educational and health service industries were higher by 13 percent.
Fatal work injuries among government workers were up 3 percent in 2010, due largely to an
increase in fatalities to state government workers (notably police protection workers) from 75 in
2009 to 107 in 2010. Fatal work injuries incurred by local government workers were also higher in
2010, but fatal injuries among federal government workers were lower (down 21 percent to 96 fatal
work injuries in 2010).
For more detailed information on fatal injuries by industry, see the 2010 tables at
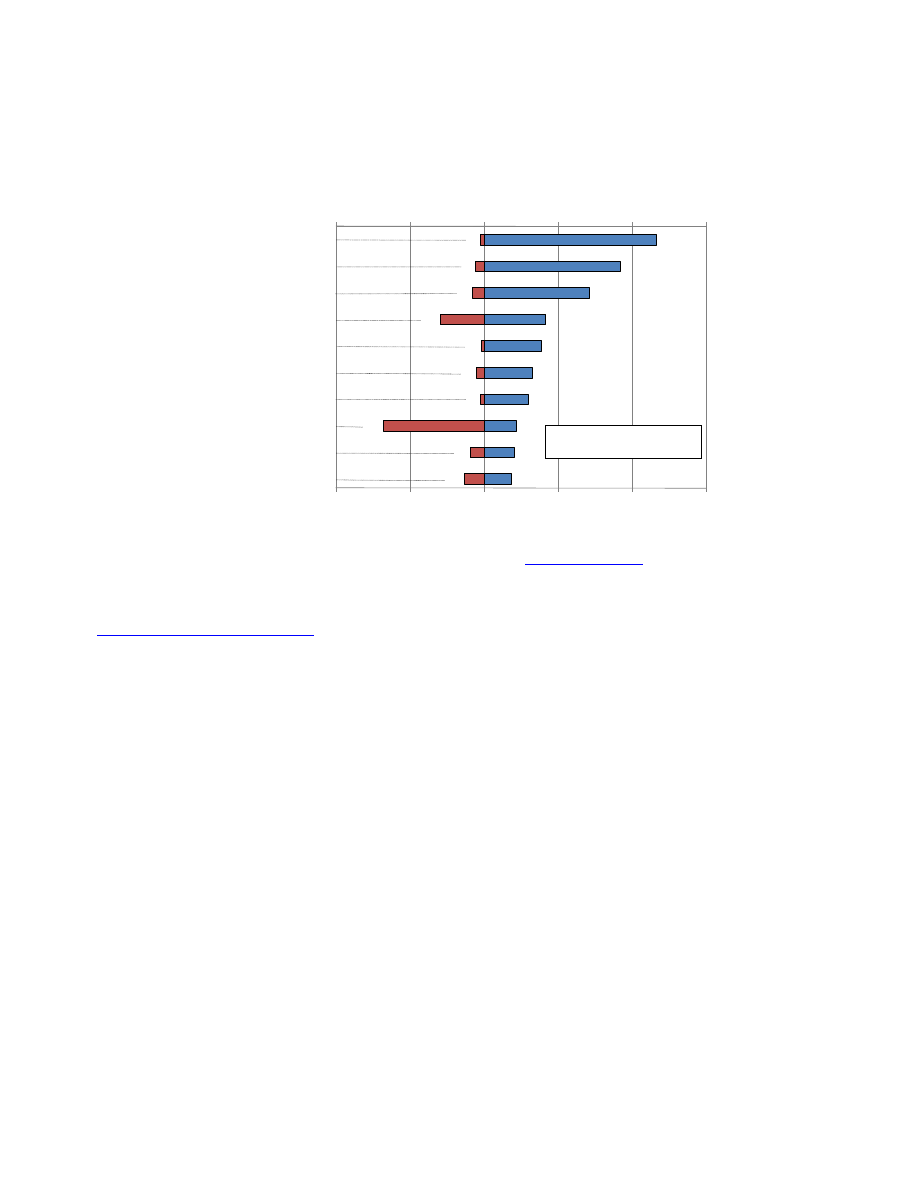
Profile of fatal work injuries in 2010 by occupation
Fatal work injuries in the construction and extraction occupations declined by 9 percent in 2010 to
the lowest level since the series high reported in 2006. Construction trades worker fatalities were
down 15 percent (from 621 in 2009 to 530 in 2010) and have declined 46 percent since 2006. Fatal
work injuries involving construction laborers, the worker subgroup accounting for the highest
number of fatalities in the construction trades worker group, were down by 16 percent in 2010 to
193 fatal work injuries. In contrast, fatal work injuries involving extraction workers were up
sharply, from 59 in 2009 to 91 in 2010 including a number of fatal work injuries from the Upper
Big Branch Mine and Deepwater Horizon oil rig incidents.
Fatal work injuries involving farming, fishing, and forestry workers increased by 9 percent in 2010.
Fatalities involving agricultural workers, including farmworkers and laborers, rose from 127 in
2009 to 156 in 2010. Fatalities among logging workers also increased in 2010 from 36 in 2009 to 59
in 2010, but fatalities among fishers and related fishing workers declined.
The number of fatal work injuries among protective service occupations increased by 6 percent in
2010 after two years of declines. The increase was led by fatalities among police officers which rose
40 percent from 96 to 134 in 2010. Of the 134 fatal work injuries among police officers, 57
involved highway incidents and 48 involved homicides. Most other subgroups in the protective
service occupational group declined in 2010.
Fatal work injuries involving workers in transportation and material moving occupations were
higher by 5 percent in 2010 and accounted for about one quarter of all occupational fatalities.
Driver/sales workers and truck drivers, the subgroup with the highest number of fatal work injuries
within the transportation and material moving group, led the increase. Fatalities in this subgroup
rose from 647 in 2009 to 683 in 2010, an increase of 6 percent.
5
Fatal work injuries involving resident military personnel decreased 44 percent in 2010 to 42
fatalities.
*Data for 2010 are preliminary.
NOTE: Fatal injury rates exclude workers under the age of 16 years, volunteers, and resident military. The number of fatal work injuries represents total published fatal injuries
before the exclusions. For additional information on the fatal work injury rate methodology changes please see
http://www.bls.gov/iif/oshnotice10.htm
.
SOURCE: U.S. Bureau of Labor Statistics, U.S. Department of Labor, 2011.
100
41.4
Chart 3. Occupations with high fatal work injury rates, 2010*
116.0
91.9
Logging workers
Aircraft pilots and flight
engineers
Refuse and recyclable
material collectors
Farmers and ranchers
Driver/sales workers and
truck drivers
Fishers and related
fishing workers
Roofers
Fatal work injury rate
(per 100,000 full-time equivalent workers)
Number of fatal work injuries
70.6
500
50
Total fatal work injuries = 4,547
All-worker fatal injury rate = 3.5
Industrial machinery installation,
repair, and maintenance workers
1,000
0
150
Mining machine operators
Police and sheriff's patrol officers
38.7
32.4
29.8
21.8
20.3
18.0
29
59
78
300
23
57
683
26
96
133
For more detailed information on fatal injuries by occupation, see the 2010 tables at
Profile of fatal work injuries in 2010 by worker characteristics
The number of fatal work injuries rose 2 percent among non-Hispanic white workers in 2010, but
were lower for both non-Hispanic black or African-American workers and for Hispanic or Latino
workers. The largest decline was among non-Hispanic black or African-American workers who
recorded 9 percent fewer fatalities in 2010 after a decline of 21 percent in 2009. With the lower
count in 2010, fatal work injuries among black or African-American workers have decreased by
more than a third (37 percent) since 2007.
Fatal work injuries among Hispanic or Latino workers were down 4 percent in 2010 to the lowest
level since 1997. Of the 682 fatal work injuries involving Hispanic or Latino workers, 427 (or 63
percent) involved foreign-born workers. Overall, there were 774 fatal work injuries involving
foreign-born workers in 2010, of which the greatest share (297 or 38 percent) were born in Mexico.
Total hours worked for wage and salary workers increased slightly in 2010, but declined by nearly 2
percent for the self-employed. Fatal injuries to self-employed workers (the lowest annual total since
the fatality census was first conducted in 1992) declined 6 percent from 2009 to 2010, while
fatalities among wage and salary workers rose by 2 percent.

6
Fatal work injuries incurred by women increased by 6 percent in 2010, but declined by 1 percent for
men. Fatal work injuries increased for workers under 18 years of age, workers age 25 to 34, and for
workers 55 years of age and older. All other age groups recorded lower numbers of fatalities.
Profile of fatal work injuries by state
Twenty-seven states and the District of Columbia reported higher numbers of fatal work injuries in
2010 than in 2009, while 23 states reported lower numbers.
For more detailed state results, contact the individual state agency responsible for the collection of
CFOI data in that state. Although data for Puerto Rico, the Virgin Islands, and Guam are not
included in the national totals for this release, results for these jurisdictions are available.
Participating agencies and their telephone numbers are listed in Table 6.
Background of the program
The Census of Fatal Occupational Injuries (CFOI), part of the BLS Occupational Safety and Health
Statistics (OSHS) program, compiles a count of all fatal work injuries occurring in the U.S. during
the calendar year. The CFOI program uses diverse state, federal, and independent data sources to
identify, verify, and describe fatal work injuries. This assures counts are as complete and accurate
as possible. For the 2010 data, over 18,000 unique source documents were reviewed as part of the
data collection process.
Another OSHS program, the Survey of Occupational Injuries and Illnesses (SOII), presents
frequency counts and incidence rates by industry and also by detailed case circumstances and
worker characteristics of nonfatal workplace injuries and illnesses that result in days away from
work. Incidence rates for 2010 by industry will be published in October 2011, and information on
2010 case circumstances and worker characteristics will be available in November 2011. For
additional data, access the BLS Internet site:
. For technical information about and
definitions for the CFOI program, please go to the BLS Handbook of Methods on the BLS web site
here:
www.bls.gov/opub/hom/homch9_a1.htm

Table 1. Fatal occupational injuries by event or exposure, 2009-2010
Event or exposure1
Fatal injuries
20092
2010
p
Number
Percent
Total ...................................................................................................................
4,551
4,547
100
Transportation incidents .....................................................................................
1,795
1,766
39
Highway .............................................................................................................
985
968
21
Collision between vehicles, mobile equipment ...............................................
466
501
11
Moving in same direction ...........................................................................
117
119
3
Moving in opposite directions, oncoming ...................................................
184
182
4
Moving in intersection ................................................................................
82
102
2
Vehicle struck object on side of road .............................................................
255
244
5
Noncollision ....................................................................................................
240
195
4
Jack-knifed or overturned-no collision ........................................................
202
173
4
Nonhighway (farm, industrial premises) .............................................................
261
272
6
Overturned .................................................................................................
133
154
3
Worker struck by a vehicle .................................................................................
268
277
6
Railway accident ................................................................................................
34
44
1
Water vehicle accident .......................................................................................
86
52
1
Aircraft accident .................................................................................................
159
151
3
Assaults and violent acts ....................................................................................
837
808
18
Homicides ..........................................................................................................
542
506
11
Shooting .........................................................................................................
434
401
9
Stabbing .........................................................................................................
49
34
1
Self-inflicted injuries ...........................................................................................
263
258
6
Contact with objects and equipment .................................................................
741
732
16
Struck by object or equipment ............................................................................
420
402
9
Struck by falling object or equipment .............................................................
272
263
6
Struck by flying object or equipment ..............................................................
41
36
1
Caught in or compressed by equipment or objects ............................................
233
224
5
Caught in running equipment or machinery ...................................................
114
90
2
Caught in or crushed in collapsing materials .....................................................
80
91
2
Falls .......................................................................................................................
645
635
14
Fall to lower level ...............................................................................................
538
515
11
Fall from ladder ..............................................................................................
127
129
3
Fall from roof ..................................................................................................
109
117
3
Fall from scaffold, staging ..............................................................................
54
44
1
Fall on same level ..............................................................................................
93
93
2
Exposure to harmful substances or environments ..........................................
404
409
9
Contact with electric current ...............................................................................
170
163
4
Contact with overhead power lines ................................................................
63
76
2
Contact with temperature extremes ...................................................................
41
45
1
Exposure to caustic, noxious, or allergenic substances .....................................
129
139
3
Inhalation of substance ..................................................................................
45
57
1
Oxygen deficiency ..............................................................................................
62
60
1
Drowning, submersion ...................................................................................
51
45
1
Fires and explosions ...........................................................................................
113
187
4
1 Based on the 2007 BLS Occupational Injury and Illness Classification Manual. Includes other events and
exposures, such as bodily reaction, in addition to those shown separately.
2 Totals for 2009 are revised and final. Preliminary 2009 data issued August 19, 2010, reported a total of 4,340
fatal work injuries for calendar year 2009. Since then, an additional 211 job-related fatal injuries were identified,
bringing the total job-related fatal injury count for 2009 to 4,551.
p
Data for 2010 are preliminary. Revised and final 2010 data are scheduled to be released in Spring 2012.
NOTE: Totals for major categories may include subcategories not shown separately. Percentages may not add to
totals because of rounding. CFOI fatality counts exclude illness-related deaths unless precipitated by an injury event.
SOURCE: U.S. Department of Labor, Bureau of Labor Statistics, in cooperation with State, New York City, District
of Columbia, and Federal agencies, Census of Fatal Occupational Injuries
7

Table 2. Fatal occupational injuries by industry and selected event or exposure, 2010
p
Industry1
Fatal injuries
Selected event or exposure2
(percent of total for industry)
Number
Percent
Highway3
Homicides
Falls
Struck by object
Total .............................................................................................
4,547
100
21
11
14
9
Private industry ...............................................................................
4,070
90
21
10
15
9
Goods producing ...........................................................................
1,839
40
13
2
19
13
Natural resources and mining ....................................................
768
17
14
1
5
17
Agriculture, forestry, fishing and hunting .....................................
596
13
12
1
5
18
Crop production .......................................................................
312
7
12
1
6
16
Animal production ....................................................................
151
3
10
–
7
11
Forestry and logging ................................................................
70
2
17
–
–
54
Mining4 ........................................................................................
172
4
23
–
6
15
Mining, except oil and gas .......................................................
61
1
–
–
–
13
Support activities for mining ....................................................
99
2
35
–
7
16
Construction ................................................................................
751
17
11
1
35
8
Construction ................................................................................
751
17
11
1
35
8
Construction of buildings .........................................................
157
3
7
2
50
9
Heavy and civil engineering construction ................................
143
3
16
–
9
10
Specialty trade contractors ......................................................
430
9
11
1
37
8
Manufacturing ..............................................................................
320
7
16
4
13
15
Manufacturing ..............................................................................
320
7
16
4
13
15
Food manufacturing .................................................................
53
1
21
9
21
–
Fabricated metal product manufacturing .................................
47
1
11
–
21
26
Service providing ..........................................................................
2,231
49
26
18
11
6
Trade, transportation, and utilities ............................................
1,141
25
36
17
8
6
Wholesale trade ...........................................................................
185
4
32
12
8
13
Merchant wholesalers, durable goods .....................................
87
2
32
9
–
22
Merchant wholesalers, nondurable goods ...............................
91
2
31
15
11
4
Retail trade ..................................................................................
301
7
14
45
12
5
Motor vehicle and parts dealers ..............................................
45
1
31
22
9
11
Food and beverage stores .......................................................
79
2
5
72
8
–
Transportation and warehousing .................................................
631
14
48
6
6
5
Truck transportation .................................................................
396
9
64
1
7
6
Transit and ground passenger transportation ..........................
62
1
35
45
5
–
Utilities .........................................................................................
24
1
17
–
–
–
Information ...................................................................................
42
1
45
–
12
–
Financial activities .......................................................................
108
2
14
30
20
–
Finance and insurance ................................................................
23
1
17
30
30
–
Real estate and rental and leasing ..............................................
85
2
13
29
18
–
Professional and business services ..........................................
356
8
17
6
18
12
Professional and technical services ............................................
76
2
21
–
9
4
Administrative and waste services ..............................................
280
6
16
6
20
14
Educational and health services ................................................
169
4
20
13
16
–
Educational services ....................................................................
30
1
–
–
20
–
Health care and social assistance ...............................................
139
3
23
14
15
–
Leisure and hospitality ...............................................................
229
5
10
35
10
3
Arts, entertainment, and recreation .............................................
79
2
13
8
10
6
Accommodation and food services ..............................................
150
3
9
50
11
–
Other services, except public administration ...........................
186
4
17
23
11
10
Government5 ...................................................................................
477
10
27
17
8
4
Federal government ........................................................................
96
2
21
11
5
5
State government ............................................................................
107
2
25
18
5
–
Local government ............................................................................
267
6
30
20
10
5
1 Based on the 2007 North American Industry Classification System.
2 Based on the 2007 BLS Occupational Injury and Illness Classification Manual. The figure shown is the percent of the total fatal injuries for that industry group.
3 "Highway" includes deaths to vehicle occupants resulting from traffic incidents that occur on the public roadway, shoulder, or surrounding area. It excludes incidents
occurring entirely off the roadway, such as in parking lots and on farms; incidents involving trains; and deaths to pedestrians or other nonpassengers.
4 Includes fatal injuries at all establishments categorized as Mining (Sector 21) in the North American Industry Classification System, 2007, including establishments not
governed by the Mine Safety and Health Administration (MSHA) rules and reporting, such as those in Oil and Gas Extraction.
5 Includes fatal injuries to workers employed by governmental organizations regardless of industry.
p
Data for 2010 are preliminary. Revised and final 2010 data are scheduled to be released in Spring 2012.
NOTE: Totals for major categories may include subcategories not shown separately. Percentages may not add to totals because of rounding. Dashes indicate no data
reported or data that do not meet publication criteria. CFOI fatality counts exclude illness-related deaths unless precipitated by an injury event. There were zero fatal injuries
for which there was insufficient information to determine a specific industry classification.
SOURCE: U.S. Department of Labor, Bureau of Labor Statistics, in cooperation with State, New York City, District of Columbia, and Federal agencies, Census of Fatal
Occupational Injuries
8

Table 3. Fatal occupational injuries by occupation and selected event or exposure, 2010
p
Occupation1
Fatal injuries
Selected event or exposure2
(percent of total for occupation)
Number
Percent
Highway3
Homicides
Falls
Struck by
object
Total ...................................................................................................................
4,547
100
21
11
14
9
Management occupations ...................................................................................
533
12
14
10
9
12
Top executives ...................................................................................................
29
1
21
10
–
–
Operations specialties managers .......................................................................
34
1
18
9
21
12
Other management occupations ........................................................................
463
10
12
10
9
13
Business and financial operations occupations ...............................................
25
1
28
–
16
–
Computer and mathematical occupations .........................................................
11
4
(
)
–
–
–
–
Architecture and engineering occupations .......................................................
51
1
25
–
12
–
Engineers ...........................................................................................................
32
1
31
–
12
–
Life, physical, and social science occupations ................................................
28
1
11
–
–
–
Community and social services occupations ...................................................
24
1
58
12
12
–
Legal occupations ................................................................................................
9
4
(
)
–
–
–
–
Education, training, and library occupations ....................................................
30
1
17
33
23
–
Arts, design, entertainment, sports, and media occupations ..........................
53
1
19
6
17
–
Entertainers and performers, sports and related workers ..................................
36
1
19
–
11
–
Healthcare practitioners and technical occupations ........................................
65
1
15
11
6
–
Health diagnosing and treating practitioners ......................................................
41
1
15
10
7
–
Health technologists and technicians .................................................................
24
1
17
12
–
–
Healthcare support occupations ........................................................................
17
4
(
)
24
29
–
–
Protective service occupations ..........................................................................
258
6
31
37
3
2
Fire fighting and prevention workers ..................................................................
27
1
33
–
11
–
Law enforcement workers ..................................................................................
145
3
41
37
–
2
Other protective service workers ........................................................................
63
1
11
56
–
–
Food preparation and serving related occupations .........................................
60
1
7
40
18
–
Supervisors, food preparation and serving workers ...........................................
21
4
(
)
–
24
–
–
Building and grounds cleaning and maintenance occupations ......................
226
5
8
5
25
16
Building cleaning and pest control workers ........................................................
45
1
9
20
24
–
Grounds maintenance workers ..........................................................................
141
3
10
–
21
21
Personal care and service occupations .............................................................
65
1
11
25
6
–
Sales and related occupations ...........................................................................
274
6
16
48
9
4
Supervisors, sales workers ................................................................................
140
3
10
48
8
7
Retail sales workers ...........................................................................................
86
2
7
62
10
–
Sales representatives, services .........................................................................
9
4
(
)
67
–
–
–
Sales representatives, wholesale and manufacturing ........................................
17
4
(
)
76
–
–
–
Office and administrative support occupations ................................................
68
1
31
16
15
4
Material recording, scheduling, dispatching, and distributing workers ...............
29
1
28
17
10
10
Farming, fishing, and forestry occupations ......................................................
260
6
11
1
6
20
Agricultural workers ............................................................................................
156
3
12
–
10
6
Fishing and hunting workers ..............................................................................
30
1
–
–
–
–
Forest, conservation, and logging workers ........................................................
60
1
12
–
–
67
Construction and extraction occupations .........................................................
760
17
9
1
33
9
Supervisors, construction and extraction workers ..............................................
110
2
18
–
25
14
Construction trades workers ..............................................................................
530
12
7
1
40
7
Extraction workers ..............................................................................................
91
2
10
–
10
20
Installation, maintenance, and repair occupations ...........................................
351
8
11
6
17
17
Vehicle and mobile equipment mechanics, installers, and repairers .................
121
3
13
10
5
32
Other installation, maintenance, and repair occupations ...................................
190
4
8
3
23
9
Production occupations ......................................................................................
222
5
7
8
14
13
Supervisors, production workers ........................................................................
35
1
9
14
17
–
Metal workers and plastic workers .....................................................................
68
1
7
–
12
24
Transportation and material moving occupations ............................................
1,115
25
45
7
6
5
Air transportation workers ..................................................................................
78
2
–
–
–
–
Motor vehicle operators ......................................................................................
767
17
62
7
5
4
Water transportation workers .............................................................................
19
4
(
)
–
–
–
–
Material moving workers ....................................................................................
200
4
6
6
15
11
Military occupations5 ..........................................................................................
42
1
–
–
–
7
1 Based on the 2000 Standard Occupational Classification system.
2 Based on the 2007 BLS Injury and Illness Classification Manual. The figure shown is the percent of the total fatal injuries for that occupation group.
3 "Highway" includes deaths to vehicle occupants resulting from traffic incidents that occur on the public roadway, shoulder, or surrounding area. It excludes incidents
occurring entirely off the roadway, such as in parking lots and on farms; incidents involving trains; and deaths to pedestrians or other non passengers.
4 Less than or equal to 0.5 percent.
5 Includes fatal injuries to persons identified as resident armed forces regardless of individual occupation listed.
p
Data for 2010 are preliminary. Revised and final 2010 data are scheduled to be released in Spring 2012.
NOTE: Totals for major categories may include subcategories not shown separately. Percentages may not add to totals because of rounding. Dashes indicate no data
reported or data that do not meet publication criteria. CFOI fatality counts exclude illness-related deaths unless precipitated by an injury event. There were zero fatal
injuries for which there was insufficient information to determine a specific occupation classification.
SOURCE: U.S. Department of Labor, Bureau of Labor Statistics, in cooperation with State, New York City, District of Columbia, and Federal agencies, Census of Fatal
Occupational Injuries
9

Table 4. Fatal occupational injuries by selected worker characteristics and selected event or exposure, 2010
p
Characteristic
Fatal injuries
Selected event or exposure1
(percent of total for characteristic category)
Number
Percent
Highway2
Homicides
Falls
Struck by
object
Total .....................................................................................................
4,547
100
21
11
14
9
Employee status
Wage and salary3 ................................................................................
3,548
78
24
10
14
8
Self-employed4 ....................................................................................
999
22
11
14
14
13
Sex
Men ......................................................................................................
4,192
92
21
10
14
9
Women ................................................................................................
355
8
27
26
13
2
Age5
Under 16 years ....................................................................................
16
6
(
)
19
–
–
–
16-17 years ..........................................................................................
19
6
(
)
21
–
–
–
18-19 years ..........................................................................................
53
1
15
11
6
8
20-24 years ..........................................................................................
240
5
19
12
9
10
25-34 years ..........................................................................................
756
17
24
12
9
8
35-44 years ..........................................................................................
849
19
19
13
11
9
45-54 years ..........................................................................................
1,124
25
22
11
16
7
55-64 years ..........................................................................................
921
20
22
11
18
9
65 years and older ...............................................................................
565
12
20
7
18
12
Race or ethnic origin7
White ...................................................................................................
3,279
72
22
8
14
10
Black or African-American ...................................................................
384
8
27
26
9
5
Hispanic or Latino ................................................................................
682
15
15
13
18
9
American Indian or Alaska Native .......................................................
31
1
23
–
16
–
Asian ....................................................................................................
136
3
15
43
8
2
Native Hawaiian or Pacific Islander .....................................................
5
6
(
)
–
–
–
–
Multiple races ......................................................................................
7
6
(
)
–
43
43
–
Other or not reported ...........................................................................
23
1
17
13
13
–
1 Based on the 2007 BLS Occupational Injury and Illness Classification Manual. The figure shown is the percent of the total fatal injuries for that
demographic group.
2 "Highway" includes deaths to vehicle occupants resulting from traffic incidents that occur on the public roadway, shoulder, or surrounding area. It
excludes incidents occurring entirely off the roadway, such as in parking lots and on farms; incidents involving trains; and deaths to pedestrians or other
nonpassengers.
3 May include volunteers and workers receiving other types of compensation.
4 Includes self-employed workers, owners of unincorporated businesses and farms, paid and unpaid family workers, members of partnerships, and
may include owners of incorporated businesses.
5 There were 4 fatal injuries for which there was insufficient information to determine the age of the decedent.
6 Less than or equal to 0.5 percent.
7 Persons identified as Hispanic or Latino may be of any race. The race categories shown exclude Hispanic and Latino workers.
p
Data for 2010 are preliminary. Revised and final 2010 data are scheduled to be released in Spring 2012.
NOTE: Totals for major categories may include subcategories not shown separately. Percentages may not add to totals because of rounding. Dashes
indicate no data reported or data that do not meet publication criteria. CFOI fatality counts exclude illness-related deaths unless precipitated by an injury
event.
SOURCE: U.S. Department of Labor, Bureau of Labor Statistics, in cooperation with State, New York City, District of Columbia, and Federal agencies,
Census of Fatal Occupational Injuries
10

Table 5. Fatal occupational injuries by state and event or exposure, 2009-2010
State of injury
Total fatal injuries1
Event or exposure4
2010
20092
(revised)
20103
,p
Transpor-
tation
incidents5
Assaults
and violent
acts6
Contact with
objects and
equipment
Falls
Exposure to
harmful sub-
stances or
environ-
ments
Fires and
explosions
Total ....................................................................................
4,551
4,547
1,766
808
732
635
409
187
Alabama ..................................................................................
75
86
30
20
16
13
4
–
Alaska ......................................................................................
17
39
24
4
5
–
4
–
Arizona ....................................................................................
76
75
27
24
8
9
7
–
Arkansas .................................................................................
75
87
40
9
13
12
12
–
California .................................................................................
409
302
91
73
43
59
26
10
Colorado ..................................................................................
83
80
27
21
15
11
3
3
Connecticut .............................................................................
34
49
11
17
3
5
4
8
Delaware .................................................................................
7
8
5
–
–
–
–
–
District of Columbia .................................................................
11
16
–
7
–
5
–
–
Florida .....................................................................................
245
215
88
46
19
32
28
–
Georgia ....................................................................................
110
82
18
23
16
15
6
4
Hawaii ......................................................................................
13
19
8
5
–
4
–
–
Idaho .......................................................................................
27
33
20
–
6
–
4
–
Illinois ......................................................................................
158
203
72
38
39
31
15
7
Indiana .....................................................................................
125
115
54
13
19
17
8
4
Iowa .........................................................................................
80
75
43
6
15
7
4
–
Kansas ....................................................................................
76
84
38
4
16
11
6
9
Kentucky ..................................................................................
101
68
30
3
20
7
4
4
Louisiana .................................................................................
140
104
40
12
14
11
12
15
Maine .......................................................................................
16
19
12
–
3
3
–
–
Maryland ..................................................................................
65
69
22
17
12
12
3
–
Massachusetts ........................................................................
64
51
14
12
4
15
5
–
Michigan ..................................................................................
94
141
42
35
22
22
17
–
Minnesota ................................................................................
61
69
25
13
17
10
4
–
Mississippi ...............................................................................
67
68
35
9
7
10
6
–
Missouri ...................................................................................
142
107
60
13
14
14
6
–
Montana ..................................................................................
52
36
19
7
3
3
3
–
Nebraska .................................................................................
57
54
22
6
8
8
9
–
Nevada ....................................................................................
24
28
4
9
7
6
–
–
New Hampshire .......................................................................
6
5
–
–
–
–
–
–
New Jersey ..............................................................................
99
78
31
17
5
13
11
–
New Mexico .............................................................................
42
38
12
10
–
6
6
–
New York (including N.Y.C.) ....................................................
185
182
54
45
31
28
15
8
New York City ......................................................................
63
68
7
29
5
16
8
3
North Carolina .........................................................................
129
134
43
31
23
22
15
–
North Dakota ...........................................................................
25
30
15
–
8
5
–
–
Ohio .........................................................................................
137
156
61
28
38
12
13
4
Oklahoma ................................................................................
82
91
40
7
17
9
11
7
Oregon ....................................................................................
66
45
18
11
8
4
4
–
Pennsylvania ...........................................................................
168
219
78
39
36
46
13
7
Rhode Island ...........................................................................
7
9
–
4
–
–
–
–
South Carolina .........................................................................
73
65
29
12
4
11
6
3
South Dakota ...........................................................................
24
36
19
–
10
5
–
–
Tennessee ...............................................................................
111
137
50
15
31
21
13
5
Texas .......................................................................................
482
456
196
74
64
50
53
18
Utah .........................................................................................
48
42
15
7
8
8
4
–
Vermont ...................................................................................
12
13
7
–
3
–
–
–
Virginia ....................................................................................
119
104
54
17
13
9
9
–
Washington .............................................................................
76
104
40
17
21
9
8
7
West Virginia ...........................................................................
41
95
32
–
14
5
8
34
Wisconsin ................................................................................
94
91
28
12
26
12
8
5
Wyoming .................................................................................
19
34
18
8
4
–
3
–
1 State totals include other events and exposures, such as bodily reaction, in addition to those shown separately.
2 Totals for 2009 are revised and final. Preliminary 2009 data issued August 19, 2010, reported a total of 4,340 fatal work injuries for calendar year 2009. Since then, an
additional 211 job-related fatal injuries were identified, bringing the total job-related fatal injury count for 2009 to 4,551. Includes two fatal injuries that occurred within the
territorial boundaries of the United States, but a State of incident could not be determined.
3 Includes one fatal injury that occurred within the territorial boundaries of the United States, but a State of incident could not be determined.
4 Based on the 2007 BLS Occupational Injury and Illness Classification Manual.
5 Includes highway, nonhighway, air, water, rail fatal injuries, and fatal injuries resulting from being struck by a vehicle.
6 Includes violence by persons, self-inflicted injuries, and attacks by animals.
p
Data for 2010 are preliminary. Revised and final 2010 data are scheduled to be released in Spring 2012.
NOTE: Dashes indicate no data reported or data that do not meet publication criteria. CFOI fatality counts exclude illness-related deaths unless precipitated by an injury
event.
SOURCE: U.S. Department of Labor, Bureau of Labor Statistics, in cooperation with State, New York City, District of Columbia, and Federal agencies, Census of Fatal
Occupational Injuries
11

12
Table 6. CFOI participating agencies and telephone numbers
State
Agency
Telephone number
Alabama
Department of Labor
(334) 242-3463
Alaska
Department of Labor and Workforce Development
(907) 465-4539
Arizona
Industrial Commission
(602) 542-3739
Arkansas
Department of Labor
(501) 682-4542
California
Department of Industrial Relations
(510) 286-0702
Colorado
Department of Public Health and Environment
(303) 692-2170
Connecticut
Labor Department
(860) 263-6933
Delaware
Department of Labor
(302) 761-8219
Dist. of Columbia
Department of Health
(202) 442-9010
Florida
Bureau of Labor Statistics – Atlanta Region
(404) 893-8339
Georgia
Department of Labor
(404) 679-1656
Hawaii
Department of Labor and Industrial Relations
(808) 586-9001
Idaho
Industrial Commission
(208) 334-6090
Illinois
Department of Public Health
(312) 814-8194
Indiana
Department of Labor
(317) 232-2668
Iowa
Division of Labor Services
(515) 281-5151
Kansas
Department of Labor
(785) 296-1640
Kentucky
Labor Cabinet
(502) 564-4136
Louisiana
Workforce Commission
(225) 342-3126
Maine
Bureau of Labor Standards
(207) 623-7904
Maryland
Division of Labor and Industry
(410) 527-4463
Massachusetts
Department of Public Health
(617) 624-5679
Michigan
Department of Licensing and Regulatory Affairs
(517) 322-1851
Minnesota
Department of Labor and Industry
(651) 284-5568
Mississippi
Department of Health
(601) 576-7186
Missouri
Department of Labor and Industrial Relations
(573) 751-2719
Montana
Department of Labor and Industry
(406) 444-3297
Nebraska
Workers' Compensation Court
(402) 471-3547
Nevada
Division of Industrial Relations
(775) 684-7083
New Hampshire
Division of Vital Records Administration
(603) 271-4647
New Jersey
Department of Health and Senior Services
(609) 826-4984
New Mexico
Occupational Health and Safety Bureau
(505) 476-8740
New York State
Department of Health
(518) 402-7900
New York City
Department of Health
(212) 788-4584
North Carolina
Department of Labor
(919) 733-0337
North Dakota
Bureau of Labor Statistics – Chicago Region
(312) 353-7200 ext. 410
Ohio
Department of Health
(614) 644-0135
Oklahoma
Department of Labor
(405) 521-6855
Oregon
Department of Consumer and Business Services
(503) 947-7364
Pennsylvania
Department of Health
(717) 783-2548
Rhode Island
Department of Health
(401) 222-2812
South Carolina
Department of Labor, Licensing, and Regulation
(803) 896-7673
South Dakota
Bureau of Labor Statistics – Chicago Region
(312) 353-7200 ext. 410
Tennessee
Department of Labor and Workforce Development
(615) 741-1749
Texas
Department of Insurance, Division of Workers' Compensation
(512) 804-4658
Utah
Occupational Safety and Health Statistics
(801) 530-6823
Vermont
Department of Labor
(802) 828-5985
Virginia
Department of Labor and Industry
(804) 786-1035
Washington
Department of Labor and Industries
(360) 902-5510
West Virginia
Bureau of Labor Statistics – Philadelphia
Region
(215) 861-5637
Wisconsin
State Laboratory of Hygiene
(608) 221-6294
Wyoming
Department of Employment
(307) 473-3804
Guam
Department of Labor
(671) 475-7056
Puerto Rico
Negociado de Estadisticas
(787) 754-5300 ext.3056
Virgin Islands
Department of Labor
(340) 776-3700 ext. 2135

13
TECHNICAL NOTES
Identification and verification of work-related fatalities
In 2010, there were 20 cases included for which work relationship could not be independently verified;
however, the information on the initiating source document for these cases was sufficient to determine
that the incident was likely to be job-related. Data for these fatalities are included in the Census of Fatal
Occupational Injuries counts. An additional 66 fatalities submitted by states were not included because
the source documents had insufficient information to determine work relationship and could not be
verified by either an independent source document or a follow-up questionnaire.
States may identify additional fatal work injuries after data collection closeout for a reference year. In
addition, other fatalities excluded from the published count because of insufficient information to
determine work relationship may subsequently be verified as work related. States have up to 7 months
from this release to update their initial published state counts. This procedure ensures that fatality data
are disseminated as quickly as possible and that legitimate cases are not excluded from the final counts.
Thus, each year's initial release of data should be considered preliminary. Final data are released in the
Spring of the following year; revised counts for 2010 will be available in 2012.
Over the last 3 years, increases in the published counts based on additional information have averaged
174 fatalities per year or about 3 percent of the revised total. The BLS news release issued August 19,
2010 reported a total of 4,340 fatal work injuries for 2009. With the May 2011 release of final data, an
additional 211 net fatal work injuries were added, bringing the total for 2009 to 4,551.
Federal/State agency coverage
The Census of Fatal Occupational Injuries includes data for all fatal work injuries, whether the decedent
was working in a job covered by the Occupational Safety and Health Administration (OSHA) or other
federal or state agencies or was outside the scope of regulatory coverage. Thus, any comparison between
the BLS fatality census counts and those released by other agencies should take into account the
different coverage requirements and definitions being used by each agency.
Acknowledgements
BLS thanks the participating states, New York City, the District of Columbia, Puerto Rico, the Virgin
Islands, and Guam for their efforts in collecting accurate, comprehensive, and useful data on fatal work
injuries. BLS also appreciates the efforts of all federal, state, local, and private sector entities that
submitted source documents used to identify fatal work injuries. Among these agencies are the
Occupational Safety and Health Administration; the National Transportation Safety Board; the U.S.
Coast Guard; the Mine Safety and Health Administration; the Office of Workers’ Compensation
Programs (Federal Employees' Compensation and Longshore and Harbor Workers' Compensation
divisions); the Federal Railroad Administration; the National Highway Traffic Safety Administration;
state vital statistics registrars, coroners, and medical examiners; state departments of health, labor and
industries, and workers' compensation agencies; state and local police departments; and state farm
bureaus.
Document Outline
Wyszukiwarka
Podobne podstrony:
więcej podobnych podstron