
Brain shape in human microcephalics
and
Homo floresiensis
Dean Falk*
†
, Charles Hildebolt
‡
, Kirk Smith
‡
, M. J. Morwood
§
, Thomas Sutikna
¶
, Jatmiko
¶
, E. Wayhu Saptomo
¶
,
Herwig Imhof
储
, Horst Seidler**, and Fred Prior
‡
*Department of Anthropology, Florida State University, Tallahassee, FL 32306;
‡
Mallinckrodt Institute of Radiology, Washington University School of
Medicine, St. Louis, MO 63110;
§
Archaeology and Palaeoanthropology, University of New England, Armidale, New South Wales 2351, Australia;
¶
Indonesian Centre for Archaeology, JI. Raya Condet Pejaten No. 4, Jakarta 12001, Indonesia;
储
Clinic for Radiodiagnostics, Medical University
of Vienna, A-1090 Vienna, Austria; and **Department of Anthropology, University of Vienna, A-1090 Vienna, Austria
Edited by Marcus E. Raichle, Washington University School of Medicine, St. Louis, MO, and approved December 7, 2006 (received for review
October 18, 2006)
Because the cranial capacity of LB1 (Homo floresiensis) is only 417
cm
3
, some workers propose that it represents a microcephalic
Homo sapiens rather than a new species. This hypothesis is difficult
to assess, however, without a clear understanding of how brain
shape of microcephalics compares with that of normal humans. We
compare three-dimensional computed tomographic reconstruc-
tions of the internal braincases (virtual endocasts that reproduce
details of external brain morphology, including cranial capacities
and shape) from a sample of 9 microcephalic humans and 10 normal
humans. Discriminant and canonical analyses are used to identify
two variables that classify normal and microcephalic humans with
100% success. The classification functions classify the virtual en-
docast from LB1 with normal humans rather than microcephalics.
On the other hand, our classification functions classify a patho-
logical H. sapiens specimen that, like LB1, represents an
⬇3-foot-
tall adult female and an adult Basuto microcephalic woman that is
alleged to have an endocast similar to LB1’s with the microcephalic
humans. Although microcephaly is genetically and clinically vari-
able, virtual endocasts from our highly heterogeneous sample
share similarities in protruding and proportionately large cerebella
and relatively narrow, flattened orbital surfaces compared with
normal humans. These findings have relevance for hypotheses
regarding the genetic substrates of hominin brain evolution and
may have medical diagnostic value. Despite LB1’s having brain
shape features that sort it with normal humans rather than
microcephalics, other shape features and its small brain size are
consistent with its assignment to a separate species.
virtual endocast
M
icrocephaly (‘‘small head’’) is a condition in which adults
typically achieve brain masses of 400–500 g (or cubic
centimeters if cranial capacity is used as a surrogate for brain
size) and are moderately to severely mentally retarded (1–15).
Affected individuals have been reported from all over the world,
frequently from consanguineous unions (9, 10, 16–26). Tradi-
tionally, the terms ‘‘primary microcephaly,’’ ‘‘true microceph-
aly,’’ ‘‘microcephaly vera,’’ and ‘‘primary autosomal recessive
microcephaly’’ (MCPH, MIM #251200; Online Mendelian In-
heritance in Man, www.ncbi.nlm.nih.gov/omim) have been used
to describe individuals who were born with abnormally small
brains, sloping foreheads, and prominent ears but lacked other
‘‘neurological, growth, health, or dysmorphic findings, and [had]
no discernible prenatal or postnatal syndrome or cause, such as
an aberrant chromosome or structural brain anomaly’’ (16).
[Because MCPH directly affects neurogenesis rather than
growth of the skull, some prefer the term ‘‘micrencephaly’’ (27).]
MCPH has been distinguished from microcephaly that is ac-
quired or ‘‘secondary’’ to degenerative brain disorders. Since
1998, however, at least seven autosomal recessive microcephalic
loci and five associated genes have been identified [see
], and all of the general maladies
that, by definition, were previously excluded from MCPH have
now been observed in one or more affected individuals (see
). Variable phenotypes are occasionally correlated with
particular kinds of mutations within a given gene [e.g., deletions
are generally more severe than duplications (28)] and may be
representatives of a continuous phenotype (13, 20, 29). Even the
signature sloping forehead of primary microcephalics is occa-
sionally lacking in affected individuals (17, 24) (
Primary microcephaly is therefore a genetically and clinically
heterogeneous condition that begs the traditional ‘‘diagnosis of
exclusion’’ (13, 25, 26, 30).
Given all of this heterogeneity, are there any features other
than small size that distinguish microcephalic brains from those
of normal humans? To address this question, we compared
three-dimensional computed tomographic reconstructions of
the internal braincase (virtual endocasts) that reproduce details
of external brain morphology, including vessels, sinuses, some
sulci, cranial capacities, and shape (1) from a sample of 9
heterogeneous microcephalic humans and 10 normal humans
(Fig. 1 and Table 1). Because of the controversial suggestion that
LB1 (Homo floresiensis) may have been a microcephalic Homo
sapiens rather than a new species (2–7), we reassessed its virtual
endocast in light of our findings. We also assessed the virtual
endocasts of a microcephalic woman whose endocast is alleged
to resemble that of LB1 (4) and a pathological H. sapiens
specimen that, like LB1, represents an
⬇3-foot-tall adult female.
[Although this specimen was labeled as a ‘‘dwarf,’’ this hetero-
geneous medical condition (MCPH, MIM #210710; Online
Mendelian Inheritance in Man, www.ncbi.nlm.nih.gov/omim)
should not be confused with endemic dwarfism.]
Results
Virtual endocasts were electronically measured to obtain cranial
capacities that are traditionally used to approximate brain mass
(Table 1). Brain size of microcephalics departs further below
normal values as microcephalics mature because it reaches its
maximum earlier than is the case for normal humans and then
decreases in size (27). For this reason, we estimate the upper
limits of brain size for adult microcephalics from data for that
group (Michel Hofman, personal communication) rather than
using normal humans as a reference population. The mean brain
weight for 25 microcephalics (sexes combined) aged 21–74 years
Author contributions: D.F., C.H., and K.S. designed research; D.F., C.H., K.S., M.J.M., T.S., J.,
E.W.S., H.I., H.S., and F.P. performed research; D.F., C.H., and K.S. analyzed data; and D.F.,
C.H., K.S., M.J.M., and F.P. wrote the paper.
The authors declare no conflict of interest.
This article is a PNAS direct submission.
Abbreviation: CT, computed tomographic.
†
To whom correspondence should be addressed. E-mail: dfalk@fsu.edu.
This article contains supporting information online at
www.pnas.org/cgi/content/full/
© 2007 by The National Academy of Sciences of the USA
www.pnas.org
兾cgi兾doi兾10.1073兾pnas.0609185104
PNAS
兩 February 13, 2007 兩 vol. 104 兩 no. 7 兩 2513–2518
NEUROSCIENCE
is 365 g with a SD of 95 (
⫾3 SD, 80–650 g), which gives an upper
limit of 650 g(cm
3
) (see
). Because this upper limit is
considerably higher than the 400–500 g widely quoted as typical
for primary microcephalics (9–15), we believe the estimated
range is likely to incorporate most, if not all, members of that
group. Although two of the microcephalics in our sample have
capacities that were slightly above the upper limit, we included
them in our initial analyses to increase our sample size (Table 1).
One of them (UV 3795, 667 cm
3
) was porencephalic (a condition
characterized by fluid-filled cavities in the brain) and therefore
a secondary microcephalic. The mean capacity for our nine
microcephalics is 498 cm
3
, and the mean for the seven that have
cranial capacities below 650 cm
3
is 450 cm
3
. These data suggest
the clinically testable hypothesis that adults that are diagnosed
as microcephalics and have brain volumes exceeding 650 cm
3
are
secondary microcephalics.
Eight measurements were obtained electronically from the
virtual endocasts and used to generate four ratios that we
thought would discriminate between the two groups {Fig. 2: 2/1
(cerebellar protrusion), [2–4]/1 (relative length posterior base),
6/5 (relative cerebellar width), and 8/6 (relative frontal breadth);
see Materials and Methods}. Using the four variables, discrimi-
nant and canonical analyses were used to study shape differences
between microcephalic humans (n
⫽ 9) and normal humans (n ⫽
10), and backward stepwise discriminant analysis was used to
select the most powerful discriminators (
). All four
variables, when analyzed individually, resulted in statistically
significant discriminant functions (P
⬍ 0.001;
and
). With the resulting classification functions, cerebellar
protrusion misclassified one microcephalic as a normal human
(
). Relative length posterior base misclassified a
normal human as a microcephalic. Relative cerebellar width
misclassified three microcephalics as normal humans, and rela-
tive frontal breadth misclassified two microcephalics as normal
humans. The backward stepwise discriminant analysis retained
two variables (cerebellar protrusion
2
⁄
1
and relative frontal
breadth
8
⁄
6
;
). Both ratios and the resulting
discriminant function (root) were highly significant (P
ⱕ 0.002),
with the most heavily weighted ratio being cerebellar protrusion.
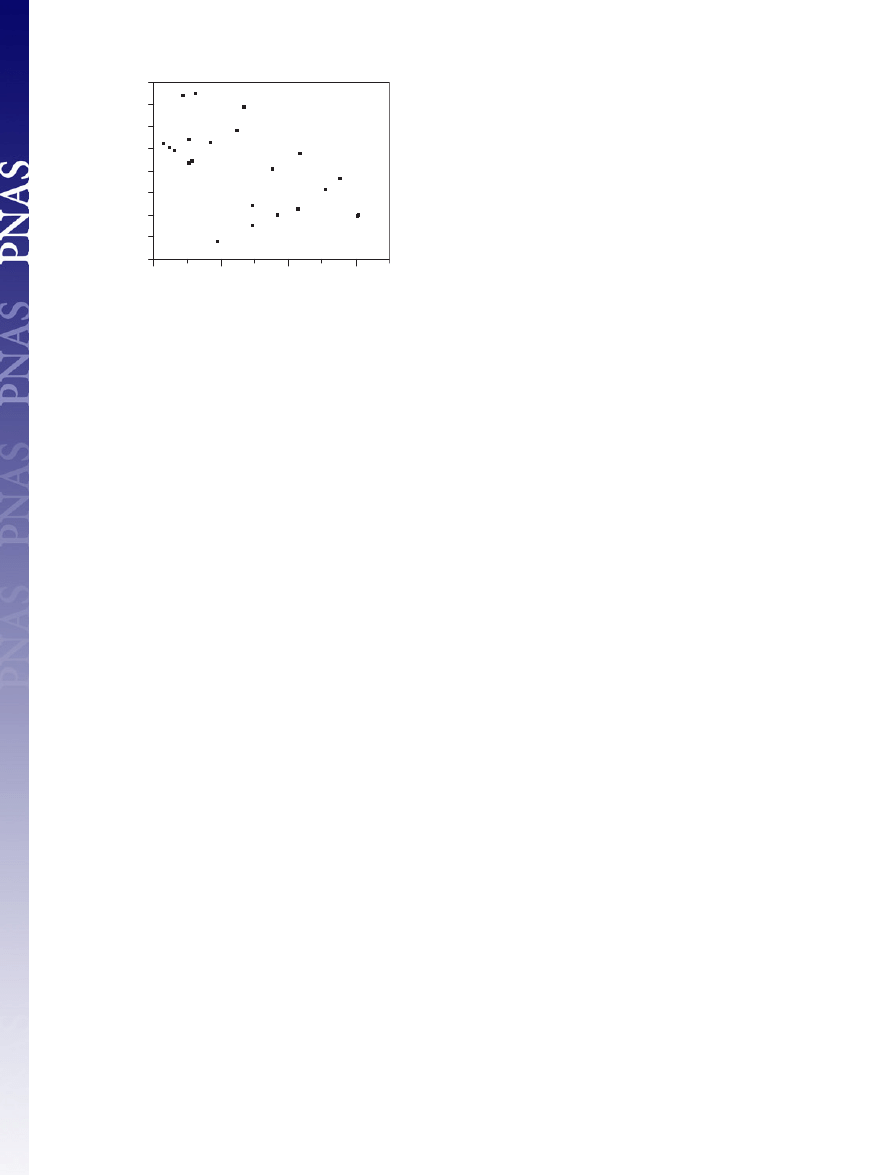
Fig. 3 is a scatter plot of these two variables, which classified
microcephalics (M) and normal humans (NH) with 100% suc-
cess. LB1, the human dwarf, and the Basuto woman (which were
not used to develop the discriminant and classification functions)
were then classified. LB1 sorted with normal humans (
⬎99%
probability) and the other two classified as microcephalics
(human dwarf
⬎99% probability and Basuto woman 99% prob-
ability; Fig. 3).
When we began our study, we did not know the size or shape
of the dwarf’s virtual endocast but suspected that the 3-foot-tall
specimen might be a microcephalic. The cranial capacity of 752
cm
3
that we obtained for the human dwarf is
⬇100 cm
3
above the
upper limit we estimate for primary microcephalics. Because the
dwarf’s brain size is considerably smaller than the mean of
⬇1,300 cm
3
for normal women (27) and because our analysis
classified the dwarf’s brain shape as being that of a microce-
phalic, we believe it represents a variant of microcephalic
primordial dwarfism (MCPH, MIM #210710; Online Mendelian
Inheritance in Man, www.ncbi.nlm.nih.gov/omim) and is there-
fore a secondary microcephalic. LB1’s 417-cm
3
endocast, on the
other hand, classified with normal humans, indicating that its
brain shape differs completely from that of this 3-foot-tall-adult
secondary microcephalic female H. sapiens.
Because LB1’s capacity is only 417 cm
3
(1), we were particu-
larly interested in learning what shape features may discriminate
the smaller-brained microcephalics from normal humans. A
second analysis was performed after deleting the two microce-
phalic brains with volumes
⬎650 cm
3
from the data set. The most
powerful discriminators from our first analysis (individually and
in combination) were, again, used to derive new classification
functions, which were used to classify cases. As in the first
analysis, cerebellar protrusion misclassified one microcephalic as
a normal human. Relative frontal breadth misclassified no case,
however, compared with the first analysis in which it misclassi-
fied the two largest microcephalics as normal humans. The
combination of these two discriminators misclassified no case
(with posterior probabilities for group membership exceeding
0.9999 for all cases) and, again, LB1 was classified with normal
humans and the dwarf with the microcephalics. When the two big
microcephalics were not used to create the classification func-
tion, the Basuto woman classified with microcephalics with 100%
probability. These data suggest the testable hypothesis that
smaller-brained primary microcephalics may have smaller rela-
tive frontal breadths than bigger-brained (possibly secondary)
microcephalics, and raises the possibility that future research on
virtual endocasts and clinical imaging studies could reveal
phenotypic characterizations that might have diagnostic signif-
icance for known microcephaly loci (
) (26).
Discussion
Because the sample of microcephalics we used to develop the
classification functions contains only nine individuals, one might
argue that it is too small to be representative. As is the case for
fossil hominins, microcephalic skulls are rare and our sample has
the advantage of being extremely heterogeneous and therefore
more likely to capture general features that may characterize
microcephaly. Our specimens represent both sexes, ages ranging
from 10 years old to adult, cranial capacities from 276 to 671 cm
3
,
and come from different parts of the world including Europe, the
United States, South America, and Africa (Table 1). It contains
both primary and secondary microcephalics, although we believe
most, if not all, of the individuals below 650 cm
3
are probably
primary microcephalics, which is the form of microcephaly most
often attributed to LB1. LB1 resembles normal humans in the
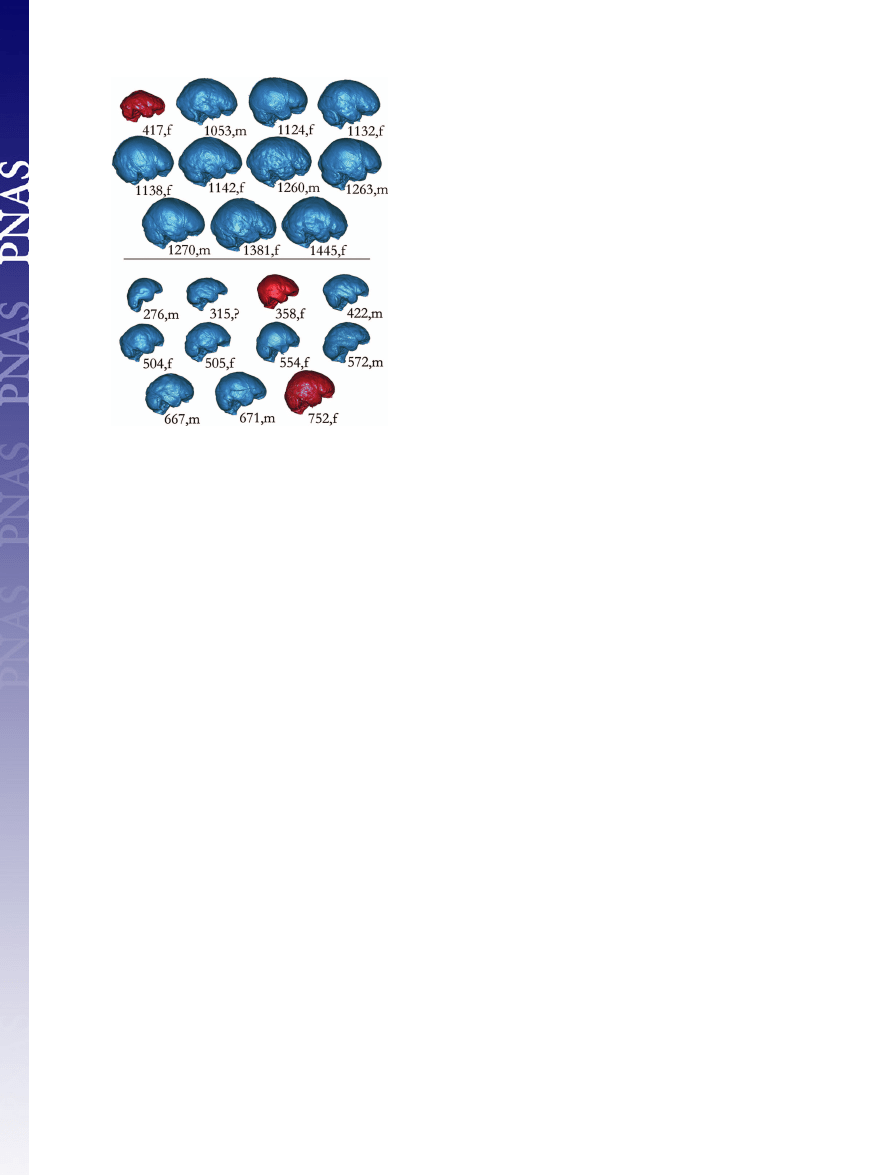
Fig. 1.
Comparisons of right lateral views of virtual endocasts from 10
normal humans (Upper, blue) and 9 microcephalics (Lower, blue). Discriminant
and canonical analyses classify the virtual endocast of LB1 [417,f (Upper, red)]
with normal humans and those from a female human dwarf (752,f, Lower) and
the Basuto woman (358,f, Lower) with microcephalics. Images are labeled
with their cranial capacities and sex: f, female; m, male (see Table 1 for details
about individual specimens).
2514
兩 www.pnas.org兾cgi兾doi兾10.1073兾pnas.0609185104
Falk et al.
shape of its orbital surface (Fig. 1 and
); the endocast
of the Basuto (Lesotho) woman that is supposed to resemble LB1
(4, 31) does not (Fig. 1). We are pleased to have obtained a copy
of this microcephalic endocast that was described by Martin et al.
(4, 31) but were unsuccessful at our repeated efforts to obtain
information about the repository and specimen number of the
key microcephalic endocast that was alleged to be nearly iden-
tical to LB1’s by Weber et al. (2) or, more importantly, to obtain
fp
tp
bs
cp
op
v
1
2
3
4
5
6
7
op
cp
b
v
8
mat
mat
a
b
c
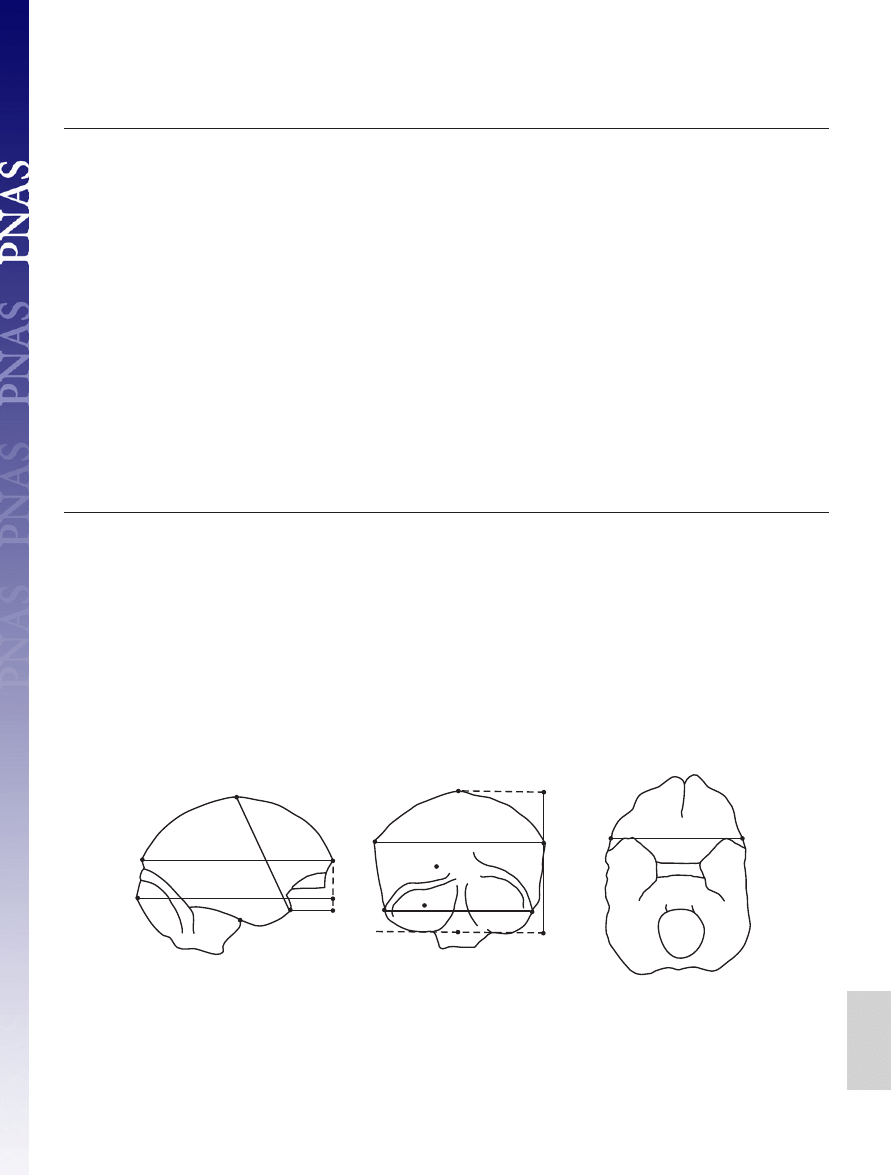
Fig. 2.
Key for right lateral (a), posterior (b), and inferior (c) views of endocasts. Measurements (3, a chord; others projected): (a) 1, cerebral length (fp-op); 2, cerebellar
pole-projected frontal pole; 3, anterior cerebral height (chord v-tp); 4, temporal pole-projected frontal pole; (b) 5, cerebral width (right and left points that define
maximum projected width); 6, cerebellar width (right and left most lateral points on cerebellum, includes sigmoid sinus if visible in posterior view); 7, endocast height
(v-b); (c) 8, frontal breadth (mat-mat). Landmarks: b, midpoint on line tangent to the base of cerebellum; bs, intersection of right brainstem with right temporal lobe;
cp, most caudal point on the cerebellum in lateral view (may be on either side); fp, most rostral point on the frontal lobes in lateral view (may be on either side); mat,
in basal view, point at lateral edge of endocast located at level of the most anterior point of the temporal lobe; op, most caudal point on occipital lobes in lateral view
(may be on either side); tp, most rostral point on temporal lobes in lateral view (may be on either side); v, vertex. Four indices used in discriminant and canonical analyses:
cerebellar protrusion
⫽ 2/1; relative length posterior base ⫽ (2–4)/1; relative cerebellar width ⫽ 6/5; relative frontal breadth ⫽ 8/6.
Table 1. Specimens used
Specimen
Age, years
Sex
Cranial
capacity, cm
3
Repository
ID
Diagnosis
Comments
1
14
M
667
UV
3795*
Secondary
Associated with porencephalic, genu
microcephaly
valgum, pes calcaneus, scoliosis
2
20–30
M
572
UV
5385
Microcephaly
Skull cast from early 20th century,
detailed impressions endocranially
3
315
WU
Microcephaly
4
10
M
276
AMNH2792a
Primary
Skull cast; individual lived in
microcephaly
Germany, late 19th century
5
Sub-adult
F
554
PMHU
7200*
Microcephaly
From Peru
6
Adult
M
422
PMHU
7387*
Microcephaly
From Mauritius, African features,
7
Nearly adult
F
504
NMNH
379510*
Microcephaly
From Peru (Chilca)
8
Adult
F
505
UM
96-11-128A
Microcephaly
9
Adult
M
671
UM
660
Microcephaly
32
F
358
FMNH
Microcephaly
Basuto woman, South Africa
30
F
417
INCA
LB1
H. floresiensis
1
25
F
1,138
WU
66-10
Normal human
2
20–30
M
1,270
FSU
20-30
Normal human
Caucasian
3
40
F
1,132
WU
78-8
Normal human
4
40
M
1,053
WU
67-11
Normal human
5
20–30
M
1,263
FSU
C20-C30
Normal human
Caucasian
6
18–25
M
1,260
FSU
C18-C25
Normal human
Caucasian
7
45
⫹
F
1,381
FSU
OBF
Normal human
Black
8
45
⫹
F
1,445
FSU
OFU
Normal human
9
18–25
F
1,124
FSU
PAAF
Normal human
Probably African-American
10
45
⫹
F
1,142
FSU
001
Normal human
Probably African-American
20
F
752
UPM
1190*
Dwarf
3 ft tall; Tubingen, Germany
*CT data provided directly; other specimens scanned at Barnes Jewish Hospital, St. Louis. AMNH, Amercian Museum of Natural History; FMNH, Field Museum
of Natural History; FSU, Florida State University Department of Anthropology; INCA, Indonesian National Centre for Archaeology, Jakarta; NMNH, National
Museum of Natural History (Smithsonian); PMHU, Peabody Museum of Archaeology and Ethnology, Harvard University; UM, University of Michigan Department
of Anthropology; UPM, University of Pennsylvania Museum of Archaeology and Anthropology; UV, Museum of Pathology and Anatomy, University of Vienna;
WU, Washington University School of Medicine. Data for microcephalics (M) and normal humans (NH) from authors and G. Conroy, Washington University School
of Medicine (M#3); K. Mowbray, American Museum of Natural History (M #4); D. Lieberman, Harvard University, M. Morgan and J. Brown, Peabody Museum (M
#5– 6); Bruno Frohlich and D. Ubelaker, National Museum of Natural History (Smithsonian Institution) (M #7); Milford Wolpoff, University of Michigan (M #8 –9);
G. Doran and Colette Berbesque, Florida State University (NH #2, 5–10); and Janet Monge, University of Pennsylvania Museum (dwarf). R. Martin provided the
endocast of the Basuto woman, upon which we performed a computed tomographic scan.
Falk et al.
PNAS
兩 February 13, 2007 兩 vol. 104 兩 no. 7 兩 2515
NEUROSCIENCE
a copy or computed tomographic (CT) scan of the endocast so
that we might include it in the present analysis.
Our analysis of the virtual endocast of 10-year-old micro-
cephalic Jakob Moegele has been criticized because we per-
formed a computed tomographic scan of a cast whose parts
(the calotte and base) were different colors and chemical
compositions (4, 31). Despite the skull’s calotte and base
having been cast separately, the CT data produced a seamless
virtual endocast (Fig. 1 and
) with a volume of 276 cm
3
,
which is very close to the 272 cm
3
initially reported (32).
Indeed, figure 3 of Martin et al. (31) reveals the similarity in
the shape of the original skull and the cast that we scanned, and
shape rather than color of the cast parts is the salient feature
in our analyses. Because primary microcephalics are believed
to achieve their maximum cranial capacities by around four
years of age (27), there is no reason to exclude a 10-year-old
microcephalic from our analysis. As noted, the added variation
in age and cranial capacity increases the diversity of our
sample, which makes it more likely that it captures general
traits of microcephalics. The most compelling reason for
including Jakob Moegele’s virtual endocast in our sample,
however, is because our analyses show that it classifies with the
other microcephalics in all respects.
Despite the heterogeneity of our microcephalic sample, cer-
tain shape features distinguish it from that of normal humans:
Microcephalics usually have cerebella that protrude more cau-
dally (Fig. 1 and
) and appear disproportionately larger
than those of normal humans (Fig. 1) (27). The relatively smaller
frontal breadths of microcephalics (Fig. 3) are consistent with
their typically sloping foreheads, frontal lobes that are more
pointed rostrally in dorsal views, and hypothetically smaller
forebrains (15, 21, 26, 27, 29). In brains of normal humans, the
orbital surface of the frontal lobes (in lateral view) is expanded
due to ventral protrusion of the cortex medially (underneath the
paths of the olfactory tracts) (33) (Fig. 1 and
). Virtual
endocasts of microcephalics, on the other hand, appear flatter on
their orbital surfaces, which is consistent with images of actual
brains (21, 29), even when the sulci and gyri appear superficially
normal (
). The indices that describe cerebellar protru-
sion and relative frontal breadth, which together perfectly sort
our sample of microcephalics from normal humans, represent
traits that are visually apparent and in keeping with descriptions
of microcephalics in the clinical literature. Because our classi-
fication functions sort together microcephalic endocasts that
range in size from 276–671 cm
3
, our shape analyses are not
constrained by allometric scaling. (The question of whether
microcephalic brains scale allometrically in other ways is beyond
the scope of this paper but could be addressed in future studies
using 3D geometric morphometrics.)
Two genes that cause microcephaly when mutated (
are hypothesized to have been under pronounced natural selection
in the last common ancestor of apes (microcephalin, MCPH1) and
in hominins (ASPM, MCPH5) in conjunction with increasing brain
size (11, 12, 15) although their precise correlation with phylogenetic
increases in this trait has been questioned (25). Our findings are
consistent with the hypothesis that genes associated with primary
microcephaly may have had a role in primate brain evolution and,
more specifically, that some brain dimensions in primary microce-
phalics resemble those of early hominins (12). Endocasts of an early
hominin genus, Paranthropus, that is not believed to have been
directly ancestral to humans retained an apelike shape of the orbital
rostrum (in lateral views) and pointed frontal lobes (in dorsal views)
(33) similar to endocasts of primary microcephalics (Fig. 1 and
). Between 2.5 and 3.0 million years ago, a derived ventrally
expanded orbital surface and squared-off frontal lobes (in dorsal
view) appeared in another species that may have been directly
ancestral to humans, Australopithecus africanus (33). These con-
verging data raise the interesting possibility that genes involved in
primary microcephaly (e.g., ASPM) may have been important for
the evolution of the shape and internal organization of the orbito-
frontal cortex in addition to their effects on brain size.
A study that concluded LB1 is a microcephalic pygmy H.
sapiens rather than a new species of hominin (7) provided no
measurements of the neurocranium. This study is refuted not
only by our findings but also by an investigation of LB1’s
affinities using cranial and postcranial metric and non-metric
analyses that included comparisons with pygmies from Africa
and Andaman Islanders as well as a ‘‘pygmoid’’ excavated from
another cave on Flores (34). As shown here, the frontal breadth
relative to cerebellar width and lack of cerebellar protrusion of
LB1’s endocast classify it with 100% probability with normal H.
sapiens rather than microcephalics. The relative length of its
orbital surface also sorts LB1 with H. sapiens (1). On the other
hand, LB1’s endocast shows affinities with Homo erectus in its
relative height, disparity between its maximum and frontal
breadths, relative widths of its caudal and ventral surfaces and
long, low lateral profile (1). Its tiny cranial capacity, relative
brain size, and derived ventrally expanded orbital surface,
however, show affinities with Australopithecus africanus (33).
Because subsets of LB1’s features occur normally in other
hominins and because virtual reconstruction adjusted for the
slight in situ distortion of LB1’s skull, these endocast features
should not be attributed to pathology nor to postmortem me-
chanical deformation. The above findings for LB1, plus its
bilaterally expanded but otherwise normal-appearing gyri in the
region of Brodmann’s area 10 (1), are consistent with its
attribution to a separate species, H. floresiensis (35–37). Al-
though LB1’s relative brain size seems not to scale on the
ontogenetic curve for H. erectus (1), a recent study of brain size
in Pongo raises the possibility that H. floresiensis ’ relative brain
size may have been reduced because of ecological factors (38),
consistent with the insular-dwarfing hypothesis. Other analyses
of cranial and postcranial data, however, suggest that H. flor-
esiensis may be descended from an earlier small-bodied hominin
from either Australopithecus or Homo (34).
Materials and Methods
CT scans of 5 microcephalic skulls, 1 microcephalic endocast,
and 10 normal human skulls (Table 1) were performed at
Washington University School of Medicine. The CT scan
parameters (and reconstruction kernel) were chosen to pro-
duce optimal reconstructions. Our material was scanned with
0.7
0.75
0.8
0.85
0.9
0.95
1
1.05
1.1
Relative frontal breadt
h
M
M
M
M
M
M
M
M
M
BW
LB1
N
N
N
N
N
N
N
N
N
N
Dwarf
.9
.95
1
1.05
Cerebellar protrusion
Fig. 3.
Scatter plot of relative frontal breadth on cerebellar protrusion. The
legend of Fig. 2 contains a description of the measurements that were used to
create the ratios. Discriminant analysis demonstrated that these two variables
classified microcephalics (M) and normal humans (N) with 100% success. The
dwarf, Basuto woman (BW), and LB1, which were not used to develop the
classification functions, were classified, respectively, as two microcephalics
and a normal human.
2516
兩 www.pnas.org兾cgi兾doi兾10.1073兾pnas.0609185104
Falk et al.

a Siemens Sensation 64 (Siemens Medical Systems, Erlangen,
Germany) clinical multislice, computed-tomography (MCT)
scanner, located in Barnes Jewish Hospital (St. Louis, MO).
Specimens were aligned along a cranial-caudal axis with the
nose facing upward, to simulate a normal anatomical head
orientation. Scanning parameters included a 512
⫻ 512 matrix,
120 kVp, 300 effective mAs, 32 detectors with dual sampling
to achieve a 0.6-mm collimation, a 1-sec table increment per
gantry rotation, a pitch of 0.8, a reconstruction interval of 0.5
mm, and a H50s reconstruction kernel. With the higher-depth-
resolution images that we used, a high-sharpness kernel was
unnecessary. Because the features that we identified crossed
many planes, our ability to visualize the features was not
compromised by the Nyquist frequency (39), which dictates the
resolution above which a feature must be sampled to fully
reconstruct the feature. All data were archived to compact disk
in DICOM format and transferred to a stand-alone worksta-
tion for processing. By using commercially available software
packages, Mimics 8.11 (Materialise, Ann Arbor, MI) and
Analyze 6.1 (Biomedical Imaging Resource, Mayo Clinic,
Rochester, MN), the CT image data were visually assessed and
inspected for artifacts and damaged areas. CT scans of four
additional microcephalic skulls were provided by the Museum
of Pathology and Anatomy, University of Vienna (one);
Harvard Peabody (two); and the Smithsonian (one) (Table 1).
These scans were performed by using our parameters. CT data
for a ‘‘female dwarf’’ were also provided by the University of
Pennsylvania Museum. CT scans of LB1 were performed by
using a Siemens Emotion CT scanner in Jakarta and analyzed
at the Mallinckrodt Institute of Radiology (1).
Virtual endocasts of all specimens were made by using Mimics
8.11. This software provides tools to convert grayscale CT image
data into a wireframe ‘‘virtual’’ model. First, the skull is seg-
mented (isolated) from surrounding air and labeled by using a
combination of global and local thresholding operations together
with a region growing operation. The internal braincase was
enclosed, using manual segmentation, to close any contour gaps
in the skull, such as at the eye sockets. Once the internal
braincase was fully enclosed, as would be done making a
traditional latex endocast, the virtual endocast object was de-
fined with a cavity fill operation, and a 3D object was created
within the Mimics 3D Object module. This was done by using the
high-quality option. By means of the edge extraction tools within
the Mimics STL module, a triangulated surface definition was
created from the endocast 3D object.
Shape comparisons were performed between the endocasts by
using Geomagic Studio 5 software (Raindrop Geomagic, Re-
search Triangle Park, NC).
Each virtual endocast was aligned in dorsal view, and markers
were placed on its most rostral frontal pole (fp) and most caudal
occipital pole (op). The endocast was then rotated to the right
lateral view and a line placed to connect the two markers; the line
was rotated to a horizontal position (Fig. 2 A). The projected fp–op
distance in lateral view was measured to obtain cerebral length
(measurement 1). In the right lateral view, markers were placed on
the vertex (v) and most caudal cerebellar pole (cp). These place-
ments were checked with dorsal and posterior views. In right lateral
view, markers were placed on the more rostrally projecting tem-
poral lobe at the middle of its curvature (tp), and the intersection
of the right side of the brainstem with the right temporal lobe (bs).
Anterior cerebral height (measurement 3) was measured as the
direct distance (chord) from vertex to tp; and shortest projected
distances were measured from cp and tp to the vertical line tangent
to fp (cerebellar pole-projected frontal pole, measurement 2;
temporal pole-projected frontal pole, measurement 4). The endo-
cast was then rotated to occipital view (Fig. 2B), and markers were
added at the most projecting points laterally on both hemispheres
of the cerebrum and at the most laterally projecting points of the
cerebellum (at the outside edges of the sigmoid sinuses, if visible).
These markers were used to measure the projected maximum
widths of the cerebrum (cerebral width, measurement 5) and
cerebellum (cerebellar width, measurement 6). Endocast height
(measurement 7) was measured as the shortest projected distance
from vertex to the line tangent to the base of the cerebellum.
Frontal breath (measurement 8) was measured at the mean level of
the most rostral points on the two temporal poles in basilar view
(Fig. 2C).
Three months after the baseline measurements were made by
K.S. and D.F., all identifying features were removed from the
three-dimensional computed tomographic images of the 9 mi-
crocephalics and 10 humans and one observer (K.S.) repeated all
measurements (T2). Bland-and-Altman plots were used to assess
measurement reliability, along with plots of baseline (T1) and
repeat (T2) measurements for the microcephalics and normal
humans (40). Variance components analyses were used to de-
termine the percentages of variation attributable to subjects and
time (baseline and repeated measurements). Measurements of
the Basuto woman (8) were made (by K.S.) at the time that
repeat measurements were made. Repeatability (reliability)
analyses were performed with JMP Statistical Software Release
5.0.1 (SAS Institute, Cary, NC) and MedCalc Statistics for
Biomedical Research Version 8.1.0.0 (MedCalc Software, Mari-
akerke, Belgium). Measurement repeatability was high, with
⬎99% of measurement variability being attributable to subjects
(see
Discriminant and canonical analyses were used to study
shape differences between virtual endocasts of microcephalic
humans (n
⫽ 9) and normal humans (n ⫽ 10). For these
analyses, we used the four ratios that we thought would
discriminate between the two groups (2/1, [2– 4]/1, 6/5, and 8/6)
(Fig. 2). Data were tested for normality with Shapiro–Wilk W
tests, and the homogeneity of the variances and covariances
was tested with a Box M test. Backward stepwise discriminant
analysis was used to select the most powerful discriminators
(
). For the stepwise procedure, the F to enter was
set at 4; F to leave was set at 3; and the tolerance was set at
0.01. Each discriminator plus the combination of the most
powerful discriminators was used to classify each case into the
group that it most closely resembled. In addition, LB1, the
Basuto woman, and a human dwarf (which were not used to
develop the discriminant and classification functions) were
classified into the two groups. Posterior classification of cases
was based on Mahalanobis distances, with a priori probabilities
being proportional to group sample sizes. Data analyses were
performed with JMP Statistical Software Release 5.0.1.2 and
STATISTICA (data analysis software system, Version 7.1;
StatSoft, Tulsa, OK). Scatter plots for the four variables that
were analyzed are presented in
. The data were
normally distributed (Shapiro–Wilk W test, P
⬎ 0.05), and the
variances and covariances were homogeneous across groups
(Box M test, P
⬎ 0.05).
We are deeply grateful to G. Conroy (Washington University School
of Medicine), D. Chernoff (Saratoga Imaging), A. Fobbs (National
Museum of Health and Medicine), B. Frohlich and D. Ubelaker
(National Museum of Natural History, Smithsonian Institution), G.
Doran and C. Berbesque (Florida State University), M. N. Haidle
(Institute for Prehistory and Early History and Archaeology of the
Middle Ages, Tuebingen), M. Hofman (Netherlands Institute for
Brain Research), D. Lieberman (Harvard University), R. Martin
(Field Museum of Natural History), J. Monge (University of Penn-
sylvania Museum), M. Morgan and J. Brown (Peabody Museum), K.
Mowbray (American Museum of Natural History), L. Sobin (Armed
Forces Institute of Pathology), F. Spoor (University College London),
Falk et al.
PNAS
兩 February 13, 2007 兩 vol. 104 兩 no. 7 兩 2517
NEUROSCIENCE

C. Tincher (Barnes Jewish Hospital, St. Louis), R. Wilkinson (Skid-
more College), and M. Wolpoff and T. Schoenemann (University of
Michigan). This work was supported by National Geographic Society
Grants 7769-04 and 7897-05. Acquisition of CT data in Vienna was
supported by Austrian Federal Ministry for Culture Science and
Education Grant GZ 200.093/I.VI/I/2004.
1. Falk D, Hildebolt C, Smith K, Morwood MJ, Sutikna T, Brown P, Jatmiko,
Saptomo EW, Brunsden B, Prior F (2005) Science 308:242–245.
2. Weber J, Czarnetzki A, Pusch CM (2005) Science 310:236b.
3. Falk D, Hildebolt C, Smith K, Morwood MJ, Sutikna T, Jatmiko, Saptomo EW,
Brunsden B, Prior F (2005) Science 310:236c.
4. Martin RD, MacLarnon AM, Phillips JL, Dussebieux L, Williams PR, Dobyns
WB (2006) Science 312:999.
5. Falk D, Hildebolt C, Smith K, Morwood MJ, Sutikna T, Jatmiko, Saptomo EW,
Brunsden B, Prior F (2006) Science 312:999.
6. Richards GD (2006) J Evol Biol 19:1744–1767.
7. Jacob T, Indriati E, Soejono RP, Hsu
¨ K, Frayer DW, Eckhardt RB, Kuperavage
AJ, Thorne A, Henneberg M (2006) Proc Natl Acad Sci USA 36:13421–13426.
8. Dru-Drury EG (1919/1920) Trans R Soc Afr 8:149–154.
9. Jackson AP, Eastwood H, Bell SM, Adu J, Toomes C, Carr IM, Roberts E,
Hampshire DJ, Crow YJ, Mighell AJ, et al. (2002) Am J Hum Genet 71:136–142.
10. Kumar A, Markandaya M, Girimaji SC (2002) J Biosci 27:629–632.
11. Zhang J (2003) Genetics 165:2063–2070.
12. Evans PD, Anderson JR, Vallender EJ, Choi SS, Lahn BT (2004) Hum Mol
Genet 13:1139–1145.
13. Verloes A (2004) Orphanet, www.orpha.net/data/patho/GB/uk-MVMSG.pdf.
14. Evans PD, Gilbert SL, Mekel-Bobrov N, Vallender EJ, Anderson JR,
Vaez-Azizi LM, Tishkoff SA, Hudson RR, Lahn BT (2005) Science 309:1717–
1720.
15. Gilbert SL, Dobyns WB, Lahn BT (2005) Nat Rev Genet 6:581–590.
16. Bond J, Scott S, Hampshire DJ, Springell K, Corry P, Abramowicz MJ,
Mochida GH, Hennekam RCM, Maher ER, Fryns J-P, et al. (2003) Am J Hum
Genet 73:1170–1177.
17. Jackson AP, McHale DP, Campbell DA, Jafri H, Rashid Y, Mannan J, Karbani
G, Corry P, Levene MI, Mueller RF, et al. (1998) Am J Hum Genet 63:541–546.
18. Moynihan L, Jackson AP, Roberts E, Karbani G, Lewis I, Corry P, Turner G,
Mueller RF, Lench NJ, Woods CG (2000) Am J Hum Genet 66:724–727.
19. Pattison L, Crow YJ, Deeble VJ, Jackson AP, Jafri H, Rashid Y, Roberts E,
Woods CG (2000) Am J Hum Genet 67:1578–1580.
20. Jamieson CR, Fryns J-P, Jacobs J, Matthijs G, Abramowicz MJ (2000) Am J
Hum Genet 67:1575–1577.
21. Peiffer A, Singh N, Leppert M, Dobyns WB, Carey JC (1999) Am J Med Genet
84:137–144.
22. Kelley RI, Robinson D, Puffenberger EG, Strauss KA, Morton DH (2002)
Am J Med Genet 112:318–326.
23. Rosenberg MJ, Agarwala R, Bouffard G, Davis J, Fiermonte G, Hilliard MS,
Koch T, Kalikin LM, Makalowska I, Morton DH, et al. (2002) Nat Genet
32:175–179.
24. Roberts E, Hampshire DJ, Pattison L, Springell K, Jafri H, Corry P, Mannon
J, Rashid Y, Crow Y, Bond J, et al. (2002) J Med Genet 39:718–721.
25. Woods CG, Bond J, Enard W (2005) Am J Hum Genet 76:717–728.
26. Mochida GH, Walsh CA (2001) Curr Opin Neurol 14:151–156.
27. Hofman MA (1984) J Neurol 231:87–93.
28. Brewer C, Holloway S, Zawalnyski P, Schinzel A, FitzPatrick D (1998) Am J
Hum Genet 63:1153–1159.
29. Trimborn M, Bell SM, Felix C, Rashid Y, Jafri H, Griffiths PD, Neumann LM,
Krebs A, Reis A, Sperling K, et al. (2004) Am J Hum Genet 75:261–266.
30. Dobyns WB (2002) Am J Med Genet 112:315–317.
31. Martin RD, Maclarnon AM, Phillips JL, Dobyns WB (2006) Anat Rec
288A:1123–1145.
32. Vogt C (1867) Arch Anthropol 2:129–284.
33. Falk D, Redmond JC, Jr, Guyer J, Conroy GC, Recheis W, Weber GW, Seidler
H (2000) J Hum Evol 38:695–717.
34. Argue D, Donlon D, Groves C, Wright R (2006) J Hum Evol 51:360–374.
35. Brown P, Sutikna T, Morwood MJ, Soejono RP, Jatikmo, Saptomo WW, Due
RA (2004) Nature 431:1055–1061.
36. Morwood MJ, Soejono RP, Roberts RG, Sutikna T, Turney CSM, Westaway
KE, Rink WJ, Zhao J-X, van den Bergh GD, Due RA, et al. (2004) Nature
431:1087–1091.
37. Morwood MJ, Brown P, Jatikmo, Sutikna T, Saptomo EW, Westaway KE, Due
RA, Roberts RG, Maeda T, Wasisto S, Djubiantono T (2005) Nature 437:1012–
1017.
38. Taylor AB, van Schaik CP (2007) J Hum Evol 52:59–71.
39. Dainty JC, Shaw R (1974) Image Science: Principles, Analysis and Evaluation of
Photographic-type Imaging Processes (Academic, New York).
40. Altman DG, Bland JM (1983) Statistician 32:307–317.
2518
兩 www.pnas.org兾cgi兾doi兾10.1073兾pnas.0609185104
Falk et al.
Wyszukiwarka
Podobne podstrony:
więcej podobnych podstron