
Int. J. of Thermodynamics, Vol. 11 (No. 3)
133
Int. J. of Thermodynamics
ISSN 1301-9724
Vol. 11 (No. 3), pp. 133-141, September 2008
Thermodynamic Analysis of Rankine-Kalina Combined Cycle
R. Senthil Murugan
*
, P. M. V. Subbarao
Department of Mechanical Engineering, Indian Institute of Technology Delhi,
New Delhi -110016, India.
Abstract
Efficiency enhancement in a low grade fuel fired power plant is one of the challenging
tasks for researchers. In a low grade fuel fired power plant even a fraction of a percentage
improvement in efficiency implies a huge savings in annual fuel costs. Mainly, the poor
vapor quality of steam in the last stages of an LP turbine and energy loss in the condenser
deteriorates the Rankine steam cycle performance. Reducing the amount of energy loss in
the condenser and minimizing two-phase fluid operation in last stages of the LP turbine can
substantially improve the cycle efficiency. The objective is to reduce the energy losses and
to enhance the system performance. In this work a direct-fired 82.2 MW
fuel
biomass fueled
condensing power Rankine cycle is considered for performance improvement. Energy and
exergy analysis are performed for the proposed Rankine-Kalina combined cycle (RKC).
The RKC cycle produces higher power output and is more efficient than a Rankine steam
cycle.
Keywords: Rankine-Kalina combined cycle, low grade fuel, biomass.
1.
Introduction
The efficiency of the Rankine cycle can be
improved by varying cycle parameters such as
turbine inlet pressure, inlet temperature, reheat
pressure, reheat temperature, extraction pressure
and the condenser pressure with respect to the
optimum value. The last few stages of an LP
turbine usually operate in the two-phase region
and they are subjected to blade corrosion
problems. Mainly, blade erosion occurs due to
sudden impingement of moisture droplets at the
leading edge of the blades. The energy loss due
to moisture reduces the power output and thus,
plant profitability (Dooley, 2001). Specific
volume of the steam is gradually increasing as
the steam expands in the steam turbine. The
substantial increase in specific volume in the LP
turbine leads to careful design of LP turbine
stages and exhaust part. Appropriate selection of
blade material, and exhaust hood area are of
paramount importance in design. (Li et al.,
1985). The energy loss due to moisture and
energy loss in the condenser are unavoidable
losses in steam electric power plants. These
losses are even larger during off-design
conditions (Li et al., 1985). When compared to
the other cycle components, the condenser in
steam power cycle is subjected to higher energy
loss.
The pressure in the condenser determines
the quantity of latent heat that is to be removed
for the vapor to become condensed. The s
team
condenser cooling section weakens under partial
load conditions and the resultant increase in
vapor tends to overload the vent system at the
same time as the vent system capacity is reduced
at lower condenser pressures.
Dejfors
et
al.
(1997)
investigated
thermodynamic
advantages
of
utilizing
ammonia-water mixtures in small direct-fired
biomass fueled cogeneration plants. In the
conventional condensing power application, the
cycle utilizing ammonia water reaches higher
power generation than the conventional Rankine
steam cycle. Modifications in the cycle
configuration with respect to less energy and
exergy loss may lead to further improvement in
power output of ammonia water cycle. Kalina
cycle shows better performance at different load
condition. During partial load, the performance
of Rankine cycle further reduces due to variation
of steam quality at the turbine exhaust. It leads to
higher energy loss and reduction of LP turbine
internal efficiency. In Kalina cycle, the quality of
turbine exhaust is always superior, adjusting the
composition will maintain proper quality of
steam at the exit, and it reduces the component
*
Author to whom correspondence should be
addressed. r_sm4@yahoo.co.in
Int. J. of Thermodynamics, Vol.11 (No. 3)
134
irreversibility, hence more power output. Kalina
proposed a novel bottoming cycle for use in
combined cycle system using an ammonia-water
mixture as a working fluid. The multi component
working fluid with variable boiling and
condensing temperature provides less exergy loss
in the evaporator and condenser. Due to that, the
Kalina cycle is more efficient than the Rankine
cycle especially when working with finite heat
sources (Dejfors et al. 1997; Mlcak, 1996).
Using ammonia-water mixture throughout the
cycle is another way to improve the performance
of the cycle.
The results of Dejfors et al. (1997) proved
the same. Normally, using ammonia-water
mixture at more than (400 °C) is not advisable,
because at higher temperature NH
3
becomes
unstable which leads to nitride corrosion.
2. Proposed cycle configuration and its
integrated approach
The
literature
often
suggested
that
combining two or more thermal cycles within a
single power plant is more beneficial than
operating in a single cycle alone. Two different
Kalina cycle configurations like distillation
condensation subsystem (Marston, 1990) and
modified Kalina cycle system for geothermal
resources-KCS 34 (Mlcak et al,2002)
are
analyzed for better performance match with the
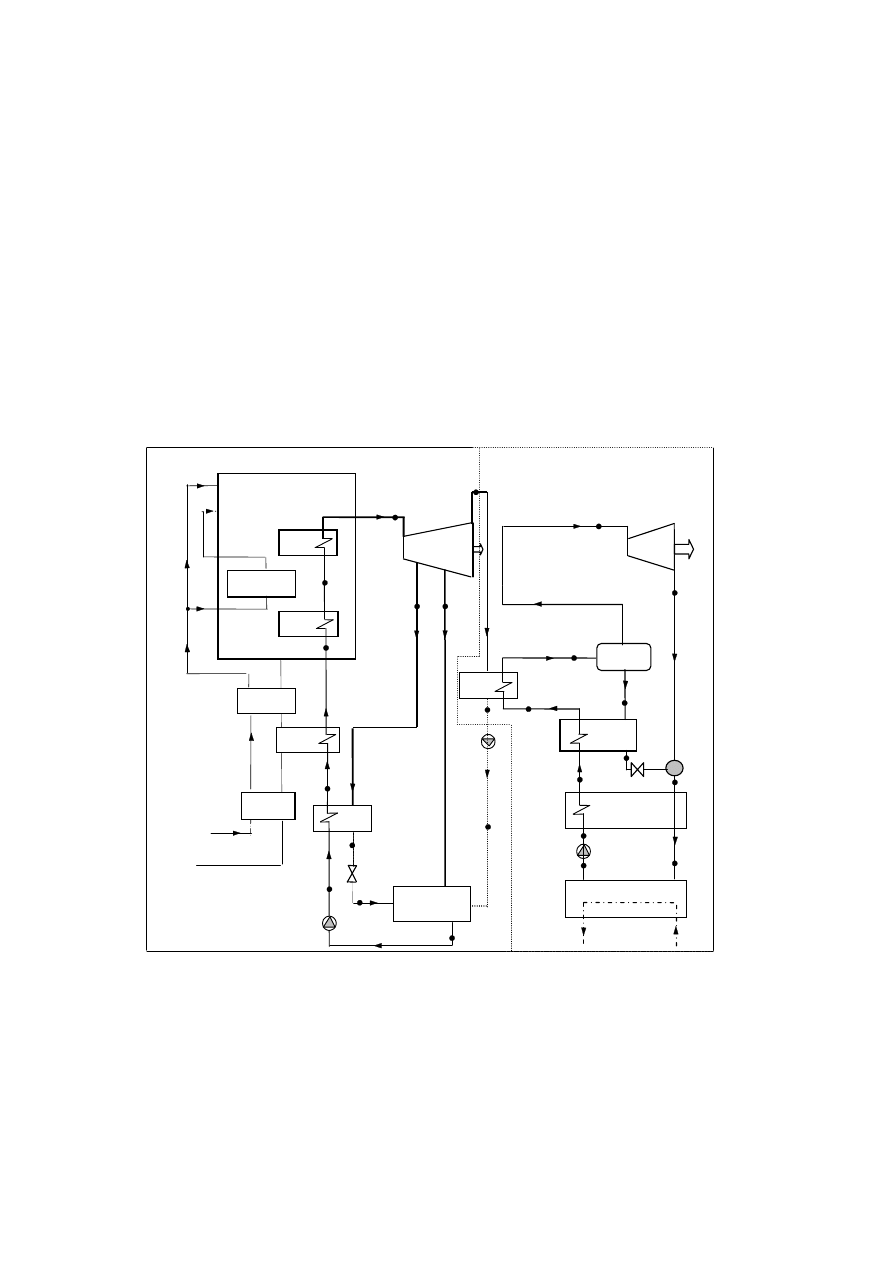
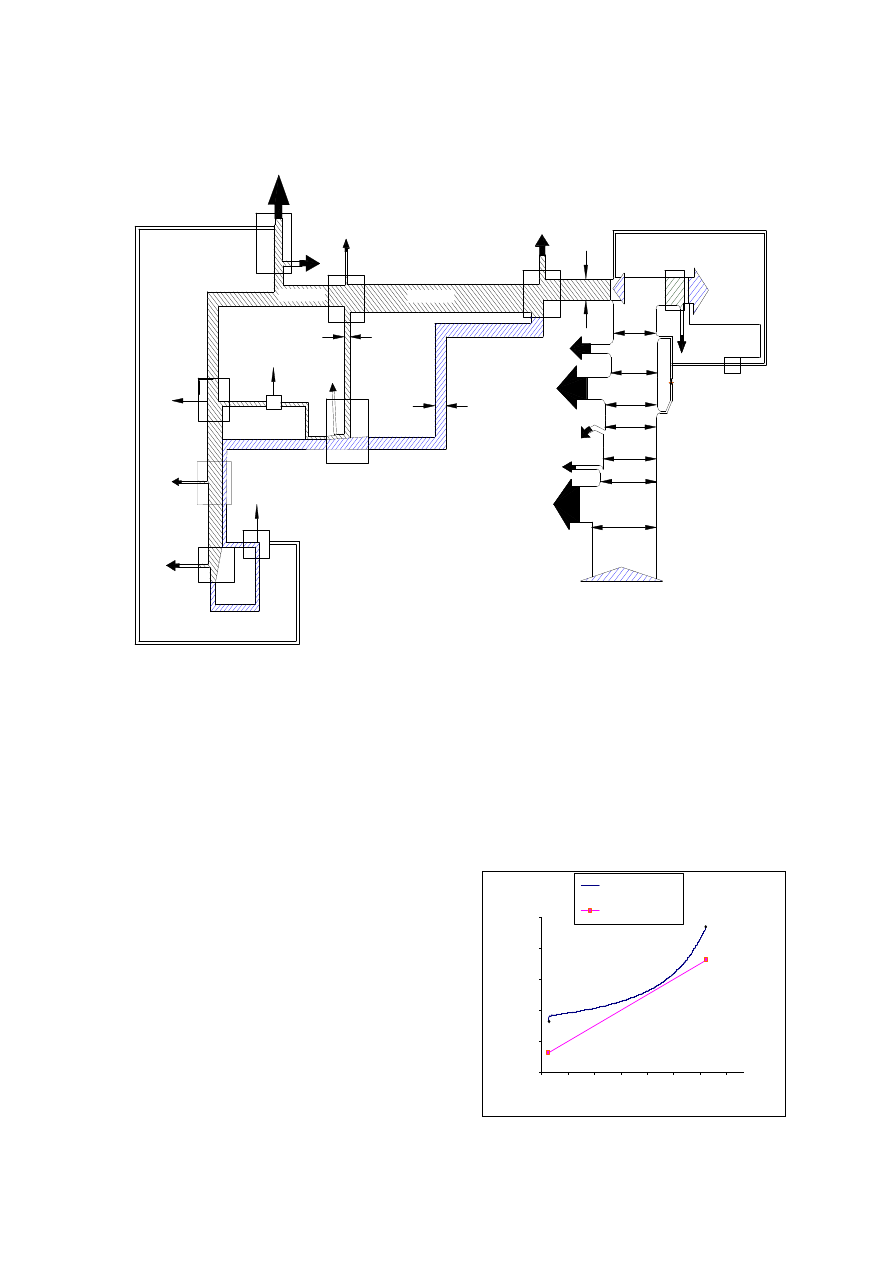
topping cycle (Rankine cycle). Figure 1
depicts
the proposed configuration of RKC cycle. RKC
cycle represents the two-fluid cycles, where two
cycles amalgamated in series.
Figure 1. Scheme of proposed Rankine- Kalina combined cycle.
In all cases, the intention is to increase the
cycle efficiency over that of a single cycle. A
combined cycle with a different working
medium is more interesting because the
advantages can complement one another. The
topping cycle identified in Figure 1 is part of an
82.2 MW biomass fueled condensing power
Rankine cycle. In the topping cycle (Rankine)
the steam from the superheater (3) is partially
expanded in the turbine and exhaust from the
turbine (4) is sent to the bottoming cycle
(Kalina) for further processing. In the open feed
water heater, the saturated liquid from the
preheater (9) is mixed with the saturated liquid
from the evaporator (6). The resultant mixture is
heated by bleed steam from the turbine (10). In
Flue gas
SH1
EVA1
Tur-1
Air
PH
ECO
P1
APH2
APH3
Tur-2
EVA2
P3
OFH
Condenser
LTR
HTR
P2
valve1
Valve 2
SEP
1
2
7
10
3
5
6
21
22
14
15
24
17
1c
2c
19
20
23
16
18
11
12
13
4
8
9
25
MIX
APH1
Int. J. of Thermodynamics, Vol. 11 (No. 3)
135
0
50
100
150
200
250
300
350
400
450
500
550
600
-25
0
25
50
75
100
125
150
175
200
225
250
275
Total Entropy (m*s), [kW/ k]
T
e
m
p
e
ra
tu
re
,
[
C
]
bottoming cycle, the working fluid is in liquid
phase before entering the evaporator (21). After
the evaporator (22), the ammonia-water mixture
splits into two streams (14, 23). The vapor (14)
from the separator is expanded through the
turbine. The liquid (23) gives off its heat to the
incoming saturated liquid from the condenser,
further throttled to the turbine exit pressure and
finally it is mixed with stream (15) from the
turbine exit.
3. Strategy of optimization
The first step in optimization is to
transform
the
physical
situation
into
a
mathematical model, by identifying the number
and type of variables, objective function and the
constraints imposed on the system.
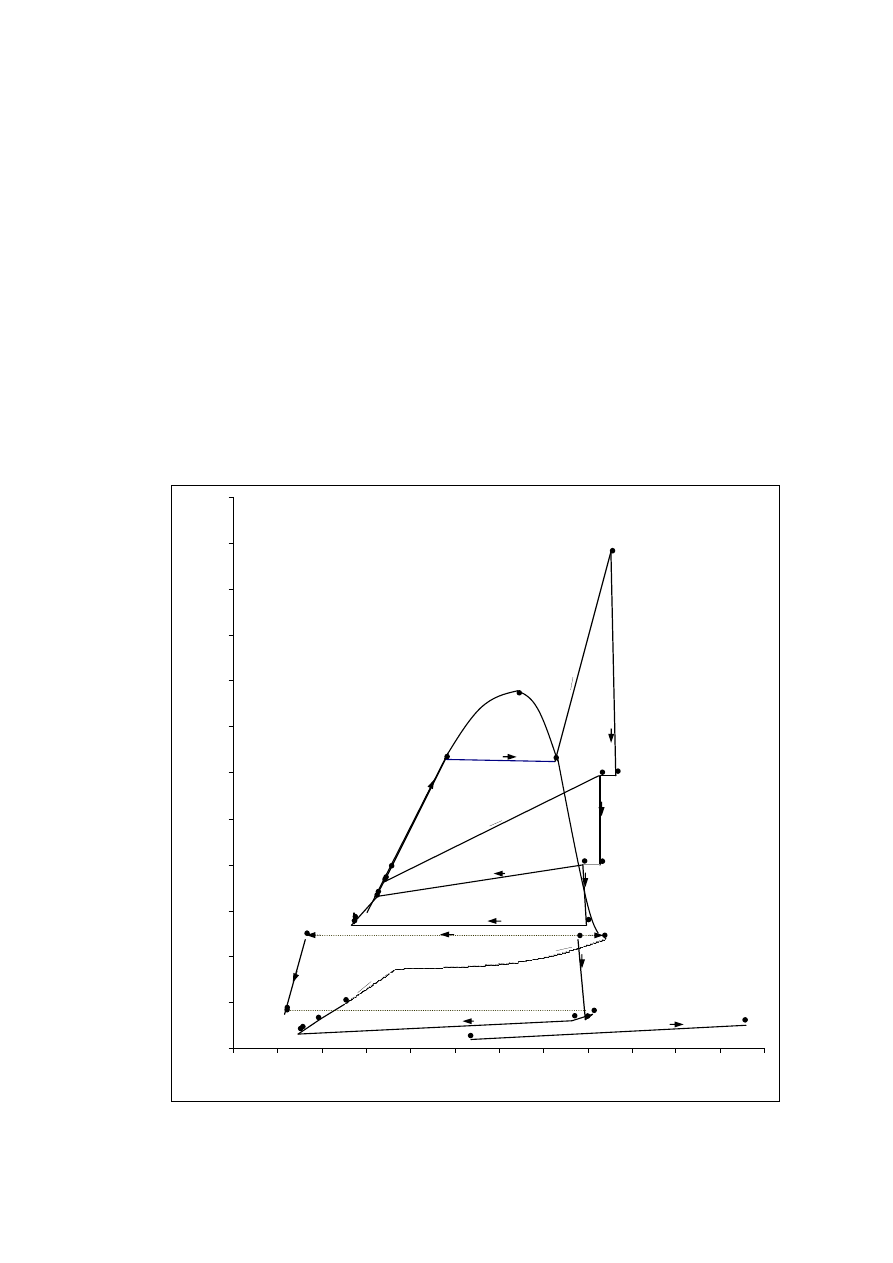
Figure 2 shows a T- s diagram for the RKC
cycle. The state of the working fluid is identified
by the same numbers as those of the schematic
diagram in Figure.1. In the separator the
ammonia water mixture is separated into liquid
and vapor with different fractions of ammonia
represented by thin lines (14-23 and 14-22) as
shown in Figure. 2.
For the present case, efficiency of the cycle
is considered as the objective function to
optimize. The efficiency of RKC cycle depends
on the following parameters:
1. Bleed steam extraction pressure (Topping
cycle).
2. Fraction of ammonia-water mixture at
separator inlet
3. Turbine inlet pressure (Bottoming cycle).
11
9
3
1
7
10
5
13
22
14
23
24
25
19
15
16
17
20
21
1c
2c
4
18
6
8
12
Figure 2. Temperature vs Total Entropy diagram of the RKC cycle.
2
Int. J. of Thermodynamics, Vol.11 (No. 3)
136
1
1
1
1
n
n
o p t
i
i
i
i
i
η
η
η η
−
+
=
=
=
−
∑
∑
4
1
X
<
1
2
1
1
1
1
Q
Q
or
Q
W
−
=
η
Kalina
2
W
1
W
Q
1
Q
2
Q
3
Rankine
The objective function to optimize is,
(1)
The variable under consideration for
topping cycle is turbine extraction pressure and
steam turbine outlet pressure. In bottoming cycle
the optimization variables are ammonia mass
fraction at the separator inlet and steam turbine
inlet pressure. Checks placed throughout the
program ensure that approach point, pinch point
and quality of steam constraints are not violated.
To
make
the
system
optimization
meaningful, it is necessary to maintain proper
quality of mixture at the turbine exhaust of
topping as well as bottoming cycle and
appropriate pinch point and approach point must
be maintained in the heat exchangers.
(2)
Using superheated steam in the bottoming
cycle requires an additional super heater
moreover there no benefit is obtained by using
the superheated steam in bottoming cycle,
therefore in this study, utilization of superheated
steam is avoided in bottoming cycle.
4. About Monte Carlo method
Monte Carlo (MC) methods are stochastic
techniques that use a random number generator
to generate random numbers. It is a highly
efficient numerical method capable of solving
the most complex application (Bauer, 1958)
.
The
best solution depends on the trueness of random
number. Several test points are created at
random, the finest feasible of these considered is
the minimum for that iteration, the search
domain is reduced around the selected point, and
the random trial begins again.
5. About the software program
The complete program has been written in
‘C++’. For the water and ammonia-water
mixture properties that are required for
optimization, a separate software code was also
developed using a ‘C++’ program by making use
of the equations in the literature (Wagner et al,
1997) and the thermodynamic properties of
ammonia-water mixtures were obtained by using
a library of subroutines developed by Goswami
et al. (1999). The software includes five different
modules, taking care of steam properties,
ammonia-water mixture properties, random
number generator for Monte Carlo algorithm,
energy analysis and finally exergy analysis.
Checks placed throughout the program ensure
that approach point, pinch point and quality of
steam constraints were not violated.
6. Input data and assumptions
All the analyses were performed for the
fuel input corresponding to 82.2 MW (Dejfors,
and Svedberg, 1999). The composition of the
biomass fuel is x
c
=0.2499, x
N2 =
0.0020, x
H2
=0.0304, x
O2
=0.1980, x
ash
=0.0098, x
H2O
=0.5100,
and LHV of the fuel is 8.43 MJ/kg and fuel rate
is 9.75 kg/sec. The following assumptions were
made in the cycle design.
1. Quality of steam at the turbine exit for topping
and bottoming cycle should not fall below 0.90.
2. Mechanical and generator efficiency is 0.98.
3. Isentropic efficiency of the turbine 0.88.
4. Isentropic efficiency of the pump 0.80.
5. Pressure drop and heat loss in pipe lines are
neglected.
7. Energy analysis of the cycle
All components associated with the cycle
are steady flow devices, and thus, all processes
that make up the cycle can be analyzed as steady
flow processes. The kinetic and potential energy
changes of the steam are usually small relative to
the work and heat transfer terms and, therefore,
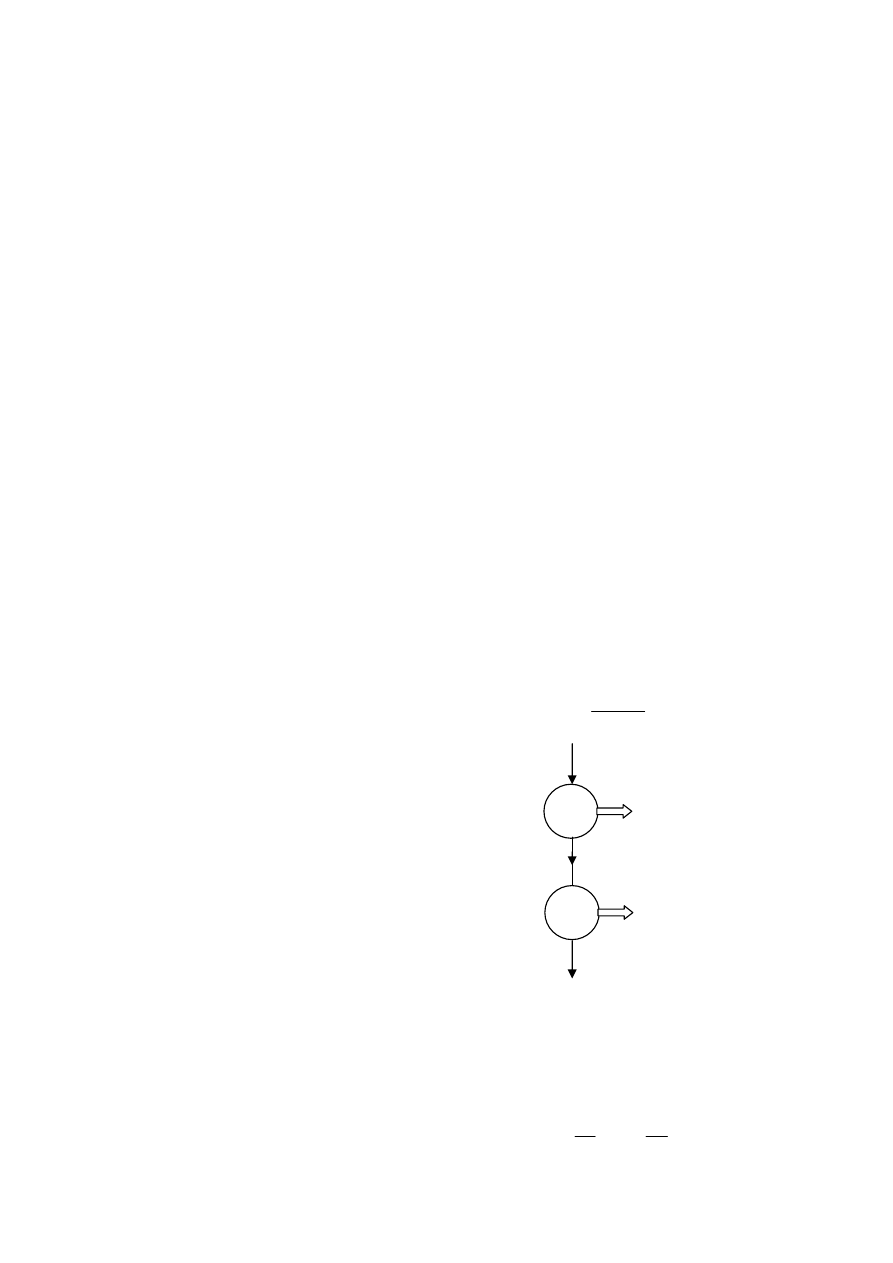
usually neglected. In the case of the proposed
Rankine-Kalina combined cycle, the heat lost by
the topping cycle is absorbed in the bottoming
cycle (Fig. 3). The overall cycle efficiency is the
ratio of total work output to the heat input.
(3)
Figure 3. Rankine- Kalina cycle coupled
in series.
The net cycle efficiency of Rankine cycle
can be written as,
(4)
1 4
0 . 9 0
X
≥
1
2
1
Q
W
W +
=
η

Int. J. of Thermodynamics, Vol. 11 (No. 3)
137
0
0
0
(
)
(
)
ph
E
h h
T s
s
= −
−
−
)
(
)
(
)
(
)
(
)
(
13
3
3
2
1
4
4
10
0
1
7
7
3
3
1
h
h
m
p
W
p
W
h
m
h
m
h
m
h
m
−
×
−
−
×
−
×
−
×
−
×
=
η
)
(
)
(
21
22
21
3
15
14
14
2
h
h
m
W
h
h
m
P
−
×
−
−
=
η
(
)
i
H
O
H
ch
i
NH
NH
ch
ch
y
M
e
y
M
e
E
−
+
=
1
0
,
0
,
0
2
2
3
3
2
3
2
2
2
1
Q
Q
or
Q
W
−
=
η
1
2
2
1
3
)
1
(
1
1
Q
Q
Q
Q
η
η
−
−
=
−
=
(
)
1
2
1
1
1
3
1
)
1
(
1
1
Q
Q
Q
Q
η
η
η
−
−
−
=
−
=
)
(
&
)
(
5
6
5
2
11
12
12
1
h
h
m
W
h
h
m
W
p
p
−
=
−
=
)
(
18
9
1
18
3
h
h
m
W
p
−
=
Similarly the net cycle efficiency of Kalina
cycle can be written as,
(5)
Equation 3 can also be written as,
or
2
1
2
1
η
η
η
η
η
×
−
+
=
(6)
The cycle efficiency of topping and
bottoming cycle can be written in terms of cycle
parameters indicated in Figure 1 as given below,
(7)
(8)
Where W
P1
and W
P2
are the pump work
(9)
(10)
Where W
p3
is the pump work corresponding to
the bottoming cycle.
8. Exergy analysis of the cycle
Exergy is the maximum theoretical useful
work (or maximum reversible work) obtained as
a system interacts with an equilibrium state.
Exergy
analysis provides accurate information of
the actual inefficiency in the system and the true
location of these inefficiencies.
Exergy method shows the designer how the
performance of the system departs from the ideal
limit, to what extent each component contributes
to this departure, and what can be done to design
a better less irreversible system (Rosen, 1999).
For all exergy analysis calculations, the
reference temperature is taken to be 15 °C, and
the reference pressure is 1.01325 bar. The total
exergy of a system becomes the summation of
physical exergy and chemical exergy. The
general physical exergy balance equation is
given by
(11)
In
Ammonia
Water
mixture,
the
concentration of the components varies from one
state to another, thus changing the chemical
exergy as well as the total exergy of the working
fluid. To calculate the chemical exergy of a
component in the mixture the following
expression is used:
(12)
Where,
3
,
0
NH
ch
e
and
O
H
ch
e
2
,
0
are chemical
exergies of Ammonia and water.
The standard
chemical exergy of ammonia and water are taken
from Ahrendts (1980). The chemical exergy term
vanishes during irreversibility calculation.
The second law efficiency, ε, for the net
power production is written as,
(13)
9. Results and discussion
Analyses were performed at different steam
turbine outlet conditions and ammonia mass
fractions at the separator inlet.
It is found that efficiency is best at a steam
turbine exit pressure and temperature of 3 bar
and 133.5 °C and the cycle configuration
corresponding with the optimum parameter is
depicted in TABLE I.
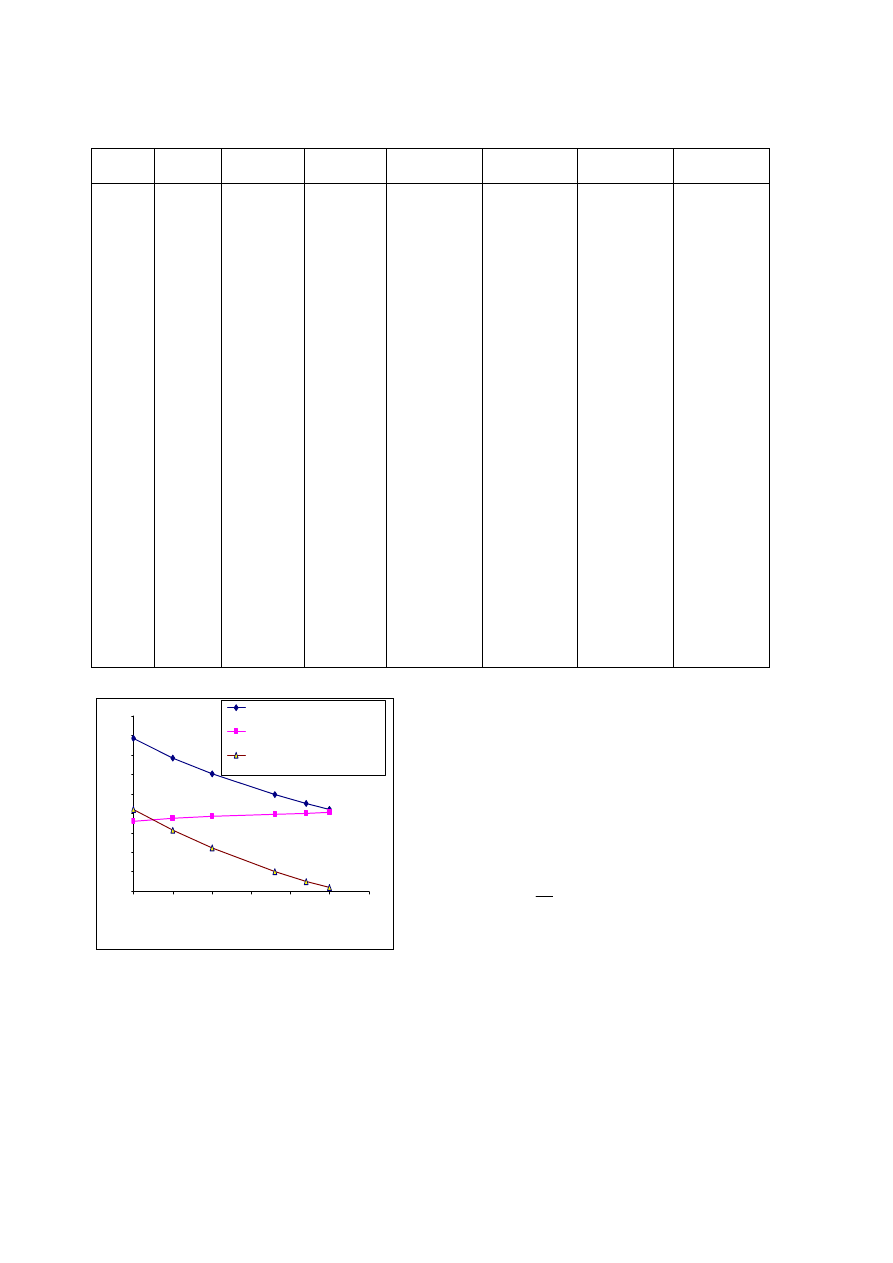
In bottoming cycle ammonia, mass fraction
at the inlet to the evaporator and the turbine inlet
pressure varied continuously to obtain the
maximum power output. Optimum fraction of
ammonia water mixture was found to be 0.89.
Further increases in fraction of ammonia-
water mixture leads to a) decrease in mass flow
rate of ammonia water mixture at the inlet
separator inlet, b) decrease in mass flow rate of
ammonia liquid at the inlet to the HTR, and c)
decrease in work output. The variation of mass
flow rate at different fractions of ammonia-water
mixture are shown in Figure. 4. Reducing the
fraction of ammonia water mixture from the
optimum value leads to increase in mass flow
rate of ammonia-water mixture at the separator
inlet. Though mass flow rate increases, the plant
output does not show much variation. The reason
is increasing mass flow rate increased the
quantity of work required for the pump which
alleviates the benefit.
in
Exergy
product
in
exergyout
Total
=
ε
Int. J. of Thermodynamics, Vol.11 (No. 3)
138
H2O
H2O
ch,
H2O
vap
2
1
fuel
che,
x
e
+
)
x
h
+
(LHV
=
e
β
β
)
/x
0.0450(x
+
)
/x
0.2160(x
+
1.0412
=
C
N2
C
H2
1
β
)]
/x
0.7884(x
+
)[1
/x
0.2499(x
C
H2
C
2
O
−
)
/x
x
0.3035)(
(1
=
C
O2
2
−
β
Figure 4. Variation of mass flow rate for
different fractions of ammonia-water mixture.
The net power output of RKC cycle is 1.4
MW more than the power output of the
condensing Rankine steam cycle configuration
reported by Dejfors et. al (1997)
.
The first law
efficiency of RKC cycle is 1.43% more than
condensing Rankine steam cycle. RKC cycle is
turbine.
The
having less energy loss in the condenser and LP
exergy loss due to thermodynamic irreversibility
in each component is calculated for the specified
dead state. The exergy output depends on the
degree of irreversibility of the cycle [Nag and
Gupta, 1998].
The value of fuel exergy is 105.98 MW
(Dejfors and Svedberg, 1999) which was
obtained from the equation below (Szargut et al.
1988).
(14)
(15)
(16)
The heat of vaporization, h
vap
, is 2.44 kJ/kg
and), e
ch,H2O
=64 kJ/kg.
The exergy destructions are graphically
represented by the exergy flow diagram in
Figure.5.
Node
P ( bar )
T (°
°°°C)
y
h ( kJ / kg )
m(kg/sec)
S(kJ/kg K)
Exergy
Rate (kW)
1
2
3
4
5
6
7
8
9
10
11
12
13
14
15
16
17
18
19
20
21
22
23
24
25
1c
2c
104
102
100
3
3
6.9
17.1
17.1
6.9
6.9
6.9
105
105
41.70
6.917
6.917
6.698
6.487
43.33
42.93
42.52
41.70
41.70
41.30
6.917
1.03125
1.01325
313.8
312.4
540
133.5
133.5
133.5
296
180
164.5
199.5
164.5
167.1
192.3
118.5
31.61
36.71
30.33
15.00
15.98
31.71
47.53
118.5
118.5
36.71
37.30
10
25
0
0
0
0
0
0
0
0
0
0
0
0
0
0.9728
0.9728
0.89
0.89
0.89
0.89
0.89
0.89
0.89
0.5696
0.5696
0.5696
0
0
1424
2721
3476
2720
561.4
562.2
3023
763.6
763.6
2844
702.65
716.45
822.1
1450.69
1227.23
961.47
887.62
-9.9476
-3.069
70.77
147.06
1215.3
305.0
-65.30
-65.30
41.99
104.9
28
28
28
25
25
25
1.4
1.4
1.4
1.6
28
28
28
40.13
40.13
50.51
50.51
50.51
50.51
50.51
50.51
50.51
10.38
10.38
10.38
720.84
720.84
3.386
5.602
6.725
6.979
1.672
1.672
6.834
2.139
2.144
6.892
2.005
2.011
2.244
4.233
4.3341
3.52703
3.29694
0.227057
0.231817
0.480721
0.724862
3.6626
1.5056
0.3867
0.4007
0.151
0.3673
12601.8
31039.3
43119.0
17769.5
2033.4
2053.4
1477.8
208.6
206.5
1375.8
3545.8
3883.8
4962.2
793276.3
783139.8
901210.5
900829.0
900171.8
900450.0
900557.1
900857.2
912058.4
118575.9
118078.7
118036.8
135.7
557.6
0
10
20
30
40
50
60
70
80
90
0.7
0.75
0.8
0.85
0.9
0.95
1
Fraction of Ammonia-water mixture
M
a
s
s
fl
o
w
r
a
te
(
K
g
/s
e
c
)
Mass flow rate Inlet to the seperator
Mass flow rate of Ammonai vapor( Inlet to
the turbine)
Mass flow rate of ammonia liquid ( Inlet to
the HTR)
TABLE I. RESULTS FOR RKC CYCLE.
Int. J. of Thermodynamics, Vol. 11 (No. 3)
139
At the inlet to the condenser, ammonia
water mixture is at lower temperature and, hence
heat rejected in condenser is lower. In the RKC
cycle, maximum output is obtained at an
ammonia mass fraction of 0.89 percent and
turbine inlet pressure of 41.70 bar.
Exergy flow diagram in Fig. 5 indicates that
combustion
isthe
major
thermodynamic
inefficiency. In bottoming cycle the exergy
losses in the evaporator is higher when compared
to other cycle components in bottoming cycle
and the exergy loss in the condenser is
significantly less. The total exergy loss in
percentage of fuel exergy in RKC cycle is
around 72.70 % and it is 2.0 % less than the
condensing Rankine cycle reported by Dejfors
and Svedberg (1999)
.
The thermal exergy flow
diagram in Fig. 5 shows not only exergy losses
but also the splitting of exergy streams and
recirculation of exergy. Temperature- Enthalpy
rate difference diagram is an important tool for
heat exchanger analysis.
Figure 6
shows the temperature profile of
heat exchange process taking place in the
condenser.The temperature profile of water
ammonia-mixture is highly nonlinear in nature
due to variable temperature heat rejection.
Heat recuperation from the turbine
exhaust fluid reduces heat rejected to the
environment. This results in reduction of exergy
losses in evaporator and condenser. Heat load in
the condenser of a condensing Rankine cycle is
Figure 6. dT vs dh diagram for the condenser.
280
285
290
295
300
305
-50
100
250
400
550
700
850
1000
Enthalpy (kJ/kg)
T
e
m
p
e
ra
tu
re
(
k
)
Ammonia-w ater mixture
colling w ater
Figure 5. Exergy flow diagram for RKC cycle.
Mix loss
0.033
MW
0.031 %
Exhaust loss
(8.9MW,8.48%)
Heat transfer loss
(20.1,19.0 %)
Radiation Loss
( 1.199 MW ,1.13%)
Combustion Loss
(34.89MW ,32.92%)
Air preheater
(2.562 MW,2.42 %)
105.98 MW
100 %
67.08 %
65.95 %
2.150 MW
(2.030 %)
46.56 %
63.53 %
36.05 %
Heat transfer loss
(4.517 MW,4.26%)
loss in turbine
(2.3 MW,2.22%)
FWH
17.761 MW
2.0359 MW
15.72 MW
21.739MW
Seperator
0.149 MW
(0.1414%)
1.47 MW (0.016%)
Mix loss
0.020 MW
(0.0188 %)
Valve 2
0.041MW
(0.038%)
LTR loss
0.273 MW
(0.257 %)
Cond loss
0.317 MW
(0.299%)
Pump(3) loss
0.069 MW
(0.065%)
0.0347MW
10.53MW
(9.935%)
HTR loss
0.20 MW
(0.188 %)
Net Poweroutput
8.447 MW
(7.970 %)
65.56 %
20.113MW
PUMP 2
Net
Poweroutput
19.74 MW
(18.62%)
0.02 MW

Int. J. of Thermodynamics, Vol.11 (No. 3)
140
46.785 MW, which is 1.441 MW more than the
RKC cycle. The exergy loss in the condenser is
0.299 % and is 7 % less than condensing
Rankine steam cycle. It confirms that RKC cycle
has less energy as well as exergy loss in the
condenser. Second law efficiency of RKC cycle
is around 27.22 % and is 2.0 % more than the
condensing Rankine cycle configuration adopted
for this study.
10. Conclusions
The current study explored the possibility
of integrating two different cycles for the sake of
better performance. The overall energy and
exergy analysis were performed to find out the
thermodynamic performance of proposed RKC
cycle. The author proposed a new approach for
reducing energy loss due to moisture in the
turbine exhaust and losses in the condenser of
Rankine steam cycle power plant. The energy
and exergy results shows that proposed Rankine-
Kalina combined cycle is more efficient than
Rankine steam cycle operating on a condensing
mode.
In the topping cycle all the parameters that
we used for this analysis pertain to one of the
direct-fired 82.2 MW
fuel
biomass fueled Rankine
cycle power plants in Sweden. Addition of
Ammonia-Water cycle as a bottoming cycle to
the real direct-fired biomass plant provides the
following benefits.
1. The condenser pressure in Rankine steam
cycle always operates under vacuum, whereas in
RKC cycle condenser pressure is more than
atmospheric pressure. Due to that an air removal
system and dearation are not required for RKC
cycle. In RKC, cycle condenser pressure depends
on cooling water inlet temperature unlike
Rankine cycle power plant in which it depends
on cooling water outlet temperature. Energy loss
in the condenser is less when compared to
energy loss in the Rankine cycle.
2. Since the specific volume of steam at the
turbine exhaust of RKC cycle is lower than that
of the Rankine cycle, the turbine system and
exhaust is very small.
The cost of electricity for RKC cycle may
be substantially lower only if the cost associated
with the additional components in the RKC are
not excessive compared to that for a condensing
Rankine steam cycle.
Acknowledgement
The author would like to thank Dr.Mark
Mirolli, Recurrent Engineering, Dr. Martson,
Villanova
University,
Dr.
Eva
Thorin,
Department of Public Technology, Mälardalen
University, for their valuable suggestions and
encouragement. The work was performed using
the computer facilities of Indian Institute of
Technology Delhi.
Nomenclature
E
Exergy flow rate [kW]
e
Specific exergy [kJ/kg]
h
Enthalpy [kJ/kg]
s Entropy [kJ/kg K]
W
1
Net power output topping cycle [kW]
W
2
Net power output bottoming cycle [kW]
Q
1
Heat added in topping cycle [kW]
Q
2
Heat added in bottoming cycle [kW]
Q
3
Heat rejected from the bottoming cycle [kW]
p Pressure [bar]
t Temperature [°C]
m Mass flow rate [kg/sec]
X Quality of steam at the turbine exhaust
n Number of cycle
y Ammonia mass fraction in the solution
M Molecular weight
Subscripts
ph Physical exergy
ch Chemical exergy
Greeks
1
η
Topping cycle efficiency
2
η
Bottoming cycle efficiency
Abbreviation
RKC Rankine- Kalina combined cycle
LTR Low temperature recuperater
HTR High temperature recuperater
FWH Feed water heater
References
Ahrendts, J., 1980, “Reference states”, Energy,
Vol. 5, pp. 667–677.
Bauer, W. F., 1958, “The Monte Carlo Method”,
Journal of the Society for Industrial and Applied
Mathematics, Vol. 6(4), pp.438-451.
Dejfors, C., Thorin, E., Svedberg., 1997,
“Ammonia-Water Power cycle for Direct Fired
Cogeneration applications”, Energy conversion
and management, Vol. 39, pp.16-18.
Dejfors, C., and Svedberg G., 1999, “Second law
Analysis of Ammonia-water Power Cycle for
Direct
Fired
Cogeneration
Applications”,
International
Journal
of
Applied
Thermodynamics, Vol. 2, pp.125-131.
Dooley, B., 2001, “Low Pressure Steam Turbine
Performance”, EPRI report, Strategic science
andTechnology,http://amptest.epri.com/targetSS
TContent.asp?program=224919&value=01T023
037&objid=266782.

Int. J. of Thermodynamics, Vol. 11 (No. 3)
141
Feng,
Xu.,
and
Yogi
Goswami.,
1999,
"Thermodynamic Properties of ammonia-water
mixtures for power-cycle applications”, Energy,
Vol.24, pp.525 - 536.
Li, K.W., and Priddy, A.P., 1985, “Power Plant
System Design”, John Wiley and Sons, New
York.
Marston, C.H., 1990, “Parametric Analysis of
the Kalina Cycle”, Transactions of the ASME,
Journal of Engineering for Gas Turbines and
Power, Vol.112, 107-116.
Mlcak, H.A., 1996, “An Introduction to the
Kalina Cycle”, Proceedings of the International
Joint Power Generation Conference, Houston,
Texas, Vol.30, pp.1-11
Mlcak, H.A., Mirolli, M., Hjartarson, H.,
Húsav´ıkur, O., Ralph, M., 2002, “Notes from
the north: A report on the Debut year of the 2
MW Kalina cycle Geothermal power plants in
Húsav´ık, Iceland”, Geothermal Res. Council
Trans.,Vol. 26, pp.715–718.
Nag, P.K and Gupta, A.V.S.S.K.S., 1998, Exergy
analysis of the Kalina cycle, Applied Thermal
Engineering, Vol. 18, pp.427-439.
Rosen, M.A., 1999, Second law analysis:
Approaches and implications. International
Journal of Energy research, Vol.23, pp. 415-
429.
Szargut J, Morris D., Steward F, 1988, Exergy
Analysis
of
Thermal,
Chemical,
and
Metallurgical Processes, Hemisphere Publishing
Corporation.
Wagner, W. et al., 2000, “The IAPWS Industrial
Formulation 1997 for the Thermodynamic
Properties of Water and Steam”, Transactions of
the ASME,
J. Eng. Gas Turbines Power,
Vol.
122, pp.150 – 169.
Wyszukiwarka
Podobne podstrony:
Okła Ryzyko zespołu wypalenia i sposoby jego przezwyciężania u terapeutów i osób wspierających (s 1
141 Future Perfect Continuous
009 Dystrybucja
009 Dystrybucja 3id 2475 ppt
133
ep 12 009
140 141
139 141
p13 009
141 145
133 ROZ bhp i p poz w zakla Nieznany
133 Manuskrypt przetrwania
P31 009
133 SC DS300 R VW BORA A 98 XX
Podstawy elektroniki str 101 141
p36 009
009 szkolo
więcej podobnych podstron