
6
th
International Mine Ventilation Congress - Technical Paper
1
AN ANALYSIS OF THE DATA OBTAINED FROM VENTILATION STUDIES OF LONGWALL
PANELS
Ian J. Duckworth, Brian S. Prosser
Mine Ventilation Services, Inc.
With the trend in the coal mining industry pushing towards improved productivity and greater
production, the number and size of longwall panels is increasing rapidly. The development and mining
of large longwall panels causes unique problems in the provision of adequate ventilation at the working
faces. Because of the transient nature of the longwall panel, and the difficult field conditions for
ventilation measurements, detailed pressure and volume surveys around the longwall circuit are often
not conducted. This paper examines data collected from ventilation studies of longwall panels at nine
mines. The variation in airway resistance, ventilating pressure and airflow is examined and compared
with specific factors such as airway dimensions, ground conditions and support type used. The highest
resistance airway in longwall mines is typically the longwall tailgate, which often represents the only
unregulated split in the ventilation network.
INTRODUCTION
To date there have been few studies devoted to the determination of typical resistance values and
frictional factors for longwall panels. Traditionally, mine ventilation planning has been conducted by
selecting suitable friction factors, and then determining expected resistance values for future mine
airways based on proposed airway geometry. The main drawback with this approach is that
published friction factors are typically derived from work conducted by the U.S. Bureau of Mines in
the 1920’s and 1930’s (McElroy, 1935). These friction factors were mainly developed from
measurements taken in metal mines, and their application to coal mines is questionable due to the
variation in typical airway geometry, roughness and ground support between hard rock and soft rock
mines. More recent work was conducted by Kharkar et al. (1974) on the determination of typical
friction factors for U.S. coal mines, and this work was published by Hartman in the second edition of
his ventilation textbook (1982). A more recent study was conducted by Wala, in association of the
U.S. Bureau of Mines (1991), which determined typical coefficients for airway resistance and
Atkinson friction factors for Kentucky coal mines. McPherson (1993) provides a more detailed list of
friction factors in his textbook, which have been compiled from a combination of reported tests, and
the results from numerous unpublished ventilation surveys. Friction factors are listed for both hard and
soft rock mines, and typical values are provided for a longwall faceline with steel conveyor and
powered supports. However, none of these references provide detailed empirical data for ventilation
engineers who wish to establish resistance values for entire longwall panels. While the determination
of resistance for the headgate entries may be simple, evaluating the resistance of the longwall and
tailgate sections can be considerably more complex. It is necessary to not only consider the frictional
losses of the air moving around the panel, but also the shock losses encountered by the air as it enters

6
th
International Mine Ventilation Congress - Technical Paper
2
and exits the longwall faceline. In addition, the tailgate entry of the panel is frequently unlike any other
airway in the mine. The high stresses can result in an airway that is in poor condition, requiring timber
cribbing, or other roof support, for the entire length of the entry.
The number of mechanized longwall panels in the U.S. has increased considerably over the last
decade, and the demand for reliable empirical data has grown accordingly. To the authors’
knowledge, there have been no publications that provide an analysis of the data collected from
ventilation studies of longwall panels. This work presents typical measured data for use by engineers
for modeling proposed longwall panels.
GENERAL THEORY
The determination of frictional pressure drop in mine airways may be obtained from the following
relationship:
p = L
Per
A
u
f
ρ
2
2
(Pa)
f
= Chezy Darcy coefficient of friction
ρ
= Air density (kg/m
3
)
Per = Airway perimeter (m)
u = Air velocity (m/s)
A
= Area (m
2
)
L = Length (m)
This is a form of the Chezy-Darcy (also known as Darcy-Weisbach) equation, and is applicable to
circular and non-circular airways and ducts. The Chezy-Darcy coefficient of friction (dimensionless )
varies with respect to Reynolds Number, the trend of which is plotted on the Moody diagram. The
Chezy-Darcy equation was adapted by Atkinson to give the following, commonly used, Atkinson
Equation:
p = kL
Per
A
u
2
(Pa)
The Atkinson friction factor (k) is a function of air density, and is computed as the product of the
Chezy-Darcy coefficient of friction and the air density, divided by a factor of two. Since the Chezy-
Darcy coefficient of friction is dimensionless, the Atkinson friction factor has the units of density
(kg/m
3
). The Atkinson equation may be expressed in terms of the Atkinson resistance (R) for the
airway, where:
R =
p
Q
= kL
Per
A
2
3
(Ns
2
/m
8
)

6
th
International Mine Ventilation Congress - Technical Paper
3
The first section of this equation, relating frictional pressure drop and quantity to resistance, is known
as the Square Law. This important relationship is used to establish resistance from measured pressure
and quantity data. The second section of the equation is used to determine resistance from typical
Atkinson friction factors, and known or proposed airway geometry. It should be noted that the
frictional pressure drop term in the Square Law is directly proportional to air density, as is the
Atkinson friction factor. Hence, the Atkinson friction factor that is applied must be adjusted for actual
mine air density.
When using the Atkinson friction factor it is important to remember that the factor is not constant for
a given airway, but varies with Reynold’s Number. However, in mine ventilation it normal to assume
that the Atkinson friction factor is constant, regardless of the flow regime. This is because for fully
turbulent flow (which is typically the case in mine ventilation) the friction factor is a function only of the
relative roughness of the airway. Where the relative roughness of the airway is defined as the height of
the airway asperities (e) divided by the hydraulic mean diameter (d = 4A/Per). The Von Kármán
equation gives the relationship for Atkinson friction factor and relative roughness for fully turbulent
flow:
f =
2k
=
1
2 log
d
e
+ 1.14
10
ρ
4
2
From this equation it is apparent that for airways with the same surface roughness (asperity height),
but different hydraulic mean diameters, the Atkinson friction factor will vary. Hence, as the airway
hydraulic mean diameter increases, and all other conditions remain the same, both the relative
roughness and the Atkinson friction factor will decrease. However, this change in Atkinson friction
factor is usually small, and is often not discernible from field measurements. If an example airway is
taken which has an average asperity height of 50 mm, and dimensions of 2 m by 6 m, the Atkinson
friction factor at standard density is 0.0068 kg/m
3
. If a second airway is considered which has the
same surface roughness, but has dimensions of 3 m by 6 m, the Atkinson friction factor drops to
0.0061 kg/m
3
at standard density. Hence, for this example a 50% increase in flow area results in only
10% change in the Atkinson friction factor. Due to the relatively small changes in airway dimensions
measured during the study, and the considerable scatter in Atkinson friction factor values obtained
from the data, the change in Atkinson friction factor due to variation in relative roughness was ignored.
LONGWALL VENTILATION SURVEY TECHNIQUES
For each mine the measured pressure and quantity data were used to develop ventilation networks,
which were modeled and manipulated using a commercially available ventilation network simulation
computer program (VnetPC for Windows). The longwall panel represents just one component of the
system, however, it is often the only open split in the network, and it is therefore important to
accurately model this component.

6
th
International Mine Ventilation Congress - Technical Paper
4
Resistances were evaluated from measured pressure and airflow data using the Square Law
relationship. The air quantity surveys consisted of the measurement of mean air velocities and airway
cross-sectional areas at predetermined locations throughout the longwall panels. A rotating vane
anemometer attached to an extendible rod was used to traverse the airways for measurement of the
mean air velocity. Traverses were repeated until two readings were obtained within ±5%. The airway
cross-sectional areas were measured using steel tapes. The air quantities at each station were
computed as the product of the air velocity and the airway cross-sectional area. The airflow quantities
were checked in the field for adherence with Kirchhoff's First Law, namely that the sum of airflow
entering a junction was equal to the sum of airflow leaving the junction (in practice this is within ±5%).
The frictional pressure drops around the longwall panels were determined using the gauge-and-tube
technique. The gauge-and-tube (or trailing hose) method allows direct measurement of frictional
pressure differentials using a manometer connected into a length of tubing, the ends of which are
connected to the total pressure tappings of pitot-static tubes. Static pressure drops were taken across
regulators, doors and stoppings wherever possible. The pressure differential data were checked for
adherence with Kirchhoff's Second Law, namely that the sum of the pressure drops around the
longwall circuit equate to zero (in practice to within ±10%).
The majority of the longwall panels were surveyed when the longwall shearer was operating. To
ensure maximum airflow stability it is preferable that the longwall is idle, however, most of the
ventilation surveys were conducted during a time when the longwall was in operation. Pulling the
pressure tubing across the longwall faceline is complicated by the movement of the shields, however, if
the measurements are taken rapidly, and the tube is routed carefully along the shields, the
measurements can be taken with no disruption to production. Mean air velocities are extremely
difficult to measure across the actual faceline, and a more reliable value is often obtained by measuring
the total airflows at the headgate and tailgate junctions.
GENERAL DESCRIPTION OF THE SURVEYED MINES
The data presented in this paper were collected from ventilation studies at nine longwall mining
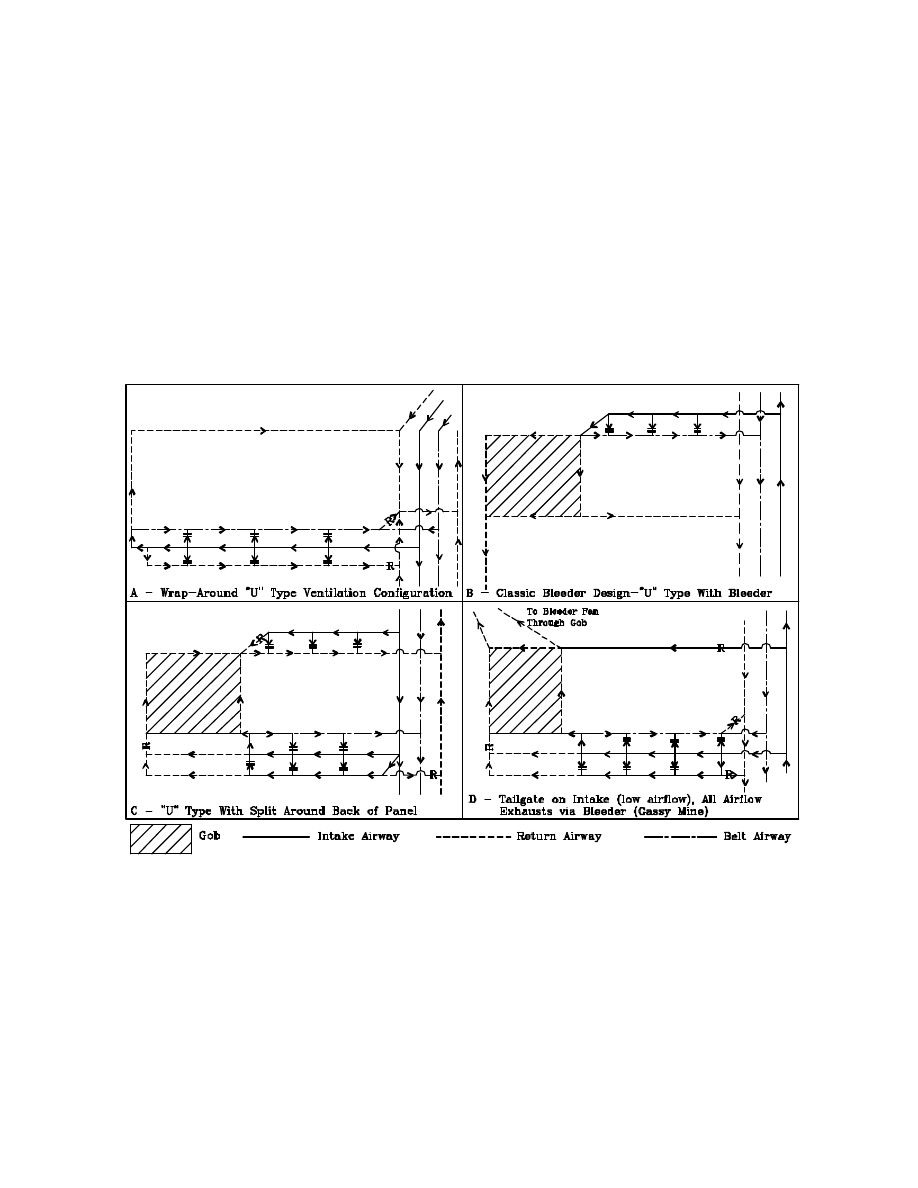
operations. Figure 1 shows four line diagrams representing the different types of longwall panels that
were surveyed. The longwall configuration for each of the nine mines is represented by one of these
general configurations.
Two of the mines employed a wrap-around or “U” type ventilation system shown on Sketch A.
This design has the advantage of restricting airflow movement through the gob. This bleederless
system is simple, and is generally used in those mines that are not particularly gassy, but which are
susceptible to spontaneous combustion. Three of the mines that were surveyed utilized a “U” type
ventilation system for the longwall with a back bleeder. This design is shown on Sketch B. The back
bleeder allows some of the air to be vented around the gob behind the longwall to dissipate gas away
from the faceline to either a dedicated raise or main return. The back bleeder acts to ventilate both the
current gob area and the seals from previous panels. One mine used a “U” type ventilation system for
the longwall while maintaining a bleeder solely around the current gob. This design is shown on
6
th
International Mine Ventilation Congress - Technical Paper
5
Sketch C. For this particular panel two entries were maintained on intake along the headgate. This
was the first panel in a new longwall block, and consequently an intake split could be maintained along
the tailgate, which was unaffected by previous panels. This intake split was maintained to allow diesel
equipment to travel the tailgate up to the vicinity of the faceline, which facilitated the installation of
tailgate support. As mining progresses to adjacent panels, this outside tailgate will be used to return
the bleeder air from behind the panels to the main return. Three mines utilized a flow-through, or “Z”
type ventilation configuration. This design is shown on Sketch D. For these mines the gas flow from
the strata was considerable, and emphasis was placed on the control and isolation of all the return air.
The return air from the longwall region is directed to a dedicated bleeder raise through both the gob
and the bleeder entries. Using this method, significant amounts of air are drawn through the previously
mined panels which ensures adequate gas dissipation.
Figure 1. Line diagrams showing general longwall configurations for the different mines
6
th
International Mine Ventilation Congress - Technical Paper
6
EXAMINATION OF SURVEY DATA
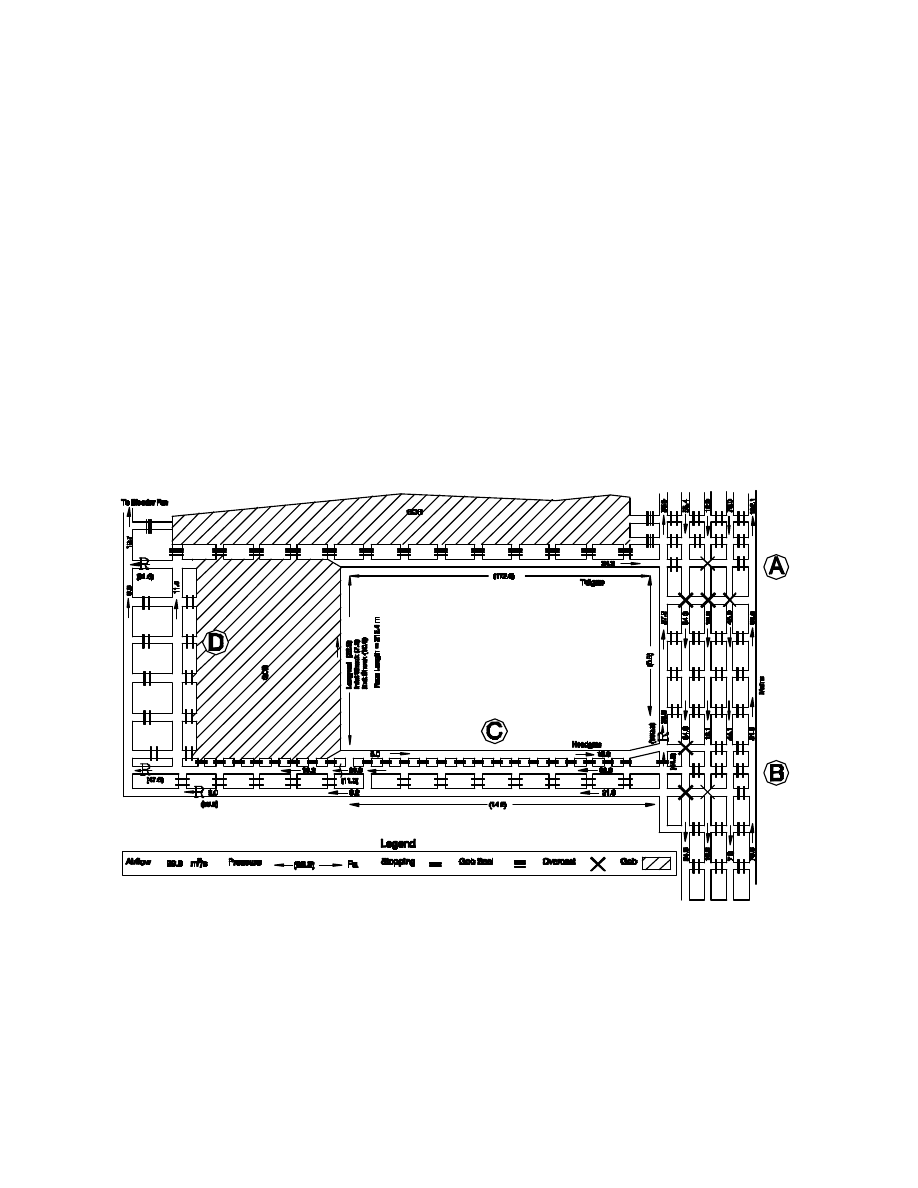
Figure 2 is a sketch showing one of the surveyed longwall panels. This illustration is not to scale.
Certain measured airflow and frictional pressure drop data have been marked on the sketch. To
simplify the figure measured frictional pressure drop data are shown for only the more important
airways. During the survey many more measurements were taken throughout this region in order to
correctly evaluate resistances for all the main airways and leakage paths.
Multiple airflow measurements were taken along the mains and through the longwall headgate in
order to determine the leakage characteristics for this component of the ventilation system. This data
is for a mine utilizing a “U” type ventilation system with a back bleeder, as shown in Figure 1 (B). The
bleeder is used to ventilate the back seals of previously mined panels and exhausts through a
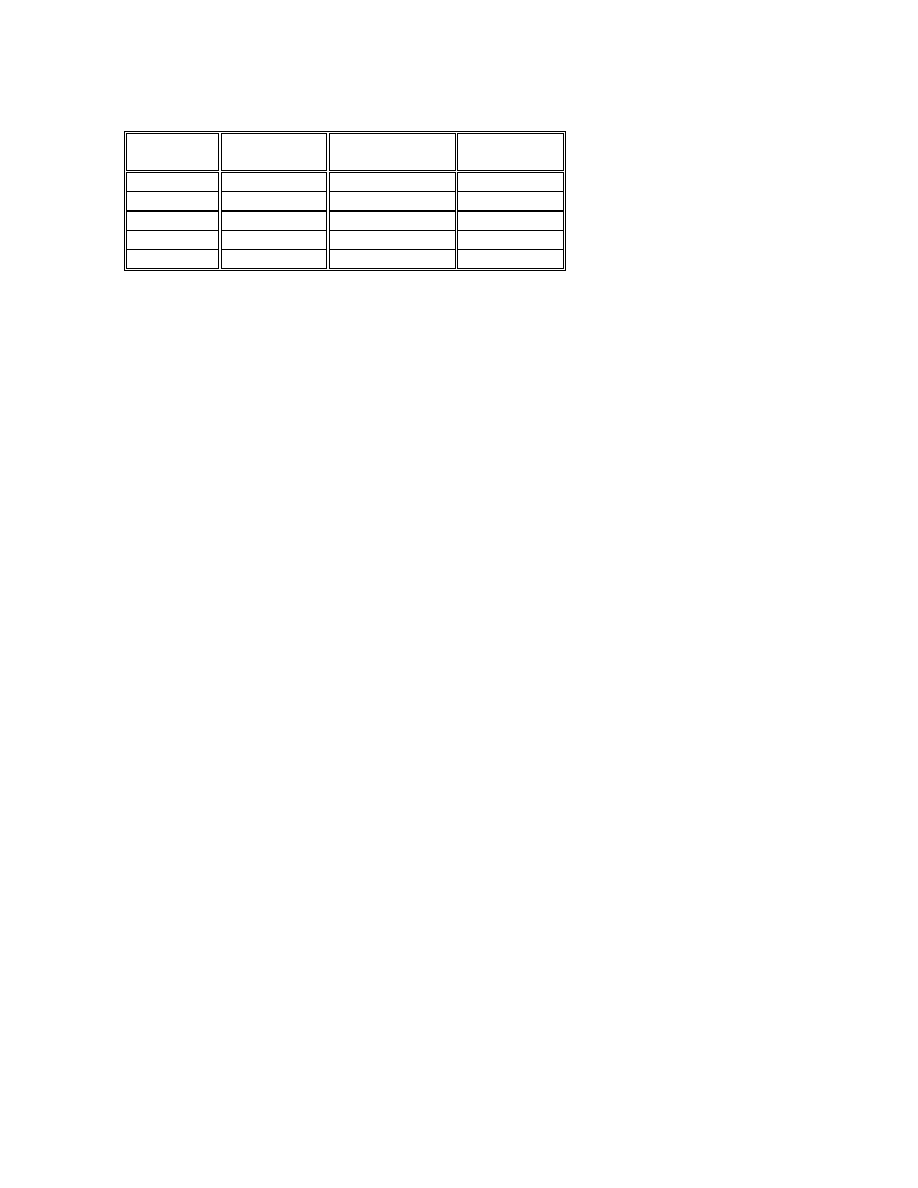
dedicated raise. Table 1 shows the results from the balancing of the measured airflows throughout the
longwall panel. This exercise uses Kirchhoff’s First Law to ensure that the sum of the intake and
exhaust airflows balance within an acceptable error for the main junctions.
Figure 2. Measured airflow and frictional pressure drop data for a longwall panel
6
th
International Mine Ventilation Congress - Technical Paper
7
Junction
Location
Total Intaking
(m
3
/s)
Total Exhausting
(m
3
/s)
Error of Intake
(%)
A
281.2
284.5
1.2
B
238.4
234.9
1.5
C
59.4
59.3
0.2
D
45.5
48.9
7.5
Entire Area
223.9
230.4
2.9
Table 1. Balancing of measured airflows using Kirchhoff’s First Law
The closure at junction A, indicated on Figure 2, is approximately 3.3 m
3
/s, which represents an
error of 1.2% of the total intake volume. This same exercise is conducted for each main junction to
ensure that the measured airflow data is acceptable. For this mine, the only area where the measured
data does not close to within
±
5%, is area D. This junction examines the balance of air intaking the
longwall faceline, to that exhausting via the belt entry, tailgate and the back bleeder. An error of 7.5%
exists at this location, but considering the difficult measurement conditions near the faceline, and the
fluctuations caused by the operation of the longwall equipment, the error of 3.4 m
3
/s was considered
to be acceptable. A final check on the airflow intaking and exhausting the entire area should always
be conducted, which provided a 2.9% error for this mine.
To ensure closure of the longwall frictional pressure loop, it is necessary to apply Kirchhoff’s
Second Law to the data shown on Figure 2. By summating the frictional pressure drops along the
headgate, across the longwall faceline, and down the tailgate, a total value of 231.2 Pa is obtained.
To close the loop, the frictional pressure drop from junctions A to B must be totaled, while continuing
around the loop in the same direction (clockwise). The total frictional pressure drop from points A to
B is -244.4 Pa. Hence, the error on the loop is -13.2 Pa, or approximately 5.7%. This error is within
the
±
10% criteria specified for the frictional pressure loops. In practice many smaller pressure loops
would be closed using frictional pressure drops across stoppings and along other main airways (using
additional data not shown on Figure 2).
RESULTS FOR THE LONGWALL FACELINE
The majority of the air passing across the longwall faceline travels in the void formed by the fresh
wall of coal, top of the support shields, and the primary rams on the shields. A small amount of air
does pass through the area between the rams and the back of the shields at the gob, however, this
area is generally much smaller than that adjacent to the wall. The leakage of air from or onto the
longwall faceline is dependent on the resistance of the gob and the differential pressure maintained
across the caved zone.
As the air enters the longwall faceline there is a shock loss encountered by the air as a result of the
multiple changes in airflow direction and airway dimension. The intake air will typically travel along the
center airway(s) of the headgate until it reaches the location of the last open cross-cut. At this point
the intake air will turn abruptly into the cross cut, travel through the cross cut, and then turn into the

6
th
International Mine Ventilation Congress - Technical Paper
8
belt entry. The intake entry, inbye of the last open cross cut, will typically be regulated using a curtain
hung across the airway. Some air may be routed around the back of the longwall panel to provide
ventilation for personnel and to remove gas, however, most of the air will be forced into the belt entry
at the faceline. For the majority of mines, as the intake air exits the last open cross cut, into the belt
entry, the airflow will split. Some air will exhaust the headgate via the belt entry, while the remainder
will be directed across the faceline. In order to enter the faceline the air has to move around various
obstructions within the belt entry, and then turn at the first shield. To empirically compute the total
shock loss of the air from the end of the intake airway at the headgate, to the first shield at the longwall
faceline is extremely difficult, and at best is an estimate. In order to facilitate the estimation of this
shock loss, survey data was examined to provide an average value and range for this resistance.
The shock loss of the air entering the longwall faceline may be considered as the first of three stages
of resistance. The second stage is that of the actual faceline itself. To simplify the calculations the
resistance was assumed to be linear across the breadth of the panel. In practice the resistance per
length will actually vary according to the movement of the shearer and the associated positioning of the
shields. However, without conducting considerably more detailed measurements to isolate various
sections of the faceline, this change in resistance cannot be accurately determined.
The final section of the longwall is at the transition point into the tailgate. This “tail” section of the
longwall is perhaps the hardest to empirically compute the resistance for. The constriction and shock
loss varies considerably according to many factors, including; tailgate configuration and support,
ground conditions, longwall mining technique and bleeder configuration. Because of these many
factors, it is difficult to determine an average shock loss or equivalent length from measured data. For
this study “best” and “worst” case resistances for the shock loss were determined from the field
measurements, providing a range for use in future planning.
Faceline with no Shock Losses
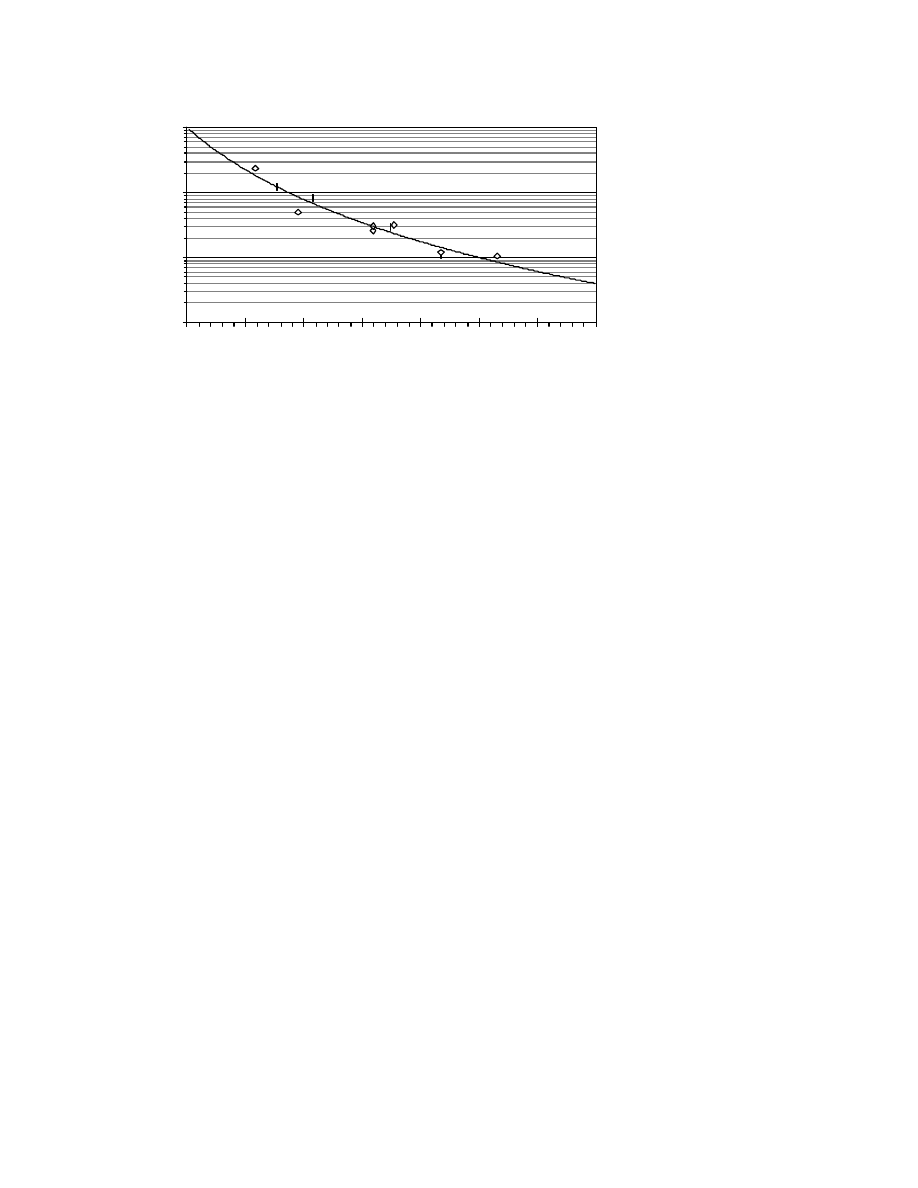
Figure 3 shows a graph of resistance per length plotted against wall height for the measured longwall
faces. This graph provides resistances for the actual faceline section, and does not include any shock
losses. Because of the irregular cross section of the longwall it is considerably simpler to determine
resistance directly from resistance per length, rather than using an equivalent Atkinson friction factor.
The graph is plotted on a logarithmic scale on the y-axis, such that a complete range of wall height may
be plotted from 1.0 m through 4.5 m. A definite trend is visible, formed by plotting resistance per
length against wall height, and a trend has been fit to the data. Using the equation for this power curve
(y = 99.528 x
-3.6731
) the resistance per length can be obtained for any proposed wall height.
6
th
International Mine Ventilation Congress - Technical Paper
9
There is a considerable degree of scatter with the raw data, which is not that apparent due to the
logarithmic scale, however, the data is well distributed throughout the length of the trendline. Perhaps
one of the more interesting results from the longwall ventilation surveys is that it is possible to fit a
trendline to the data. Even though it is reasonable to assume that the resistance should increase as the
wall height decreases, the impact that the shield type, general longwall infrastructure and shearer
movement have on resistance do not appear to be that significant.
Longwall Shock Losses
Figure 3 may be used to determine an approximate resistance per meter for a certain longwall
height. This value may then be multiplied by the proposed longwall width to obtain a resistance value
for the actual longwall faceline section. However, this will not incorporate the shock losses
encountered by the air as it enters and leaves the faceline. The simplest method to incorporate these
shock losses is by adding an equivalent length to the actual faceline length prior to multiplying by the
resistance per meter.
Based on the longwall data collected from the ventilation surveys, resistances for the shock losses
encountered by the air as it enters and exits the faceline were evaluated. Equivalent lengths were
determined by dividing these resistances by the measured resistance per meter for the unobstructed
longwall faceline. The results from this study are provided below:
•
Entry shock loss: Range = 16.4 m - 60.1 m
Average = 33.5 m
•
Exit shock loss:
Range = 25.7 m - 88.5 m
Average = 61.5 m
y = 99.528x
-3.6731
0.1
1.0
10.0
100.0
1.0
1.5
2.0
2.5
3.0
3.5
4.0
4.5
Wall Height (m)
Stand. Resis. per Meter (Ns
2
/m
9
x 10
-4
)
Figure 3. Graph of resistance per length against measured wall height
for the longwall faceline

6
th
International Mine Ventilation Congress - Technical Paper
10
There is a considerable variation in the shock loss encountered by the air at the longwall faceline.
There is no discernible correlation between equivalent length and wall height, with the shock loss
generally being dictated by the condition and constriction for each specific case. Unless information is
available suggesting that the transition shock losses on the longwall faceline will be either lower or
higher than “normal”, it is suggested that the average values are used for planning future longwall
panels.
RESULTS FOR THE HEADGATE ENTRIES
Airflow and frictional pressure drop measurements were conducted along the length of each
headgate intake entry. Based on the data collected from these measurements, resistance per length
and Atkinson friction factors were determined for the eleven panels. Results showing resistance per
meter plotted against entry height are given in Figure 4.
Examination of the graph shows that the resistance per length data for the headgate intake entries is
rather scattered, and it is difficult to fit a precise trendline through the points. Under ideal conditions,
where the entry does not change in shape or size throughout the entire length of the gateroad, there is
no variation in surface roughness along the entry, and there is no disruption to airflow throughout the
period of measurement, the resistance per length should be the same throughout the entry. During the
survey this was not case, and the resistance per length and Atkinson friction factor was found to vary
along the entry. For this study average values were determined for each mine. Some of the scatter
probably results from the inaccuracies of measurement, however, the main reason is due to the
variation in surface roughness at the different mines. For all the gateroad intake entries that were
measured, the only support used was roof bolting. However, the mining method, general condition of
the surrounding ground, quantity of fallen debris against the ribs, and the bolting, meshing and/or
strapping techniques will certainly affect friction factor and resistance per length. In all cases the
entries were driven using continuous miners, however, examination of the entries showed that variation
in equipment type, size and operator technique had a substantial impact on surface roughness.
6
th
International Mine Ventilation Congress - Technical Paper
11
During the ventilation surveys the airway roughness at each mine was not measured. For this reason
it is not possible to try to fit multiple curves to the data, and one power curve was best fit through the
eleven points. This curve can be used to provide an approximate value for resistance per meter based
upon entry height (for a standard 6.1 m wide roadway). However, perhaps the most accurate method
is to allocate an Atkinson friction factor based on the expected condition for the entry.
A statistical analysis on the measured Atkinson friction factor for the headgate intake roadway at
each mine produced the following results (each Atkinson friction factor is provided at standard
density):
•
Average Atkinson friction factor:
0.0056 kg/m
3
•
Standard deviation for the population (11 samples): 0.0018 kg/m
3
•
95% Confidence range:
0.0045 to 0.0066 kg/m
3
•
Actual data range:
0.0036 to 0.0088 kg/m
3
The results indicate that it is difficult to apply a mean value with any degree of confidence, which is
apparent by the scatter of the resistance per length data on Figure 3. Hence, the recommended
technique in modeling a proposed headgate entry is to make a decision as to the condition of the
roadway and use a value within the actual data range shown above. The measured value of 0.0036
kg/m
3
is very low and should only be used for exceptionally smooth entries maintained free of debris
and obstructions. The average value of 0.0056 kg/m
3
may still be considered low if compared to
references determined from measurements in metal mines (McElroy, 1935). However, if this value is
compared against an average value measured by Wala (1991) for straight, clean, unobstructed, roof-
bolted entries driven using a continuous miner in Kentucky coal mines, exactly the same number is
obtained. The peak value of 0.0088 kg/m
3
should be used if the proposed entry is to be driven in
poor ground, where additional debris, increased surface irregularities, and extra
bolting/meshing/banding is likely.
0.0
10.0
20.0
30.0
40.0
50.0
60.0
70.0
80.0
90.0
100.0
1.7
1.9
2.1
2.3
2.5
2.7
2.9
3.1
3.3
3.5
Entry Height (m)
Stand. Resis. per Meter (Ns
2
/m
9
x 10
-6
)
Figure 4. Graph of resistance per length against entry height for single
headgate intake entries (assumes each roadway is 6.1 m wide)

6
th
International Mine Ventilation Congress - Technical Paper
12
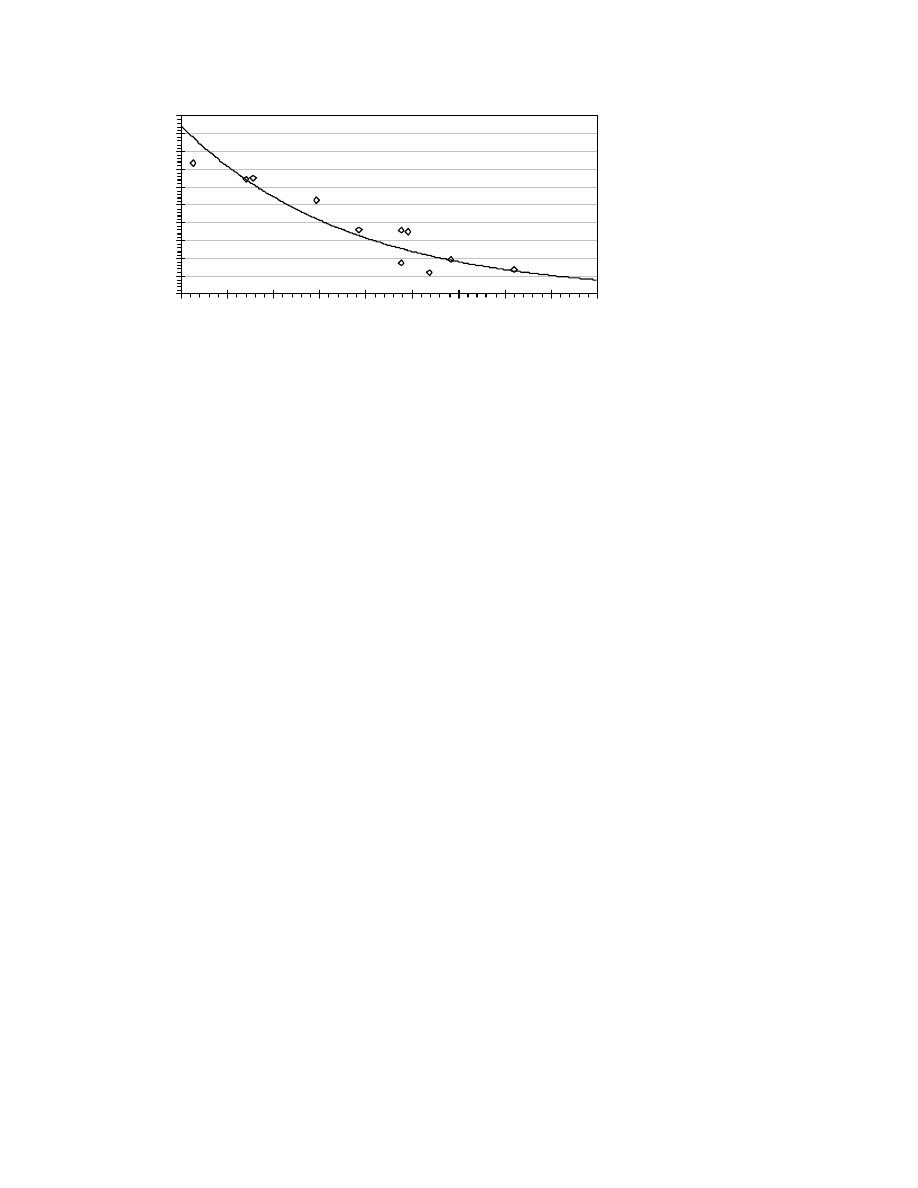
RESULTS FOR THE TAILGATE ENTRIES
For those mines that used a wrap-around tailgate ventilation design, frictional pressure drops were
measured throughout the length of the tailgate. For the nine mines surveyed, the majority used timber
cribbing to support the roof in the tailgate. Generally two rows of 1.2 m wide cribs were used, placed
on 2.4 m centers. In order to provide an estimate for the average resistance per length for this timber
cribbing, a graph has been plotted of resistance per length against entry height. This graph is shown on
Figure 5. Of the eleven longwall panels surveyed, only six used a single timber cribbed tailgate entry
with a wrap-around ventilation system, therefore only six points are plotted. Those mines surveyed
that were particularly gassy did not employ a wrap-around ventilation system, and generally used
dedicated bleeder systems to maintain high differential pressures across the gob. Under these
conditions the tailgate was kept as a low volume intake up to the faceline, and there was generally not
enough airflow to provide measurable frictional pressure drops (or at least large enough values to
enable accurate measurements).
Because of the low number of data points, the trendline fitted to the data in Figure 5 is at best a
rough approximation. The data are distributed across the graph from a roof height of a 1.7 m to 2.9
m. The data can be seen to follow a definite trend, however, tailgate resistance is very mine specific.
Even if two mines drive the same size entry, and use the same method of tailgate support, the
deterioration of the tailgate, and hence the resistance, may vary considerably. The weight of the
overburden, competency of the overlying ground, and the age of the airway mainly dictates the
condition of the tailgate. For these reasons it is often preferable to use an equivalent Atkinson friction
factor for planning the resistance of the tailgate entry.
Applying an equivalent Atkinson friction factor to the tailgate allows the basic geometry of the
airway to be used, without having to adjust the area and perimeter for the supports. This approach
provides an approximate value, whereby the Atkinson friction factor is grossly inflated to account for
0.0
5.0
10.0
15.0
20.0
25.0
1.7
1.8
1.9
2.0
2.1
2.2
2.3
2.4
2.5
2.6
2.7
2.8
2.9
Entry Height (m)
Stand. Resis. per Meter (Ns
2
/m
9
x 10
-4
)
Figure 5. Graph of resistance per length against entry height for single
tailgate entries supported by two rows of timber cribs (based on
cribbing dimensions 1.2 m wide on 2.4 m centers, and 6.1 m original
entry width)

6
th
International Mine Ventilation Congress - Technical Paper
13
the obstruction of the supports, and the increased perimeter. It should be noted that certain
parameters that may be derived from the equivalent Atkinson friction factor, such as the surface
roughness, would be meaningless. The equivalent Atkinson friction factor is provided to allow rapid
estimation of tailgate resistance based on a range of entry conditions.
A statistical analysis on the equivalent Atkinson friction factor for each mine produced the following
results (each friction factor is provided at standard density):
•
Average equivalent Atkinson friction factor:
0.1142 kg/m
3
•
Standard deviation for the population (6 samples): 0.0355 kg/m
3
•
95% Confidence range:
0.0857 to 0.1426 kg/m
3
•
Actual data range:
0.0726 to 0.1808 kg/m
3
As expected the statistical analysis indicates that there is a wide variation in the data. This is the
result of the variation in the condition of the tailgate. It is recommended that if the ground condition is
unknown, the average value of 0.1142 kg/m
3
is used for the equivalent Atkinson friction factor for a
timber supported tailgate entry (1.2 m crib width). If the mine has very little overburden, and the roof
is competent, a figure as low as 0.0726 kg/m
3
can be applied. Conversely, if the mine has a
considerable depth of overburden, and the roof is in poor condition, a value as large as 0.1808 kg/m
3
is applicable. However, it should be noted that the latter value was measured in a mine that had an old
tailgate that was in extremely poor condition. Based upon the data collected, there was no discernible
correlation between Atkinson friction factor and whether or not the two rows of timber cribs were
staggered along the entry.
In addition to timber cribbing, measurements were also taken along one tailgate that used pillar type
supports. These supports were 0.6 m in diameter, with roof caps of 0.4 m by 0.8 m, and were
installed in two rows on approximately 1.8 m spacing. The entry was in average to poor condition,
and the following results were obtained for this configuration:
•
Equivalent Atkinson friction factor: 0.0666 kg/m
3
•
Entry height:
2.8 m
•
Resistance per meter:
2.883
×
10
-4
Ns
2
/m
8
Surprisingly the resistance per meter is high for the entry height, and plots right on the curve shown
on Figure 5. This high resistance undoubtedly results from the poor condition of the entry, and shows
that high resistances may still be experienced even with substantially smaller supports. This is apparent
from the considerable range of equivalent Atkinson friction factor measured for the timber cribbed
entries, as discussed previously.

6
th
International Mine Ventilation Congress - Technical Paper
14
SUMMARY
As the number of longwall panels increases globally, the demand for reliable empirical data to aide in
ventilation planning and design has grown accordingly. Presented in this paper are the results from full
ventilation surveys of eleven longwall panels at nine different mines.
The results for this study are split into three sections. These comprise of results from measurements
across the actual faceline, and measurements along the headgate and tailgate entries. The results for
the faceline measurements are provided on Figure 3. This graph plots resistance per meter (at
standard air density) against measured wall height. The equation for the trendline fitted through the
data is:
[
]
Resistance per Meter = 99.528 Wall Height
−
3 6731
.
(Ns
2
/m
9
×
10
-4
)
This equation may be used to determine an average resistance per meter for a longwall faceline
based only on the proposed height of the wall. The impact that the shield type, general longwall
infrastructure, and shearer movement have on the resistance could not be determined from the
measurements, but did not seem to be significant when compared against the wall height. An Atkinson
friction factor was not determined for this area of the mine because of the difficulty in measuring an
accurate faceline area.
Equivalent length values were determined for the shock losses encountered by the air as it enters and
exits the longwall faceline. These values should be added to the actual faceline length, and the total
length multiplied by the resistance per meter. The average equivalent length for the entry shock loss
was determined to be 33.5 m, with a range of 16.4-60.1 m. The average equivalent length for the exit
shock loss at the tailgate was determined to be 61.5 m, with a measured range of 25.7-88.5 m.
Engineering judgment should be used to estimate how constricted the longwall transition areas are, and
a value within these ranges should be selected.
Resistance per meter data are also plotted for the headgate and tailgate entries (Figures 4 and 5). A
6.1 m entry width is assumed for both of the figures. These graphs may be used to estimate an
average resistance per length. However, the scatter on both of the graphs makes it difficult to fit a
precise trendline through the data points. Variations in mining technique, roof support, competency of
the overlying ground, and the age of the airway resulted in large discrepancies in resistance per length.
For this reason typical Atkinson friction factors were determined for both of these entries. These
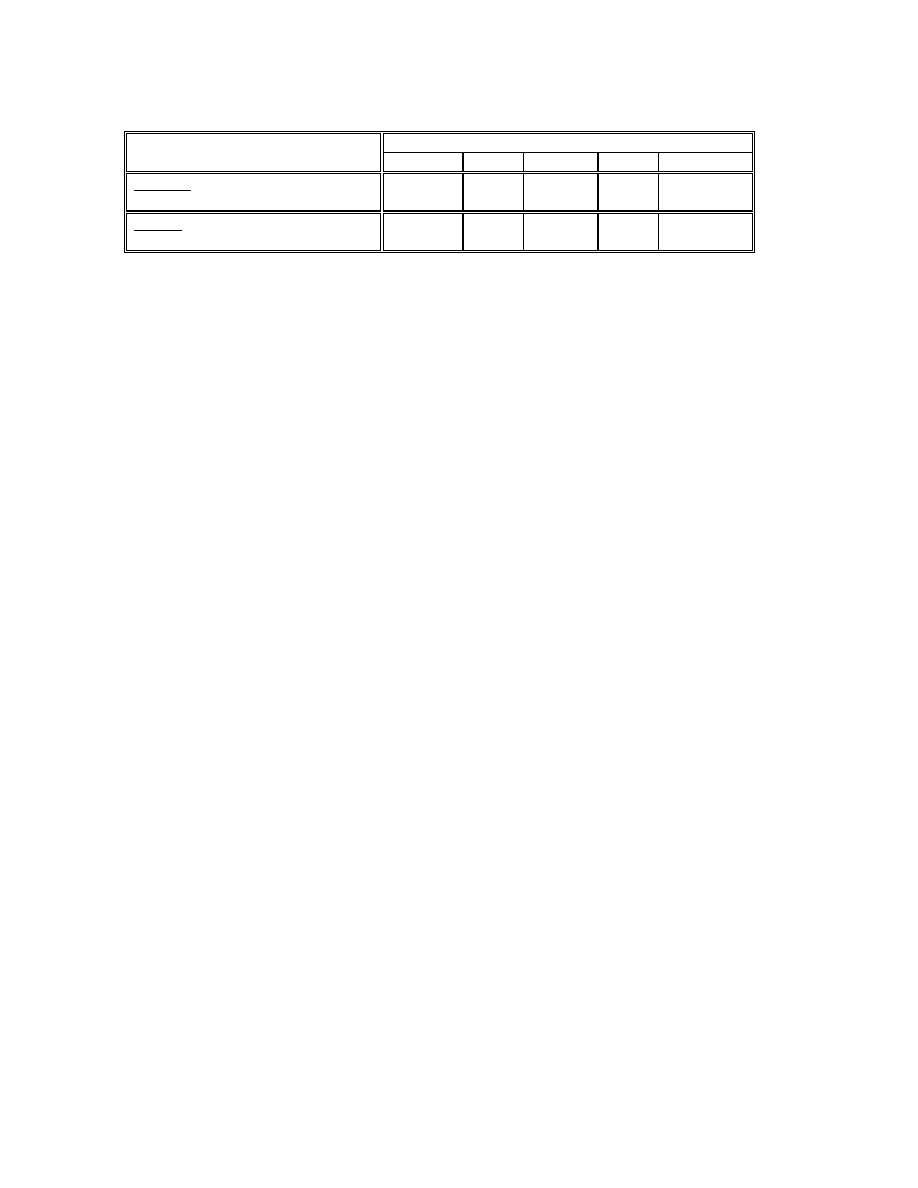
results are provided in Table 2.
6
th
International Mine Ventilation Congress - Technical Paper
15
Description of Airway
Atkinson friction factor (kg/m
3
)
Very Poor
Poor
Average
Good
Very Good
Headgate: Single/intake/continuous
miner/roof bolts only
0.0088
0.0072
0.0056
0.0046
0.0036
Tailgate: Single/timber cribbing/1.2 m
wide cribs/2 rows
0.1808
0.1475
0.1142
0.0934
0.0726
Table 2. Results of Atkinson friction factor for headgate and tailgate entries
This table provides a range of Atkinson friction factors for each airway. The Atkinson friction factor
should be selected based on known or estimated conditions for the entry.
By applying suitable values for the resistance per length, equivalent length and Atkinson friction
factor, it is possible to rapidly obtain an estimate for the main airways around a longwall panel. This
empirical data is valuable when establishing the ventilation requirements for proposed longwall panels,
and may be directly input into ventilation simulation programs. However, it is important to remember
that every mine is unique, and that the Atkinson friction factor, and resistance per length, will vary
according to specific conditions. Hence, it remains important to update calculations and ventilation
computer models with measured data as soon as feasibly possible.
REFERENCES
Hartman, H.L., 1982, “Mine Ventilation and Air Conditioning,” Published by Krieger Publishing
Company, pp. 148-153.
Kharkar, R., Stefanko, R., and Ramani, R.V., 1974, “Analysis of Leakage and Friction Factors in
Coal Mine Ventilation Systems,” Special Research Report Number SR-99, Pennsylvania Department
of Commerce.
McElroy, G.E., 1935, “Engineering Factors in the Ventilation of Metal Mines,” U.S. Department of
the Interior, Bureau of Mines, Bulletin Number 385.
McPherson, M. J., 1993, “Subsurface Ventilation and Environmental Engineering,” Published by
Chapman & Hall, pp. 134-140.
Wala, A.M., 1991, “Studies of Friction Factor for Kentucky’s Coal Mines,” Proceedings of the 5
th
U.S. Mine Ventilation Symposium, Edited by Wang, Y.J., pp. 675-684.
Wyszukiwarka
Podobne podstrony:
An analysis of the European low Nieznany
A Philosophy for all an analysis of the Tao
An analysis of the energy efficiency of winter rapeseed biomass under
an analysis of the legal high mephedrone bioorg med chem lett 20 4135 4139 2010
With Microscope and Tweezers An Analysis of the Internet Virus of November 1988
Price An Analysis of the Strategy and Tactics of Alexious I Komnenos
A systematic review and meta analysis of the effect of an ankle foot orthosis on gait biomechanics a
David Icke An Other Dimensional View of the American Catastrophe from a Source They Cannot Silence
Analysis of the Vibrations of an Elastic Beam
An analysis of energy efficiency in the production of oilseed crops
An Analysis of U S Army Fratricide Incidents during the Global War on Terror (11 September 2001 to 3
Al Suhaibani And Kryzanowski An Exploratory Analysis Of The Order Book, And Order Flow And Execution
Orszulak Dudkowska, Katarzyna Food Expenses in the Rhythm of Daily Life An Analysis of Household Ac
Piotr Siuda Prosumption in the Pop Industry An Analysis of Polish Entertainment Companies
Terrorists as Enemy Combatants An Analysis of How the United States Applies the Law of Armed Conflic
więcej podobnych podstron