Chapter 15
FLOW OVER BODIES: DRAG AND LIFT

Drag, Lift, and Drag Coefficients of Common Geometries
15-1C The flow over a body is said to be two-dimensional when the body is too long and of constant cross-section, and the flow is normal to the body (such as the wind blowing over a long pipe perpendicular to its axis). There is no significant flow along the axis of the body. The flow along a body that possesses symmetry along an axis in the flow direction is said to be axisymmetric (such as a bullet piercing through air). Flow over a body that cannot be modeled as two-dimensional or axisymmetric is three-dimensional. The flow over a car is three-dimensional.
15-2C The velocity of the fluid relative to the immersed solid body sufficiently far away from a body is called the free-stream velocity, V∞. The upstream (or approach) velocity V is the velocity of the approaching fluid far ahead of the body. These two velocities are equal if the flow is uniform and the body is small relative to the scale of the free-stream flow.
15-3C A body is said to be streamlined if a conscious effort is made to align its shape with the anticipated streamlines in the flow. Otherwise, a body tends to block the flow, and is said to be blunt. A tennis ball is a blunt body (unless the velocity is very low and we have “creeping flow”).
15-4C The formation of vapor cavities in regions of low pressure in liquid flow is called cavitation. It occurs at locations such as the constrictions in a valve or the tips of impeller blades where the pressure drops below vapor pressure due to high velocities. We try to avoid cavitation since it reduces performance, generates annoying vibrations and noise, and causes erosion, surface pitting, fatigue failure, and the eventual destruction of the components or machinery.
15-5C The force a flowing fluid exerts on a body in the flow direction is called drag. Drag is caused by friction between the fluid and the solid surface, and the pressure difference between the front and back of the body. We try to minimize drag in order to reduce fuel consumption in vehicles, improve safety and durability of structures subjected to high winds, and to reduce noise and vibration.
15-6C The force a flowing fluid exerts on a body in the normal direction to flow that tend to move the body in that direction is called lift. It is caused by the components of the pressure and wall shear forces in the normal direction to flow. The wall shear also contributes to lift (unless the body is very slim), but its contribution is usually small.
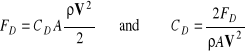
15-7C When the drag force FD, the upstream velocity V, and the fluid density ρ are measured during flow over a body, the drag coefficient can be determined from
![]()
where A is ordinarily the frontal area (the area projected on a plane normal to the direction of flow) of the body.
15-8C When the lift force FL, the upstream velocity V, and the fluid density ρ are measured during flow over a body, the lift coefficient can be determined from
![]()
where A is ordinarily the planform area, which is the area that would be seen by a person looking at the body from above in a direction normal to the body.
15-9C The frontal area of a body is the area seen by a person when looking from upstream. The frontal area is appropriate to use in drag and lift calculations for blunt bodies such as cars, cylinders, and spheres.
15-10C The planform area of a body is the area that would be seen by a person looking at the body from above in a direction normal to flow. The planform area is appropriate to use in drag and lift calculations for slender bodies such as flat plate and airfoils when the frontal area is very small.
15-11C The maximum velocity a free falling body can attain is called the terminal velocity. It is determined by setting the weight of the body equal to the drag and buoyancy forces, W = FD + FB.
15-12C The part of drag that is due directly to wall shear stress τw is called the skin friction drag FD, friction since it is caused by frictional effects, and the part that is due directly to pressure P and depends strongly on the shape of the body is called the pressure drag FD, pressure. For slender bodies such as airfoils, the friction drag is usually more significant.
15-13C The friction drag coefficient is independent of surface roughness in laminar flow, but is a strong function of surface roughness in turbulent flow due to surface roughness elements protruding further into the highly viscous laminar sublayer.
15-14C (a) In general, the drag coefficient decreases with the Reynolds number at low and moderate Reynolds numbers. (b) The drag coefficient is nearly independent of the Reynolds number at high Reynolds numbers (Re > 104).
15-15C As a result of attaching fairings to the front and back of a cylindrical body at high Reynolds numbers, (a) friction drag increases, (b) pressure drag decreases, and (c) total drag decreases.
15-16C As a result of streamlining, (a) friction drag increases, (b) pressure drag decreases, and (c) total drag decreases at high Reynolds numbers (the general case), but increases at very low Reynolds numbers since the friction drag dominates at low Reynolds numbers.
15-17C At sufficiently high velocities, the fluid stream detaches itself from the surface of the body. This is called separation. It is caused by a fluid flowing over a curved surface at a high velocity (or technically, by adverse pressure gradient). Separation increases the drag coefficient drastically.
15-18C For a moving body to follow another moving body closely by staying close behind is called drafting. It reduces the pressure drag and thus the drag coefficient for the drafted body by taking advantage of the low pressure wake region of the moving body in front.
15-19C The car that is contoured to resemble an ellipse has a smaller drag coefficient and thus smaller air resistance, and it is more likely to be more fuel efficient than a car with sharp corners.
15-20C The bicyclist who leans down and brings his body closer to his knees will go faster since the frontal area and thus the drag force will be less in that position. The drag coefficient will also go down somewhat, but this is a secondary effect.
15-21 The drag force acting on a car is measured in a wind tunnel. The drag coefficient of the car at the test conditions is to be determined. √
Assumptions 1 The flow of air is steady and incompressible. 2 The cross-section of the tunnel is large enough to simulate free flow over the car. 3 The bottom of the tunnel is also moving at the speed of air to approximate actual driving conditions or this effect is negligible. 4 Air is an ideal gas.
Properties The density of air at 1 atm and 25°C is ρ = 1.164 kg/m3 (Table A-22).
Analysis The drag force acting on a body and the drag coefficient are given by
where A is the frontal area. Substituting and noting that 1 m/s = 3.6 km/h, the drag coefficient of the car is determined to be
![]()
Discussion Note that the drag coefficient depends on the design conditions, and its value will be different at different conditions. Therefore, the published drag coefficients of different vehicles can be compared meaningfully only if they are determined under identical conditions. This shows the importance of developing standard testing procedures in industry.
15-22 A car is moving at a constant velocity. The upstream velocity to be used in fluid flow analysis is to be determined for the cases of calm air, wind blowing against the direction of motion of the car, and wind blowing in the same direction of motion of the car. √
Analysis In fluid flow analysis, the velocity used is the relative velocity between the fluid and the solid body. Therefore:
(a) Calm air: V = Vcar = 80 km/h
(b) Wind blowing against the direction of motion:
V = Vcar + Vwind = 80 + 30 = 110 km/h
(c) Wind blowing in the same direction of motion:
V = Vcar - Vwind = 80 - 50 = 30 km/h
Discussion Note that the wind and car velocities are added when they are in opposite directions, and subtracted when they are in the same direction.
15-23 The resultant of the pressure and wall shear forces acting on a body is given. The drag and the lift forces acting on the body are to be determined.
Analysis The drag and lift forces are determined by decomposing the resultant force into its components in the flow direction and the normal direction to flow,
Drag force: ![]()
Lift force: ![]()
Discussion Note that the greater the angle between the resultant force and the flow direction, the greater the lift.
15-24 The total drag force acting on a spherical body is measured, and the pressure drag acting on the body is calculated by integrating the pressure distribution. The friction drag coefficient is to be determined.
Assumptions 1 The flow of air is steady and incompressible. 2 The surface of the sphere is smooth. 3 The flow over the sphere is turbulent (to be verified).
Properties The density and kinematic viscosity of air at 1 atm and 5°C are ρ = 1.269 kg/m3 and ν = 1.382×10⁻⁵ m2/s (Table A-22). The drag coefficient of sphere in turbulent flow is CD = 0.2, and its frontal area is A = πD2/4 (Table 15-2).
Analysis The total drag force is the sum of the friction and pressure drag forces. Therefore,
![]()
where
![]()
Taking the ratio of the two relations above gives
![]()
Now we need to verify that the flow is turbulent. This is done by calculating the flow velocity from the drag force relation, and then the Reynolds number:

![]()
which is greater than 2×10⁵. Therefore, the flow is turbulent as assumed.
Discussion Note that knowing the flow regime is important in the solution of this problem since the total drag coefficient for a sphere is 0.5 in laminar flow and 0.2 in turbulent flow.
15-25E The frontal area of a car is reduced by redesigning. The amount of fuel and money saved per year as a result are to be determined. √EES
Assumptions 1 The car is driven 12,000 miles a year at an average speed of 55 km/h. 2 The effect of reduction of the frontal area on the drag coefficient is negligible.
Properties The densities of air and gasoline are given to be 0.075 lbm/ft3 and 50 lbm/ft3, respectively. The heating value of gasoline is given to be 20,000 Btu/lbm. The drag coefficient is CD = 0.3 for a passenger car (Table 15-2).
Analysis The drag force acting on a body is determined from
![]()
where A is the frontal area of the body. The drag force acting on the car before redesigning is
![]()
Noting that work is force times distance, the amount of work done to overcome this drag force and the required energy input for a distance of 12,000 miles are
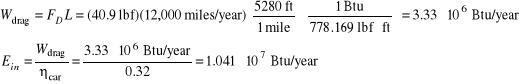
Then the amount and costs of the fuel that supplies this much energy are
![]()
![]()
That is, the car uses 10.41 ft3 = 77.9 gallons of gasoline at a cost of $171.3 per year to overcome the drag.
The drag force and the work done to overcome it are directly proportional to the frontal area. Then the percent reduction in the fuel consumption due to reducing frontal area is equal to the percent reduction in the frontal area:
Therefore, reducing the frontal area reduces the fuel consumption due to drag by 16.7%.
Discussion Note from this example that significant reductions in drag and fuel consumption can be achieved by reducing the frontal area of a vehicle.
15-26E Problem 15-25E is reconsidered. The effect of frontal area on the annual fuel consumption of the car as the frontal area varied from 10 to 30 ft2 in increments of 2 ft2 are to be investigated.
CD=0.3
rho=0.075 "lbm/ft3"
V=55*1.4667 "ft/s"
Eff=0.32
Price=2.20 "$/gal"
efuel=20000 "Btu/lbm"
rho_gas=50 "lbm/ft3"
L=12000*5280 "ft"
FD=CD*A*(rho*V^2)/2/32.2 "lbf"
Wdrag=FD*L/778.169 "Btu"
Ein=Wdrag/Eff
m=Ein/efuel "lbm"
Vol=(m/rho_gas)*7.4804 "gal"
Cost=Vol*Price
A, ft2 |
Fdrag lbf |
Amount, gal |
Cost, $ |
10 12 14 16 18 20 22 24 26 28 30 |
22.74 27.28 31.83 36.38 40.92 45.47 50.02 54.57 59.11 63.66 68.21 |
43.27 51.93 60.58 69.24 77.89 86.55 95.2 103.9 112.5 121.2 129.8 |
95.2 114.2 133.3 152.3 171.4 190.4 209.4 228.5 247.5 266.6 285.6 |
15-27 A circular stop sign is subjected to high winds. The drag force acting on the sign and the bending moment at the bottom of its pole are to be determined. √EES
Assumptions 1 The flow of air is steady and incompressible. 2 The drag force on the pole is negligible. 3 The flow is turbulent so that the tabulated value of the drag coefficient can be used.
Properties The drag coefficient for a thin circular disk is CD = 1.1 (Table 15-2). The density of air at 100 kPa and 10°C = 283 K is
![]()
Analysis The frontal area of a circular plate subjected to normal flow is A = πD2/4. Then the drag force acting on the stop sign is
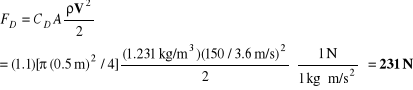
Noting that the resultant force passes through the center of the stop sign, the bending moment at the bottom of the pole becomes
![]()
Discussion Note that the drag force is equivalent to the weight of over 23 kg of mass. Therefore, the pole must be strong enough to withstand the weight of 23 kg hanged at one of its end when it is held from the other end horizontally.
15-28E A rectangular billboard is subjected to high winds. The drag force acting on the billboard is to be determined.
Assumptions 1 The flow of air is steady and incompressible. 2 The drag force on the supporting poles are negligible. 3 The flow is turbulent so that the tabulated value of the drag coefficient can be used.
Properties The drag coefficient for a thin rectangular plate for normal flow is CD = 2.0 (Table 15-2). The density of air at 14.3 psia and 40°F = 500 R is
![]()
Analysis The drag force acting on the billboard is determined from
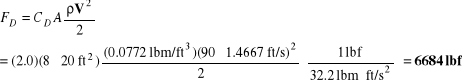
Discussion Note that the drag force is equivalent to the weight of 6684 lbm of mass. Therefore, the support bars must be strong enough to withstand the weight of 6684 lbm hanged at one of their ends when they are held from the other end horizontally.
15-29 An advertisement sign in the form of a rectangular block that has the same frontal area from all four sides is mounted on top of a taxicab. The increase in the annual fuel cost due to this sign is to be determined.
Assumptions 1 The flow of air is steady and incompressible. 2 The car is driven 60,000 km a year at an average speed of 50 km/h. 3 The overall efficiency of the engine is 28%. 4 The effect of the sign and the taxicab on the drag coefficient of each other is negligible (no interference), and the edge effects of the sign are negligible (a crude approximation). 5 The flow is turbulent so that the tabulated value of the drag coefficient can be used.
Properties The densities of air and gasoline are given to be 1.25 kg/m3 and 0.75 kg/L, respectively. The heating value of gasoline is given to be 42,000 kJ/kg. The drag coefficient for a square rod for normal flow is CD = 2.2 (Table 15-1).
Analysis Noting that 1 m/s = 3.6 km/h, the drag force acting on the sign is
![]()
Noting that work is force times distance, the amount of work done to overcome this drag force and the required energy input for a distance of 60,000 km are
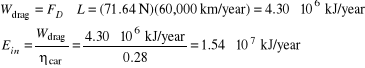
Then the amount and cost of the fuel that supplies this much energy are
That is, the taxicab will use 488 L of gasoline at a cost of $244 per year to overcome the drag generated by the advertisement sign.
Discussion Note that the advertisement sign increases the fuel cost of the taxicab significantly. The taxicab operator may end up losing money by installing the sign if he/she is not aware of the major increase in the fuel cost, and negotiate accordingly.
15-30 The water needs of a recreational vehicle (RV) are to be met by installing a cylindrical tank on top of the vehicle. The additional power requirements of the RV at a specified speed for two orientations of the tank are to be determined.
Assumptions 1 The flow of air is steady and incompressible. 2 The effect of the tank and the RV on the drag coefficient of each other is negligible (no interference). 3 The flow is turbulent so that the tabulated value of the drag coefficient can be used.
Properties The drag coefficient for a cylinder corresponding to L/D = 2/0.5 = 4 is CD = 0.9 when the circular surfaces of the tank face the front and back, and CD = 0.8 when the circular surfaces of the tank face the sides of the RV (Table 15-2). The density of air at the specified conditions is
![]()
Analysis (a) The drag force acting on the tank when the circular surfaces face the front and back is
![]()
Noting that power is force times velocity, the amount of additional power needed to overcome this drag force is
![]()
(b) The drag force acting on the tank when the circular surfaces face the sides of the RV is
![]()
Then the additional power needed to overcome this drag force is
![]()
Therefore, the additional power needed to overcome the drag caused by the tank is 1.67 kW and 7.55 W for the two orientations indicated.
Discussion Note that the additional power requirement is the lowest when the tank is installed such that its circular surfaces face the front and back of the RV. This is because the frontal area of the tank is minimum in this orientation.
15-31E A person who normally drives at 55 mph now starts driving at 75 mph. The percentage increase in fuel consumption of the car is to be determined.
Assumptions 1 The power generated by the car engine is used entirely to overcome aerodynamic drag, and thus the fuel consumption is proportional to the drag force on a level road. 2 The drag coefficient remains the same.
Analysis The drag force is proportional to the square of the velocity, and power is force times velocity. Therefore,
![]()
Then the ratio of the drag force at V2= 70 mph to the drag force at V1 = 55 mph becomes
![]()
Therefore, the power to overcome the drag force and thus fuel consumption per unit time more than doubles as a result of increasing the velocity from 55 to 75 mph.
Discussion This increase appears to be large. This is because all the engine power is assumed to be used entirely to overcome drag. Still, the simple analysis above shows the strong dependence of the fuel consumption on the cruising speed of a vehicle.
A better measure of fuel consumption is the amount of fuel used per unit distance (rather than per unit time). A car cruising at 55 mph will travel a distance of 55 miles in 1 hour. But a car cruising at 75 mph will travel the same distance at 55/75 = 0.733 h or 73.3% of the time. Therefore, for a given distance, the increase in fuel consumption is 1.86×0.733 = 1.36 - an increase of 36%.
15-32 A plastic sphere is dropped into water. The terminal velocity of the sphere in water is to be determined.
Assumptions 1 The fluid flow over the sphere is laminar (to be verified). 2 The drag coefficient remains constant.
Properties The density of plastic sphere is 1150 kg/m3. The density and dynamic viscosity of water at 20ႰC are ၲ = 998 kg/m3 and ၭ = 1.002Ⴔ10-3 kg/mთs, respectively (Table A-15). The drag coefficient for a sphere in laminar flow is CD = 0.5 (Table 15-2).
Analysis The terminal velocity of a free falling object is reached when the drag force equals the weight of the solid object less the buoyancy force applied by the fluid,
![]()
where ![]()
Here A = πD2/4 is the frontal area and V = πD3/6 is the volume of the sphere. Substituting and simplifying,

Solving for V and substituting,
![]()
The Reynolds number is
![]()
which is less than 2×10⁵. Therefore, the flow is laminar as assumed.
Discussion This problem can be solved more accurately using a trial-and-error approach by using CD data from Fig. 15-33 (the CD value corresponding to Re = 503 is about 0.6. Repeating the calculations for this value gives 0.115 m/s for the terminal velocity.
15-33 A semi truck is exposed to winds from its side surface. The wind velocity that will tip the truck over to its side is to be determined.
Assumptions 1 The flow of air in the wind is steady and incompressible. 2 The edge effects on the semi truck are negligible (a crude approximation), and the resultant drag force acts through the center of the side surface. 3 The flow is turbulent so that the tabulated value of the drag coefficient can be used. 4 The distance between the wheels on the same axle is also 2 m. 5 The semi truck is loaded uniformly so that its weight acts through its center.
Properties The density of air is given to be ၲ = 1.10 kg/m3. The drag coefficient for a body of rectangular cross-section corresponding to L/D = 2/2 = 1 is CD = 2.2 when the wind is normal to the side surface (Table 15-2).
Analysis When the truck is first tipped, the wheels on the wind-loaded side of the truck will be off the ground, and thus all the reaction forces from the ground will act on wheels on the other side. Taking the moment about an axis passing through these wheels and setting it equal to zero gives the required drag force to be
![]()
Substituting, the required drag force is determined to be
![]()
The wind velocity that will cause this drag force is determined to be
![]()
which is equivalent to a wind velocity of V = 50.3×3.6 = 181 km/h.
Discussion This is very high velocity, and it can be verified easily by calculating the Reynolds number that the flow is turbulent as assumed.
15-34 A bicyclist is riding his bicycle downhill on a road with a specified slope without pedaling or breaking. The terminal velocity of the bicyclist is to be determined for the upright and racing positions.
Assumptions 1 The rolling resistance and bearing friction are negligible. 2 The drag coefficient remains constant. 3 The buoyancy of air is negligible.
Properties The density of air is given to be ၲ = 1.25 kg/m3. The frontal area and the drag coefficient are given to be 0.45 m2 and 1.1 in the upright position, and 0.4 m2 and 0.9 on the racing position.
Analysis The terminal velocity of a free falling object is reached when the drag force equals the component of the total weight (bicyclist + bicycle) in the flow direction,
![]()
→ ![]()
Solving for V gives ![]()
The terminal velocities for both positions are obtained by substituting the given values:
Upright position: 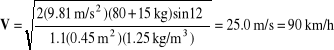
Racing position: 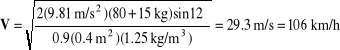
Discussion Note that the position of the bicyclist has a significant effect on the drag force, and thus the terminal velocity. So it is no surprise that the bicyclists maintain the racing position during a race.
15-35 The pivot of a wind turbine with two hollow hemispherical cups is stuck as a result of some malfunction. For a given wind speed, the maximum torque applied on the pivot is to be determined. √EES
Assumptions 1 The flow of air in the wind is steady and incompressible. 2 The air flow is turbulent so that the tabulated values of the drag coefficients can be used.
Properties The density of air is given to be ၲ = 1.25 kg/m3. The drag coefficient for a hemispherical cup is 0.4 and 1.2 when the hemispherical and plain surfaces are exposed to wind flow, respectively.
Analysis The maximum torque occurs when the cups are normal to the wind since the length of the moment arm is maximum in this case. Noting that the frontal area is πD2/4 for both cups, the drag force acting on each cup is determined to be
Convex side: ![]()
Concave side: ![]()
The moment arm for both forces is 12.5 cm since the distance between the centers of the two cups is given to be 25 cm. Taking the moment about the pivot, the net torque applied on the pivot is determined to be
![]()
Discussion Note that the torque varies between zero when both cups are aligned with the wind to the maximum value calculated above.
15-36 Prob. 15-35 is reconsidered. The effect of wind speed on the torque applied on the pivot as the wind speed varies from 0 to 50 m/s in increments of 5 m/s is to be investigated.
CD1=0.40 "Curved bottom"
CD2=1.2 "Plain frontal area"
"rho=density(Air, T=T, P=P)" "kg/m^3"
rho=1.25 "kg/m3"
D=0.08 "m"
L=0.25 "m"
A=pi*D^2/4 "m^2"
FD1=CD1*A*(rho*V^2)/2 "N"
FD2=CD2*A*(rho*V^2)/2 "N"
FD_net=FD2-FD1
Torque=(FD2-FD1)*L/2
V, m/s |
Fdrag, net, N |
Torque, Nm |
0 5 10 15 20 25 30 35 40 45 50 |
0.00 0.06 0.25 0.57 1.01 1.57 2.26 3.08 4.02 5.09 6.28 |
0.000 0.008 0.031 0.071 0.126 0.196 0.283 0.385 0.503 0.636 0.785 |
15-37E A spherical tank completely submerged in fresh water is being towed by a ship at a specified velocity. The required towing power is to be determined.
Assumptions 1 The flow is turbulent so that the tabulated value of the drag coefficient can be used. 2 The drag of the towing bar is negligible.
Properties The drag coefficient for a sphere is CD = 0.2 in turbulent flow (it is 0.5 for laminar flow). We take the density of water to be 62.4 lbm/ft3.
Analysis The frontal area of a sphere is A = πD2/4. Then the drag force acting on the spherical tank is
![]()
Noting that power is force times velocity, the power needed to overcome this drag force during towing is
![]()
Therefore, the additional power needed to tow the tank is 12.0 hp.
Discussion Note that the towing power is proportional the cube of the velocity. Therefore, the towing power can be reduced to one-eight (which is 1.5 hp) by reducing the towing velocity by half to 6 ft/s. But the towing time will double this time for a given distance.
15-38 The power delivered to the wheels of a car is used to overcome aerodynamic drag and rolling resistance. For a given power, the speed at which the rolling resistance is equal to the aerodynamic drag and the maximum speed of the car are to be determined. √EES
Assumptions 1 The air flow is steady and incompressible. 2 The bearing friction is negligible. 3 The drag and rolling resistance coefficients of the car are constant. 4 The car moves horizontally on a level road.
Properties The density of air is given to be ၲ = 1.20 kg/m3. The drag and rolling resistance coefficients are given to be CD = 0.32 and CRR = 0.04, respectively.
Analysis (a) The rolling resistance of the car is
![]()
The velocity at which the rolling resistance equals the aerodynamic drag force is determined by setting these two forces equal to each other,
![]()
(or 118 km/h)
(b) Power is force times speed, and thus the power needed to overcome drag and rolling resistance is the product of the sum of the drag force and the rolling resistance and the velocity of the car,
![]()
Substituting the known quantities, the maximum speed corresponding to a wheel power of 80 kW is determined to be
![]()
or,
![]()
whose solution is V = 55.56 m/s = 200 km/h.
Discussion Note that a net power input of 80 kW is needed to overcome the rolling resistance and the aerodynamic drag at a velocity of 200 km/h. About 75% of this power is used to overcome drag and the remaining 25% to overcome the rolling resistance. At much higher velocities, the fraction of drag becomes even higher as it is proportional to the cube of car velocity.
15-39 Problem 13-38 is reconsidered. The effect of car speed on the required power to overcome (a) rolling resistance, (b) the aerodynamic drag, and (c) their combined effect as the car speed varies from 0 to 150 km/h in increments of 15 km/h is to be investigated.
rho=1.20 "kg/m3"
C_roll=0.04
m=950 "kg"
g=9.81 "m/s2"
V=Vel/3.6 "m/s"
W=m*g
F_roll=C_roll*W
A=1.8 "m2"
C_D=0.32
F_D=C_D*A*(rho*V^2)/2 "N"
Power_RR=F_roll*V/1000 "W"
Power_Drag=F_D*V/1000 "W"
Power_Total=Power_RR+Power_Drag
V, m/s |
Wdrag kW |
Wrolling, kW |
Wtotal, kW |
0 15 30 45 60 75 90 105 120 135 150 |
0.00 0.03 0.20 0.68 1.60 3.13 5.40 8.58 12.80 18.23 25.00 |
0.00 1.55 3.11 4.66 6.21 7.77 9.32 10.87 12.43 13.98 15.53 |
0.00 1.58 3.31 5.33 7.81 10.89 14.72 19.45 25.23 32.20 40.53 |
15-40 A submarine is treated as an ellipsoid at a specified length and diameter. The powers required for this submarine to cruise horizontally in seawater and to tow it in air are to be determined.
Assumptions 1 The submarine can be treated as an ellipsoid. 2 The flow is turbulent. 3 The drag of the towing rope is negligible. 4 The motion of submarine is steady and horizontal.
Properties The drag coefficient for an ellipsoid with L/D = 25/5 = 5 is CD = 0.1 in turbulent flow (Table 15-2). The density of sea water is given to be 1025 kg/m3. The density of air is given to be 1.30 kg/m3.
Analysis Noting that 1 m/s = 3.6 km/h, the velocity of the submarine is equivalent to V = 40/3.6 = 11.1 m/s. The frontal area of an ellipsoid is A = πD2/4. Then the drag force acting on the submarine becomes
In water: ![]()
In air: ![]()
Noting that power is force times velocity, the power needed to overcome this drag force is
In water: ![]()
In air: ![]()
Therefore, the power required for this submarine to cruise horizontally in seawater is 1380 kW and the power required to tow this submarine in air at the same velocity is 1.75 kW.
Discussion Note that the power required to move the submarine in water is about 800 times the power required to move it in air. This is due to the higher density of water compared to air (sea water is about 800 times denser than air). Also, the drag coefficient is CD = 0.3 for laminar flow. Therefore, the power requirements would be 3 times larger in laminar flow.
15-41 A garbage can is found in the morning tipped over due to high winds the night before. The wind velocity during the night when the can was tipped over is to be determined.
Assumptions 1 The flow of air in the wind is steady and incompressible. 2 The ground effect on the wind and the drag coefficient is negligible (a crude approximation) so that the resultant drag force acts through the center of the side surface. 3 The garbage can is loaded uniformly so that its weight acts through its center.
Properties The density of air is given to be ၲ = 1.25 kg/m3, and the average density of the garbage inside the can is given to be 150 kg/m3. The drag coefficient of the garbage can is given to be 0.7.
Analysis The volume of the garbage can and the weight of the garbage are
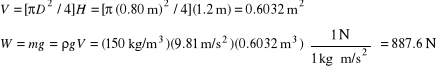
When the garbage can is first tipped, the edge on the wind-loaded side of the can will be off the ground, and thus all the reaction forces from the ground will act on the other side. Taking the moment about an axis passing through the contact point and setting it equal to zero gives the required drag force to be
![]()
Noting that the frontal area is DH, the wind velocity that will cause this drag force is determined to be
![]()
which is equivalent to a wind velocity of V = 37.5×3.6 = 135 km/h.
Discussion The analysis above shows that under the stated assumptions, the wind velocity at some moment exceeded 135 km/h. But we cannot tell how high the wind velocity has been. Such analysis and predictions are commonly used in forensic engineering.
15-42E The drag coefficient of a sports car increases when the sunroof is open, and it requires more power to overcome aerodynamic drag. The additional power consumption of the car when the sunroof is opened is to be determined at two different velocities.
Assumptions 1 The car moves steadily at a constant velocity on a straight path. 2 The effect of velocity on the drag coefficient is negligible.
Properties The density of air is given to be 0.075 lbm/ft3. The drag coefficient of the car is given to be CD = 0.32 when the sunroof is closed, and CD = 0.41 when it is open.
Analysis (a) Noting that 1 mph = 1.4667 ft/s and that power is force times velocity, the drag force acting on the car and the power needed to overcome it at 35 mph are:
Open sunroof: ![]()
![]()
Closed sunroof: ![]()
![]()
Therefore, the additional power required for this car when the sunroof is open is
![]()
(at 35 mph)
(b) We now repeat the calculations for 70 mph:
Open sunroof: ![]()
![]()
Closed sunroof: ![]()
![]()
Therefore, the additional power required for this car when the sunroof is open is
![]()
(at 70 mph)
Discussion Note that the additional drag caused by open sunroof is 0.35 kW at 35 mph, and 2.78 kW at 70 mph, which is an increase of 8 folds when the velocity is doubled. This is expected since the power consumption to overcome drag is proportional to the cube of velocity.
Chapter 15 Flow Over Bodies: Drag and Lift
15-21
FD
Wind tunnel
90 km/h
80 km/h
Wind
V
35°
FR=700 N
D = 12 cm
Air
V
STOP
50 cm
150 km/h
1.5 m
BILLBOARD
8 ft
20 ft
90 mph
AD
TAXI
0.5 m
2 m
RV
V
Water
4 mm
V
0.75 m
2 m
1.8 m
8 m
5,000 kg
12 ft/s
Water
5 ft
25 cm
Submarine
40 km/h
1.2 m
D = 0.8 m
Garbage
can
V∞
Wyszukiwarka
Podobne podstrony:
FTFS Chap22 P001
FTFS Chap14 P001
FTFS Chap13 P001
FTFS Chap08 P001
FTFS Chap18 P001
FTFS Chap11 P001
FTFS Chap15 P043
FTFS Chap09 P001
FTFS Chap17 P001
FTFS Chap19 P001
FTFS Chap12 P001
FTFS Chap10 P001
FTFS Chap23 P001
FTFS Chap16 P001
FTFS Chap20 P001
FTFS Chap15 P071
bb5 chap15
FTFS Chap14 P062
DS F5000 P001 P002 20V AC Adapter
więcej podobnych podstron