Chapter 12
Putting the Pieces Together: Corporate Valuation and Value-Based Management
ANSWERS TO END-OF-CHAPTER QUESTIONS
12-1 a. Assets-in-place, also known as operating assets, include the land, buildings, machines, and inventory that the firm uses in its operations to produce its products and services. Growth options are not tangible. They include items such as R&D and customer relationships. Financial, or nonoperating, assets include investments in marketable securities and non-controlling interests in the stock of other companies.
b. Operating current assets are the current assets used to support operations, such as cash, accounts receivable, and inventory. It does not include short-term investments. Operating current liabilities are the current liabilities that are a natural consequence of the firm's operations, such as accounts payable and accruals. It does not include notes payable or any other short-term debt that charges interest. Net operating working capital is operating current minus operating current liabilities. Operating capital is sum of net operating working capital and operating long-term assets, such as net plant and equipment. Operating capital also is equal to the net amount of capital raised from investors. This is the amount of interest-bearing debt plus preferred stock plus common equity minus short-term investments. NOPAT is the amount of net income a company would generate if it had no debt and held no financial assets. NOPAT is a better measure of the performance of a company's operations because debt lowers income. In order to get a true reflection of a company's operating performance, one would want to take out debt to get a clearer picture of the situation. Free cash flow is the cash flow actually available for distribution to investors after the company has made all the investments in fixed assets and working capital necessary to sustain ongoing operations. It is the most important measure of cash flows because it shows the exact amount available to all investors.
c. The value of operations is the present value of all the future free cash flows that are expected from current assets-in-place and the expected growth of assets-in-place when discounted at the weighted average cost of capital:
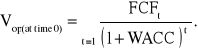
The terminal, or horizon value, is the value of operations at the end of the explicit forecast period. It is equal to the present value of all free cash flows beyond the forecast period, discounted back to the end of the forecast period at the weighted average cost of capital:
![]()
The corporate valuation model defines the total value of a company as the value of operations plus the value of nonoperating assets plus the value of growth options.
d. Value-based management is the systematic application of the corporate value model to a company's decisions. The four value drivers are the growth rate in sales (g), operating profitability (OP=NOPAT/Sales), capital requirements (CR=Capital/Sales), and the weighted average cost of capital (WACC). Return on Invested Capital (ROIC) is NOPAT divided by the amount of capital that is available at the beginning of the year.
e. Managerial entrenchment occurs when a company has such a weak board of directors and has such strong anti-takeover provisions in its corporate charter that senior managers feel there is very little chance that they will be removed. Non-pecuniary benefits are perks that are not actual cash payments, such as lavish offices, memberships at country clubs, corporate jets, and excessively large staffs.
f. Targeted share repurchases, also known as greenmail, occur when a company buys back stock from a potential acquiror at a higher than fair-market price. In return, the potential acquiror agrees not to attempt to take over the company. Shareholder rights provisions, also known as poison pills, allow existing shareholders in a company to purchase additional shares of stock at a lower than market value if a potential acquiror purchases a controlling stake in the company. A restricted voting rights provision automatically deprives a shareholder of voting rights if the shareholder owns more than a specified amount of stock.
g. A stock option allows its owner to purchase a share of stock at a fixed price, called the exercise price, no matter what the actual price of the stock is. Stock options always have an expiration date, after which they cannot be exercised. A restricted stock grant allows an employee to buy shares of stock at a large discount from the current stock price, but the employee is restricted from selling the stock for a specified number of years. An Employee Stock Ownership Plan, often called an ESOP, is a type of retirement plan in which employees own stock in the company.
12-2 The first step is to find the value of operations by discounting all expected future free cash flows at the weighted average cost of capital. The second step is to find the total corporate value by summing the value of operations, the value of nonoperating assets, and the value of growth options. The third step is to find the value of equity by subtracting the value of debt and preferred stock from the total value of the corporation. The last step is to divide the value of equity by the number of shares of common stock.
12-3 A company can be profitable and yet have an ROIC that is less than the WACC if the company has large capital requirements. If ROIC is less than the WACC, then the company is not earning enough on its capital to satisfy its investors. Growth adds even more capital that is not satisfying investors, hence, growth decreases value.
12-4 Entrenched managers consume to many perquisites, such as lavish offices, excessive staffs, country club memberships, and corporate jets. They also invest in projects or acquisitions that make the firm larger, even if they don't make the firm more valuable.
12-5 Stock options in compensation plans usually are issued with an exercise price equal to the current stock price. As long as the stock price increases, the option will become valuable, even if the stock price doesn't increase as much as investors expect.
SOLUTIONS TO END-OF-CHAPTER PROBLEMS
12-1 NOPAT = EBIT(1 - T)
= 100(1 - 0.4) = $60.
Net operating WC01 = ($27 + $80 + $106) - ($52 + $28)
= $213 - $80 = $133.
Operating capital01 = $133 + $265 = $398.
Net operating WC02 = ($28 + $84 + $112) - ($56 + $28)
= $224 - $84 = $140.
Operating capital02 = $140 + $281 = $421.
FCF = NOPAT - Net investment in operating capital
= $100(0.6) - ($421 - $398)
= $37.0.
12-2 Value of operations = Vop = PV of expected future free cash flow
Vop = ![]()
= ![]()
= $6,000,000.
12-3 a. ![]()
= ![]()
= $2,700,000.
b. 0 1 2 3 N

| | | | • • • |
$80,000 $100,000 $108,000
$ 71,428.57
79,719.39
2,152,423.47 ![]()
= 2,700,000 =
$2,303,571.43
12-4 a. ![]()
= ![]()
= $713.33.
b. 0 1 2 3 4 N
| | | | | • • • |
-20 30 40
($ 17.70)
23.49 ![]()
= 713.33
522.10 753.33
$527.89
c. Total valuet=0 = $527.89 + $10.0 = $537.89.
Value of common equity = $537.89 - $100 = $437.89.
Price per share = ![]()
= $43.79.
12-5 The growth rate in FCF from 2003 to 2004 is g=($750.00-$707.55)/$707.50 = 0.06.
VOp at 2003 = ![]()
= $15,000.
12-6 ![]()
=$200,000,000 + (-$40,000,000).
MVA = $160,000,000 - $200,000,000 = -40,000,000.
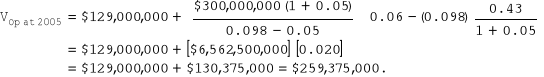
12-7 Capital2005 = Sales2005 (0.43)= $129,000,000.
12-8 Total corporate value = Value of operations + marketable securities
= $756 + $77 = $833 million.
Value of equity = Total corporate value - debt - Preferred stock
= $833 - ($151 + $190) - $76 = $416 million.
12-9 Total corporate value = Value of operations + marketable securities
= $651 + $47 = $698 million.
Value of equity = Total corporate value - debt - Preferred stock
= $698 - ($65 + $131) - $33 = $469 million.
Price per share = $469 / 10 = $46.90.
12-10 a. NOPAT2002 = $108.6(1-0.4) = $65.16
NOWC2002 = ($5.6 + $56.2 + $112.4) - ($11.2 + $28.1) = $134.9 million.
Capital2002 = $134.9 + $397.5 = $532.4 million.
FCF2002 = NOPAT - Investment in Capital = $65.16 - ($532.4 - $502.2)
= $65.16 - $30.2 = $34.96 million.
b. HV2002 = [$34.96(1.06)]/(0.11-0.06) = $741.152 million.
c. VOp at 12/31/2001 = [$34.96 + $741.152]/(1+0.11) = $699.20 million.
d. Total corporate value = $699.20 + $49.9 = $749.10 million.
e. Value of equity = $749.10 - ($69.9 + $140.8) - $35.0 = $503.4 million.
Price per share = $503.4 / 10 = $50.34.
SOLUTION TO SPREADSHEET PROBLEMS
12-11 The detailed solution for the problem is available both on the instructor's resource CD-ROM (in the file “Solution for Ch 12-11 Build a Model.xls”) and on the instructor's side of the Harcourt College Publishers' web site, http://www.harcourtcollege.com/finance/theory.
12-12 The inputs and outputs for all three growth scenarios are shown below for each of the three divisions. The spread for Division A is 0, so all growth rates produce the same MVA. The spread for Division B is negative, so the low growth rate (3%) produces the best MVA, although it still is negative. The spread for division C is positive, so the high growth rate (7%) produces the highest MVA.
Division A: |
|
|
|
INPUT DATA: |
|
|
|
Most recent year's sales (millions of $) |
800.0 |
800.0 |
800.0 |
Sales growth rate |
3.0% |
5.0% |
7.0% |
Operating profitability (OP=NOPAT/Sales) |
7.5% |
7.5% |
7.5% |
Capital requirements (CR=Capitalt-1/Salest) |
75.0% |
75.0% |
75.0% |
WACC |
10.0% |
10.0% |
10.0% |
|
|
|
|
KEY OUTPUTS: |
|
|
|
EROIC |
10.0% |
10.0% |
10.0% |
Spread (EROIC-WACC) |
0.0% |
0.0% |
0.0% |
Value of operations |
618.0 |
630.0 |
642.0 |
Market value added (MVA) |
0.0 |
0.0 |
0.0 |
End of year sales |
824.0 |
840.0 |
856.0 |
End of year capital |
636.5 |
661.5 |
686.9 |
|
|
|
|
MODEL-GENERATED DATA: |
|
|
|
Most recent year's sales (millions of $) |
800.0 |
800.0 |
800.0 |
Forecasted sales for next year |
824.0 |
840.0 |
856.0 |
Forecasted NOPAT |
61.8 |
63.0 |
64.2 |
Start of year capital |
618.0 |
630.0 |
642.0 |
End of year capital |
636.5 |
661.5 |
686.9 |
Free cash flow |
43.3 |
31.5 |
19.3 |
Value of operations |
618.0 |
630.0 |
642.0 |
Market value added |
0.0 |
0.0 |
(0.0) |
Return on invested capital (EROIC=NOPAT/start of year capital) |
10.0% |
10.0% |
10.0% |
Spread (EROIC-WACC) |
0.0% |
0.0% |
0.0% |
Division B: |
|
|
|
INPUT DATA: |
|
|
|
Most recent year's sales (millions of $) |
800.0 |
800.0 |
800.0 |
Sales growth rate |
3.0% |
5.0% |
7.0% |
Operating profitability (OP=NOPAT/Sales) |
9.0% |
9.0% |
9.0% |
Capital requirements (CR=Capitalt-1/Salest) |
95.0% |
95.0% |
95.0% |
WACC |
10.0% |
10.0% |
10.0% |
|
|
|
|
KEY OUTPUTS: |
|
|
|
EROIC |
9.5% |
9.5% |
9.5% |
Spread (EROIC-WACC) |
-0.5% |
-0.5% |
-0.5% |
Value of operations |
723.9 |
714.0 |
670.5 |
Market value added (MVA) |
(58.9) |
(84.0) |
(142.7) |
End of year sales |
824.0 |
840.0 |
856.0 |
End of year capital |
806.3 |
837.9 |
870.1 |
|
|
|
|
MODEL-GENERATED DATA: |
|
|
|
Most recent year's sales (millions of $) |
800.0 |
800.0 |
800.0 |
Forecasted sales for next year |
824.0 |
840.0 |
856.0 |
Forecasted NOPAT |
74.2 |
75.6 |
77.0 |
Start of year capital |
782.8 |
798.0 |
813.2 |
End of year capital |
806.3 |
837.9 |
870.1 |
Free cash flow |
50.7 |
35.7 |
20.1 |
Value of operations |
723.9 |
714.0 |
670.5 |
Market value added |
(58.9) |
(84.0) |
(142.7) |
Return on invested capital (EROIC=NOPAT/start of year capital) |
9.5% |
9.5% |
9.5% |
Spread (EROIC-WACC) |
-0.5% |
-0.5% |
-0.5% |
Division C: |
|
|
|
INPUT DATA: |
|
|
|
Most recent year's sales (millions of $) |
800.0 |
800.0 |
800.0 |
Sales growth rate |
3.0% |
5.0% |
7.0% |
Operating profitability (OP=NOPAT/Sales) |
5.5% |
5.5% |
5.5% |
Capital requirements (CR=Capitalt-1/Salest) |
40.0% |
40.0% |
40.0% |
WACC |
10.0% |
10.0% |
10.0% |
|
|
|
|
KEY OUTPUTS: |
|
|
|
EROIC |
13.8% |
13.8% |
13.8% |
Spread (EROIC-WACC) |
3.8% |
3.8% |
3.8% |
Value of operations |
506.2 |
588.0 |
770.4 |
Market value added (MVA) |
176.6 |
252.0 |
428.0 |
End of year sales |
824.0 |
840.0 |
856.0 |
End of year capital |
339.5 |
352.8 |
366.4 |
|
|
|
|
MODEL-GENERATED DATA: |
|
|
|
Most recent year's sales (millions of $) |
800.0 |
800.0 |
800.0 |
Forecasted sales for next year |
824.0 |
840.0 |
856.0 |
Forecasted NOPAT |
45.3 |
46.2 |
47.1 |
Start of year capital |
329.6 |
336.0 |
342.4 |
End of year capital |
339.5 |
352.8 |
366.4 |
Free cash flow |
35.4 |
29.4 |
23.1 |
Value of operations |
506.2 |
588.0 |
770.4 |
Market value added |
176.6 |
252.0 |
428.0 |
Return on invested capital (EROIC=NOPAT/start of year capital) |
13.8% |
13.8% |
13.8% |
Spread (EROIC-WACC) |
3.8% |
3.8% |
3.8% |
CYBERPROBLEM
12-13 The detailed solution for the cyberproblem is available on the instructor's side of the Harcourt College Publishers' web site, http://www.harcourtcollege.com/finance/theory.
MINI CASE
You have been hired as a consultant to Kulpa Fishing Supplies (KFS), a company that is seeking to increase its value. KFS has asked you to estimate the value of two privately held companies that KFS is considering acquiring. But first, the senior management of KFS would like for you to explain how to value companies that don't pay any dividends. You have structured your presentation around the following questions.
a. List the three types of assets that companies own.
ANSWER: Assets-in-place, growth options, and nonoperating, or financial, assets.
b. what are assets-in-place? How can their value be estimated?
ANSWER: Assets-in-place are tangible, such as buildings, machines, inventory. Usually they are expected to grow. They generate free cash flows. The PV of their expected future free cash flows, discounted at the WACC, is the value of operations.
c. What are growth options? How can their value be estimated?
ANSWER: Growth options are not tangible. They include R&D, such as at drug companies and genetic engineering companies, and building customer relationships, such as at Amazon.com. Growth options are valued using option pricing techniques in Chapter 15.
d. What are nonoperating assets? How can their value be estimated?
ANSWER: Non operating assets are marketable securities and ownership of non-controlling interest in another company. The value of nonoperating assets usually is very close to figure that is reported on balance sheets.
e. What is the total value of a corporation? Who has claims on this value?
ANSWER: Total corporate value is sum of value of operations, value of nonoperating assets, and value of growth options. (No examples in this chapter have a growth option-- this is deferred until Chapter 15). Debtholders have first claim. Preferred stockholders have the next claim. Any remaining value belongs to stockholders.
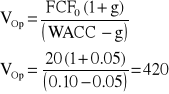
f. 1. The first acquisition target is a privately held company in a mature industry. The company currently has free cash flow of $20 million. Its WACC is 10% and it is expected to grow at a constant rate of 5%. The company has marketable securities of $100 million. It is financed with $200 million of debt, $50 million of preferred stock, and $210 million of book equity. What is its value of operations?

ANSWER:
f. 2. What is its total corporate value? What is its value of equity?
ANSWER: Total corporate value = VOp + Mkt. Sec.
= $420 + $100
= $520 million
Value of equity = Total - Debt - Pref.
= $520 - $200 - $50
= $270 million
f. 3. What is its MVA (MVA = Total corporate value - total book value)?
ANSWER: MVA = Total corporate value of firm minus total book value of firm
Total book value of firm = book value of equity + book value of debt
+ book value of preferred stock
MVA = $520 - ($210 + $200 + $50)
= $60 million
g. 1. The second acquisition target is a privately held company in a growing industry. The target has recently borrowed $40 million to finance its expansion; it has no other debt or preferred stock. It pays no dividends and currently has no marketable securities. KFS expects the company to produce free cash flows of -$5 million in one year, $10 million in two years, and $20 million in three years. After three years, free cash flow will grow at a rate of 6%. Its WACC is 10% and it currently has 10 million shares of stock. What is its horizon value (i.e., its value of operations at year three)? What is its current value of operations (i.e., at time zero)?
ANSWER: 0 1 2 3 4 N
| | | | | • • • |
-5 10 20
$ -4.545
8.264
15.026
398.197
$416.942 = VALUE OF OPERATIONS
g. 2. What is its value of equity on a price per share basis?
ANSWER:
VALUE OF EQUITY = VALUE OF OPERATIONS - DEBT
= $416.94 - $40 = $376.94 MILLION.
PRICE PER SHARE = $376.94/10 = $37.69.
h. KFS is also interested in applying value-based management to its own divisions. Explain what value-based management is.
ANSWER: VBM is the systematic application of the corporate valuation model to all corporate decisions and strategic initiatives. The objective of VBM is to increase Market Value Added (MVA).
i. What are the four value drivers? How does each of them affect value?
ANSWER: MVA is determined by four drivers: Sales growth, Operating profitability (OP=NOPAT/Sales), Capital requirements (CR=Operating capital / Sales, and the Weighted average cost of capital. MVA will improve if WACC is reduced, operating profitability (OP) increases, or the capital requirement (CR) decreases. See the next question for an explanation of the impact of growth.
j. What is return on invested capital (ROIC)? Why is the spread between ROIC and WACC so important?
![]()
ANSWER: ROIC IS THE RETURN ON THE CAPITAL THAT IS IN PLACE AT THE BEGINNING OF THE PERIOD:
If the spread between the expected return, ROICt+1, and the required return, WACC, is positive, then MVA is positive and growth makes MVA larger. The opposite is true if the spread is negative.
k. KFS has two divisions. Both have current sales of $1,000, current expected growth of 5%, and a WACC of 10%. Division A has high profitability (OP=6%) but high capital requirements (CR=78%). Division B has low profitability (OP=4%) but low capital requirements (CR=27%). What is the MVA of each division, based on the current growth of 5%? What is the MVA of each division if growth is 6%?
![]()
ANSWER:
Division A Division B
OP 6% 6% 4% 4%
CR 78% 78% 27% 27%
Growth 5% 6% 5% 6%
MVA (300.0) (360.0) 300.0 385.0
l. What is the ROIC of each division for 5% growth and for 6% growth? How is this related to MVA?
ANSWER:
|
Division A |
Division B |
||
Capital0 |
$780 |
$780 |
$270 |
$270 |
Growth |
5% |
6% |
5% |
6% |
Sales1 |
$1,050 |
$1,060 |
$1,050 |
$1,060 |
NOPAT1 |
$63 |
$63.6 |
$42 |
$42.4 |
ROIC1 |
8.1% |
8.2% |
15.6% |
15.7% |
MVA |
(300.0) |
(360.0) |
300.0 |
385.0 |
The expected ROIC of Division A is less than the WACC, so the division should postpone growth efforts until it improves ROIC by reducing capital requirements (e.g., reducing inventory) and/or improving profitability.
The expected ROIC of Division B is greater than the WACC, so the division should continue with its growth plans.
m. The managers at KFS have heard that corporate governance can affect shareholder value. List for them the three mechanisms of corporate governance.
ANSWER: The three mechanisms are Provisions in the charter that affect takeovers, Composition of the board of directors, and Compensation plans.
n. Why is entrenched management potentially harmful to shareholders?
ANSWER: Entrenchment Occurs when there is little chance that poorly performing managers will be replaced. there are Two causes: Anti-takeover provisions in the charter and a Weak board of directors. Entrenched managers.
Management consumes perks: Lavish offices, corporate jets, Excessively large staffs, Memberships at country clubs
Management accepts projects (or acquisitions) to make firm larger, even if MVA goes down. This is because salary and prestige are highly correlated with size.
o. List three provisions in the corporate charter that affect takeovers.
ANSWER: THESE INCLUDE Targeted share repurchases (i.e., greenmail), Shareholder rights provisions (i.e., poison pills), AND Restricted voting rights plans.
p. Explain the difference between insiders and outsiders on the board of directors. What are interlocking boards?
ANSWER: Weak boards have many insiders (i.e., those who also have another position in the company) compared with outsiders. Interlocking boards are weaker (CEO of company A sits on board of company B, CEO of B sits on board of A).
q. What is a stock option in a compensation plan?
ANSWER: GIVES OWNER OF OPTION THE RIGHT TO BUY A SHARE OF THE COMPANY'S STOCK AT A SPECIFIED PRICE (CALLED THE EXERCISE PRICE) EVEN IF THE ACTUAL STOCK PRICE IS HIGHER. USUALLY CAN'T EXERCISE THE OPTION FOR SEVERAL YEARS (CALLED THE VESTING PERIOD). CAN'T EXERCISE THE OPTION AFTER A CERTAIN NUMBER OF YEARS (CALLED THE EXPIRATION, OR MATURITY, DATE).
Answers and Solutions: 12 - 4
Answers and Solutions: 12 - 3
Solution to Spreadsheet Problems: 12 - 8
Solution to Spreadsheet Problems: 12 - 7
Solution to Cyberproblem: 11 - 10
Solution to Cyberproblem: 12 - 9
Mini Case: 12 - 14
Mini Case: 12 - 15
![]()
WACC = 12%
g = 8%
WACC = 13%
g = 7%
![]()
![]()
kc = 10%
g = 6%
![]()
= 530 = ![]()
Wyszukiwarka
Podobne podstrony:
Ch19 Solations Brigham 10th E
Ch25 Solations Brigham 10th E
Ch04 Solations Brigham 10th E
Ch27 Solations Brigham 10th E
Ch23 Solations Brigham 10th E
Ch26 Solations Brigham 10th E
Ch07 Solations Brigham 10th E
Ch11 Solations Brigham 10th E
Ch16 Solations Brigham 10th E
Ch22 Solations Brigham 10th E
Ch24 Solations Brigham 10th E
Ch05 Solations Brigham 10th E
Ch02 Solations Brigham 10th E
Ch15 Solations Brigham 10th E
Ch01 Solations Brigham 10th E
Ch30 Solations Brigham 10th E
Ch28 Solations Brigham 10th E
Ch13 Solations Brigham 10th E
Ch18 Solations Brigham 10th E
więcej podobnych podstron