Geotech
Page 1
ETI:
H
o
w
To
Bu
il
d
G
o
ld
& Treas
ur
e D
et
ect
o
rs
, 19
81
—
C
o
p
y
ri
gh
t
©
Mur
ray/
M
od
ern
Magazi
nes
, rep
rod
uce f
o
r p
ers
onal
u
se
onl
y
An earth resistivity meter can be used
to identify the composition of various
earth strata and the depth at which each
strata occurs and by detecting changes
in earth composition, to point to the
existence of buried objects.
An earth resistivity meter may be
used to locate archaeological objects to
assist in finding conditions favourable
for alluvial gold or gemstones, or even
for such prosaic duties as determining
where to locate a septic tank!
These instruments are not expensive
compared with most electronic instru-
mentation. Nevertheless at $1000 or so
they are way above the budget of most
amateur archaeologists or rock-hounds.
But for such people all is not lost — it
is possible to construct a simple dc
operated resistivity meter for a mere
fraction of the price of commercial
units.
For this to be possible we have to
accept a few operating limitations —
primarily of operating depth — for
whereas a commercial unit may be used
to depths of 100-200 metres, our unit is
limited to 15 metres or so. But unless
you are hoping to locate oil bearing
deposits in your backyard the limitation
on operating depth should not be a
problem.
The basic instrument is extremely
simple — four equally spaced elec-
trodes are placed in line in the earth. An
accurately known current is caused to
flow from one outer electrode to the
other and a measurement is taken of the
voltage between the two inner
electrodes.
Having measured both voltage and
current, a simple formula is used to
establish depth and composition of the
strata.
Professional earth resistivity meters
use alternating current across the earth
electrodes in order to eliminate the
effects of the small galvanic voltages
caused by the earth.
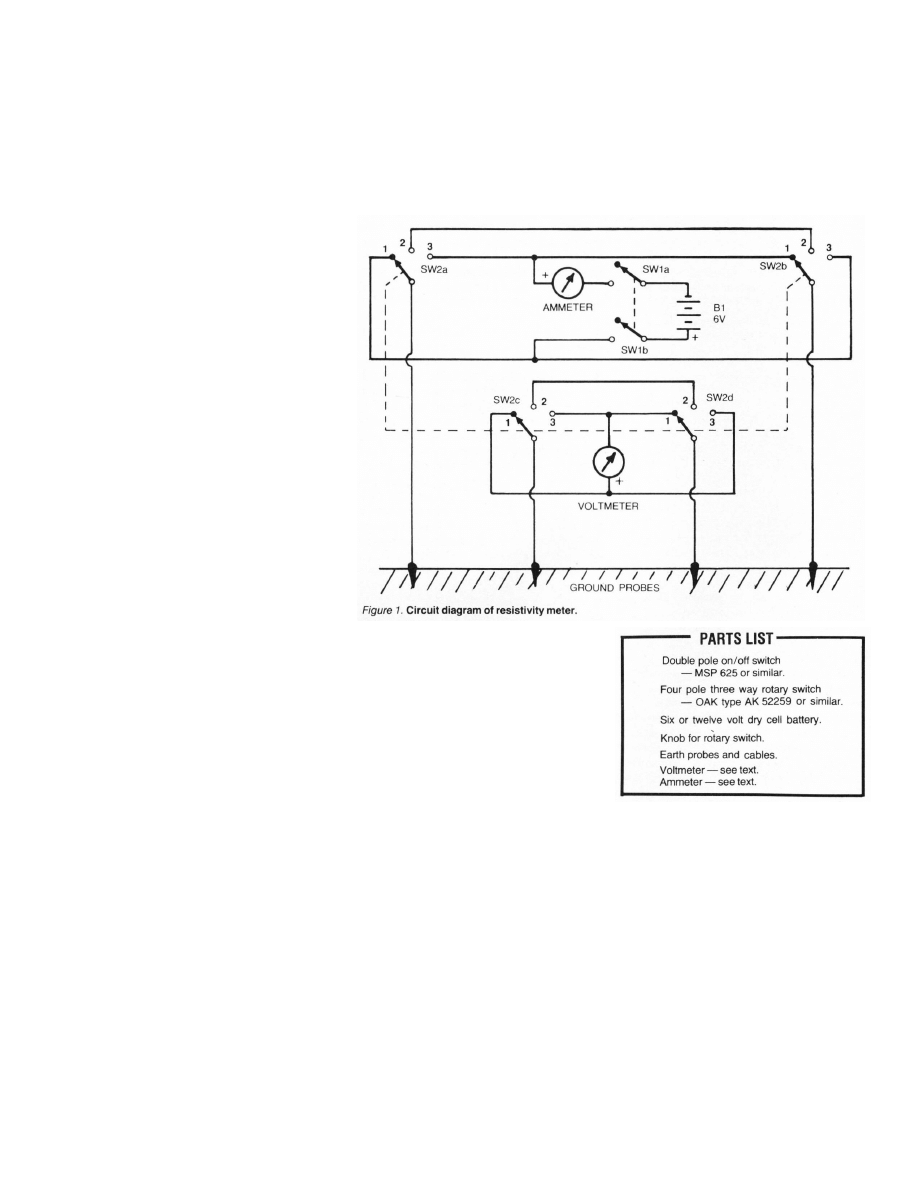
This effect cannot be totally elimi-
nated with dc instruments but it can be
minimised by switching the battery
across the electrodes in alternate polari-
ties — a centre position of the switch
(SW2) meanwhile short-circuits the two
centre electrodes between readings to
discharge the galvanic potential.
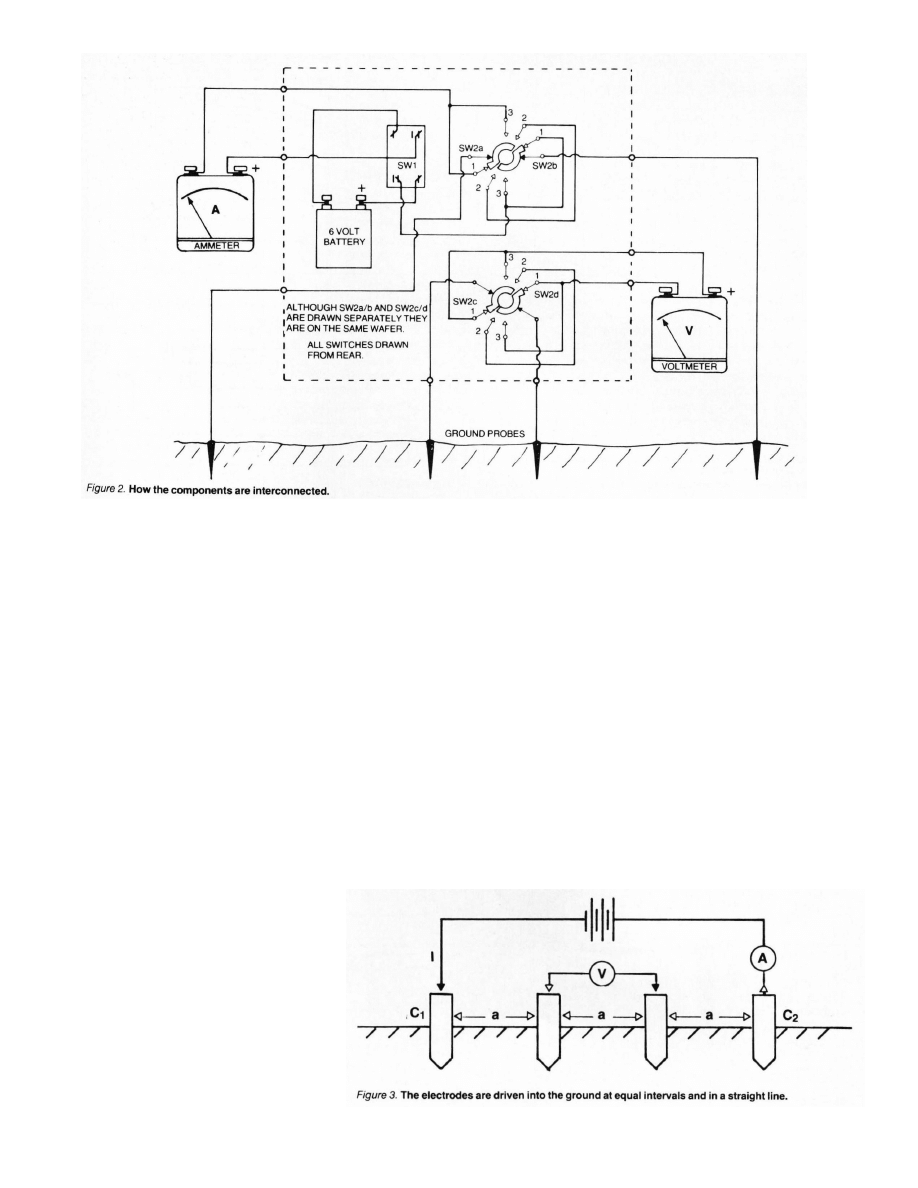
Figure 1 shows the circuit diagram of
the instrument. A connection diagram is
reproduced in Figure 2.
We have not provided any mechani-
cal assembly drawings, for this will
depend almost entirely upon the meters
used. A pair of cheap multimeters are
ideal but if these are not available then a
voltmeter and a milliameter with swit-
chable ranges should be used. The
milliameter should be capable of mea-
suring from microamps to a maximum
of 100 milliamps or so, the voltmeter
should cover a range from approxi-
mately 100 microvolts to three volts or
so and should have a sensitivity of
about 20 000 ohms per volt.
Switch SW2 is a three-pole four-way
wafer switch. All switching contacts are
located on one wafer. Each of the four
segments shown in the wiring diagram
(i.e: SW1 SW2 etc) consists of a wip-
ing contact and three fixed contacts —
the connections will be readily appar-
ent when the wiring diagram is
compared with the switch.
The ground probes should ideally be
made of copper coated steel or brass —
however electrodes made from 25 mm
to 50 mm steel tubing or rod will work
quite well as long as they are kept clean.
It is of course essential that they make
the best possible contact with the sur-
rounding earth. Electrode cable
connections must be securely made
using proper terminals — remember
that you are looking for fairly minor
changes in earth resistance.
Operating voltage is not critical — a
six or twelve volt dry cell is adequate
for most applications.
Earth resistivity meter
John Stanley
From gold to archaeological remains — this simply
constructed instrument will assist your prospecting.
Geotech
Page 2
ETI:
H
o
w
To
Bu
il
d
G
o
ld
& Treas
ur
e D
et
ect
o
rs
, 19
81
—
C
o
p
y
ri
gh
t
©
Mur
ray/
M
od
ern
Magazi
nes
, rep
rod
uce f
o
r p
ers
onal
u
se
onl
y
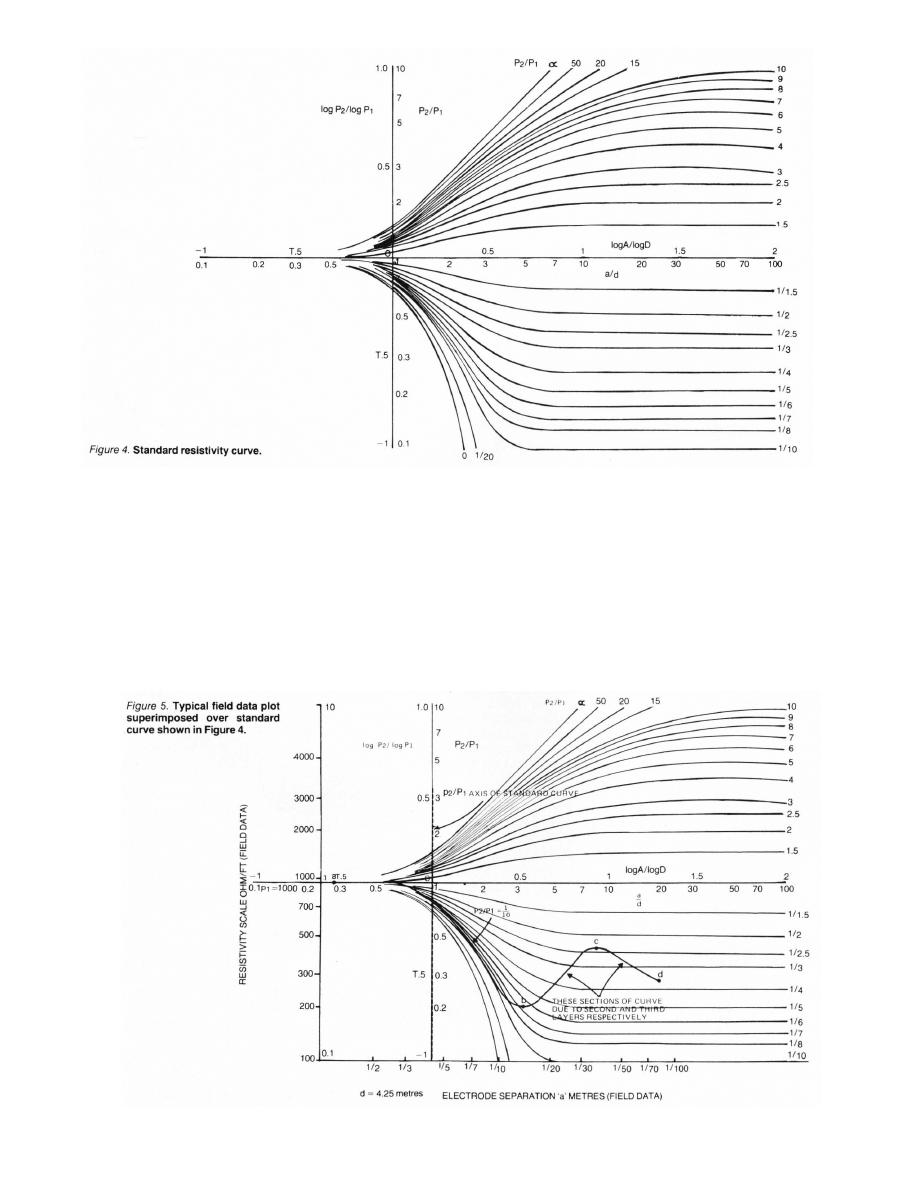
Measuring earth resistivity
There are several methods of measur-
ing soil resistivities, mostly variations
of the original method devised by Wen-
ner. This consists of driving four metal
spikes (commonly called electrodes),
into the ground, at equal intervals along
a straight line as shown in Figure 3.
A current is passed through the outer
electrodes C
1
and C
2
and the resulting
voltage drop across the earth resistance
is measured across the inner pair p
1
and
p
2
.
If the ground has a uniform resistiv-
ity p then
p = 2
πa V/I = 2πa R
where ‘R’ is the apparent resistance
measured between the inner potential
electrodes.
Generally the current will flow in an
arc between the electrodes and hence
the depth penetrated will increase as the
electrode separation is increased. The
effective depth at which R is measured
is usually taken as 0.6 times the separa-
tion ‘a’.
For the greatest accuracy in determin-
ing the ratio V/I it is desirable that the
current flow I be maximised and hence
in dry surface conditions it is common
to moisten the soil about the electrodes
to reduce the contact resistance. The
depth to which the electrodes are
inserted must not exceed one-twentieth
of their separation. This is important if
standard curves are to be used for the
interpretation of the experimental data.
Having inserted the four electrodes an
average value for both V and I must be
determined for both polarities of the
battery. Reversing the polarity removes
the possibility that the earth may have
its own potential due to galvanic reac-
tions underground. From these
measurements the resistivity p can be
calculated.
Resistivity depth sounding
Consider for example the problem of
measuring the depth beneath the ground
of the water table or perhaps the thick-
ness of soil overlying the bedrock. This
type of situation is by far the most com-
mon — where a layer of resistivity p1
and thickness ‘d’ is overlying a layer of
different resistivity p2.
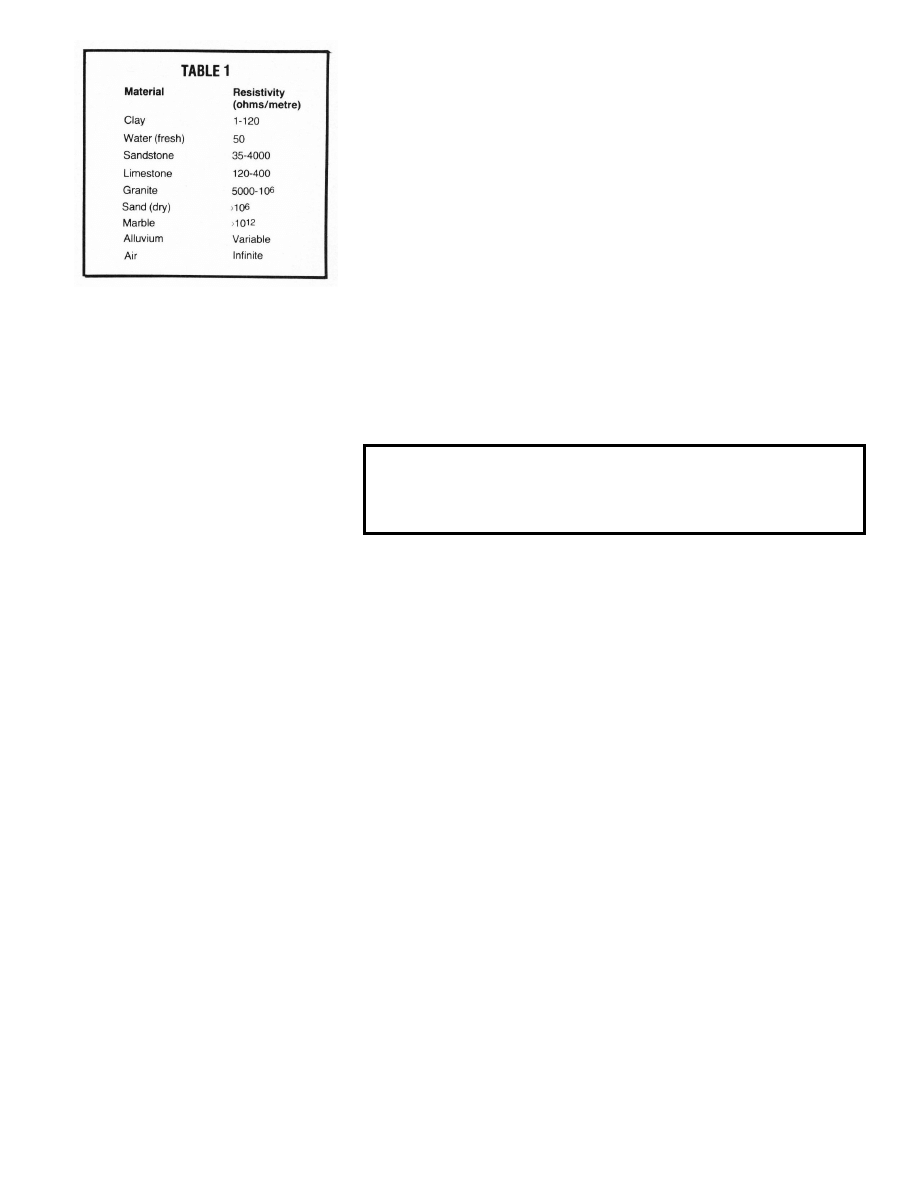
We can determine the depth ‘d’ with
the aid of ‘standard curves’. The proce-
dure is to measure the resistivity of the
ground each time the electrode separa-
tion ‘a’ is increased about a central
point. To use the standard curves pro-
vided it is necessary to plot the
measured resistivity (p) on the vertical
axis, against the electrode separation
distance on log/log graph paper.
The standard curves provided (Figure
4), are also constructed on log/log graph
paper i.e: graph paper that is ruled in
both directions at logarithmic intervals.
Each major division on the paper corre-
sponds to a power of 10 and is therefore
called a decade. We suggest that for
plotting your data you purchase
semi-transparent paper that has three
decades on either axis and a decade sep-
aration of 2½ inches. The 2½ inch
decade separation is most important as
Geotech
Page 3
ETI:
H
o
w
To
Bu
il
d
G
o
ld
& Treas
ur
e D
et
ect
o
rs
, 19
81
—
C
o
p
y
ri
gh
t
©
Mur
ray/
M
od
ern
Magazi
nes
, rep
rod
uce f
o
r p
ers
onal
u
se
onl
y
paper having other decade separations
will not allow your plotted results to be
overlaid on the standard curves. This
paper should be readily available from
major stationary suppliers such as John
Sands or Dymocks.
Figure 5 shows a typical plot of field
data overlaid onto the standard curve.
To do this, place your plotted curve
over the standard curve and slide it hori-
zontally until you find the standard
curve that best matches your plotted
curve.
When the best matching curve has
been found, note where the vertical axis
of the standard curve intersects the ‘ab’
curve of your plotted data. This line
extended vertically downwards to inter-
sect the ‘electrode separation’ axis of
your plotted data will show the depth of
the first layer — in our example this is
4.25 metres.
We know from our plotted data that
the resistivity p2 is about 1000 ohms/
metre and the standard curve that is a
best match shows a p2/p1 ratio of one
tenth, that is p2 equals 0.1 p1.
Thus p2 is approximately 100 ohms/
metre. Relating these figures to Table 1
we see that the most likely strata forma-
tion is two layers of sandstone of
different densities or a top layer of
sandstone and a lower layer of
limestone.
From the section bc it is possible to
calculate the resistivity and depth of the
Geotech
Page 4
ETI:
H
o
w
To
Bu
il
d
G
o
ld
& Treas
ur
e D
et
ect
o
rs
, 19
81
—
C
o
p
y
ri
gh
t
©
Mur
ray/
M
od
ern
Magazi
nes
, rep
rod
uce f
o
r p
ers
onal
u
se
onl
y
second layer but this requires the use of
a second set of auxiliary standard
curves. These are very complex and
beyond the scope of this article. Simi-
larly section cd provides data on the
third layer and so on. There are a num-
ber of standard texts on such
measurement and the interested experi-
menter should refer to these for further
information.
Resistivity trenching
Another common application of the
resistivity meter is in searching for bur-
ied objects such as large water mains,
buried stream beds or underground sew-
erage tunnels. The method used is
simply to decide approximately at what
depth the object is likely to be found,
and divide the distance by 0.6 to give a
suitable electrode separation. Maintain-
ing this same separation, the array of all
four electrodes should be progressively
moved in a line over the ground being
explored. Readings of resistivity should
be made at each point and the value
plotted against distance moved. (See
Figure 6 in our feature on Exploration
Archaeology). The distance between
each reading point should be no greater
than half the dimension of the object to
be located; in fact the closer the read-
ings are taken, the greater will be the
resolution.
If it is desired to follow the depth of
bedrock beneath the surface, it is best to
first carry out a vertical depth sounding
to locate the bedrock. Then divide this
depth by 0.6 to give the most suitable
electrode separation. The depth sound
will also tell you whether the bedrock
has a higher or lower resistivity (from
the ratio p2/p1). If p2 is greater than p1
then an increase in your measured resis-
tivity will tell you that the basement is
getting shallower and vice versa. Alter-
natively, if p2 is less than p1 an increase
in resistivity will indicate that the base-
ment is becoming deeper. This method
is most suitable for looking for alluvial
gold or heavy gemstones which tend to
be concentrated in the hollows of the
bedrock along alluvial creekbeds.
Earth electrodes should not be inserted into the ground to a depth greater than one-
twentieth of the probe separation. Because of this, poor electrode/ground contact
may result at close spacings. This problem can be reduced by using porous pots
filled with copper sulphate solution. Electrodes specifically intended for such work
are available from geophysical supply houses.
Wyszukiwarka
Podobne podstrony:
earth resistivity meter part 1b [robert beck]
John Stanley (1712 1786) Voluntary op 7 nr1 MB
John Stanley (1712 1786) Voluntary op 5 nr 6 MB
Trumpet Voluntary by John Stanley
John Stanley Martin From Godan to Wotan
John Stanley (1712 1786) Allegro op 5 no1 MB
John Stanley (1712 1786) Voluntary op 7 nr 7 MB
John Stanley (1712 1786) Voluntary op 6 nr9 MB
Eurocode 8 Part 1 1998 2004 Design of Structures for Earthquake Resistance General Rules Seism
Eurocode 8 Part 5 1998 2004 Design of Structures for Earthquake Resistance Foundations, Retaini
Eurocode 8 Part 4 1998 2006 Design of tructures for Earthquake Resistance Silos, Tanks and Pipe
Eurocode 8 Part 6 1998 2005 Design of Structures for Earthquake Resistance Towers, Masts and Ch
Eurocode 8 Part 5 1998 2004 Design of Structures for Earthquake Resistance Foundations, Retaini
Eurocode 8 Part 6 1998 2005 Design of Structures for Earthquake Resistance Towers, Masts and Ch
GbpUsd analysis for July 06 Part 1
~$Production Of Speech Part 2
20 H16 POST TRANSFUSION COMPLICATIONS KD 1st part PL
Discussions A Z Intermediate handout part 1
part 20
więcej podobnych podstron