
What is typical for call centre jobs? Job
characteristics, and service interactions in different
call centres
Dieter Zapf, Amela Isic, Myriam Bechtoldt, and Patricia Blau
J. W. Goethe University Frankfurt, Germany
Call centres have been one of the few booming branches in recent years. The
main task of call centre operators is to interact with customers by telephone,
usually supported by computer systems. It has been argued that call centre
work is a modern form of ‘‘Taylorism’’, because it is characterized by routine
tasks, and low level of control for the employees. Moreover, it has been
suggested that there is a high level of stress at work, both with regard to the
work tasks and to the interactions with customers. In the present study a
sample of 375 call centre employees from eight different call centres was
compared with a sample of noncall centre workers (N = 405) in terms of job
characteristics, job stressors, and emotional labour (emotion work). The
results showed that call centre workers had worse job characteristics, but were
better off with regard to most job stressors compared to representative
comparison groups of no-service workers, service workers, and workers in
human services respectively. Moreover, compared to the other groups,
customer service representatives (CSRs) had to express less negative emotions,
but were most frequently exposed to states of emotional dissonance. A
comparison of the working conditions of the eight call centres revealed that in
most call centres the working conditions could be substantially improved. In
addition, various call centre parameters such as inbound vs. outbound, or
inhouse vs. external service centres were examined. The strongest effects were
found for the percentage of time spent on the telephone. With some
exceptions, the results support the view that the majority of call centres have
been established to organize mass service for customers, that the work in the
#
2003 Psychology Press Ltd
http://www.tandf.co.uk/journals/pp/1359432X.html
DOI: 10.1080/13594320344000183
Correspondence should be addressed to D. Zapf, Department of Psychology, Johann
Wolfgang Goethe-University Frankfurt, Mertonstr. 17, D-60054 Frankfurt, Germany. Email:
D.Zapf@psych.uni-frankfurt.de
An earlier version of this article was presented as a poster at the 25th International Congress
of Applied Psychology, 7 – 12 July 2002, Singapore. The present study was supported by the
German Federal Ministry of Work and Social Affairs. Overall coordination of participating
projects: Verwaltungsberufsgenossenschaft VBG. Project organization of the present study:
Rationalisierungskuratorium der Deutschen Wirtschaft RKW, Eschborn. The support of the
project organizers is gratefully acknowledged.
EUROPEAN JOURNAL OF WORK AND ORGANIZATIONAL PSYCHOLOGY,
2003, 12 (4), 311–340

call centres is characterized by routine work and low task control, and that call
centre employees are required to suggest a ‘‘friendly smile’’ when they are on
the phone.
No prospering without customers—a fact of prominent importance for
service-oriented economies worldwide. Competing for customers has
inspired companies to invent new ways of service. One of these ways is a
call centre. As the name suggests, call centres are offices assigned to
telephonic contact with customers. An official definition says: Call centres
are ‘‘tools for organising communication with customers . . . with the help of
telecommunication’’ (Henn, Kruse, & Strawe, 1996, p. 14).
Call centres may either be part of the company (‘‘inhouse’’ call centres) or
be external services (‘‘service bureaux’’) usually working on behalf of several
companies. The ways call centres get in contact with customers may differ.
Whereas inbound call centres are restricted to a passive role (i.e., being
called up exclusively by customers having any questions or complaints
concerning a product), outbound call centres actively engage in phoning
people up, e.g., telemarketing call centres. However, there are also call
centres with both inbound and outbound activities. Basically, with the help
of call centres companies aim to demonstrate their customer orientation,
and try to ensure their clients’ satisfaction and commitment. From the
companies’ point of view, the advantages are manifold: lower costs in the
area of field work because even sophisticated services may be rendered by
phone; more satisfied customers because, ideally, the call centre can be
contacted 7 days a week, 24 hours a day (Henn et al., 1996; Holman, 2003).
To do his job, the customer service representative (CSR) of a call centre
usually sits at a table in front of a computer, wearing a headset for
communicating with the customer, leaving his/her hands free in order to
input data into the computer if necessary. Depending on the business, a
CSR talks to between 60 and 250 clients per 8 hour shift (Dieckhoff,
Freigang-Bauer, Schro¨ter, & Viereck, 2002; Henn et al., 1996). The more
customers are talked to, the less time is available for each of them and the
more routine (and boring) these conversations may become for the CSR.
The high rate of turnover and absenteeism in many call centres suggests
that working in call centres is a stressful experience (e.g., Baumgart et al.,
2002; Deery, Iverson, & Walsh, 2002; Holman, 2002, 2003). Although some
studies seem to suggest that working in call centres can be interesting (Batt,
2002), there are still too few studies to give a definite answer here. Therefore,
it is interesting to analyse the profile of CSRs’ jobs from a work psychology
point of view.
Recent studies suggest that most jobs in call centres can be characterized
as unskilled work, which some authors (e.g., Knights & McCabe, 1998)
called an advanced form of Taylorism (see also Dieckhoff et al., 2002).
312
ZAPF ET AL.

Relatively short-cycle routine interactions with customers mostly controlled
by automatic call distribution systems and supported by networked
information technologies allow little control of when and whom to speak
to (e.g., Holman, 2003). Moreover, CSRs are expected to be always friendly
(as if they are ‘‘smiling’’) on the telephone (Holman, 2003; Schuler, 2000)—a
fact described in literature as imposing emotional demands on the CSRs.
Thus the main research question of this article is: Can call centres be
characterized as low skilled routine jobs with little control, high job
stressors, and high emotional demands to be customer-friendly due to
organizational rules?
Several studies (e.g., Richter & Schulze, 2001; Wieland, Metz, & Richter,
2001) showed that CSRs have low levels of job control. Isic, Dormann, and
Zapf (1999) compared the working conditions of 250 call centre employees
to those in banks and administrative offices. While call centres did not stand
out in terms of job stressors such as uncertainty, organizational problems,
and time pressure, they were distinguished by very low task control and
timing control. According to that, CSRs suffered significantly more from
psychosomatic complaints than employees in banks and administrative
offices. Gerlmaier, Bo¨cker, and Kastner (2001), and Richter and Schulze
(2001) reported similar results. Metz, Rothe, and Degener (2001) analysed
37 CSR jobs with the help of experts. The experts criticized the poor decision
latitude as well as the low complexity and high division of the work: CSRs
continuously had to repeat the same activities thereby scarcely having the
opportunity to make use of their professional know-how. Most call centre
employees working in the front office do not complete a professional
training for their telephone work (Baumgart et al., 2002; Isic et al., 1999).
Therefore, to prevent inexperienced CSRs from making mistakes, complex-
ity of work is often massively restricted. For example, with the help of
standardized computer programs, employees in call centres of banks book
orders for bonds even without any comprehensive knowledge of the matter
(cf. Holman, 2003; Holman, Chissic, & Totterdell, 2002). More complicated
enquiries are diverted to the few specialists who work in the back office
(Henn et al., 1996).
Following Bowen and Schneider (1988) and Batt (2002), Holman (2003)
differentiated between two call centre models: the ‘‘mass service’’ and the
‘‘high commitment service’’ model. The mass service model aims at a high
market volume and low added value. Cost minimization is the primary goal
here. The jobs are characterized by routine work (low complexity) and low
control. Employees are often required to follow a scripted dialogue when
interacting with customers and follow highly detailed instructions (Deery et
al., 2002). Frenkel, Tam, Korczynski, and Shire (1998) argued that despite
the rhetoric of service quality, management appears to place a greater
emphasis on the quantity of calls, thus showing preference for the mass
TYPICAL CHARACTERISTICS OF CALL CENTRE JOBS
313

service model (see also Dieckhoff et al., 2002). This contrasts the high
commitment service. In this case, the market volume is low but the added
value is high. Jobs are empowered, i.e., tasks are complex and there is high
control for the service providers. The interactions with customers
correspond to the relationship model (see below). Moreover, there are
human resource incentives such as ongoing investment in training, employ-
ment security and relatively high pay (Batt, 2002).
In this study we compare employees from several call centres with a
representative sample of employees not working in call centres. This
sample consisted of three groups: employees doing manufacturing or
administrative work (the ‘‘no-service group’’), people working in the
service sector (e.g., sales or banks), and people working in the human
services (e.g., nurses). In order to analyse typical profiles of call centre
work, we first analysed whether call centre work is specific in the way
that it differs significantly from the three groups of the representative
sample (Hypothesis 1). Based on the existing studies cited above we
expected most call centres to follow the mass service model, i.e., jobs will
be characterized by lower complexity and control (task and timing
control,
participation)
in
comparison
to
the
comparison
samples
(Hypothesis 1a). Moreover, in these types of call centres employees are
supposed to handle as many call as possible. This is assumed to lead to
high time pressure and requiring considerable attention and concentra-
tion. Therefore it was hypothesized that call centre jobs are characterized
by
higher
task-related
and
organizational
job
stressors
than
the
comparison samples (Hypothesis 1b).
So far, we have discussed organizational and task aspects of call centre
jobs focusing on cognitive aspects of internal information processing.
Another aspect is the CSRs’ social interaction with the customer. As in any
social interaction, the regulation of emotions plays a central role here.
Hochschild (1983) coined the term ‘‘emotional labour’’ for this kind of job
requirement occurring in service interactions. Emotional labour or emotion
work (Zapf, 2002) refers to the quality of interactions between employees
and clients. ‘‘Client’’ refers to any person who interacts with an employee,
for example, patients, children, customers, passengers, or guests. Expressing
appropriate emotions during face-to-face or voice-to-voice interactions is a
job demand for many employees in the service industry, particularly in call
centre jobs. Hochschild drew upon the work of Goffman (1959) to argue
that while interacting, people nearly always tend to play roles and try to
create certain impressions. Impressions include the display of normatively
appropriate emotions following certain display rules. This general social
phenomenon also applies to interactions between CSRs and their customers
or clients. Certainly, CSRs cannot be assumed to be always in a good mood.
Rather, they frequently encounter situations where anger is likely to be the
314
ZAPF ET AL.

dominant emotion (Deery et al., 2002; Grandey, Dickter, & Sin, 2002).
Emotion work as part of the job, however, implies the display of
organizationally desired emotions even in such unpleasant situations.
Accordingly, emotion work can be defined as the psychological processes
necessary to regulate organizationally desired emotions as part of one’s job
(Grandey, 2000; Zapf, 2002).
In the service sector, customer orientation is a label for such norms, rules,
and standards of behaviour in service interactions that require to regulate
emotions (Zeithaml & Bitner, 2000). In the case of a call centre where
employees interact with customers by telephone, there may be rules such as:
talking to customers should not exceed 5 minutes; customers should be
addressed by their names; or customers should be talked to in a friendly tone
throughout the interaction which means to display certain (usually positive)
emotions towards clients.
Recent studies have differentiated various dimensions of emotion work.
Most of them comprise the frequency of emotion expression and emotional
dissonance (e.g., Brotheridge & Grandey, 2002; Bu¨ssing & Glaser, 1999;
Grandey, 2000; Morris & Feldman, 1996; Schaubroeck & Jones, 2000). This
also applies to the concept used in the present study. Zapf, Vogt, Seifert,
Mertini, and Isic (1999) differentiated the following aspects of emotion
work: (1) the requirement to display positive emotions (abbreviated as
‘‘positive emotions’’), (2) the requirement to display and handle negative
emotions, which also implies a high variety of emotions (‘‘negative
emotions’’), (3) the requirement to sense the interaction partner’s emotions
(‘‘sensitivity requirements’’), and (4) the dissonance between felt and
displayed emotions (‘‘emotional dissonance’’).
In line with most empirical studies (e.g., Adelmann, 1995; Brotheridge &
Lee, 2003; Morris & Feldman, 1997) the frequency of emotional display is
considered to be an important aspect of emotion work. Factor analyses
(Zapf et al., 1999) demonstrated the necessity of distinguishing between
showing positive and showing negative emotions. Having to display positive
and negative emotions usually implies demonstrating a high variety of
emotions because positive emotions have to be shown in most of the jobs.
Therefore, the requirement to display negative emotions comes close to the
concept of variety of emotion display suggested by Morris and Feldman
(1996).
The expression of organizationally desired emotions is not an end in
itself. Emotions are shown to have an influence on clients (Kruml & Geddes,
2000). Expressing emotions is one possible way to influence the clients’
emotions. To be able to do so, their accurate perception is an important
prerequisite. Therefore, sensitivity requirements as the necessity to be
sensitive and to consider the clients’ emotions is another aspect of the
emotion work concept (Zapf et al., 1999).
TYPICAL CHARACTERISTICS OF CALL CENTRE JOBS
315

Finally, as most of the other studies of emotion work, we included the
concept of emotional dissonance (e.g., Brotheridge & Lee, 2003; Bu¨ssing &
Glaser, 1999; Kruml & Geddes, 2000; Morris & Feldman, 1996, 1997;
Nerdinger & Ro¨per, 1999; Zapf et al., 1999). Emotional dissonance occurs
when an employee is required to express emotions that are not genuinely felt
in the particular situation. A person may feel neutral while required to
display a particular emotion, or alternatively the display rule may require
the suppression of undesired emotions and the expression of neutrality or a
positive emotion instead of a negative one. Studies on emotional dissonance
consistently found correlations with emotional exhaustion (e.g., Morris &
Feldman, 1997; Nerdinger & Ro¨per, 1999; Schaubroeck & Jones, 2000).
Based on Gutek (1997), Holman (2003) classified customer – employee
interactions in call centres as ‘‘relationships’’ and ‘‘encounters’’. Encounters
involve single short interactions between strangers and are standardized
with little room for authentic emotional expression. Contrary to that,
persons in relationships know each other and share a common history. Trust
and loyalty are important elements of these relationships. Applying the
concept of emotion work, it can be assumed that the expression of positive
emotions (the friendly ‘‘smile’’) is the predominant requirement in the
encounter. Since encounters involve short interactions between strangers
having no shared history in common, requirements to express negative
emotions are unlikely. Of course, both interaction partners may have
negative feelings; for example, the CSR might feel impatient, the customer
dissatisfied or angry at the quality of service. However, the CSR is always
expected to react in a positive manner and to ‘‘appear happy, nice and glad
to serve the customer’’ (Erickson & Wharton, 1997, p. 188). This may lead
to a high level of emotional dissonance, which is the discrepancy between
expressed and felt emotions. Gutek (1997) argued that relationships serve as
a model for encounters because of their positive features and that
organizations try to emulate some of the qualities of relationships by
developing ‘‘pseudo-relationships’’. By showing interest and concern, CSRs
may create the impression of a trusting relationship to customize the service.
This may be supported by customer-relationship systems that track
customers’ interaction with the organization (Holman, 2003) and provide
information about the customers’ service histories and their needs. Thus
there may be relatively high requirements to be sensitive to the needs and
emotions of customers compared to what one would normally expect from
impersonal short-cycle encounters.
With regard to our study we expected that most call centres follow the
encounter model implying a high requirement to express positive emotions
(Hypothesis 1c), but a low requirement to express negative emotions
(Hypothesis 1d). Expectations for sensitivity requirements were unclear;
however, emotional dissonance was expected to be high (Hypothesis 1e).
316
ZAPF ET AL.

The reason for this is that in the encounter model the interaction is only
superficial and comprises just a few cues to elicit the expected positive
emotion. The room for authenticity is assumed to be limited in these
interactions, i.e., adequate negative emotion may hardly be expressed. Being
strictly required to show positive emotions in situations where one would
normally show negative ones leads to emotional dissonance.
Moreover, to further analyse what is typical for call centres, we were
interested in comparing the various call centres under study. Although it is
likely that most of the call centres follow the mass service model, there may
be some call centres following the customer relationship service model or
some hybrid model. Therefore, we expected diversity among the call centres
with regard to complexity and control. That is, although the majority of call
centres may be characterized by unskilled work, there may be a few call
centres with complex tasks and high control (Hypothesis 2a). Moreover, we
expected no or only minor differences among the call centres with regard to
the emotion work variables because the various call centres claimed to have
similar degrees of customer orientation and numbers of CSR – customer
interactions (Hypothesis 2b).
We were also interested in explaining the differences among the call
centres. Therefore we looked at various organizational variables that were
hypothesized to cause such differences. We compared inhouse call centres vs.
service bureaux, providing simple information vs. simple counselling vs.
complex counselling, percentage of frontline work, inbound vs. outbound
vs. both, leadership responsibilities, mean call time, and number of
customers per hour as covariates. If these covariates reduced the variance
between the call centres then the differences could be mainly attributed to
these variables.
Finally, we were interested to compare call centre jobs with regard to the
organizational call centre variables. First, we expected differences between
inhouse call centres and service bureaux. We assumed inhouse CSRs to be
better off while they could have the opportunity to combine telephone work
with other, more challenging, work. In service bureaux such work might
often be not available. Apart from that, the CSRs may have worked in other
departments of the organization and may, therefore, be familiar with a
variety of these tasks. Service bureaux usually work for different clients,
which would probably not be effective if the tasks they take over are very
complex, because that would require high training efforts. Therefore,
complexity and control should be higher in inhouse call centres compared to
service bureaux (Hypothesis 3a). Moreover, the studies of Bongard and
al’Absi (2003) suggest that emotional display rules are less rigid the more
familiar the situation is. Therefore, we expected that service bureaux were
more rigid with regard to their display rules, whereas CSRs dealing with
customers of their own company may be allowed to be somewhat more
TYPICAL CHARACTERISTICS OF CALL CENTRE JOBS
317

authentic. This usually implies that they are allowed to express negative
emotions in certain situations, e.g., if the customer shows negative
behaviours. Agents in service bureaux, in contrast, are required to express
positive emotions even in such situations. Therefore, we expected that the
requirement to express negative emotions was higher in inhouse call centres
compared to service bureaux (Hypothesis 3b). As a consequence emotional
dissonance was expected to be higher in service bureaux (Hypothesis 3c).
The nature of the tasks in the call centre is believed to affect the working
conditions of the CSRs. CSRs whose main task is to pass on simple
information and to book orders as well as to do simple counselling were
expected to have jobs of low complexity and control (Hypothesis 4a).
However, they were also expected to have less job stressors, because it is a
typical finding that high task complexity goes along with more job stressors
(e.g., Dormann, Zapf, & Isic, 2002; Zapf, 1993, Zapf et al., in press)
(Hypothesis 4b). Also as for inhouse call centres we expected less strict
display rules and more possibilities to be authentic for CSRs with complex
counselling tasks. Displaying of negative emotions was, therefore, expected
to be higher for CSRs with complex counselling tasks (Hypothesis 4c) and
emotional dissonance was expected to be lower (Hypothesis 4d).
We also compared participants with leadership responsibilities (team
leaders) vs. CSRs who had no leadership role. Team leaders were expected
to be confronted with more complex tasks and to have more control
(Hypothesis 5a). In addition, we also expected that they would be more
exposed to job stressors, since they were supposed to be in charge for all the
unusual tasks that lack clear procedures how to be handled and that are
unpredictable with respect to outcomes and time required (Hypothesis 5b).
Because team leaders were hypothesized to have more other tasks than
interacting with customers, they were supposed to be less involved in
emotion work (Hypothesis 5c).
Next, we asked for the percentage of telephone work (frontline work in
comparison to backstage work). In the study by Metz et al. (2001), working
conditions in the back office were rated more favourably because people
working there are dealing with specialist, administrative, and managerial
tasks that are much more challenging and less restricted. These employees
do not interact with customers, so they are not directly controlled by them.
Consequently they had more timing and task control and the tasks were in
average more complex. Also people in the back office are believed to have
more control because the affairs they are dealing with can hardly be
managed within a few minutes—the time employees in the front office have
available. Similar results were reported by Baumgart et al. (2002). Therefore,
we hypothesized that less telephone work should imply higher complexity
and control (Hypothesis 6a). With less interactions with customers, there
should be less emotion work, too (Hypothesis 6b).
318
ZAPF ET AL.

Finally, we also compared inbound and outbound activities. In the
inbound service customers are making the call, which means that the CSRs
are in control neither of time nor action (timing control and task control, see
Method section)—they have no choice but to accept the call. We, therefore,
expected that inbound activities would be characterized by the lowest job
control (Hypothesis 7).
METHOD
Sample
A sample of employees working in different call centres was compared
with a random sample of employees of two German cities. A variety of
call centres were contacted, e.g., both inhouse call centres and external
service bureaux, call centres with inbound and outbound activities, etc.
The majority of the call centre sample was located in Hessen (a federal
state of Germany). In total, nine call centres agreed to take part in this
study. From the 506 questionnaires that were distributed, 375 ques-
tionnaires were returned. The response rate was 71%. From one call
centre only very few questionnaires were returned; this call centre was left
out of the comparison of call centres. The data was included in other
analyses. Eight call centres, representing different types of call centres,
could therefore be compared. Participation was voluntary and anonymity
was guaranteed. Two thirds of the sample (66.8%) was women. Mean
age was 31.9 years, ranging from 18 to 59 years. There were 44.1% who
had some kind of high school degree, 37.3% who had attended modern
secondary school (middle stream school-leaving certificate), and 16.6%
having a lower stream school-leaving certificate. Only 8% were in
possession of some kind of university degree. There were 59.6% persons
reporting to have completed a professional training, while 25.4% had
not. However, more than half (50.9%) of the persons with professional
training had no specific training concerning working in call centres.
Instead, they had changed their vocation and started working as CSRs
without special experience. On average, persons had more than 5 years
but no longer than 10 years work experience, but they had not been
employed for longer than 6 – 12 months by their current call centre at the
time of study.
The jobs of the call centre employees consisted of providing information
on the phone (33.2%) or simple counselling (46%); 19.5% were specialists
responsible for complex counselling. Eighty-five per cent of the persons
worked as CSRs without leadership responsibilities, 10.5% were head of a
team. Sixty-six per cent of the sample worked in service bureaux, the rest in
inhouse call centres. More than half (54.8%) of the persons did inbound
TYPICAL CHARACTERISTICS OF CALL CENTRE JOBS
319

calls only, 12.3% outbound calls only, and 32.6% were engaged in both.
Call centre 1 was a telemarketing call centre with outbound activities only.
In Call centres 4 and 6, only inbound activities were carried out, whereas all
the other call centres combined both inbound and outbound activities. Call
centres 2, 5, and 6 were inhouse call centres; the others were external service
bureaux. On average the participants reported a single call to last between 3
and 5 minutes (range: 1 to more than 15 minutes). Per hour, they talked to
6 – 10 clients, ranging from 1 to more than 20.
The comparison sample was a random sample of persons from two large
German cities who worked for at least 30 hours a week, who were not self-
employed, and whose German was reasonably good so that they were able
to fill in the questionnaire. Participants were randomly chosen from a citizen
database. They received a letter inviting them to participate. After some
days the potential participants were contacted by telephone. Many people
were excluded because they did not fulfil the criteria mentioned above. We
contacted 767 persons who met the criteria for participation, and 405
persons returned the questionnaire (anonymously), which corresponds to a
response rate of 52.8%. This estimation is the lower bound of the response
rate, because among the 767 persons contacted some refused to take part in
the study and finished the telephone call before the researchers received all
information to decide whether the person would have fulfilled all criteria to
participate.
The mean age of the control sample was 40.9 years, ranging from 19 to 73
years; 37.8% were women. There were 55.9% who had some kind of high
school degree, 23% who had attended modern secondary school, and 19.8%
had a lower stream school-leaving certificate. Few (1.8%) had no certificate
at all, and 35.6% had some kind of university degree. Seventy-nine per cent
of the persons reported to have completed a professional training relevant
for their current job. On average (median category), persons had worked for
15 – 20 years, of which 2 – 5 years were in their current job.
For some of the analyses the comparison sample was divided into
subsamples: service employees not working in the service sector (N = 217,
e.g., manufacturing, repair, administrative work), employees working in the
service sector (N = 131, e.g., sales, banks, insurance, transportation, hotels
and restaurants), and human service workers (N = 52, e.g., nurses,
physicians, teachers, social workers).
Instruments
The items used in the present study were part of a more wide-ranging
questionnaire. Time to fill in the whole questionnaire took from 45 to 90
minutes. The Instrument of Stress Oriented Job-Analysis (ISTA 6.0;
Semmer, Zapf, & Dunckel, 1995, 1998, 1999) was used to examine
320
ZAPF ET AL.

differences concerning complexity, control, and job stressors. All ISTA
scales, except the one measuring ‘‘participation’’, consisted of five items and
used various response formats ranging from 1 to 5, with 1 = ‘‘very seldom/
never’’ to 5 = ‘‘very often’’. Some items required a response on a 5-point
scale that ranged from 1 = ‘‘very few’’ to 5 = ‘‘very much’’. For some items
we used the ‘‘A vs. B’’-format (e.g., ‘‘‘A’ has documents and information
that are always correct and up to date—‘B’ has documents and information
that are often incomplete and out of date. What is your job like?’’). Items
using the ‘‘A vs. B’’ format required a response on a 5-point scale from
1 = ‘‘exactly like ‘A’’’ to 5 = ‘‘exactly like ‘B’’’. The aspects considered were
as follows.
Complexity
.
This assessed the complexity of decisions and planning
processes required to fulfil the task, how often difficult tasks have to be
accomplished, and if the job offers the chance for enlarging one’s
professional know-how. An example item is: ‘‘Colleague A has to plan in
detail how the task can be solved. Colleague B’s tasks do not require any
planning processes. Which job is more similar to yours?’’
Task control
.
This referred to the number and kind of decision
possibilities concerning the tasks (e.g., ‘‘Is it possible in your job to make
one’s own decisions how to carry out the tasks?’’).
Timing control
.
This referred to decision possibilities with regard to time
aspects of the task, for example, if the person is allowed to choose his or her
own pace and take a break when feeling for it (e.g., ‘‘To what extent can you
decide how long to work on a certain task?’’).
Participation
.
This referred to more general decision possibilities with
regard to planning vacations or shifts, employing new staff, or composition
of the team. The scale consisted of seven items and asked to what extent the
person may take part in these decisions.
Organizational problems
.
This asked about problems in the work
organization that typically cause additional effort to perform the tasks
(e.g., ‘‘‘A’ has to use tricks to be able to fulfil his/her work. ‘B’ is equipped in
such a way that he/she can manage without additional effort. Which job is
similar to yours?’’). This scale bears resemblance to the constraints scale of
Spector and Jex (1998).
Uncertainty
.
This aimed at unclear or contradictory goals, conditions,
or outcomes of actions and included contradictory or unclear external tasks
of the organization (e.g., ‘‘How often do you get contradictory orders?’’).
TYPICAL CHARACTERISTICS OF CALL CENTRE JOBS
321

Time pressure
.
This described quantitative aspects of the job and
referred to problems caused by speed and quantity of information
processing so that tasks cannot be executed within a given time frame
(e.g., ‘‘How often do you have to work during your break because there is so
much work?’’).
Concentration demands
.
This referred to the problem of informational
overload of the working memory during action execution. In this case, too
much concurrent information is required to be available in the working
memory to accomplish the task (e.g., ‘‘Do you have to make mental notes of
things that are difficult to remember (number of units, names, addresses,
codes, file names, folders, etc.)?’’).
Cooperation demands
.
The necessity of cooperating with other persons
to accomplish one’s tasks may cause stress if these persons cannot be relied
on. This is why proximity of cooperation was considered to be a potential
job stressor. The scale asked if one’s process of work is hindered by
colleagues or team members.
Emotion work or emotional labour
.
This was measured using the
Frankfurt Emotion Work Scales (FEWS 4.0; Zapf, Mertini, Seifert, Vogt,
Isic, & Fischbach, 2000; Zapf et al., 1999). Response formats corresponded
to those of the ISTA instrument.
Positive emotions
.
This scale referred to the requirement to display
pleasant emotions (e.g., ‘‘In your job how often does it occur that you have
to display pleasant emotions towards your clients?’’).
Negative emotions
.
This asked for the necessity of displaying and
dealing with unpleasant emotions (e.g., ‘‘How often does it occur in your job
that you have to display unpleasant emotions towards your clients?’’).
Sensitivity requirements
.
This examined whether empathy or knowledge
about clients’ current feelings are required by the job (e.g., ‘‘Does your job
require paying attention to the feelings of your clients?’’).
Emotional dissonance
.
This referred to the display of unfelt emotions
and to the suppression of felt but (from an organizational perspective)
undesired emotions (e.g., ‘‘How often does it occur in your job that one has
to display positive emotions that do not correspond to what you feel in this
situation?’’)
Moreover, we used single items to measure characteristics of the call
centres. We asked whether the participants worked in inhouse call centres or
322
ZAPF ET AL.

in service bureaux, whether they worked inbound, outbound, or both,
whether their main task was to give information or to do simple order
bookings, simple counselling, or complex counselling, whether they had
managerial responsibility, and the percentage of time spent at the telephone.
Means and standard deviations of the above-mentioned scales are presented
in Table 1; the intercorrelations are presented in Table 2.
RESULTS
First, we analysed whether the overall call centre sample significantly
differed from the three groups of the comparison sample. Corresponding
analyses are presented in Table 3. The call centre sample was characterized
by significantly less complexity, task control, timing control, and participa-
tion than all other groups. This result was in line with previous studies and
supported Hypothesis 1a. As far as job stressors are concerned, no
differences were found for ‘‘uncertainty’’. For all other job stressors, the
call centres scored better, although there was no significant difference with
the human services group regarding the ‘‘cooperation demands’’. Thus,
Hypothesis 1b that job stressors would be higher in call centres compared to
other organizations was rejected. Third, we investigated the emotion work
variables. Again, substantial differences occurred across groups. With
regard to the requirement to express positive emotions, all groups differed
TABLE 1
Psychometric data of study variables
No. of
Call centres
Comparison groups
items
Range
Mean
SD
Coeff.
a
M
SD
Coeff.
a
Age
1
18 – 73
31.91
10.40
—
40.86
11.21
—
Gender
1
1 – 2
1.33
0.47
—
1.62
0.49
—
Complexity
5
1 – 5
2.92
0.79
.71
3.67
0.77
.77
Task control
5
1 – 5
2.75
0.93
.78
3.68
0.76
.78
Timing control
5
1 – 5
2.75
0.89
.80
3.53
0.96
.81
Participation
7
1 – 5
2.51
0.74
.75
3.37
1.02
.82
Organizational problems
5
1 – 5
2.20
0.67
.72
2.48
0.75
.76
Uncertainty
5
1 – 5
2.27
0.68
.65
2.34
0.76
.71
Time pressure
5
1 – 5
2.69
0.89
.79
3.14
0.89
.84
Concentration demands
5
1 – 5
2.84
0.85
.70
3.21
0.82
.74
Cooperation demands
5
1 – 5
2.57
1.00
.84
2.97
0.99
.86
Positive emotions
3
1 – 5
3.34
0.77
.61
2.58
1.08
.79
Negative emotions
4
1 – 5
1.70
0.55
.65
2.42
0.89
.75
Sensitivity requirements
3
1 – 5
3.37
1.10
.87
2.73
1.29
.73
Emotional dissonance
5
1 – 5
3.42
0.86
.79
2.77
0.93
.85
Gender: female = 1, male = 2.
TYPICAL CHARACTERISTICS OF CALL CENTRE JOBS
323

TABLE 2
Intercorrelation of study variables
Age
Gender
Comp
Task C
Partic
Tim C
Org P
Uncert
Concen
Time P
Coop
Pos E
Neg E
Sens R
Em Dis
Age
—
.03
.06
.23**
.16**
.01
7.11*
7.25**
.06
.08
7.13**
.08
.03
.07
7.06
Gender
.07
—
.04
.06
.05
.06
.03
.10*
7.01
7.06
.11*
7.16**
.05
7.14** 7.11
Complexity
.09
.18**
(.78)
.41**
.40**
.25**
.12*
.16**
.42**
.46**
.28**
.21**
.22**
.27**
.12*
Task control
7.09
.06
.45**
(.85)
.55**
.54**
7.16** 7.26**
.13**
.14**
.03
.13**
.15**
.14**
7.02
Participation
7.12*
.14**
.27**
.49**
(.83)
.58**
7.14** 7.18**
.15**
.16**
.17**
.05
.07
.10
7.03
Timing control
7.05
.01
.32**
.59**
.50**
(.83)
7.19** 7.17** 7.11*
7.18**
.02
7.16** 7.07
.00
7.24**
Organizational problems
.01
.12*
.06
7.11*
7.10
7.11
(.75)
.50**
.30**
.28**
.25**
.15**
.14**
.17**
.18**
Uncertainty
7.07
.13*
.10
7.03
7.01
7.03
.41**
(.67)
.32**
.32**
.36**
.14**
.14**
.16**
.25**
Concentration demands
.12
.17**
.40**
.13*
.09
.12
.22**
.28**
(.73)
.57**
.29**
.36**
.34**
.38**
.34**
Time pressure
.15**
.17**
.40**
.05
.11*
.01
.25**
.23**
.52**
(.80)
.32**
.39**
.30**
.41**
.40**
Cooperation demands
.01
.01
.34**
.16**
.20**
.17**
.16**
.20**
.39**
.47**
(.86)
.13**
.20**
.19**
.17**
Positive emotions
7.04
7.11*
.07
7.03
7.15** 7.10*
7.04
.02
.09
.15**
.01
(.77)
.55**
.60**
.55**
Negative emotions
7.11*
.10
.25**
.14**
7.01
.09
7.01
.04
.18**
.20**
.18**
.13*
(.72)
.45**
.41**
Sensitivity requirements
.00
.06
.18**
.06
.02
.08
.04
.12*
.23**
.27**
.18**
.49**
.19**
(.79)
.47**
Emotional dissonance
7.09
.05
.04
7.12
7.07
7.14**
.14**
.26**
.23**
.30**
.19**
.28**
.02
.46**
(.85)
Cronbach’s
a (total sample) = diagnonal (in parentheses); call centres (n = 375) = lower triangle; control groups (n = 405) = upper triangle;
*p
5 .05; **p 5 .01. Gender: female = 1, male = 2.
324

significantly from each other. They were lowest for the ‘‘no-service’’ group
followed by the service, call centre, and human service groups, thus partly
supporting Hypothesis 1c. The same result was found for sensitivity
requirements. In line with Hypothesis 1d, the call centre group was
significantly less required to express negative emotions than all other groups.
Finally, the ‘‘no-service’’ group experienced the least emotional dissonance,
whereas the call centre sample reported the highest emotional dissonance.
Although the call centre scores were not statistically different from the
human service group, this finding is in line with Hypothesis 1e.
Next, we compared the eight call centre samples with the comparison
samples (Figures 1 – 3). Differences were tested with analyses of variance
(with post hoc Bonferroni tests; see Table 4). As can be seen in Figure 1,
complexity and control were generally lower for call centres than for the
comparison groups. However, there were exceptions. Call centre 5, a
computer hotline for technical assistance, was comparable to the compar-
ison groups except for participation. In all, 11 of 28 possible mean
differences among the call centres were significant for complexity, 9 for task
control, 8 for timing control, and 2 for participation (cf. Table 4). Thus
Hypothesis 2a was partly supported.
With regard to job stressors, no significant differences were found for
‘‘uncertainty’’ (therefore not displayed in Figure 2). Two call centres differed
from the human service group with regard to organizational problems, but
not from the service group (Table 4 and Figure 2). Moreover, the eight call
TABLE 3
Comparison of the total call centre sample with comparison groups
Call
centres
No-service
group
Service
group
Human
service group
F
(df = 3)
Complexity
2, 92
a
3, 68
b
3, 61
b
3, 82
b
61, 09**
Task control
2, 74
a
3, 62
b
3, 73
b
3, 80
b
79, 16**
Timing control
2, 75
a
3, 66
b
3, 56
b
2, 94
a
55, 10**
Participation
2, 51
a
3, 46
c
3, 35
b,c
3, 06
b
61, 92**
Organizational problems
2, 20
a
2, 45
b
2, 44
b
2, 69
b
11, 53**
Uncertainty
2, 27
a
2, 32
a
2, 42
a
2, 23
a
1, 62
n.s.
Time pressure
2, 69
a
2, 99
b
3, 25
c
3, 52
c
23, 22**
Concentration demands
2, 84
a
3, 09
b
3, 28
b,c
3, 57
c
18, 54**
Cooperation demands
2, 57
a
2, 95
b
3, 02
b
2, 91
a,b
10, 32**
Positive emotions
3, 34
c
2, 16
a
2, 84
b
3, 71
d
102, 07**
Negative emotions
1, 70
a
2, 23
b
2, 37
b
3, 34
c
104, 35**
Sensitivity requirements
3, 37
c
2, 28
a
2, 88
b
4, 20
d
63, 56**
Emotional dissonance
3, 42
c
2, 45
a
3, 11
b
3, 26
c
59, 04**
**p
5 .01; n.s.: not significant; variance analyses with Bonferroni post hoc analyses; groups
with different letters are significantly different (p
5 .05).
TYPICAL CHARACTERISTICS OF CALL CENTRE JOBS
325
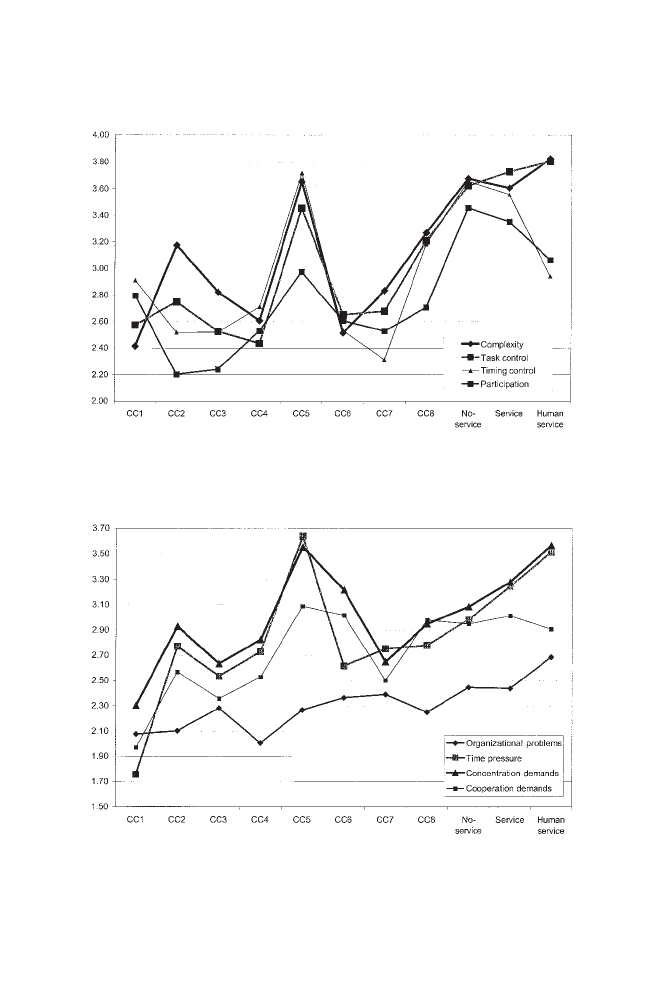
Figure 2.
Comparison of means of eight call centres and comparison groups of job stressors.
Figure 1.
Comparison of means of eight call centres and comparison groups of job
characteristics.
326
ZAPF ET AL.
centres were not significantly different from each other. In contrast, time
pressure was significantly lower in Call centre 1 (the only outbound call
centre) than in the other call centres and significantly higher in Call centre 5
than in the other call centres. In half of the call centres time pressure was
lower than in the service and human service group. Similar but less
pronounced results were found for concentration and cooperation demands.
In all, there were no significant differences among call centres for
uncertainty and organizational problems, but 12 significant differences for
time pressure, 7 for concentration demands and 5 for cooperation demands
(see Table 4: Group means with different letters are significantly different).
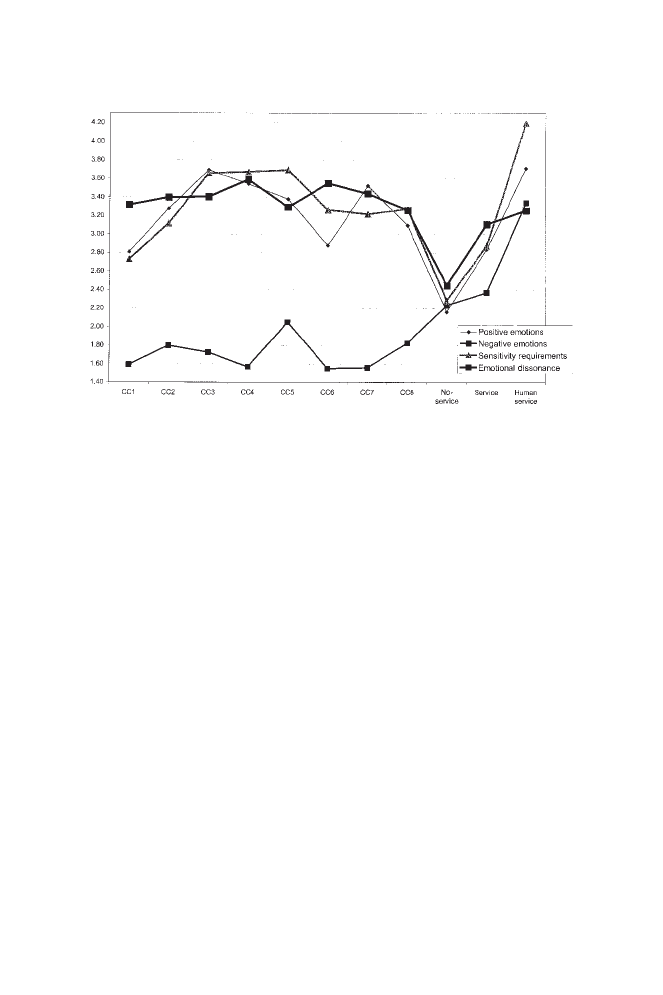
With regard to the emotion work variables (Figure 3) differences
occurred for the requirements to express positive emotions which might
be attributed to varying degrees of customer contacts. Similar results were
found for sensitivity requirements. In contrast, all call centres were
characterized by lower requirements to express negative emotions, whereas
they featured a higher level of emotional dissonance at the same time—
although not statistically different from the service and human service
group. Among the call centres, there were five significant differences for the
expression of positive emotions, and two for sensitivity requirements. No
significant differences were found for the expression of negative emotions
and emotional dissonance. Thus there was support for Hypothesis 2b only
with regard to negative emotions and emotional dissonance.
Figure 3.
Comparison of means of eight call centres and comparison groups of emotion work
variables.
TYPICAL CHARACTERISTICS OF CALL CENTRE JOBS
327

TABLE 4
Comparison of eight call centres with comparison groups
Call
centre
1
(
N = 32)
Call
centre
2
(
N = 59)
Call
centre
3
(
N = 75)
Call
centre
4
(
N = 57)
Call
centre
5
(
N = 27)
Call
centre
6
(
N = 23)
Call
centre
7
(
N = 43)
Call
centre
8
(
N = 44)
No
service
group
(
N = 217)
Service
group
(
N = 131)
Human
service
group
(
N = 52)
F
(df = 10)
Complexity
2, 42
a
3, 18
a,b
2, 82
a
2, 61
a
3, 65
c,d
2, 51
a
2, 83
a
3, 27
b
3, 68
c,d
3, 61
c,d
3, 82
d
27, 86**
Task control
2, 58
a
2, 75
a,b
2, 53
a
2, 44
a
3, 45
c,d
2, 65
a,b
2, 68
a,b
3, 21
b,c
3, 62
c,d
3, 73
d
3, 80
d
30, 84**
Timing control
2, 91
b
2, 52
a,b
2, 52
a,b
2, 71
b
3, 71
c,d
2, 53
a,b
2, 31
a
3, 18
b,c
3, 66
c,d
3, 56
c,d
2, 94
b
22, 21**
Participation
2, 80
a,b,c
2, 20
a
2, 24
a
2, 53
a,b
2, 97
b,c,d
2, 61
a,b
2, 53
a,b
2, 71
b
3, 46
d
3, 35
c,d
3, 06
b,c,d
25, 22**
Organizational
problems
2, 08
a,b
2, 10
a,b
2, 28
a,b,c
2, 08
a,b,c
2, 27
a,b,c
2, 37
a,b,c
2, 39
a,b,c
2, 25
a,b,c
2, 45
b,c
2, 44
b,c
2, 69
c
2, 73**
Uncertainty
2, 54
a
2, 08
a
2, 46
a
2, 01
a
2, 36
a
2, 48
a
2, 18
a
2, 15
a
2, 32
a
2, 42
a
2, 23
a
4, 51**
Time pressure
1, 76
a
2, 77
b,c
2, 54
b
2, 73
b
3, 64
e
2, 62
c,d
2, 76
c,d
2, 78
c,d
2, 99
c,d
3, 25
d,e
3, 52
e
10, 53**
Concentration demands
2, 30
a
2, 93
a,b,c
2, 63
a
2, 83
a,b
3, 56
b,c,d
3, 22
b,c,d
2, 65
b,c
2, 95
b,c
3, 09
b,c
3, 28
c,d
3, 57
d
15, 56**
Cooperation demands
1, 97
a
2, 57
a,b,c
2, 36
a,b
2, 53
a,b,c
3, 09
c
3, 02
b,c
2, 50
c
2, 98
c
2, 95
c
3, 02
c
2, 91
b,c
6, 77**
Positive emotions
2, 81
b
3, 28
c
3, 69
c
3, 54
c
3, 38
b,c
2, 88
b
3, 52
b
3, 10
b
2, 16
a
2, 84
b
3, 71
c
37, 06**
Negative emotions
1, 59
a
1, 80
a
1, 72
a
1, 57
a
2, 05
a,b
1, 55
a
1, 56
a
1, 82
a
2, 23
b
2, 37
b
3, 34
c
32, 35**
Sensitivity requirements
2, 73
b
3, 12
b
3, 66
b
3, 67
c
3, 69
c
3, 26
c
3, 22
b
3, 27
b
2, 28
a
2, 97
b
4, 19
c
22, 36**
Emotional dissonance
3, 32
b,c
3, 40
b,c
3, 41
b,c
3, 59
c
3, 29
b,c
3, 55
b,c
3, 44
b,c
3, 26
b,c
2, 45
a
3, 11
b
3, 26
b,c
17, 93**
**p
5 .01; variance analyses with Bonferroni post hoc analyses; groups with different letters are significantly different (p 5 .05).
328

Next we were interested in how far some of the organizational call centre
variables were able to explain the differences described in Figures 1 – 3. In
Table 5, results of covariance analyses with call centres as the independent
variable, stressors, resources, and emotion work as the dependent variables
and the organizational call centre variables as covariates are shown.
Z
2
refers
to the variance between call centres and
DZ
2
refers to the variance between
call centres after controlling for the organizational call centre variables
inhouse vs. external services, percentage of telephone work, leadership
responsibilities, task type, inbound vs. outbound, call time, and number of
customers per hour. As can be seen from Table 5, the variance between call
centres was significantly reduced for complexity and control, most
substantially for task control. Similar results were found for time pressure,
concentration, and cooperation demands, whereas the stressors uncertainty
and organizational problems were not or only little affected. The covariates
reduced the variance between call centres by 50% for positive emotions, but
had little effect on the other variables. In all cases, the percentage of
telephone time was the most influential variable.
Complexity and task control were higher in inhouse call centres, thus
partly supporting Hypothesis 3a (Table 6). No differences were found for
timing control and participation. Time pressure, concentration demands,
and cooperation demands were also higher in inhouse call centres.
Moreover, in line with Hypothesis 3b, CSRs in external service bureaux
were more frequently required to show positive emotions and less frequently
to show negative emotions. However, no differences were found for
sensitivity requirements and emotional dissonance, thus partly rejecting
Hypothesis 3b.
Not surprisingly, CSRs reporting to do complex counselling also reported
higher complexity and control (Hypothesis 4a) as well as job stressors except
uncertainty (Hypothesis 4b). Positive emotions and sensitivity requirements
were highest and negative emotions were lowest for simple counselling
(Hypothesis 4c), whereas no differences occurred for emotional dissonance.
Thus, Hypothesis 4d was rejected.
Also in line with expectations, team leaders reported higher complexity
and control (Hypothesis 5a) as well as time pressure, concentration
demands, and cooperation demands (Hypothesis 5b). No differences were
detected for the other stressors and emotion work (Hypothesis 5c). Thus
Hypothesis 5a was fully supported, Hypothesis 5b was partly supported,
whereas Hypothesis 5c was rejected. The effects for task and timing control,
however, disappeared when controlling for the other organizational call
centre variables, primarily due to the percentage of telephone time (Table 6).
Thus, the data suggest that team leaders have more task control and timing
control which might be explained by the fact that they spend less time
interacting with customers on the phone.
TYPICAL CHARACTERISTICS OF CALL CENTRE JOBS
329

TABLE 5
Job stressors and resources and characteristics of call centres
Z
2
DZ
2
Inhouse/
external
Inbound
Outbound
Information
Simple
counselling
Leader
% Time at
phone
Call time
Customer/
hour
R
2
Complexity
18.9 **
5.0 **
7.16 **
.00
7.15 **
7.22 **
7.25 **
.26 **
7.15 *
.17 **
7.08
33.9 **
(
7.18 **)
(.00)
(
7.20 **)
(
7.06)
(
7.21 **)
(.39 **)
(
7.44 *)
(.22**)
(
7.16**)
Task control
11.1 **
2.5
7.08
7.08
7.07
7.12
7.14
.06
7.31 **
.08
7.01
19.6 **
(
7.11 *)
(
7.09 *)
(
7.10 *)
(
7.07)
(
7.13 **)
(.26 **)
(
7.40**)
(.13**)
(
7.15**)
Timing control
18.3 **
6.1 **
7.06
7.13 *
7.09
7.07
7.10
7.03
7.46 **
.09
7.02
29.4 **
(
7.08)
(
7.14 *)
(
7.09 *)
(
7.09)
(
7.12 *)
(.27 **)
(
7.51**)
(.17**)
(
7.22**)
Participation
11.3 **
8.0 **
.04
7.02
7.04
7.22 **
7.20 **
.20 **
7.27 **
7.08
7.03
26.9 **
(
7.01)
(
7.05)
(
7.08)
(
7.14 *)
(
7.08)
(.40 **)
(
7.46**)
(.01)
(
7.18**)
Organizational problems
3.8
a
5.2 **
.03
7.05
7.04
7.19 *
7.15
7.03
7.03
.08
.13
3.8
n.s.
(.02)
(
7.06)
(
7.02)
(
7.08)
(
7.03)
(
7.01)
(
7.02)
(.10 *)
(.03)
Uncertainty
6.7 **
7.4 **
7.05
.03
.00
7.02
.12
7.04
7.13
.18 **
.12
4.8
n.s.
(
7.02)
(
7.02)
(.01)
(
7.07)
(.07)
(.06)
(
7.08)
(.15 **)
(.03)
Time pressure
19.6 **
8.7 **
7.04
7.02
7.14 *
7.13
7.13
.16 *
7.10
.11 *
.09
12.2 **
(
7.10)
(.03)
(
7.16 **)
(
7.02)
(
7.13 **)
(.24 **)
(
7.23**)
(.11 *)
(.01)
Concentration demands 11.9 ** 3.9
7.10
.01
7.22 **
7.10
7.14 *
.07
7.13 *
.14 *
.12
15.5 **
(
7.17 **)
(.11 *)
(
7.28 **)
(.08)
(
7.22 **)
(.14 **)
(
7.17**)
(.10 *)
(.09 *)
Cooperation demands
9.7 **
3.0
.02
.11
7.10
7.21 **
7.22 **
.14 *
7.18 *
.04
.13 *
16.7 **
(
7.09 *)
(.15 **)
(
7.22 *)
(.01)
(
7.18 **)
(.26 **)
(
7.28**)
(.03)
(.04)
Positive emotions
14.7 **
7.4 **
.14 *
.00
.08
7.02
.10
.08
.15 *
.07
.07
9.0 **
(.19 **)
(
7.07)
(.16 **)
(
7.13 **)
(.19 **)
(
7.02)
(.15**)
(.08)
(.03)
Negative emotions
6.8 **
3.6 *
7.10
.02
7.08
7.04
7.11
7.03
7.10
.13 *
7.06
7.1 **
(
7.11 *)
(.02)
(
7.12 *)
(
7.04)
(
7.15 **)
(.05)
(
7.15**)
(.14 **)
(
7.08)
Sensitivity requirements
7.4 **
5.2 **
.05
.02
7.03
7.04
.09
.09
.00
.04
.06
2.7
n.s.
(.07)
(
7.01)
(.01)
(
7.10 *)
(.12 *)
(.09)
(
7.03)
(.04)
(.01)
Emotional dissonance
1.5
1.1
.05
.08
7.05
7.11
.04
.03
.00
.05
.18 **
4.3
n.s.
(.02)
(.08)
(
7.06)
(
7.06)
(.07)
(.03)
(.03)
(.01)
(.13 **)
**p
5 .01; *p 5 .05;
a
p
= .06.
Z
2
: variance between call centres;
DZ
2
: variance between call centres after controlling for organizational call centre
variables; columns 3 – 11, line 1: results of multiple regressions: betas with stressors and resources as dependent variables; line 2, numbers in parentheses:
zero order correlations; column 12: explained variance; columns 4 – 8: dummy coded variables (cf. Table 6).
330

TABLE 6
Job stressors and resources and characteristics of call centres: Comparison of means
Inhouse
(
N = 127)
External
service
(
N = 247)
T-value
Inbound
(
N = 205)
Outbound
(
N = 45)
Both
(
N = 122)
F
(df = 2)
Information
(
N = 124)
Simple
counselling
(
N = 171)
Complex
counselling
(
N = 72)
F
(df = 2)
CSRs
(
N = 318)
Team
leader
(
N = 44)
T-value
Complexity
3.15
2.80
4.23 **
2.95
b
2.57
a
2.99
b
5.11 **
2.83
a
2.76
a
3.42
b
20.42 **
2.70
3.74
7 8.02 **
(.81)
(.76)
(.76)
(.95)
(.76)
(.76)
(.78)
(.69)
(.74)
(.70)
Task control
2.88
2.68
2.06 *
2.66
a
2.53
a
2.96
b
5.55 **
2.63
a
2.62
a
3.21
b
12.58 **
2.64
3.39
7 5.26 **
(1.01)
(.88)
(.96)
(.96)
(.82)
(.93)
(.86)
(.96)
(.89)
(.93)
Timing control
2.82
2.80
1.07
2.63
a
2.52
a
3.04
b
10.52 **
2.64
a
2.64
a
3.19
b
11.48 **
2.66
3.39
7 5.28 **
(.91)
(.88)
(.89)
(.91)
(.80)
(.80)
(.84)
(1.03)
(.84)
(.96)
Participation
2.48
2.53
7 0.59
2.45
a
2.34
a
2.68
b
5.33 **
2.37
a
2.46
a
2.87
b
11.96 **
2.40
3.26
7 5.29 **
c
(.82)
(.69)
(.73)
(.81)
(.69)
(.65)
(.73)
(.80)
(.62)
(1.05)
Organizational
2.19
2.21
7 0.22
2.18
2.18
2.25
0.45
2.11
a
2.19
2.38
b
3.68 *
2.20
2.22
7.20
problems
(.68)
(.66)
(.69)
(.76)
(.58)
(.65)
(.73)
(.80)
(.67)
(.63)
Uncertainty
2.27
2.27
0.02
2.23
2.27
2.35
1.22
2.20
2.33
2.27
1.36
2.25
2.37
7 1.08
(.72)
(.66)
(.67)
(.67)
(.71)
(.72)
(.69)
(.60)
(.69)
(.63)
Time pressure
2.89
2.58
3.20 **
2.77
b
2.40
a
2.65
3.53 *
2.64
a
2.58
a
3.04
b
7.39 **
2.61
3.28
7 4.91 **
(.89)
(.87)
(.82)
(.81)
(.99)
(.89)
(.85)
(.90)
(.86)
(.84)
Concentration
3.08
2.71
4.05 **
2.94
b
2.28
a
2.88
b
11.93 **
2.93
b
2.65
a
3.11
b
9.05 **
2.80
3.14
7 2.48 *
demands
(.80)
(.85)
(.82)
(.78)
(.86)
(.89)
(.84)
(.70)
(.87)
(.66)
Cooperation
2.74
2.49
2.28 *
2.73
b
2.06
a
2.50
b
9.15 **
2.54
a
2.37
a
3.09
b
14.46 **
2.47
3.28
7 5.12 **
demands
(1.05)
(.96)
(.98)
(.90)
(1.01)
(.96)
(.97)
(.98)
(.99)
(.84)
Positive
3.21
3.40
2.35 *
3.34
a
3.66
b
3.20
a
6.12 **
3.17
a
3.49
b
3.24
7.10 **
3.35
3.32
.39
c
emotions
(.69)
(.80)
(.76)
(.72)
(.76)
(.75)
(.80)
(.67)
(.80)
(.44)
Negative
1.79
1.66
2.24 *
1.73
1.53
1.73
2.67
1.71
1.63
a
1.89
b
5.91 *
1.70
1.76
7.74
emotions
(.58)
(.53)
(.56)
(.50)
(.53)
(.56)
(.51)
(.58)
(.55)
(.56)
Sensitivity
3.25
3.28
7 0.33
3.30
3.31
3.22
0.27
3.10
a
3.41
b
3.25
3.38 *
3.24
3.48
7 1.73
c
requirements
(1.04)
(1.02)
(1.04)
(1.04)
(1.01)
(1.04)
(1.05)
(.93)
(1.05)
(.84)
Emotional
3.41
3.42
7 0.16
3.47
3.24
3.39
1.45
3.37
3.46
3.39
0.46
3.40
3.43
7.23
dissonance
(.87)
(.85)
(.88)
(.92)
(.80)
(.83)
(.91)
(.82)
(.86)
(.94)
**p
5 .01; *p 5 .05; variance analyses with Bonferroni post hoc analyses: line 1: means; SD in parentheses;
a
and
b
: groups with different letters are
significantly different (p
5 .05);
c
imhomogeneous variance, T-test for pooled variances used.
331

Table 5 also shows correlations between the percentage of time working
on the telephone. As expected there were substantial negative correlations
between complexity and control and telephone time, with the highest
correlation for timing control (hypothesis 6a). Negative correlations were
also found for time pressure, concentration, and cooperation demands. As
expected, there was a positive correlation with positive emotions; however,
contrary to expectations, a negative correlation with the frequency to
express negative emotions occurred and no correlation was detectable for
sensitivity requirements and emotional dissonance. Thus Hypothesis 6b
could only be supported for one of the four emotion work variables.
With regard to inbound vs. outbound activities, those jobs with both
inbound and outbound activities were distinguished by the highest
complexity and control, whereas inbound calls only and outbound calls
only were not statistically different (Hypothesis 7). Outbound activities were
characterized by less job stressors than inbound activities as well as the
combination of both. Only for uncertainty no differences were found.
Finally, positive emotions were higher for outbound activities but no
differences were realized for the other emotion work variables.
In addition, Table 5 also reports results of multiple regressions with
resources, job stressors, and emotion work as the dependent variables and
the organizational call centre variables as the independent variables. The
table shows that the call centre variables explain considerable variance for
complexity and job control and they explain least variance for the emotion
work variables. The most important independent variable in these analyses
is percentage of telephone time, which significantly contributes to complex-
ity and all control variables, concentration and cooperation demands, and
the requirement to display positive emotions. All other call centre variables
are only occasionally significant in these analyses.
DISCUSSION
Call centres are among the few booming operations in recent years. The
main task in call centres is to interact with customers by telephone, usually
supported by computer systems used to organize and automate parts of the
job. In this article we compared complexity, control, job stressors, and
emotion work in a sample of call centre employees and in a comparison
group consisting of service workers, human service workers, and workers
who had no service jobs (mainly blue collar jobs and administrative jobs).
We found that jobs in call centres were characterized by lower complexity
and control, but call centre workers were better off with regard to most job
stressors compared to the comparison groups. These effects become even
stronger when CSRs without leadership responsibilities are considered only
(cf. Table 6, column 9). Moreover, CSRs had to express less negative
332
ZAPF ET AL.

emotions but were most frequently exposed to emotional dissonance
although the statistical differences were not all significant for the single
call centres. Concerning requirements to express positive emotions and to
demonstrate sensitivity they were between other service workers, the group
they are most comparable with, and human service workers. Looking at the
differentiated results of eight call centres revealed job-related deficits in most
but not all call centres. Mixed results arose from the analysis of job stressors.
The percentage of time working with customers on the telephone explained a
substantial part of the differences among call centres. The percentage of
telephone time was negatively correlated with complexity and control as well
as with some of the job stressors and it was positively correlated with the
requirement to display positive emotions.
The present results support the view that the majority of call centres—
that is both inbound and outbound call centres with relatively simple
tasks—have been established to organize customer mass service (Holman,
2003). However, there are also call centres in our study that belong to the
‘‘customer relationship’’ type, at least with regard to complexity and
control. This applies for Call centre 5, which is a hotline for technical
questions where people perform relatively complex tasks. Similar but less
pronounced results were found for Call centre 2, which is an inhouse call
centre in the tourism sector. Contrary to many expectations, the job
stressors in some call centres were lower than in the comparison groups.
This was especially so in Call centre 1, the only outbound call centre.
Looking at the various call centres substantial differences between the call
centres were revealed. Workers in Call centre 5 scored maximally with
regard to time pressure and concentration demands, as did people in human
service work. Again, similar, but less pronounced results were found for Call
centre 2. On the other hand, three call centres had significantly less
organizational problems and two call centres had significantly lower
cooperation demands than all comparison groups. Our results do not
support the conclusion that call centre jobs are generally more stressful with
regard to job stressors. The results for job complexity, control, and job
stressors support the findings of an earlier study (Isic et al., 1999). Call
centres seem to be well organized as indicated by the low levels of
uncertainty and organizational problems, certainly in comparison with
many other service organizations. This may be the result of relying heavily
on information technology supporting the distribution of calls and directing
the course of CSR – customer interactions. However, the data also show that
this leads to lower control and participation by the CSRs. Thus it can be
concluded that the problem in many call centres is not the high level of job
stressors but the low level of resources that could help to buffer the negative
effects of stressors (Hobfoll, 2001; Lazarus, 1999; Zapf & Semmer, in press).
This conclusion has to be validated, however, because although we
TYPICAL CHARACTERISTICS OF CALL CENTRE JOBS
333

measured a variety of stressors, we were not able to measure all stressful
aspects of the job. For example, we did not check whether performance was
monitored electronically, which appeared to be a stressor in the study by
Holman (2002).
With regard to emotion work, there usually are strict display rules.
Observing these rules is often enforced by electronic performance monitor-
ing in many call centres (Baumgartner, Good, & Udris, 2002; Holman, 2003;
Schuler, 2000). The frequency of customer contacts in call centres is
generally higher than in other service jobs. This could explain the fact that
CSRs are more often required to express positive emotions in comparison to
other comparable service professions. However, the absence of having to
display negative emotions seems to be specific for all call centres. Indeed,
CSRs’ tasks do not seem to include the demonstration of negative emotions
(the mean is between ‘‘almost never’’ and ‘‘once a month’’). This is in
contrast to the jobs of human service workers. A social worker, for example,
sometimes has to express negative emotions to reach certain goals. Being
allowed to display a variety of emotions may sometimes alleviate the task
for human service workers (Zapf, Seifert, Schmutte, Mertini, & Holz, 2001).
The display rules for human service workers are much less restrictive. In
most call centres CSRs are expected to display friendliness and politeness
(see, e.g., the study of Deery et al., 2002). The organizational display rules
do not allow the display of any negative emotion. This could explain why
emotion work in human services jobs seems to be more frequent and more
intensive compared to work in call centres, although emotional dissonance
seems to be higher in call centres.
The organizational call centre variables have relatively little effect on
emotion work. Only a few relations were significant, supporting the view
that a high level of the requirement to express positive emotions, a very low
level to express negative emotions, and a relatively high level of emotional
dissonance resulting from both seem to be typical for call centres in general,
almost independent of the specific call centre organization.
When considering organizational and task characteristics of the call
centres, it turns out that the percentage of time spent at the telephone
interacting with customers is one of the key variables. The more time CSRs
spend on the telephone the less complex the tasks are and the less control
they have. However, there is also an increase of time pressure, concentration
requirements, and cooperation demands. It is a frequent finding in our
studies that more complex jobs are also more stressful (e.g., Dormann et al.,
2002). So interacting by telephone in call centres is not necessarily related to
high task-related job stressors. This contradicts findings that indicators of
emotion work, such as frequency of interactions, are usually positively
correlated with time pressure and concentration demands (Zapf et al., 2001).
One speculative explanation could be that in many call centres only the time
334
ZAPF ET AL.

spent at the telephone is seen as productive (see the discussion on electronic
monitoring in Holman, 2003). This might enhance the pressure on other
tasks to be carried out as fast as possible. Although there is a pressure in
many call centres to increase the number of calls, which could be
hypothesized to go along with an heightened level of job stressors, there
is, on the other hand, some evidence that call centres are better organized
than other organizations or other organizational units. Most call centres
have invested heavily in modern information technology to support the
CSRs (Holman, 2003; Schuler, 2000). Therefore, organizational problems,
time pressure, concentration requirements, and cooperation demands are
relatively low compared to the comparison groups.
In the present study, inhouse call centres differ in several respects from
external service bureaux. When controlling for other organizational call
centre variables, external service bureaux are still characterized by less
complexity and a higher requirement to express positive emotions.
Differences with regard to job stressors and control disappear. They are
explained by the more complex tasks carried out in in-house call centres.
Contrary to expectations, outbound activities compared to inbound
activities are related to less complexity, control, and job stressors.
Obviously, the low task complexity in outbound call centres offers little
substantial control for the CSRs. An example is Call centre 1, the only
outbound call centre in the study.
Not surprisingly, team leaders report higher complexity and control, but
also more job stressors except for uncertainty. Whereas the higher extent of
complexity and participation can be attributed to their organizational role,
task control and timing control can obviously be explained by the less time
the team leaders spend at the telephone. Obviously, when interacting with
customers on the telephone, they do not have more control over the
situation than the CSRs without leadership responsibilities.
In summary, the results of this study suggest that low complexity, low
resources, and a relatively high level of emotional dissonance are the
prevailing problems of working in call centres. CSRs are strongly controlled
by customers. They often have to adhere to clear rules about how to interact
with customers both on the task level (with scripts on how to proceed) as
well as on the interaction level (display rules to be positive and friendly),
thereby being limited in their possibilities to cope with stressors.
Practical conclusions to be drawn from the present study would include
job enrichment strategies, especially for inhouse call centres. A mixture of
customer-related interaction work and administrative work, and other
backstage work as well, such as taking over tasks from other departments
of the company, could offer possibilities to improve jobs. However, these
kinds of improvement would probably be hard to introduce in specialized
call centres carrying out mass services. In this type of call centre it may be
TYPICAL CHARACTERISTICS OF CALL CENTRE JOBS
335

difficult to find a substantial amount of nonroutine work, making the
implementation of job enrichment strategies almost impossible. Countries
like Germany, which relocated a substantial part of its production to low
salary countries, are characterized by a shortage of unskilled work and low
salaried jobs. A look at the sociodemographic data of call centre staff
shows that although the percentage of employees with a university degree
is very low, only 17% are in possession of a lower stream school-leaving
certificate and there is nobody without such a level of education. This
reflects that most call centres recruit staff with some level of qualifications,
like good or very good communication skills, a friendly voice, verbal
fluency, and no accent (Baumgart et al., 2002; Baumgartner et al., 2002;
Dieckhoff et al., 2002). These skills are difficult to find among unskilled
workers. Therefore, candidates with higher education are usually preferred.
Because of their high basic education, many of these employees find call
centre work too undemanding after a while. This may contribute to the
high turnover rate frequently found in call centres (Holman, 2003; Schuler,
2000).
The present study has strengths and limitations. One of its strengths is
the reasonable sample size and the comparison group design with a
randomly drawn sample, which may, however, have a bias towards
academic professions. A limitation is that the call centres were not
randomly drawn. However, because the present results are very similar to
other studies (Baumgart et al., 2002; Baumgartner et al., 2002; Dormann
et al., 2002; Isic et al., 1999), especially with regard to sociodemographic
variables, we assume that the call centres are not untypical. Despite the
fact that the data are all self-reported, in most analyses, the independent
variable can be assumed to be bias free (e.g., call centre sample vs.
comparison samples, inbound vs. outbound, inhouse vs. service bureaux,
team leader responsibilities). Therefore, an overestimation of relations or
differences of results due to measurement artifacts is unlikely in this
article.
Whereas the study replicates previous findings suggesting that job design
could be considerable improved in call centres, it clearly shows that call
centre workers are not generally exposed to higher levels of job stressors.
One of the strengths of this study is that it provides a more differentiated
picture of the positive and negative implications of CSR – customer
interactions. The relatively high level of emotional dissonance which has
been shown to be an important stressor in service work (Zapf, 2002)
questions the application of too strict display rules and the electronic
performance monitoring techniques to enforce these rules. Although strict
scripts and display rules may have a protective function because they are
reassuring with regard to the behaviour preferred by the organization, they
often inhibit the CSRs’ autonomy and their ability to provide customized
336
ZAPF ET AL.

service (Deery et al., 2002). The data of the present study suggest giving the
agents more decision latitude to personalize the organizational display rules
and to develop an individual style how to interact with customers. However,
our practical experience is that fewer defined display and interaction rules
often lead to uncertainty for the CSRs with regard to what is and what is not
allowed.
Currently, there seems to be progress in the research on job stressors and
resources in call centres. However, little research has been carried out on the
social interaction of service provider and customer. Future research should,
therefore, supplement recent research by looking more on the service
provider – customer interaction, which seems to be the major source of stress
in the present study.
REFERENCES
Adelmann, P. K. (1995). Emotional labor as a potential source of job stress. In S. L. Sauter & L.
R. Murphy (Eds.), Organizational risk factors for job stress (pp. 371 – 381). Washington,
DC: American Psychological Association.
Batt, R. (2002). Managing customer services: Human resource practices, quit rates, and sales
growth. Academy of Management Journal, 45, 587 – 597.
Baumgart, U., Debitz, U., Metz, A.-M., Richter, P., Schulze, F., Timm, E., & Wieland, R.
(2002). CCall Report 11. Call Center auf dem arbeitspsychologischen Pru¨fstand. Teil 2:
Arbeitsgestaltung, Belastung, Beanspruchung & Ressourcen
[Call centre at the work
psychology test bench. Part 2: Job design, stressor, strain, and resources]. Hamburg:
Verwaltungs-Berufsgenossenschaft.
Baumgartner, M., Good, K., & Udris, I. (2002). Call Centers in der Schweiz. Psychologische
Untersuchungen in 14 Organisationen
[Call centres in Switzerland: Psychological investiga-
tions in 14 organizations]. Zurich, Switzerland: Institut fu¨r Arbeitspsychologie, ETH Zurich.
Bongard, S., & al’Absi, M. (2003). Domain-specific anger expression assessment and blood
pressure during rest and acute stress. Personality and Individual Differences, 34, 1381 – 1402.
Bowen, D. E., & Schneider, B. (1988). Services marketing and management: Implications for
organizational behaviour. In B. M. Staw & L. L. Cummings (Eds.), Research in
organisational behavior
(Vol. 10, pp. 43 – 80). Greenwich, CT: JAI Press.
Brotheridge, C. M., & Grandey, A. A. (2002). Emotional labor and burnout: Comparing two
perspectives of ‘‘people work’’. Journal of Vocational Behavior, 60, 17 – 39.
Brotheridge, C. M., & Lee, R. T. (2003). Development and validation of the Emotional Labour
Scale. Journal of Occupational and Organizational Psychology, 76, 365 – 379.
Bu¨ssing, A., & Glaser, J. (1999). Interaktionsarbeit. Konzept und Methode der Erfassung im
Krankenhaus [Interaction work: Concept and method of assessment in hospitals]. Zeitschrift
fu¨r Arbeitswissenschaft, 53, 164 – 173.
Deery, S., Iverson, R., & Walsh, J. (2002). Work relationships in telephone call centres:
Understanding emotional exhaustion and employee withdrawal. Journal of Management
Studies
, 39, 471 – 496.
Dieckhoff, K., Freigang-Bauer, I., Schro¨ter, W., & Viereck, K. (2002). CCall Report 1.
Branchenbild Call Center
[Call centre branch overview]. Hamburg, Germany: Verwaltungs-
Berufsgenossenschaft.
TYPICAL CHARACTERISTICS OF CALL CENTRE JOBS
337

Dormann, C., Zapf, D., & Isic, A. (2002). Emotionale Arbeitsanforderungen und ihre
Konsequenzen bei Call Center-Arbeitspla¨tzen [Emotional job requirements and their
consequences in call centre jobs]. Zeitschrift fu¨r Arbeits- und Organisationspsychologie, 46,
201 – 215.
Erickson, R. J., & Wharton, A. S. (1997). Inauthenticity and depression: Assessing the
consequences of interactive service work. Work and Occupations, 24, 188 – 213.
Frenkel, S., Tam, M., Korczynski, M., & Shire, K. (1998). Beyond bureacracy? Work
organisation in call centres. International Journal of Human Resource Management, 9, 957 –
979.
Gerlmaier, A., Bo¨cker, M., & Kastner, M. (2001). Betriebliches Belastungs- und Ressourcen-
management im Call Center [Occupational stressor and resource managment in the call
centre]. In M. Kastner, K. Kipfmu¨ller, W. Quaas, Kh. Sonntag, & R. Wieland (Eds.),
Gesundheit und Sicherheit in Arbeits- und Organisationsformen der Zukunft
(pp. 303 – 326).
Bremerhaven, Germany: Wirtschaftsverlag NW.
Goffman, E. (1959). The presentation of self in everyday life. New York: Doubleday Anchor.
Grandey, A. A. (2000). Emotion regulation in the workplace: A new way to conceptualize
emotional labor. Journal of Occupational Health Psychology, 5, 95 – 110.
Grandey, A. A., Dickter, D. N., & Sin, H.-P. (2002). Customer verbal abuse of service
representatives: Consequences and coping
. Symposium conducted at the annual meeting of
the Society of Industrial-Organizational Psychology, Toronto, Canada.
Gutek, B. A. (1997). Dyadic interactions in organisations. In C. L. Cooper & S. E. Jackson
(Eds.), Creating tomorrow’s organizations today. Chichester, UK: Wiley.
Henn, H., Kruse, P., & Strawe, O. (1996). Handbuch Call Center-Managment: das große
Nachschlagewerk fu¨r alle, die professionell mit dem Telefon arbeiten [Handbook of call centre
management: The great reference work for all who work professionally with the telephone].
Hannover, Germany: telepublic Verlag.
Hobfoll, S. E. (2001). The influence of culture, community, and the nested-self in the stress
process: Advancing conservation of resources theory. Applied Psychology: An International
Review
, 50, 337 – 421.
Hochschild, A. R. (1983). The managed heart. Berkeley, CA: University of California Press.
Holman, D. J. (2002). Employee well being in call centres. Human Resource Management
Journal
, 12, 35 – 50.
Holman, D. J. (2003). Call centres. In D. J. Holman, T. D. Wall, C. W. Clegg, P. Sparrow, & A.
Howard (Eds.), The new workplace: A guide to the human impact of modern working
practices
. Chichester, UK: Wiley.
Holman, D. J., Chissic, C., & Totterdell, P. (2002). The effects of performance monitoring on
emotional labor and well being in call centers. Motivation and Emotion, 26, 57 – 81.
Isic, A., Dormann, C., & Zapf, D. (1999). Belastungen und Ressourcen an Call Center-
Arbeitspla¨tzen [Stressors and resources at call centre jobs]. Zeitschrift fu¨r Arbeitswis-
senschaft
, 53, 202 – 208.
Knights, D., & McCabe, D. (1998). What happens when the phone goes wild? Staff, stress and
spaces for escape in a BPR telephone banking call regime. Journal of Management Studies,
35
, 163 – 194.
Kruml, S. M., & Geddes, D. (2000). Catching fire without burning out: Is there an ideal way to
perform emotional labor? In N. M. Ashkanasy, C. E. J. Ha¨rtel, & W. J. Zerbe (Eds.),
Emotions in the workplace: Research, theory and practice
(pp. 177 – 188). Westport, CT:
Quorum Books.
Lazarus, R. S. (1999). Stress and emotion: A new synthesis. New York: Springer.
Metz, A.-M., Rothe, H.-J., & Degener, M. (2001). Belastungsprofile von Bescha¨ftigen in Call
Centern [Stressor profiles of employees working in call centres]. Zeitschrift fu¨r Arbeits- und
Organisationspsychologie
, 45, 124 – 135.
338
ZAPF ET AL.

Morris, J. A., & Feldman, D. C. (1996). The dimensions, antecedents, and consequences of
emotional labor. Academy of Management Review, 21, 986 – 1010.
Morris, J. A., & Feldman, D. C. (1997). Managing emotions in the workplace. Journal of
Managerial Issues
, 9, 257 – 274.
Nerdinger, F. W., & Ro¨per, M. (1999). Emotionale Dissonanz und Burnout. Eine empirische
Untersuchung im Pflegebereich eines Universita¨tskrankenhauses [Emotional dissonance and
burnout: An empirical examination in the nursing sector of a university hospital]. Zeitschrift
fu¨r Arbeitswissenschaft, 53, 187 – 193.
Richter, P., & Schulze, F. (2001). Arbeitsorganisation als Mo¨glichkeit der Beanspruchungsop-
timierung an Call-Center-Arbeitspla¨tzen [Work organization as a possibility of strain
optimization at call centre jobs]. In I. Matuschek, A. Henninger, & F. Kleemann (Eds.),
Neue Medien im Arbeitsalltag
(pp. 131 – 146). Wiesbaden, Germany: Westdeutscher Velag.
Schaubroeck, J., & Jones, J. R. (2000). Antecedents of workplace emotional labor dimensions
and moderators of their effects on physical symptoms. Journal of Organizational Behavior,
21
, 163 – 183.
Schuler, H. (2000). Die Call Center der Zukunft: Vom Call Center zum multimedialen Kunden-
Interaktions-Center [The call centre of the future: From the call centre to the multimedia
customer interaction centre]. In H. Schuler & J. Pabst (Eds.), Personalentwicklung im Call
Center der Zukunft
(pp. 1 – 11). Neuwied, Germany: Luchterhand.
Semmer, N. K., Zapf, D., & Dunckel, H. (1995). Assessing stress at work: A framework and an
instrument. In O. Svane & C. Johansen (Eds.), Work and health—scientific basis of progress
in the working environment
(pp. 105 – 113). Luxembourg: Office for Official Publications of
the European Communities.
Semmer, N. K., Zapf, D., & Dunckel, H. (1998). Instrument zur Streßbezogenen Arbeitsanalyse
ISTA Version 6.0
. Bern, Germany: Psychologisches Institut Bern.
Semmer, N. K., Zapf, D., & Dunckel, H. (1999). Instrument zur Stressbezogenen
Ta¨tigkeitsanalyse ISTA [Instrument for stress-related job analysis]. In H. Dunckel (Ed.),
Handbuch psychologischer Arbeitsanalyseverfahren
(pp. 179 – 204). Zu¨rich, Switzerland: vdf
Hochschulverlag.
Spector, P. E., & Jex, S. M. (1998). Development of four self-report measures of job stressors
and strain: Interpersonal Conflict at Work Scale, Organizational Constraints Scale,
Quantitative Workload Inventory, and Physical Symptoms Inventory. Journal of Occupa-
tional Health Psychology
, 3, 356 – 367.
Wieland, R., Metz, A.-M., & Richter, P. (2001). CCall Report 3. Call Center auf dem
arbeitspsychologischen Pru¨fstand. Teil 1: Verfahren, Ta¨tigkeitsmerkmale und erste Ergebnisse
zur psychischen Belastung
[Call centres at the work psychology test bench. Part 1:
Instruments, task characteristics and first results regarding psychological stress]. Hamburg,
Germany: Verwaltungs-Berufsgenossenschaft.
Zapf, D. (1993). Stress-oriented job analysis of computerized office work. The European Work
and Organizational Psychologist
, 3, 85 – 100.
Zapf, D. (2002). Emotion work and psychological strain: A review of the literature and some
conceptual considerations. Human Resource Management Review, 12, 237 – 268.
Zapf, D., Bechtoldt, M., & Dormann, C. (in press). Instrument zur Streßbezogenen
Arbeitsanalyse (ISTA), Fragebogen Version 6.0 [Instrument for stress-related job analysis
(ISTA) questionnaire version 6.0]. Zeitschrift fu¨r Arbeits- und Organisationspsychologie.
Zapf, D., Mertini, H., Seifert, C., Vogt, C., Isic, A., & Fischbach, A. (2000). Frankfurt Emotion
Work Scales—Frankfurter Skalen zur Emotionsarbeit FEWS 4.0
. Frankfurt, Germany:
Department of Psychology, J. W. Goethe-University Frankfurt.
Zapf, D., Seifert, C., Schmutte, B., Mertini, H., & Holz, M. (2001). Emotion work and job
stressors and their effects on burnout. Psychology and Health, 16, 527 – 545.
TYPICAL CHARACTERISTICS OF CALL CENTRE JOBS
339

Zapf, D., & Semmer, N. K. (in press). Stress und Gesundheit in Organisationen [Stress and
health in organizations]. In H. Schuler (Ed.), Enzyklopa¨die der Psychologie, Themenbereich
D, Serie III, Band 3, Organisationspsychologie
(2nd ed.). Go¨ttingen, Germany: Hogrefe.
Zapf, D., Vogt, C., Seifert, C., Mertini, H., & Isic, A. (1999). Emotion work as a source of
stress: The concept and development of an instrument. European Journal of Work and
Organizational Psychology
, 8, 371 – 400.
Zeithaml, V. A., & Bitner, M. J. (2000). Services marketing: Integrating customer focus across
the firm
(2nd ed.). Boston: McGraw-Hill.
340
ZAPF ET AL.

Wyszukiwarka
Podobne podstrony:
Find the Job That Is Right for You
Aiello A, What is the evidence for a causal link between hygien and infections, 2002
What is the validity of the sorting task for describing beers A study using trained and untraind as
chinesepod what is your job
Immunonutrition in clinical practice what is the current evidence
Crossfit vol 19 Mar 2004 WHAT IS CROSSFIT
Angielski Gramatyka opracowania Passive voice what is it
Stationery 1 What is this Worksheet
What is love
SHSBC119 WHAT IS A WITHHOLD 0262
What is complementary distribution
What is an allophone
what is your?vourite?y of the week
What is your personal attitude to graffiti
WHAT IS LOVE
Summary of an artice 'What is meant by style and stylistics'
więcej podobnych podstron