
E C O N O M I C S
T H E B AS I C S
Economics: The Basics provides a fascinating introduction to the
key issues in contemporary economics. Comprehensive and easy to
read, it covers major microeconomic and macroeconomic aspects
including:
●
demand, supply and price theory;
●
monopoly and competition;
●
inflation and unemployment;
●
money, banking and government policies;
●
international trade;
●
developmental and environmental issues.
Through case studies ranging from the coffee plantations of
El Salvador to the international oil industry and the economic
slowdown in Japan, this book addresses the fundamental theoretical
and practical issues in economics.
This accessible guidebook is essential reading for anyone who
wants to understand how economics works and why it is important.
Tony Cleaver is Vice-Master of Grey College and lecturer in the
Department of Economics and Finance at the University of
Durham, UK.
© 2004 Tony Cleaver

You may also be interested in the following Routledge student
reference titles:
FIFTY MAJOR ECONOMISTS
STEVEN PRESSMAN
THE ROUTLEDGE COMPANION TO GLOBAL ECONOMICS
EDITED BY ROBERT BENYON
BUSINESS: THE KEY CONCEPTS
MARK VERNON
FIFTY KEY FIGURES IN MANAGEMENT
MORGEN WITZEL
INTERNET: THE BASICS
JASON WHITTAKER
© 2004 Tony Cleaver

E C O N O M I C S
THE BASICS
Tony Cleaver
© 2004 Tony Cleaver

© 2004 Tony Cleaver
First published 2004
by Routledge
2 Park Square, Milton Park, Abingdon, Oxon, OX14 4RN
Simultaneously published in the USA and Canada
by Routledge
270 Madison Avenue, New York, NY 10016
Routledge is an imprint of the Taylor & Francis Group
© 2004 Tony Cleaver
All rights reserved. No part of this book may be
reprinted or reproduced or utilised in any form or by
any electronic, mechanical, or other means, now
known or hereafter invented, including photocopying
and recording, or in any information storage or
retrieval system, without permission in writing from
the publishers.
British Library Cataloguing in Publication Data
A catalogue record for this book is available from the British Library
Library of Congress Cataloging in Publication Data
Cleaver, Tony, 1947–
Economics: the basics / Tony Cleaver.
p. cm. – (The basics)
1. Economics. I. Title. II. Series: Basics (Routledge (Firm))
HB171.C655 2004
330–dc22
2004002732
ISBN 0–415–31411–9 (hbk)
ISBN 0–415–31412–7 (pbk)
This edition published in the Taylor and Francis e-Library, 2005.
“To purchase your own copy of this or any of Taylor & Francis or Routledge’s
collection of thousands of eBooks please go to
www.eBookstore.tandf.co.uk
.”
ISBN 0-203-49602-7 Master e-book ISBN
ISBN 0-203-57327-7 (Adobe eReader Format)

PARA MARIA CRISTINA
© 2004 Tony Cleaver

C O N T E N T S
1
Wealth and poverty
2
Prices, markets and coffee
3
The business of supply
4
Inflation and unemployment – boom and bust
5
Money, banks, bubbles and crises
6
National income, world trade and multinational
enterprise
7
Can we reduce poverty and protect the environment?
Glossary
© 2004 Tony Cleaver

1
W E A LT H A N D P O V E R T Y
Planet Earth is a unique and immensely rich supporter of biological
life-forms.
The most successful life-form is, of course, humankind and it has
exploited the planet’s richness to spread rapidly across the globe – and
it has also, for some, developed lifestyles that are unprecedentedly
sophisticated and luxurious.
Dominant though the species has become, however, two important
observations must be made:
●
First, however richly endowed the Earth may be, its resources
are not limitless. It is becoming increasingly apparent that the
exponential growth in human activity is damaging to the
planet’s ecology. As more resources are commandeered for
human consumption so not only do other life-forms lose out
in direct competition but also there is the danger that future
generations of humankind itself will be deprived.
●
Second, just as other species have been unable to compete for the
control of Earth’s resources against the dominant life-form, so
within humankind there are great differences in the ability of
some to compete and succeed. A relatively small minority of the
peoples on the globe enjoy great riches. A very much larger
fraction of humankind survives in comparative poverty.
Terms in capital letters are included in the Glossary.
© 2004 Tony Cleaver

Unlike primitive plants and animals, however, what makes
humankind different from all other species on the planet is our
capacity for choice. We are not driven solely by instinct to the ends
we find ourselves occupying. We can choose our own destiny.
Acting on our own as individuals or acting together in society, we
are blessed with the capacity to influence future outcomes.
Economics has been described as the science of choice. In the face
of limited resources, human society has evolved systems of decision-
making that choose whose wants are to have priority, in what
manner resources are to be exploited and whether – in the end – we
make guns or bread and butter.
Whichever decision-making system society employs, however, it
is in the nature of economics that the answers it comes up with
cannot please all of the people, all of the time. Because fundamental
issues and disagreements are at stake here, they have excited
the passions of humankind throughout history. Revolutions have
erupted, wars have been won and lost and demonstrations continue
to this day in various cities and nations of the world about
the proper distribution, use and abuse of the fruits of the planet.
This text attempts to study these things dispassionately, to
analyse and achieve an objective understanding of the basic
economic questions that concern us all: how wealth is created, how
it is distributed amongst us and what is sacrificed in the process.
We begin by considering market, command and traditional
forms of economic organisation. In later chapters, we go on to study
the role of prices, the nature of production, and issues of inflation,
unemployment and international trade. In so doing we adopt the
economists’ rational, scientific approach to our subject matter but –
as I hope you will see – throughout this analysis we never stray far
from issues of topical and controversial interest that economics is
designed to illuminate.
In this respect, consider the criticism implied earlier. Some
observers allege that we have squandered the riches of the Earth in
creating inequitable opulence – catering for the greed of a few
powerful parties whilst ignoring the needs of all other inhabitants
of the planet. Is this true? If so, how has it come about? And what,
if anything, should be done about it?
In order to address these questions, it is worth pointing out at
the outset the difference between matters of fact and those of
© 2004 Tony Cleaver
opinion. That is, between questions of
POSITIVE ECONOMICS
, which
can be answered by resort to hard evidence and those of
NORMATIVE
ECONOMICS
, which require the application of value judgement.
Modern economists attempt to redefine most questions so that they
may be couched in terms of the former, avoiding the latter (or at
least identifying their own biases) so that the reader can make up
his/her own mind.
That the Earth’s riches are consumed more by some than by
others can be quickly demonstrated. Consider an A to Z of the
world’s nations: One quick measure of relative wealth is the
purchasing power of the average citizen in, say, Austria compared to
Zambia; Bangladesh compared to the USA. The World Bank gives
the data as shown in Figures 1.1 and 1.2 for the year 2000.
24,600
1,530
31,910
720
Austria Bangladesh
USA
Zambia
Figure 1.1 US$ average income per capita (purchasing power parity).
3.14
0.1
8.35
0.14
Austria
Bangladesh
USA
Africa*
Figure 1.2 Primary energy consumed per person (tons of oil equivalent).
Note
* Figures for Zambia are unavailable. The average for all African countries except
Algeria, Egypt and the Republic of South Africa given instead.
© 2004 Tony Cleaver

Another yardstick would be to compare the consumption of
primary energy sources of the average person in each country –
since this is a direct measure of how much of a basic and essential
resource (such as oil) is being used up by differing peoples.
These are crude measures. Many more sophisticated and more
accurate surveys can be quoted but the basic point is made: there
exist great extremes of wealth and poverty amongst the peoples of
the planet.
How such an unequal distribution has come about is a much
more difficult question of positive economics. It is, in fact, an
inquiry that will run all through this book as an undercurrent that
flows behind the various theories and analyses which form the
backbone of this subject.
What, if anything, should be done about global inequality is, of
course, not a question of positive economics at all. Like a scientist
studying the workings of the solar system, or the internal organs of
some animal, the economist is responsible for publishing the
evidence and identifying what might happen if you make this
change or that to economic systems but he/she has no more right
than anyone else to say what ought to happen in this world.
It is always easy to ask important questions in economics. It is
easy also to make colourful and outrageous claims about the nature
and conduct of economic affairs. (Have certain people really squan-
dered the riches of Earth?) It is not always easy, however, to give
balanced, objective and accurate responses to such questions and
assertions. That is nonetheless the challenge of positive economics.
T H R E E D E C I S I O N - M A K I N G S Y S T E M S
Let us return now to the study of decision-making systems that
communities may adopt to organise their economic affairs. There
are three examples.
First, consider the economic activity within a small, student-run
community – such as in a university college or hall of residence. In
this example, we can imagine a fairly active social life exists,
perhaps led and organised by a student committee: putting on
discos, arranging a regular supply of drinks and snacks, maybe on
occasions inviting outside agents and artistes to come and entertain
the residents.
© 2004 Tony Cleaver

Now contrast this with the economic life of a large town or city:
an enormous range of industrial, commercial and personal services
are provided – too many to briefly enumerate.
Third, at the opposite extreme, we can consider the economic
organisation of a small family home where housekeeping, main-
tenance and family care takes place.
How is it decided in each of these communities what goods and
services should be provided; how (where, when and by whom) these
commodities should be produced and who should enjoy the benefits
of their consumption? Decisions as to what is produced, and how
and for whom, may be taken in very different ways in these three
examples.
Small college communities where everyone knows one another
can often be run very democratically – people being elected for
office and then asking around what goods should be ordered, what
sorts of things people want to get done, etc. An efficient
CENTRAL
PLANNING
mechanism may evolve – the community’s wants are
surveyed, passed up to the decision-making committee who then
issue orders to outside suppliers or delegate production to internal
groups (the bar committee, the dance organisers, etc).
In a family home, there is unlikely to be any formal election of
senior officers. Most economic decisions are taken by parents and
family elders and roles within the family evolve slowly according to
TRADITION
and the circumstances of individuals.
Most of the economic activity in a large city, however, is deter-
mined not by planning, nor by social custom but by the dictates of a
free
MARKET
. If there is sufficient demand for a product or service
then, subject to its lawful production, it will be provided.
(Governments can outlaw certain trades such that supplies are
severely cut back – but so long as people are willing to pay high,
BLACK MARKET
prices production will take place anyway. The free
market can subvert government.)
These three decision-making systems introduced here can be
found in operation all over the world. Their precise application in
any one theatre of human activity will depend on the institutions
and practices of the country concerned – some industries and some
countries may demonstrate a distinct preference for one system
above the rest; another economic organisation may rely on a combi-
nation of all three. Industry in almost any country will demonstrate
© 2004 Tony Cleaver

some element of all three decision-making systems acting together
but let us look for examples where each regime can be studied more
or less on its own.
T R A D I T I O N A L A G R I C U LT U R E
As an example of traditional practice, there is no better showcase to
be found than to observe the work of the millions of people around
the world tied to subsistence agriculture. They are bound to a
system that – relative to other societies – has seen little change over
centuries.
Evidence suggests that farm workers in poor countries are not
themselves resistant to change – indeed they may respond rapidly
to genuine opportunities to improve their welfare – but that given
the circumstances in which they find themselves, their traditional
agricultural practices are in fact rational and efficient outcomes that
have evolved over generations of trial and error.
What goods does such a society choose to produce? Those that
experience shows to be the most reliable.
In farming some of the poorer lands on the planet, where
climatic conditions may vary, where ownership of land and one’s
place in society is traditionally determined and where government
is remote and as reliable as the wind, those who work the land tend
not to take undue risks. They produce therefore what they know
they can count on, using traditional technology that is home-grown
and suited to the terrain.
Traditional agriculture tends to be self-sufficient because it has
to be. To become dependent on a number of external suppliers in
poor countries is to risk losses when they fail you. And losses in
this context means not only losing crops or livestock but losing
your life as well.
Social custom therefore determines much of the economic
organisation that takes place in poor rural communities. What, how
and for whom production takes place is decided by traditional prac-
tices that have evolved according to the particular institutions of the
society in question. Within these given parameters, such economic
organisation can often be highly efficient – much to the surprise of
outsiders who expect to find backward or irrational production
techniques.
© 2004 Tony Cleaver

The disadvantage of tradition, of course, is that no matter how
appropriate established procedures are in their specific context,
customary ways of life rarely prepare their followers to cope well
with unprecedented changes (see Box 1.1).
El Salvador became independent from Spain in 1839 and for
some years thereafter the country remained traditionally agricul-
tural, with high birth and death rates, a small and stable
population yet with sufficient fertile land to provide for all with
no great extremes of poverty or wealth.
Standards of health and education were low in the mid nine-
teenth century but a British diplomat’s wife commented that, in
contrast with the major cities of England at that time, there was
nonetheless a striking lack of poverty in this Central American
republic. Land holdings were dispersed amongst the population
with all families having access to their own property or to
communal land, and a diverse range of agricultural goods was
produced to support domestic consumption. The economy was
basically one of self-sufficiency but with limited trade and
economic growth.
The latter half of the nineteenth century, however, brought
accelerating change. In a time of increasing world communica-
tions and trade, a growing El Salvador elite found in common
with others around the globe that there was profit to be made in
promoting exports. Most importantly, they found coffee.
Suddenly, the ownership of coffee plantations became the key to
wealth.
Families that started plantations found ways to increase the
areas under cultivation. Indian village lands, worked communally
for centuries, were said to be preserving a ‘backward’ culture
and came under threat. With no property rights recognised in
law, coffee planters bought them up, displaced the inhabitants
but offered only limited plantation work at pitifully low wages.
Box 1.1 El Salvador: a case study in the vulnerability of traditional
economic practice
© 2004 Tony Cleaver

M A R K E T A G R I C U LT U R E
Contrast all of the above to agricultural organisation in modern
market societies. Here, farms are typically located within a complex
network of supporting suppliers and outlets in time and space, from
which a wide range of inputs are purchased and to which outputs
are sold. Crop farmers use formulaic combinations of fertilisers,
pesticides and irrigation, employ agricultural machinery that is
regularly serviced and use skilled, hired labour. In animal
husbandry, there is similar dependence on bought-in feedstock and
veterinary and transport services. Such farming practices are
embedded in a modern, interdependent market society and they
could not survive without it.
What goods modern farmers produce depend on what prices and
profits they can gain from the market. Whether it be organic food-
stuffs or genetically modified crops, the market-driven producer
will farm that which brings in the best returns.
El Salvador was eventually transformed – economically, politi-
cally and socially. Coffee dominated the economy and those who
did not have coffee had little else. Land owning structures, land
use patterns, labour relations and the distribution of economic
and political power all changed. El Salvador is now a country
where economic growth has occurred – though its benefits have
been unequally distributed. Landless rural peoples have little
control over their destinies and so the only remaining ‘tradition’
which dictates what occupations poor people follow, what goods
they produce and how they produce them is the continuing tradi-
tion of economic powerlessness. Their choices today are in fact
more limited than in the past, thanks to the institutions that
have overturned earlier social custom and have re-shaped their
society.
Source: Burns, Bradford ‘The Modernization of Underdevelopment:
El Salvador 1858–1931’ reprinted as chapter 10 in Wilbur C. K. and
Jameson K. P., The Political Economy of Development and Under-
development McGraw-Hill 1996.
© 2004 Tony Cleaver

The production methods employed are similarly dependent on
market signals – where technical progress has brought down the
price of machinery, seed varieties and/or breeding stock, the farm
will be highly
CAPITAL INTENSIVE
. Alternatively, if the price of farm
labour is cheaper, farming practices may be less capital intensive
and more ‘hands on’.
Finally, the rewards to farming will be divided between
landowners, creditors, labourers and management according to the
rates of
RENT
on land,
INTEREST
on capital,
WAGES
or
PROFITS
that rule
in the market place. Certainly, if resources are not guaranteed the
going market rate – whether it be a worker’s wages or interest on a
loan – then the resource involved, labour or capital, will seek better
employment elsewhere.
Freedom to move is an essential pre-condition of any func-
tioning market and it is a key feature of this economic system that
distinguishes it from traditional and planned systems. Consumers
must be free to change their purchases, and resources their employ-
ment, if the market system is to work efficiently.
M
OBILITY
can only be meaningful, however, if people have effec-
tive choices. If there are no alternatives then there is little freedom.
Very poor people, in particular, may be unable to afford the glam-
orous variety of expensive products that are displayed on advertising
hoardings and similarly unable to afford the upgrading of skills that
might allow them to seek more rewarding employment.
For such reasons, certain governments in the past have
attempted to introduce planned systems that guarantee all peoples
in society access to basic essentials such as food, shelter, education
and health.
P L A N N E D A G R I C U LT U R E
A system of planning in agriculture was famously practised in
Soviet collective farms and Chinese communes in the latter half of
the twentieth century. Huge areas of land and millions of labourers
were employed to produce targeted amounts of foods to be distrib-
uted to the nation’s people at low,
ADMINISTERED PRICES
. Products
that arrived on the shelves in the cities were those that the planners
(not customers) ordered. Similarly, the type and quantity of
resources employed on the farms were those that planners dictated.
© 2004 Tony Cleaver

Private ownership of land, profit-maximising behaviour and the
ability of entrepreneurs to employ labour and determine the
working lives of others was prohibited. The state directed the objec-
tives of the collective farms/communes, gave the orders as to who
was working where and with whom and restricted the freedom of
individuals to do otherwise. While this may seem completely alien
to those raised in a world of democratic choice and economic plenty,
a system which guaranteed food supplies and certain employment
was extremely welcome to those who had suffered their absence.
What, how and for whom production takes place in planned
systems is decided by a hierarchical organisation where last year’s
achievements are reviewed, tomorrow’s requirements are identified
and orders are given to all levels throughout the economy to co-
ordinate production to meet the announced targets. Individual choice
thus becomes subservient to the needs of the society as a whole.
The paradox, of course, is that society is made up of individuals.
Thus a key disadvantage with centrally planned systems is that
beyond basic needs how can senior administrators know and make
provision for what every individual wants? The Soviet and Chinese
COMMAND ECONOMIES
additionally suffered from politically deter-
mined payment systems that destroyed incentives and ultimately
entailed that national outputs and incomes could not keep up with
Western standards. No nation-wide examples of centrally planned
systems thus survive today, although within market economies
some important and fascinating case studies are still to be found
(see Box 1.2).
The largest employer in Western Europe is the UK’s National
Health Service (NHS). It is a planned system of health provision
that aims to provide free access to medical services to all
Britons that require it. Set up originally in 1947, it is a huge
organisation that provides nationwide coverage with relatively
little competition from the private sector. The proportion of UK
Box 1.2 Britain’s National Health Service: planning in medical
services
© 2004 Tony Cleaver

national income spent on the NHS is much lower than that
spent on health by other developed countries and it is thus a
relatively efficient provider. There are a number of good reasons
for this: first, it is a state
MONOPSONY
: that is, an immense, and
only, purchaser of very large quantities of medical equipment,
drugs, doctors and nurses and so it can thus drive prices (its
costs) down. Second, it is a state
MONOPOLY
: a single, nation-
wide producer which is able to plan a network of hospitals and
health care services that can avoid wasteful duplication and
underemployment of resources. (Note finally, because it is a
public monopoly and not a private one, the prices it charges are
the very lowest it can get away with – not the very highest.)
In any planned system where consumers have little choice,
there can be problems of indifferent service on the part of the
providers. Insisting on professional standards and measuring
performance can go some way to alleviating this inherent disad-
vantage (applicable to state schools as well as hospitals) but
there is increasing insistence on making hospitals compete and
instituting patient choice in an attempt to improve efficiency and
simulate a
QUASI MARKET
in UK health care.
Another problem when you have a valuable service made
available to the public at next to zero price is excess demand.
Any one with any complaint goes to see the doctor. Since price
cannot be used to ration out the scarce supplies, distribution is
effected by executive decision. That is, some doctor, nurse or
hospital administrator must decide who gets served when. For
non-urgent medical treatment that tends to mean a long wait.
One other ongoing problem of the NHS is that it is dependent
on state funding (i.e. government taxation) and raises relatively
little revenue of its own. It is not free to sell its services at a
profit, nor can it divert resources to invest in those medical tech-
nologies which can guarantee the biggest financial returns.
Some may well argue that this is just as well – wealthy million-
aires who want cosmetic surgery cannot buy hospital time and
resources that could otherwise be used to treat penniless car-
crash victims. It does mean, however, that getting the money to
pay for the latest in high tech medical research means continually
bargaining for government handouts.
© 2004 Tony Cleaver

E F F I C I E N C Y A N D E Q U I T Y
In any context, whether it be how a whole economy functions, a
particular industry or just the operations of an isolated farming
community, judging the effectiveness of different systems of
economic organisation means considering issues of
EFFICIENCY
and
EQUITY
.
Just how efficient is the organisation in generating outputs,
creating wealth and improving welfare? And does its economic
activity result in a social order and distribution of benefits that we
can approve of and can defend on grounds of social justice/equity?
A beautiful and harmonious society may be perfectly equitable
but extremely wasteful and hopelessly inefficient in providing for
its needs – a community in peace but unable to fully feed its popu-
lace and lacking the means to defend itself against the ravages of
disease or foreign invaders.
Alternatively, the society may be a ruthlessly efficient produc-
tive machine, its shops full of a wide range of foods and
technologically advanced, sophisticated gadgetry – but based on
exploitation of the powerless and blighted by sections of the public
who are homeless, starving and capable only of thieving rather than
productive employment.
Clearly neither extreme is attractive. What is ideal is an
economy that combines both productive efficiency and social
equity.
The history of humankind is illustrated by the dramatic rise and
fall of empires and civilisations and the success or otherwise of
various experiments in social organisation – none more dramatic
Whatever the criticisms about the monolithic nature of the
state-run NHS, however, the over-riding objective of this planned
system has never been questioned – to provide an equitable
health service for all at no up-front price to the patient. What,
how and for whom medical services are provided is determined
by medical administrators, not by the purchasing power of
consumers.
© 2004 Tony Cleaver

than the immense changes witnessed in the twentieth century.
The last hundred years have seen wars, revolutions, economic
depression, the division of the world into opposing camps of capi-
talism and communism, increasing wealth of a capitalist minority
and finally the eventual collapse of the centrally planned, command
economies behind the ‘iron curtain’.
The process of evolution in the decision-making systems that
society has invented must inevitably continue. And as some systems
become extinct so others replace them. In the new millennium, what
has evolved as the most powerfully productive economic engine is a
predominantly market-based dynamo capable of astonishing accom-
plishments but whose worse excesses – most would agree – have to
be kept in check by the moderating influence of public authority.
The market model’s efficiency relative to other forms of
economic organisation has passed the ultimate test of outper-
forming all alternatives. It is on grounds of equity, however, that its
success can be questioned.
This chapter has already illustrated the great extremes of wealth
and poverty that exist amongst the peoples of the world. Over the
last century or so, these extremes have in fact widened at an
increasing rate as those communities which have found the formula
for increased economic growth have left behind those unable to
apply the same recipe for success.
But the inequities go further than this. Exponential growth in
economic activity has visited increasing damage on the natural envi-
ronment. Market systems that treat certain resources of the Earth as
FREE GOODS
(such as the oceans and atmosphere) have no incentive to
conserve them. The monumentally productive market engine uses
and abuses such free goods at will, dumps its waste products into the
skies and seas and it is only relatively recently in our history that
we have begun to understand the harm we have been doing to the
biosphere. Priceless (literally) flora and fauna are rapidly dimin-
ishing in number and we are thus reducing the planet’s heritage that
will eventually be passed on to our children.
If today’s standard of living is only supportable by depleting the
resources that are available for the future then
INTERGENERATIONAL
EQUITY
is being sacrificed.
Economist Kenneth Boulding characterised humankind’s industrial
activity as if it were operating within limitless frontiers – a ‘cowboy
© 2004 Tony Cleaver

economy’ played out under big skies and wide horizons where there
is plenty of space and resources for all. Unfortunately, the growth
of economic activity has now reached a point where the Earth is
better appreciated as a crowded spaceship – where oxygen and other
resources are scarce and some of the passengers are being more
selfish than others. None of us should now go round like Buffalo
Bill: burning the grass, shooting all the bison, using only a fraction
of the carcass and leaving the rest to rot.
Evidence of how far the Earth’s environment has been degraded
is still contested – some claim that we are doing irreversible damage
to the planet; others insist that such accusations are wildly exagger-
ated. There will always be some people who have a vested interest
in proclaiming one extreme or the other – all the more reason for
economists to get their sums right. Measurement of many of the
important variables is very often extremely difficult but here are
some data drawn from The Economist magazine and the environ-
mental pressure group WWF (The World Wide Fund For Nature) as
shown in Figure 1.3 and
Box 1.3
, respectively.
1700%
1400%
400%
World
population
World GDP
CO
2
emissions
80%
25%
5%
Forest areas
Blue whales
Tigers
Increase in last century
Numbers remaining today
Figure 1.3 Changes in population, output, emissions and native species
since 1890.
© 2004 Tony Cleaver

Less than a century ago, it is estimated that 100,000 tigers
ranged across all of Asia from eastern Turkey to the Sea of Japan,
from as far north as Siberia down over the equator to Indonesia.
Now, 95 per cent of tigers are gone and fragile populations
survive in small clusters in India, Indo China and Siberia. While
poaching for illegal trade in tiger body parts is a continuing
menace, the greater threat to the tiger’s survival comes from
loss of habitat and the consequent depletion of its natural prey.
Of eight tiger sub-species, three have become extinct in the
last fifty years: The Bali tiger, Javan tiger and Caspian tiger. Of
the others, the South China or Amoy tiger was estimated in 1998
to have a population of between 20 and 30 individuals only. Its
future looks bleak.
As habitats fragment, the surviving tiger populations become
separated from one another and a particular threat is then the
loss of genetic diversity. Tiger fertility is reduced, litter sizes fall
and cub survival rates decline.
The problem is that tigers compete with humankind in
populating some of the most fertile, resource-rich places in East
Asia. Look at Indonesia: having lost out in Bali and Java, the
remaining battle for tiger survival is taking place in Sumatra.
A similar struggle continues in Bengal, whose famously
beautiful tiger prowls the little remaining jungle in the Indian-
Bangladesh borders not yet colonised by people hungry for
economic development.
The painful reality of economics is illustrated here. Resources
are scarce. Natural habitats that support tigers can alternatively
support increasing wealth and welfare for human populations. It
is easy for distant critics living in foreign cities to cry out in
protest and insist that tigers are protected. Who is going to
protect the livelihood of millions of poor children in Sumatra or
Bangladesh? Only their parents who need the wood that protects
the tigers’ habitat . . .
Source: Threatened Species Account, WWF International, May 2002.
Box 1.3 Case study: Tigers at risk
© 2004 Tony Cleaver

O P P O R T U N I T Y C O S T
The most fundamental concept in economics is opportunity cost. If
you choose to use resources in one employment, then you must
sacrifice the opportunity to use them in some other way. It is an old
adage: you can’t have your cake and eat it.
This sacrifice is frequently described as a
TRADE
-
OFF
. For
example, if we use native forests to construct homes, build ships and
fuel the fires of industry then society must trade this off against
retaining the natural habitat for wild animals to roam free.
North West Europe used to be carpeted from end to end in
temperate rainforest. Very little remains today. There is no native,
unspoilt natural vegetation left in Western Europe that has
remained unexploited by man. Gone too are the bears, wild boar
and a host of other species that used to run wild in the forests.
But the trees felled in the past built the ships that first circumnavi-
gated the globe, founded the trade and provided the energy that
produced the modern industrial age. A much greater human
population has now largely replaced the animal population that
preceded it.
It is in the nature of economics that sacrifices must be made. The
issue therefore becomes one of being as efficient and equitable as
possible. Keep the opportunity cost of economic development to a
minimum so we do not have to trade-off too much of one to gain
more of the other.
The European lion may be extinct though we might yet find ways
to protect the Asian tiger. But there are no guarantees. It takes time
for society to learn to practise
SUSTAINABLE DEVELOPMENT
and, in the
interim, more species may still die out. The long term aim must not
be to preserve all existing species, however, since this would
inevitably preclude any further improvement of our own welfare.
The opportunity cost in this case would be prohibitive. The appro-
priate aim is thus to minimise environmental costs such that the
CAPITAL STOCK
of our planet is not depleted. The garden I bequeath
my children may therefore contain a different mix of flora and
fauna to that which I inherited but it should nonetheless retain all
its phenomenal fertility and productivity. Future generations are
thus not denied the opportunity to use the Earth in whatever ways
their ingenuity allows.
© 2004 Tony Cleaver

T H E M O D E R N , M I X E D E C O N O M Y
We live in a world of constant change. What consumers demand
today they discard tomorrow as tastes and preferences move on;
what producers find technically impossible this year is revolu-
tionised next year with the latest breakthrough. In such
circumstances, achieving the twin goals of efficiency and equity in
any economic system is a never-ending challenge.
Only the most flexible and fleet-footed economic organisations
will survive to meet this challenge, as is evident by the demise of
inefficient centrally planned Eastern European economies that
could not match the growing wealth of their western neighbours. It
is also evident in the economic stagnation of nations with
inequitable regimes in sub-Saharan Africa and elsewhere which
confine riches to a few and thus fail to harness the productive
capacity of most of their peoples.
Getting the perfect mix of market systems, government controls
and national traditions just right in any one country is frustratingly
difficult since there are an infinite variety of combinations and the
global economy is moving all the time. But, of course, it is just this
endless diversity that makes the world what it is and the study of
economics so fascinating.
There is a continual debate, in particular, over the extent to
which governments should intervene in markets. It must be empha-
sised at the outset of this text that markets need government and
could not survive without them – the art is in knowing just how far
to exert the guiding (corrupting?) influence of central authority and
examples will be given throughout the following pages to illustrate
this point.
That markets cannot develop without government protection is
easily demonstrated. Contrast the experience of a consumer trying
to purchase something as basic as a shirt in different cultures. In a
modern city store, the buyer would choose the selected item from a
range of alternatives on display – all carrying designated price tags
on cards which additionally provide information about the shirt
size, quality of cloth and design type employed. The customer next
takes the shirt across to the sales assistant and quite possibly hands
over a plastic card to effect a transfer of money from the
consumer’s bank account to that of the store. The buyer signs the
© 2004 Tony Cleaver

till receipt, picks up the packaged item and leaves the store. Sale
concluded.
In another culture the process may be very different. The
consumer enters the bazaar and is confronted with a wealth of
colourful alternatives, none of which appear standard. After a period
of indecision, one particular shirt perhaps seems attractive. An eager
stallholder – if not already present – soon arrives now and, recog-
nising a potential sale, engages in conversation with the customer
pointing out how wonderful this particular product is and how
astute his client is in picking out this item so soon. When it comes to
price, there is quite a debate. One party starts high; the other much
lower. In the process of
HAGGLING
, the eventual equilibrium price
emerges according to the bargaining strength and verbal acuity of
the participants. Payment is accompanied by minute examination of
the means of exchange proffered. If all goes well, the stallholder
accepts the cash and the customer moves away with his purchase,
wondering if what he has bought is as good as he hopes it to be and
whether the price will subsequently turn out to be exorbitant . . .
The physical characteristics of the shirt in both examples might
be exactly the same, though a case can be made for saying that in
the latter market place the customer has paid for the social interac-
tion as well as the product.
The economic reason for the differences described here relate to
the nature of institutional support for the markets in question. In the
second case, much time and effort is devoted to
CLIENTISATION
: the
process by which the two parties become known to one another and
their credibility established. Without the back up of a reliable
system of contracts and law enforcement, one party can always
cheat on a deal and get away with it. To overcome this, personal
credibility has to be established with a certain extravagant interac-
tion (hidden agenda: is the other worthy of entering into business
with?) otherwise the ‘price’ agreed upon will be all the higher to
compensate for the increased risk involved.
If the buyer distrusts the seller then the latter will have to pay
the ‘price’ of no deal or gaining less cash than he bargained for.
If the seller distrusts the buyer or his currency then he will charge
all the more. Better for both parties if they deal with each other
frequently and have already established a respectful relationship or,
failing that, one comes with the personal recommendation of a third
© 2004 Tony Cleaver

party who is known and respected by both. (Hence the importance
of extended family, or a patron, in such societies.)
Without the support of contract law, reliable currency and trust
that each is indeed the rightful owner of the property that is to be
exchanged, the market society in the second example – however
colourful and attractive to the tourist – cannot extend very far. The
TRANSACTION COSTS
and
INFORMATION COSTS
involved limit its scope
to personal trade only between recognised dealers. It is too costly,
too risky to engage in transactions with total strangers. This simple
market economy will never grow, therefore. It is, indeed, character-
istic of what goes on in villages and towns that are found
throughout the poorer countries of the world.
How much easier it is to buy products in a modern (albeit
impersonal) market economy. Both parties are assured that if they
are cheated they have recompense in law. With central authorities
providing the essential institutions to protect property and facil-
itate trade, risk is reduced and market dealers can get on with their
business.
Today people can purchase goods and services on the internet
which minimises transaction costs and allows greater expansion of
commerce. Dealing with strangers is quite normal; one-off trades
where you are unlikely ever to see the other party again do not
mean you are going to be exploited. Revealing details of your bank
account over the phone or on-line is so safe that it has become
common practice. It might be impersonal, but it works.
In fact, because it works, it has become more impersonal. Where
trust can be taken for granted, the market economy grows. And as it
grows it facilitates greater and greater economic specialisation,
interdependency and thereby wealth. You can book a foreign
holiday, buy the flight tickets, reserve hotel rooms, hire a car and
pay for it all without leaving your computer – safe in the knowl-
edge that the tickets will arrive in the post, the car will be waiting at
the foreign airport and the hotel room will be ready for you when-
ever you say. A range of specialised contracts have all been fulfilled
across different frontiers, not one party having personal knowledge
of the ultimate customer: you. Yet insofar as these trades are
successfully concluded, all dealers profit from the arrangement and
are encouraged to expand their businesses, offer more services,
employ more resources and spread the benefits ever wider.
© 2004 Tony Cleaver

F U R T H E R R E A D I N G
North, D. (1994) ‘Economic Performance Through Time’, American
Economic Review, Vol. 84, June pp. 359–68. This is a very accessible
article by a recent Nobel Prize winner of how institutions underpin
trade and how this accounts for the economic progress of North
America in contrast to the stagnation of South America.
Schultz, T. (1964) Transforming Traditional Agriculture, Yale
University Press. A classic text on its subject.
Wilbur, C. K. and Jameson, K. P. (1996) The Political Economy of
Development and Underdevelopment, McGraw-Hill. Not positive
economics but a provocative set of readings that emphasise the
exploitation of poorer by richer nations. Note the chapter on El
Salvador.
There is a powerful clue here to explain why some communities
grow rich and others do not. Where society has evolved institutions
to underpin markets and facilitate trade, wealth can be created.
Where such institutions are missing, markets do not develop and
wealth cannot grow. This is an important conclusion in basic
economics and one to which we will return.
Summary
• Economics analyses how societies choose what, how and for whom
goods and services are produced.
• Tradition, central planning or free markets can be employed as
mechanisms to organise production and distribution.
• The choices made and end results achieved by different economies
can be judged according to the efficiency and equity of the processes
involved.
• The real or opportunity cost of achieving any goal is measured in
terms of what has been sacrificed in achieving it.
• Wealth is created and economies develop insofar as market trade is
facilitated and enhanced by institutions that protect property, enforce
contracts and minimise risk.
© 2004 Tony Cleaver

World Wide Fund for Nature,
www.panda.org
. Again, not positive
economics but a source of selective information on environmental
matters.
World Bank,
World Development Report 2002:
Building
Institutions for Markets. The World Bank publishes an authorita-
tive report each year on a topic of economic importance, reflecting
the trends in current academic interest. This issue is recommended
if you want to read a more balanced reference on how markets
develop.
© 2004 Tony Cleaver

2
P R I C E S , M A R K E T S A N D
C O F F E E
Durham Cathedral soars above the centre of the old British market
town as it has done for almost a thousand years. But just down
the road from the Norman cathedral and the castle that defends it, a
new coffee shop has recently opened. Amongst the cluster of shops
and stalls which crowd Durham’s market place, this newcomer
has now opened its doors to tempt the passer-by with the pungent
aroma of fresh-roasted coffee. (At least it has at the time of writing.
By the time you read this yet another entrepreneur may well
have taken over the business and be displaying fashion wear or
computer games or some other such service, which attracts the
buying public!)
There are few places on Earth that are not touched by the
continual changes of market organisation. Humankind is a restless
species and is always seeking out new and better ways to produce
things, more and different goods and services to acquire. But by what
mechanism is it decided what is produced where, and by whom? How
is the organisation of society’s economic affairs carried out?
A hot cup of coffee is a perishable commodity: how come coffee,
milk, sugar, skilled labour, specific equipment and every other
resource necessary all arrive from their separate origins to deliver a
satisfying product to your hand just at the very moment you want
it? We take it for granted but a simple cup of coffee represents in
fact a complex coming together of a unique set of ingredients that
makes up a distinctive and time-sensitive product. Any breakdown
in the multiple chains of organisation that are involved in bringing
© 2004 Tony Cleaver

you this good will result in the costly failure to produce anything
palatable that anyone would want to buy.
Coffee from Colombia, sugar from the West Indies, milk or cream
from a British farm, a china cup and saucer from somewhere local
or distant (China?), water from the regional utility, an espresso
machine from Italy, local labour and enterprise, plus a variety of
other resources that go to make up the total experience of visiting
this coffee shop: who organises all these resource flows to bring you
a cup of coffee?
T H E P R I C E M E C H A N I S M
Adam Smith called it the Invisible Hand. He wrote in 1776 that
each individual’s pursuit of personal gain ensured that, in aggregate,
society’s wants are better met this way than if some philanthropic
enterprise had indeed set out consciously to organise the same.
Many economists have since shared this view. They argue that
the automatic functioning of unrestricted trade and free market
pricing will ensure efficient economic organisation that cannot be
bettered by the combined actions of any number of well-meaning
planners, administrators and public servants.
Prices make up the key signalling mechanism in a market economy
that indicates which needs are most urgent, which production strategy
should be utilised, who is to be employed and how much they should
be paid.
Suppose the tastes of the public change such that they are
increasingly interested in buying coffee and health-food sandwiches
and are tired of consuming additive-packed hamburgers and techni-
colour pizzas? Who is best placed to signal this to restauranteurs and
fast food producers – government planners or individual consumers?
In a free market, by the pattern of consumer spending, hamburger
bars and pizza parlours will lose sales and the owners of coffee shops
will be earning extra. Prices of those products out of favour may
well fall at first to try and tempt back more custom; prices of those
commodities in hot demand may well rise at first as competitive
bidding forces them up. But if consumer trends continue there will
be an irrevocable change in suppliers’ profits – out of the pockets of
loss-making hamburger sellers and into those of coffee shop keepers.
If they cannot continue to pay their costs (typically high rents in
© 2004 Tony Cleaver

city centre locations) then owners of the former enterprises will
want to sell up; owners of the latter may well negotiate to buy them
instead.
The range of commodities on offer in Durham market place, like
any other, thus automatically adjusts to meet consumer
DEMAND
. A
new coffee shop is just one small piece of evidence of how markets
evolve – the prices of products and profits of entrepreneurs
signalling the way that changes must go.
T H E A L L O C AT I O N O F R E S O U R C E S
In this particular example, as a result of changing consumer demand,
the employment of a number of specific resources was affected.
Consider, first, the small corner of land occupied by a hamburger bar
that converts to a coffee shop.
L a n d a n d Tr a n s f e r E a r n i n g s
Land in the centre of any market place is usually much in demand. A
fixed
SUPPLY
of land in a restricted area where many traders compete
to gain control of a given site means the price of this resource is forced
up and up. Though fixed in space, this land thus becomes extremely
OCCUPATIONALLY MOBILE
– it can be bought up and employed in the
service of a cafe, a retail store, a solicitor’s office, an estate agents’ or a
bank – according to whichever business is prepared to pay the
highest price. (Ever wondered why the centres of the largest busi-
ness districts are dominated by banks?)
Geographers can map the employment of land in cities going out
in concentric circles from the highest earning inner ring to progres-
sively less and less economically productive sites. A coffee shop
with a rapid turnover selling an attractive product to high-income-
earning inner city employees may well earn just enough to cover
its costly
OVERHEADS
. Typically, however, with high rents to pay
such enterprises are run on a financial knife-edge such that any
slight change in the quality of its product or in consumer prefer-
ences will have an immediate knock-on effect on profits and thus
the business’s long term survival as indicated above.
Land in city centres can therefore transfer its employment rela-
tively rapidly if it does not earn enough – which explains why so
many stores do indeed close down and reopen transformed in a new
© 2004 Tony Cleaver

guise and under new management. The same fate may also apply to
people but since individuals, unlike land, have feelings about the
work they do and can express their opinions vociferously, the allo-
cation and reallocation of their labour supply embraces many issues
that are not solely economic.
L a b o u r a n d Wa g e s
Nonetheless, precisely because the price and employment of labour
is such an emotive issue, we can take time here to briefly analyse
and understand the economic forces that determine outcomes in
this particular market.
Economics is a seemingly cold and cruel science that, like it or
not, treats labour just as any other resource. People will be employed
only in so far as they are productive. Generally speaking, coffee shop
assistants will be taken on if they possess the necessary skills, atti-
tudes and enthusiasms at a competitive price. Employment is not a
right. In a market society, any resource will only find it is in demand
if it can help produce something that consumers are willing to buy.
If this is the case, then as above, the scarcer the resource, the more it
will command a high price.
Scarcity is a relative concept. There are millions of footballers
all over the world but the supply of footballers of the specific
talents of individuals such as David Beckham are very few, relative
to the demand for their services. Hence such talent can command an
exceptional price.
M i s m a t c h U n e m p l o y m e n t
People can become amazingly specialised in the occupations they
perform. The degree of talent and training required to become a
professional in one employment or another varies enormously and
this in part determines the speed at which newcomers can enter any
particular labour market. Labour as an economic resource, therefore, is
divided and sub-divided into many non-competing groups. Someone
whose abilities do not match those skills in demand will thus be
unemployed – unless and until either the individual re-trains or
the jobs on offer change. For example, there may be a shortage in the
supply of accountants to balance the books of our coffee shop and
employing someone to do so may be very difficult (and therefore
© 2004 Tony Cleaver

expensive) if access to this profession is restricted. There may be a
large pool of willing and able workers who can be taken on as shop
assistants but even extensive unemployment of such labour will not
necessarily increase the supply, and bid down the price, of those
with differently honed skills and attributes. Increased specialisation
reduces the occupational mobility of labour.
D e m a n d - D e f i c i e n t U n e m p l o y m e n t
As mentioned above, the demand for a particular specialist service is
derived from the
DEMAND
for its product. In the extreme, in a severe
recession, a slump in consumer spending throughout the nation means
large industrial concerns may lay off all sorts of employees – white-
collar workers of rare skill as well as some horny-handed manual
labourers – if there is no demand for their joint product. This is large-
scale, demand-deficient unemployment. Governments may thus be
petitioned to provide support for those the market no longer requires,
but this can only be a short term palliative. If demand for one type of
product has moved on then the only long-term solution is for labour to
move likewise and produce something else. If rare skills are no longer
needed, the unemployed must learn others.
Te c h n o l o g i c a l U n e m p l o y m e n t
The substitutability of a specific resource also affects its price and
employment and this in turn is affected by technological change. The
development of telecommunications technology, for example, has
enabled Indian skilled labour to compete away UK and US based
service jobs. Call centres in Delhi can now replace those in Detroit or
Swindon. Similarly, the technological revolution in robotics means
there is no employment now for many assembly-line manufacturing
workers. (Note this is hardly a new phenomenon: The substitution
of labour by machines has been infamous since the time of the
nineteenth-century Luddites.)
D E M A N D , S U P P LY A N D T H E T H E O R Y O F P R I C E
Whether it be the price of coffee, the rent on land, a worker’s wages
or the profits of an enterprise, all are a measure of the demand
© 2004 Tony Cleaver

and supply of goods and services in a market society and these
prices signal to all and sundry the relative shortages and surpluses
that exist. Not only this, they also provide incentives for market
operators to respond and remedy any imbalances. Coffee in
demand? Its price will go up to ration out existing supplies and
meanwhile tempt new producers to enter the market. Falling profits
for hamburger bars? The least efficient will close down. Accountants
are earning high wages? More will take up the training. The price
mechanism is a ruthlessly efficient organiser.
Since prices are demonstrably at the heart of all economic organ-
isations it should be clear by now why economists focus so
repeatedly and relentlessly on the theory of price. If we can theorise
about what exactly determines price movements it enables us not
only to explain what has happened in the past, and why, but it also
gives us a basis for predicting what will happen in the future.
One comment on theorising before we begin: Milton Friedman,
probably the most famous economist entering the twenty-first
century, has said that no matter how abstract and seemingly unreal
the assumptions on which a theory is based, ‘the only relevant test of
the validity of a hypothesis is comparison of its predictions with
experience’. As you will see, though many assumptions in economics
make perfect sense (e.g. we assume consumers and producers
behave rationally) they are not necessarily true for all time. These
assumptions do not matter so much, however. In positive economics
we are most of all concerned about whether or not a theory’s
predictions are confirmed by hard evidence. So long as it produces
workable results, even the most unrealistic hypothesis must be
taken seriously. With that in mind, let us begin with analysing
demand.
Co n s u m e r E q u i l i b r i u m
Assume that all consumers wish to maximise their
UTILITY
, their
‘level of satisfaction’. They are thus motivated to consume that
combination of goods and services which, given their income, yields
the most utility. Individual tastes differ such that your preferred
shopping list features items totally different from mine – you
may prefer coffee and ice cream and I access to public parks and
© 2004 Tony Cleaver
footpaths – but in both cases we opt for combinations that best
satisfy our particular wants. A change in relative prices between
some goods and others or a change in our levels of income will
affect our chosen purchases but factoring in these changes we will
always adjust our consumption to maximise our total utility or
satisfaction.
Considering the demand for coffee, we can assume for the
purposes of illustration, that an individual divides his purchases
between coffee and all other goods.
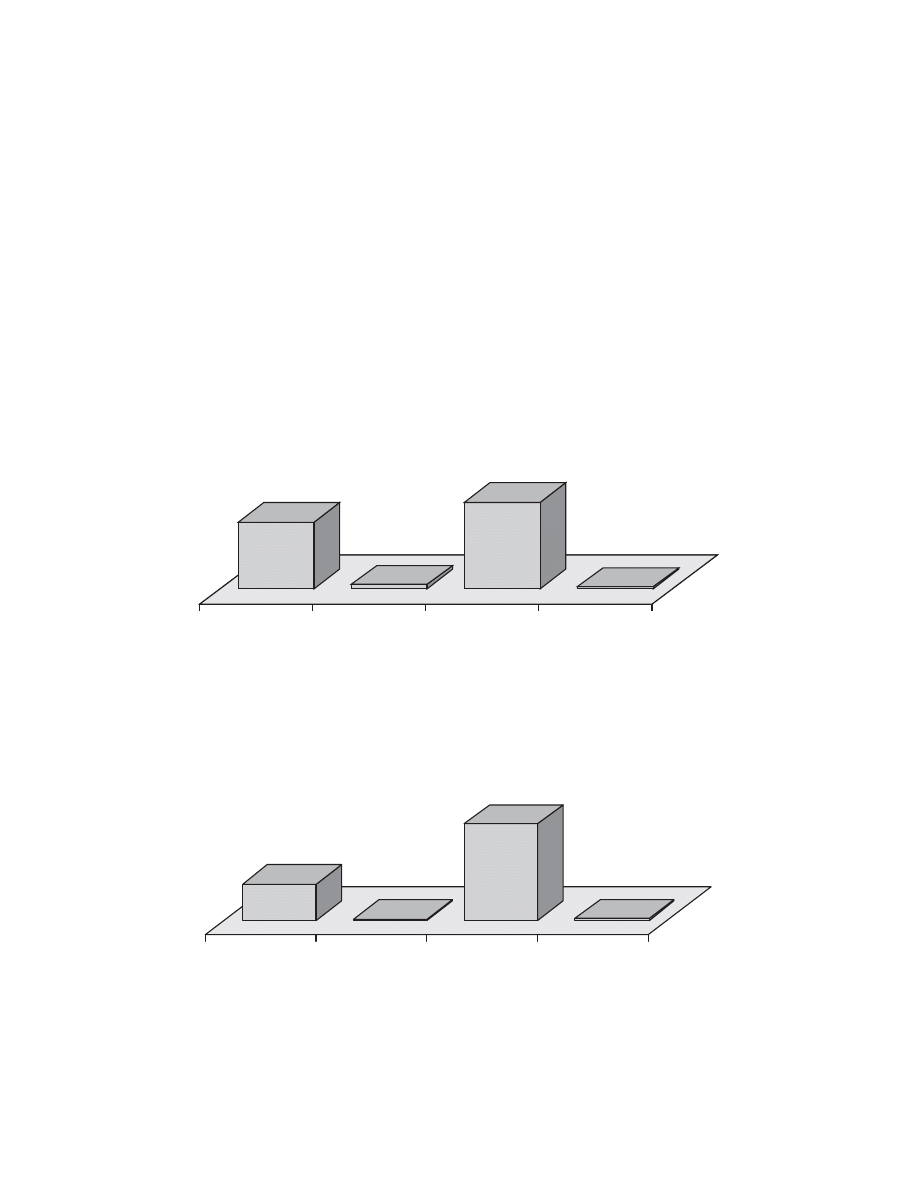
Given constant prices and incomes we can represent the choices
available to this consumer in the
OPPORTUNITY SET
given here.
Figure 2.1 shows that if a consumer spent all his fixed income on
coffee he could afford to buy amount A. Alternatively, if he spent it
entirely on other goods he could afford amount B. He thus has the
opportunity to buy any combination of coffee and all other goods
bound by the
BUDGET CONSTRAINT
triangle OAB. Given this oppor-
tunity set, the individual thus chooses that combination of goods
which best maximises his utility. Let that be at point x where he
would consume a2 of coffee and b70 of all other goods. He could
have chosen any other point along his budget constraint AB, such as
y or z, but we have said that combination x represents the highest
level of satisfaction for this individual. At this point, the consumer
is at equilibrium in the sense that he cannot rearrange his
purchases to reach a higher level of utility (
Box 2.1
).
Coffee
A
z
y
x
a2
All other goods
0
b70
B
Figure 2.1 Consumption alternatives: coffee and other goods.
© 2004 Tony Cleaver
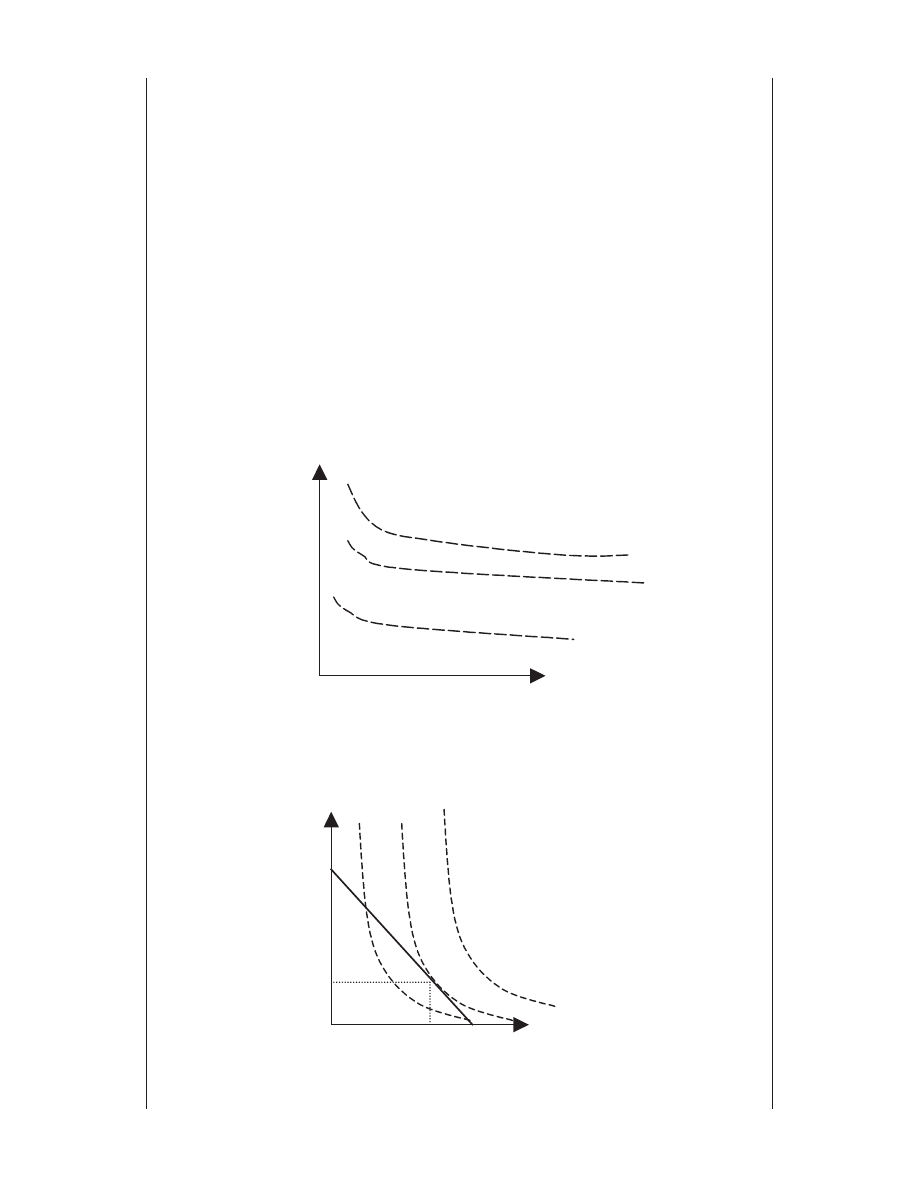
Box 2.1 Mapping individual preferences: indifference curves
Economists have invented a unique way to map an individual’s
tastes and preferences on a two dimensional diagram. It is
called an indifference map and it shows lines (similar to contour
lines on a topographical map) which illustrate higher and lower
levels of satisfaction and when taken together map out the
shape of a consumer’s preferences just as contour lines map out
the shape of the land.
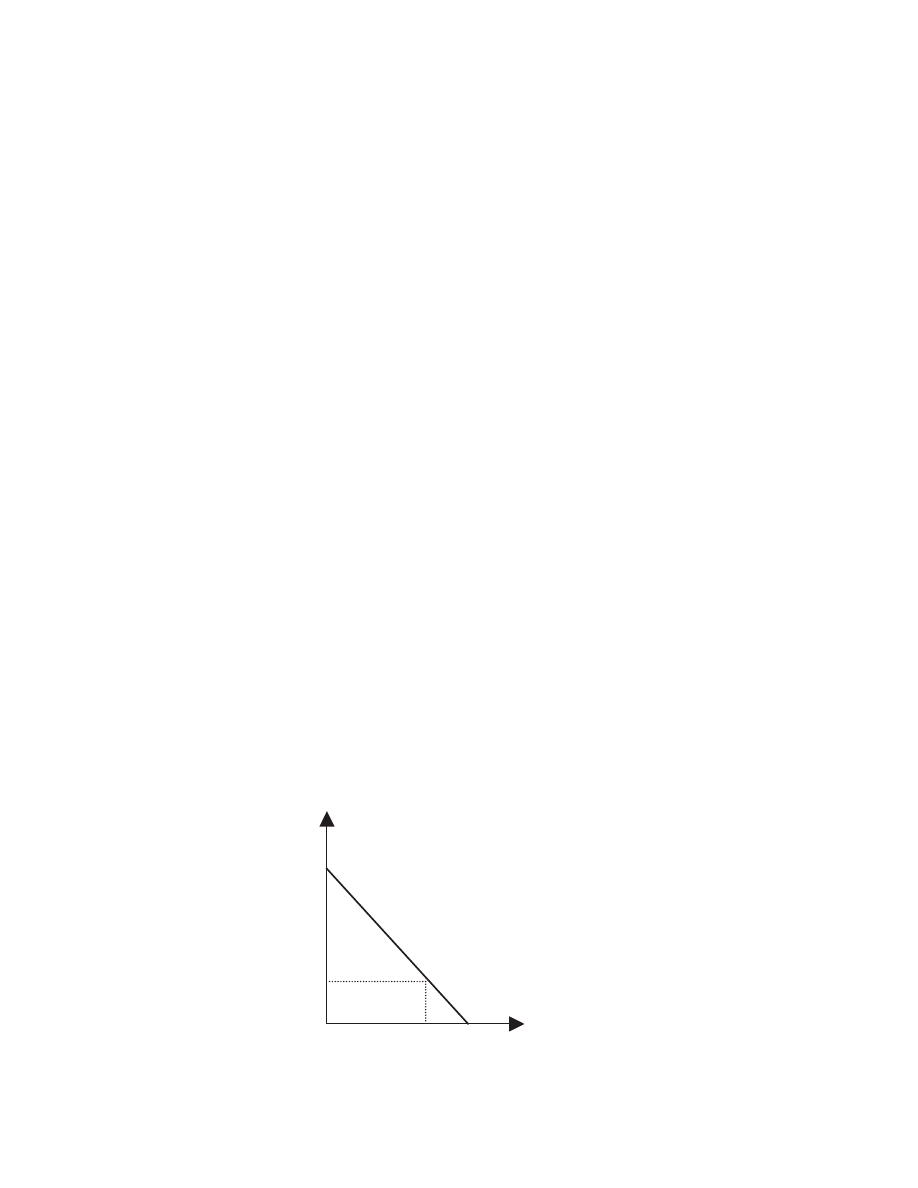
Consider the Figure 2.2. The map of indifference curves or
preference lines shows increasing levels of utility as consump-
tion of both goods increases from zero. The closer together or
further apart are the lines, the faster or slower an increase in
consumption leads to increasing utility. Any one line, however,
joins places of equal satisfaction. That is, the consumer is indif-
ferent between all combinations of purchases along the same
line. (Just as going up or downhill is represented by crossing
contours on a geography map, so maintaining the same level
means moving along a contour.) Thus the combination of coffee
and all other goods represented by consumption point G is
preferred to combinations E, D and C (and all are clearly
preferred to zero). But the consumer rates the combination of
goods at point F at the same level of utility as point G. He is
indifferent between these two combinations of purchases.
Figure 2.2 An indifference map.
Coffee
G
E
F
C
0
All other goods
D
© 2004 Tony Cleaver
Note that another individual might have a completely different
map of preferences between the two dimensions shown. It all
depends on individual tastes.
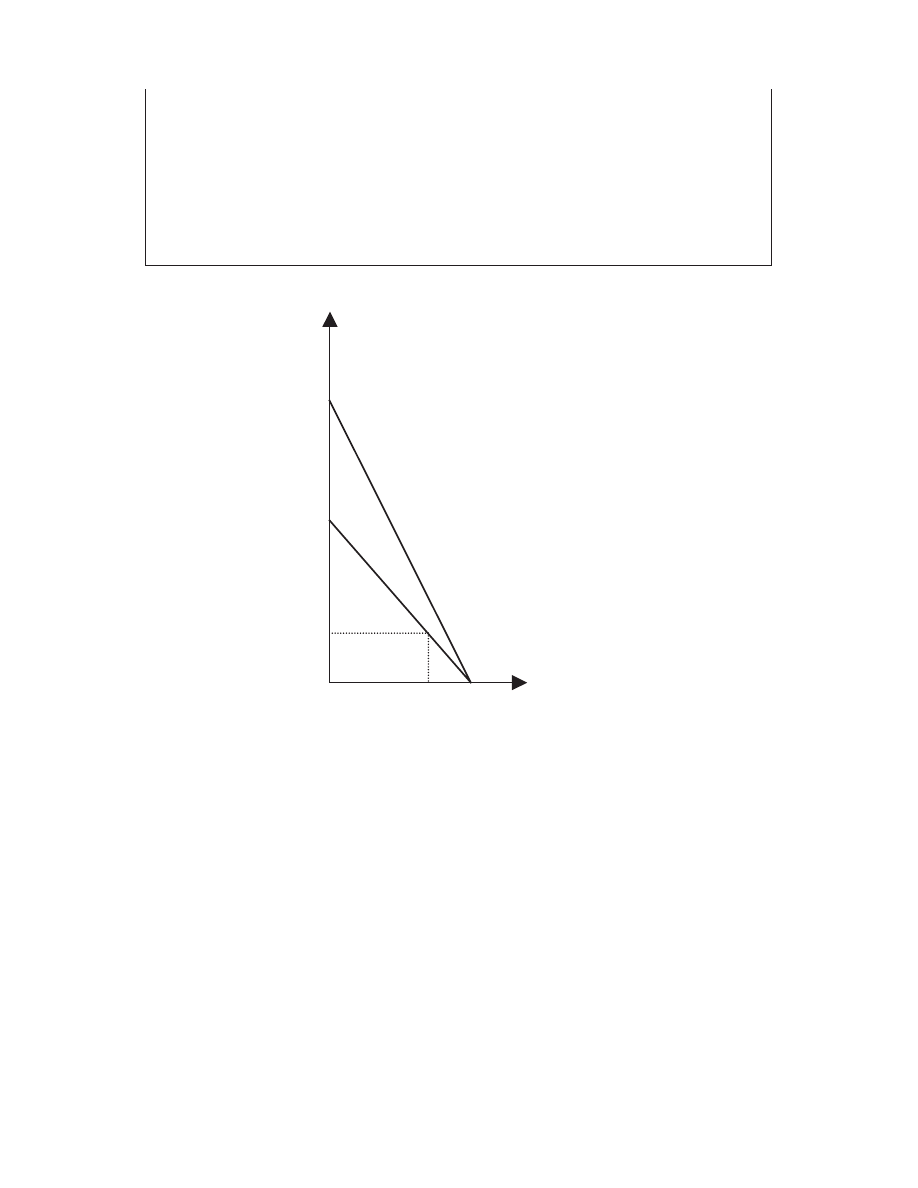
The combination points of goods, C to G, remain unchanged
here. However we are now illustrating, in Figure 2.3, the preference
map of a coffee lover who is indifferent between points C and D.
Only by increasing coffee consumption to point E or F (again he is
indifferent as to which) does his level of utility rise. G in this case
represents the highest level of satisfaction illustrated.
Returning to the original case discussed here, where the
consumer has an opportunity set constrained by his budget to
0AB, of all the possible combinations of goods that the consumer
can choose between, which one will the individual choose?
Figure 2.3 A coffee lover’s indifference map.
Figure 2.4 Consumer equilibrium.
Coffee
A
z
y
x
a2
0
b70
B
All other goods
Coffee
G
E
F
C D
0
All other goods
© 2004 Tony Cleaver
What happens now to this individual’s demand for coffee if its
price falls? Given his income, if he chose to spend it all on coffee he
could clearly buy more (represented by a move from A to C given
in Figure 2.5), though if he chose to buy no coffee at all then since
the price of no other good has changed he is still constrained to
point B. This consumer’s new set of choices made possible by the
price change is thus illustrated by the budget line CB.
Which consumption point will the consumer move to? It will be
that point which maximises his utility somewhere along the line
CB. Let that new equilibrium be point p. Note that although this
consumer’s nominal income has not changed, since the price of
Given his fixed income, he will choose that combination which
maximises his utility – that which allows him to reach the highest
level of satisfaction. That is, the combination of a2 and b70 repre-
sented by point x, which we can now see, courtesy of this
individual’s map of preferences, in
Figure 2.4
is clearly higher
than the levels of satisfaction represented by points y and z.
Coffee
C
A
q
z
y
p
x
a2
r
All other goods
0
b70
B
Figure 2.5 A price change.
© 2004 Tony Cleaver

coffee has fallen his
REAL INCOME
has risen such that he now has the
opportunity to increase his purchases of all goods as illustrated by
the additional sector ABC. According to this consumer’s preferences
he could equally choose point q or even r.
Different people have different preferences. A real coffee lover,
given the fall in price of coffee represented earlier, may choose to
Box 2.2 Diminishing marginal utility
If the price of coffee falls, exactly how much more would you buy?
Think about it. Doesn’t it depend on how much you have already,
and how much you value a bit more coffee compared to the cash
you would sacrifice in buying that bit extra? Generally speaking, if
you have already bought a lot of something, the increase in total
utility you would gain by buying more of it would be relatively
little. That is, your marginal utility has diminished. The more you
have something, the less you want more of it.
This important principle is true for all goods and services
consumed. Some people’s marginal utility diminishes more
slowly than others, however. A chocoholic, for example, will no
doubt be keener to consume more and more chocolate bars than
I will, but even an addict will find that the first item consumed
increases his total utility by more than that gained from the last
item consumed.
Given a price fall for a given product, an individual will
increase consumption until his marginal utility diminishes to
just equal its price – that is, the value of the cash that could be
spent on all other goods. Suppose this week, King Size Deep
Pan-fried Pizzas are on special offer: each one for £1. Assuming
you like these things, wouldn’t you buy more . . . up until the
point where the sacrifice of £1 (which you could spend on all
other things) is not worth it? The extra or marginal utility to be
gained from one more pizza purchase is now adjudged to be
less than the value of its price. Whether you knew it or not, you
have just reached ‘consumer equilibrium’ – where the marginal
utility per pound (or MU/£ ) on one item in your shopping list is
equal to that for all other items.
© 2004 Tony Cleaver
move from consumption point x to point q. That is, he or she may
choose to consume much more coffee and actually buy less of all
other goods. Alternatively at point r there is illustrated the option
of buying the same amount or even less coffee and buying more of
other things. Point p represents the choice to buy more coffee as its
price falls, all other purchases remaining the same.
The analysis in
Box 2.2
illustrates all the options open to one
consumer. Summarising, we can say that a price fall of any one
good that features in an individual’s regular shopping list repre-
sents not only the opportunity to increase purchases of that good
itself but also, since it represents a marginal change in
REAL INCOME
,
it opens the opportunity to alter purchases of other goods as well.
The more a certain good takes up an important slice of a person’s
budget, however, the more its price change will affect that indi-
vidual’s overall pattern of purchases.
M a r k e t D e m a n d
We can now move from the analysis of one individual’s consump-
tion decisions to consider the demand for one product from all
consumers added together.
Following a price change, if the decisions of all consumers in a
specific market for, say, cups of coffee are aggregated together we can
thus construct a market demand curve. There may be some individ-
uals whose decisions run contrary to all others (e.g. an individual who
chooses point r, in the analysis described in
Figure 2.5
) but their
influence on the overall market will be negligible. The normal
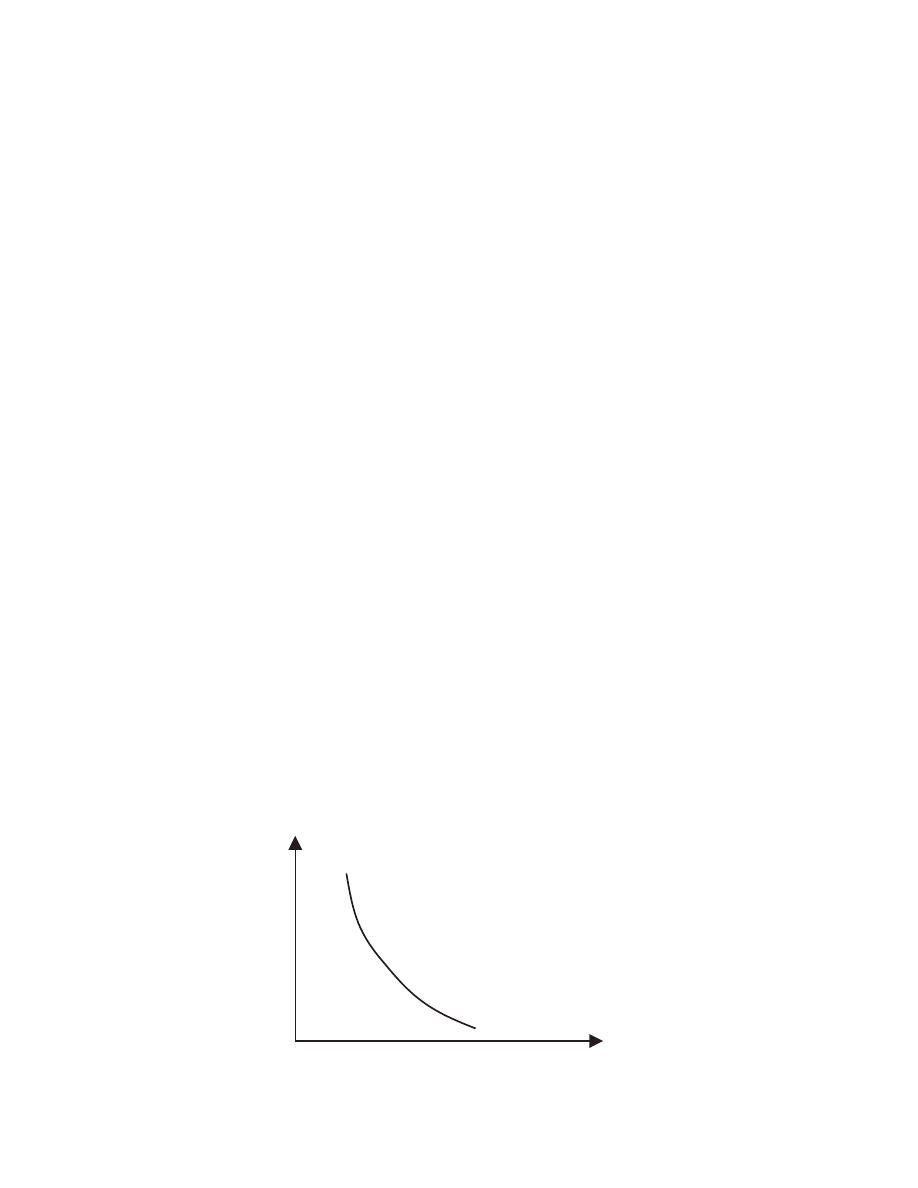
demand relationship is illustrated in Figure 2.6 – as the price of
Price
Demand for coffee
Quantity
Figure 2.6 Coffee demand curve.
© 2004 Tony Cleaver
Price
Price-elastic
demand
0
Quantity
Figure 2.7 Price-elastic demand.
Box 2.3 Calculating price-elasticity
Actually, since the flatness or steepness of any curve illustrated
depends entirely on how scale is represented on the vertical axis,
it is best to refer to the elasticity of demand mathematically. If a
5 per cent fall in price is met by a 20 per cent extension in
demand then we can say that demand is very price-elastic.
Elasticity is measured as the ratio of the percentage change in
quantity to the percentage change in price – in this case equal to
20/5 or equal to 4.
coffee increases, demand for it will fall, and vice versa, assuming all
other factors influencing the market remain unchanged.
The slope of the demand curve illustrated is important. It shows
just exactly how much demand will contract as price increases a
little or, conversely, how much demand extends as price falls.
The slope of the demand curve thus helps to represent the
responsiveness, or
ELASTICITY
, of demand consequent to a change in
price. All things being equal, the flatter the demand curve the more
responsive or price-elastic is demand. Figure 2.7 shows a situation
where a small change in price is met by a large change in the
quantity demanded (Box 2.3).
© 2004 Tony Cleaver

Generally speaking, the more one good can be substituted for
another in your pattern of spending, the more price-elastic it is
likely to be in demand. If Shell petrol goes up in price, for example,
and no other prices change then most consumers will simply switch
to alternatives such as BP or Esso. Demand for Shell oil is highly
price-elastic. If all oil goes up in price, however, then consumers
have no substitute for this vital commodity and market demand
may not change much at all in the short run. Demand for all oil is
price-inelastic.
S h i f t s i n D e m a n d
The analysis in the previous section has referred to price movements,
‘all other factors remaining unchanged’. But what factors other
than price have an important influence on market demand and how
do they affect the theory being developed here?
For any one commodity, a whole range of other factors can be
listed. World demand for coffee, for example, is affected by changes
in consumers’ incomes, by industry advertising, by collective fash-
ions, tastes and preferences, by competition from alternatives or
complementary goods, perhaps even by global changes in the
climate. Whatever the price of coffee, if any of these other factors
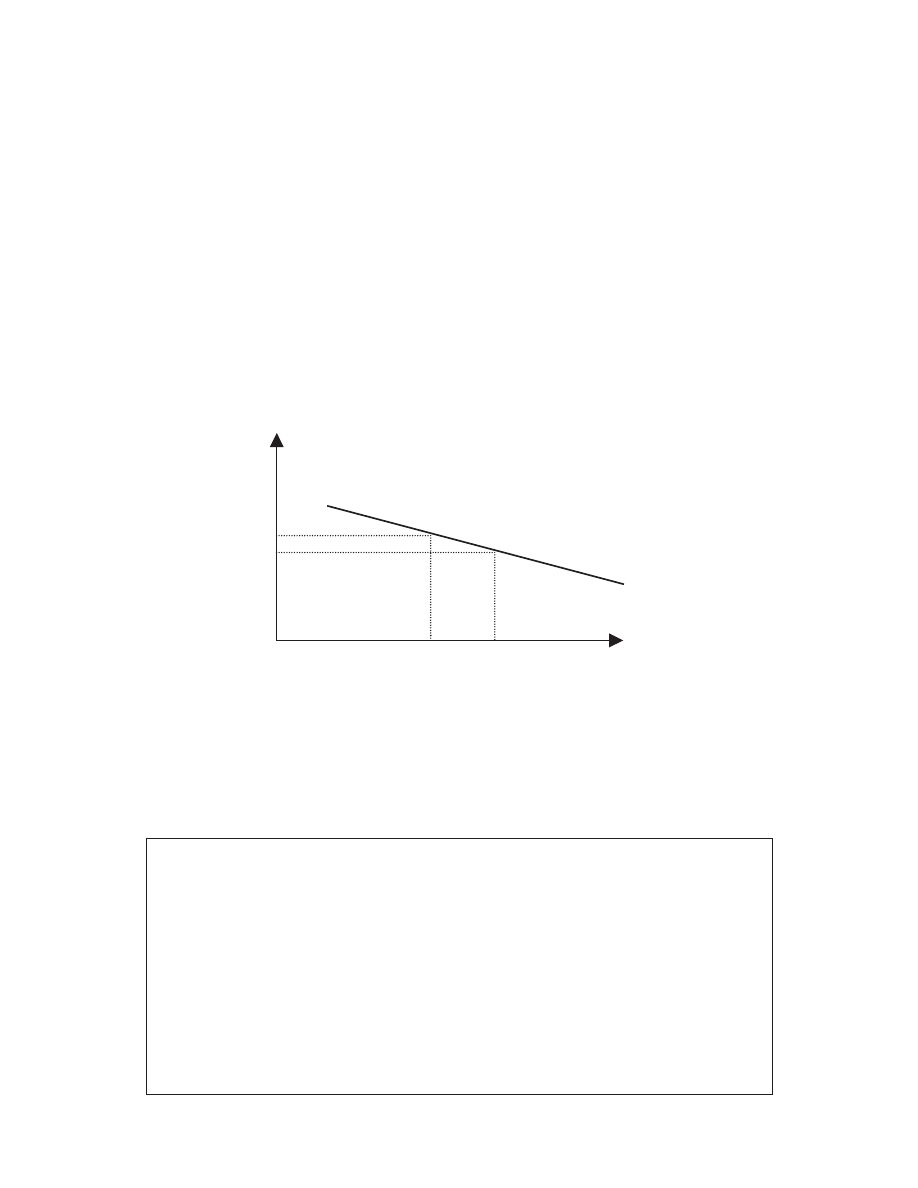
changes it will cause – to a great or lesser extent – a shift in demand.
Suppose, for example, the International Coffee Organisation
sponsored a successful, world-wide advertising campaign to
promote the consumption of coffee. Then, whatever the going
Box 2.4 Price-inelastic demand
You should be able to see that whereas goods and services that
are price sensitive have a ratio of price-elasticity greater than 1,
goods for which there are no or few substitutes will have a price-
elasticity of less than 1. For example a 400 per cent increase in
the world price of oil in January 1974 let to a minimal reduction
(say 6 per cent) in demand. That gives a ratio of 6/400 or 0.015!
Conversely, a steep demand curve illustrates ceteris paribus a
less responsive or inelastic relationship to a price change (Box 2.4).
© 2004 Tony Cleaver
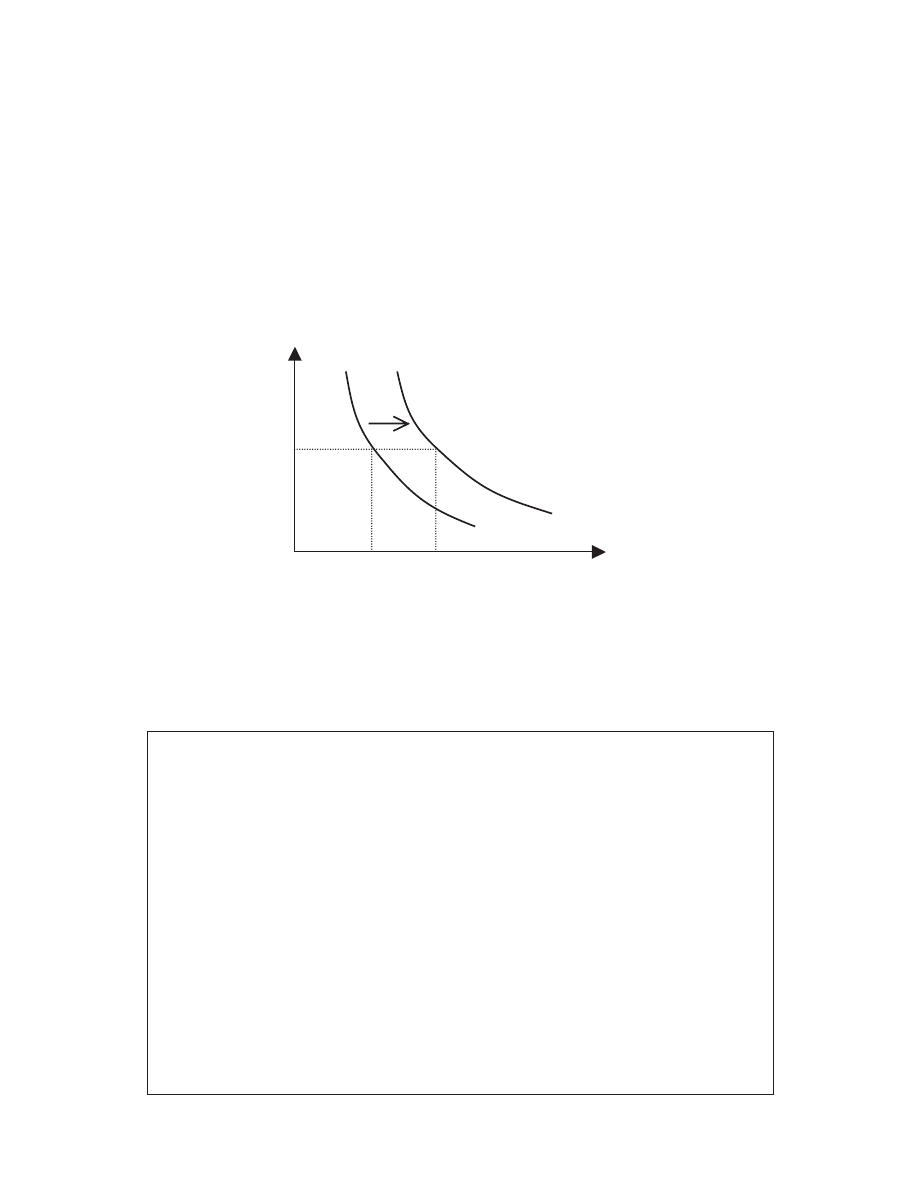
market price, we can expect that many more consumers would enter
the market and buy coffee. In Figure 2.8 at price P1, for example,
demand shifts from quantity Q1 to Q2.
Demand for coffee can change for any number of reasons, there-
fore. A contraction (or extension) in demand caused by an increase
(or decrease) in price is illustrated by a movement along the
demand curve. A fall (or rise) in demand caused by any
other exogenous change is illustrated by a shift in the whole curve
(Boxes 2.5 and
2.6
).
Box 2.5 Endogenous and exogenous changes
A two-dimensional diagram can only illustrate the interactions
between two variables – in this case, the effect of price on
demand. In this particular example, an increase in price is an
endogenous change, that is to say within the dimensions of the
model, and its effect can be studied on the dependent variable:
causing a fall in demand illustrated by a contraction along the
demand curve. A change in some other factor outside the
model, in this example advertising, is an exogenous change and
this causes the relationships between the two original variables
to shift. The distinction between endogenous (internal) and
exogenous (external) changes is important and will be referred
to continually through this text.
Price
P1
D2
D1
0
Q1
Q2
Quantity
Figure 2.8 A demand shift.
© 2004 Tony Cleaver
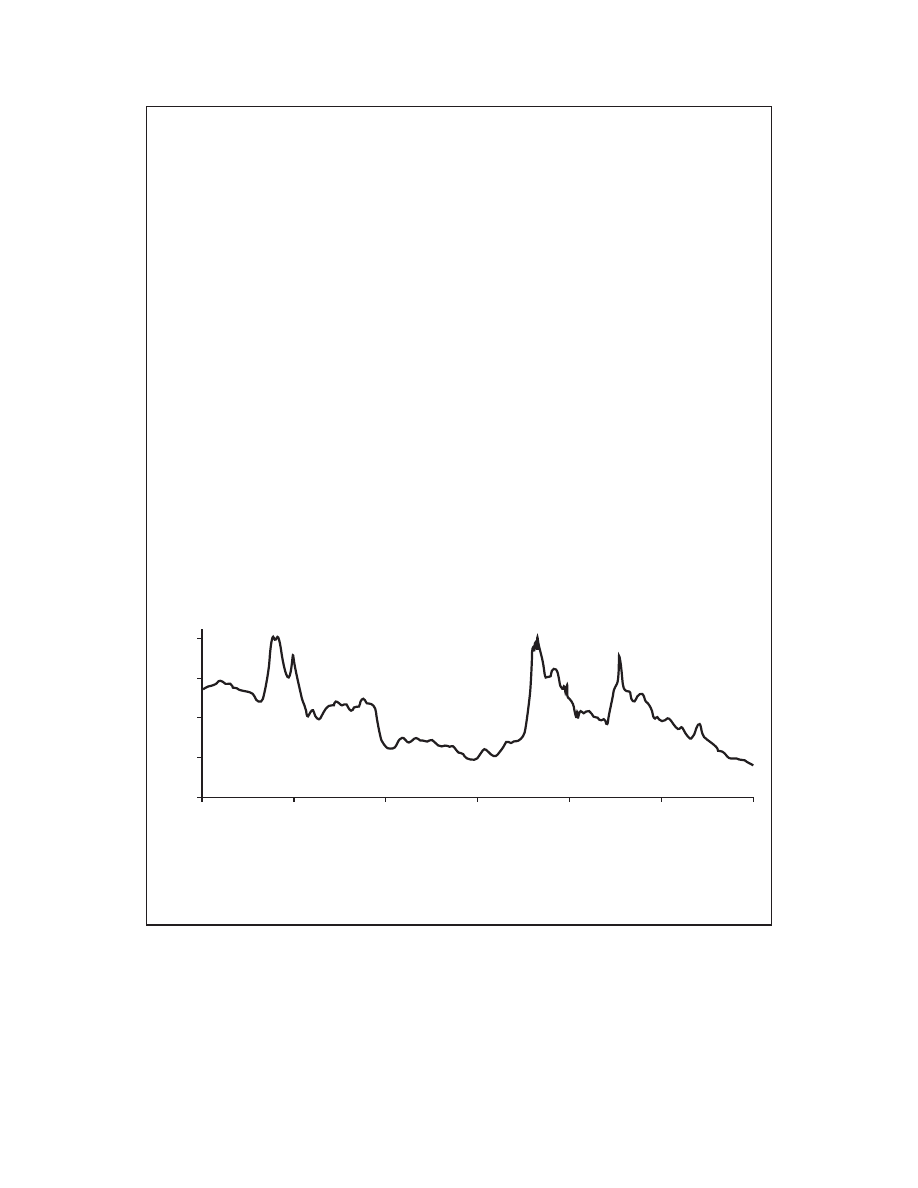
M a r k e t S u p p l y
The incentive for any business to supply goods to market is to make
profits – to sell his/her product at a higher price than the
COSTS OF
PRODUCTION
involved in offering it for sale. Whether it be a personal
service, such as providing haircuts, the assembly of a luxury motor
Box 2.6 Coffee prices: part 1
All this analysis may seem a bit pedantic but, as you will see
later on, it is actually important in separating out causes and
effects of major crises in world markets. A quick example should
help explain. Coffee is (after oil) the world’s second most impor-
tant traded commodity. The livelihood of 25 million small
producers and more than half-a-billion other people linked to
the coffee trade in poor countries is directly influenced by the
price of coffee. At the time of writing, the world price of coffee is
close to a 100-year low – depressing the incomes, and lives, of
millions. Additionally, prices over the last twenty years have been
very volatile – hurting particularly the smaller farmer who cannot
insure against risk.
Is the price low because world demand is low or has some
other factor caused the slump in prices? And what causes the
sudden and great reversals in prices and fortunes? This is not an
insignificant matter. Careful analysis is called for . . .
200
150
100
50
0
Oct-83
Oct-86
Oct-89
Oct-92
Oct-95
Oct-98
Figure 2.9 Coffee Prices, 1983–2002.
Source: ‘Coffee Market Trends’ Kristina Sorby, World Bank (June 2002).
© 2004 Tony Cleaver
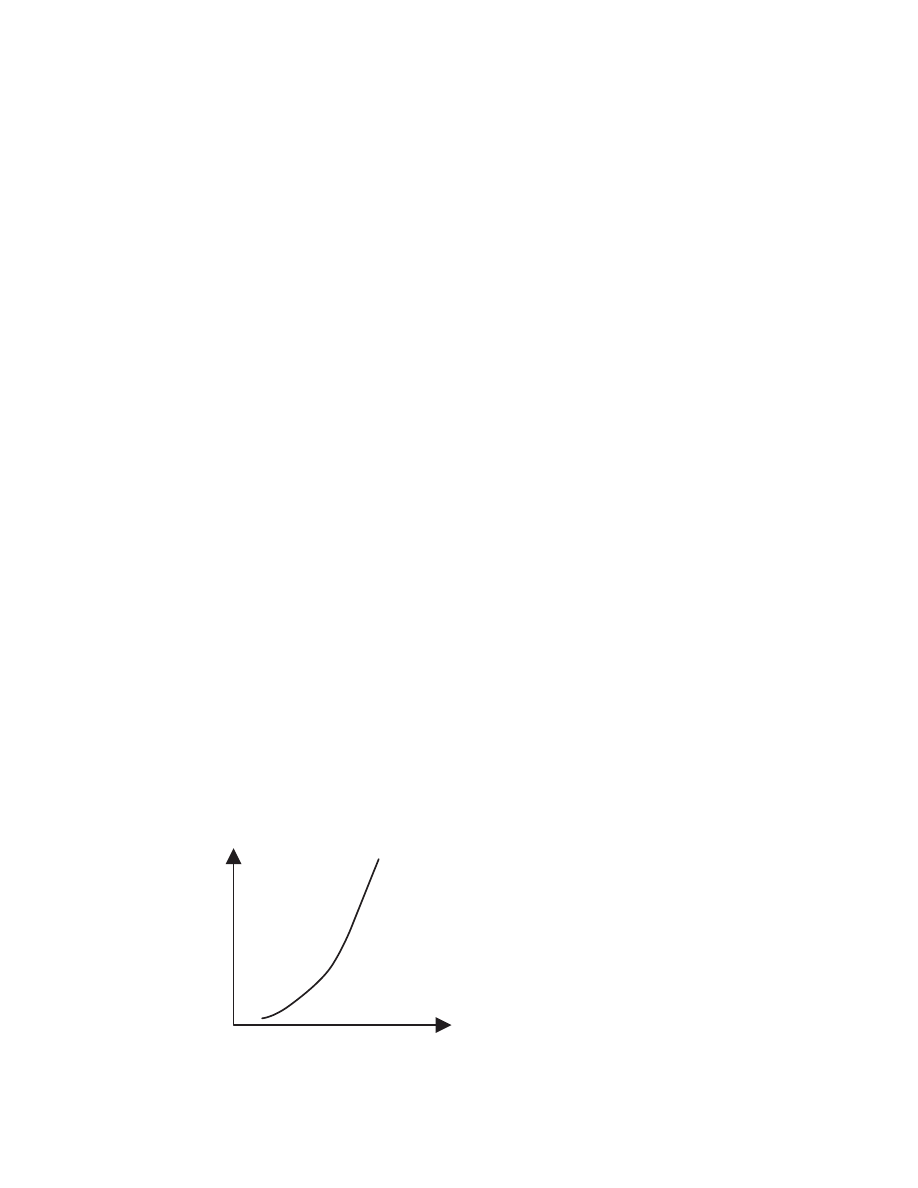
car with inputs from all over the world, or selling advertising space
on-line to invisible consumers, these goods and services will only be
supplied if the market price agreed on with the buyer sufficiently
rewards the entrepreneur for his/her efforts.
Assume that all suppliers wish to maximise profits. Given that
production costs and all other factors affecting the supply of a
certain good remain constant, then producers will increase supplies
to the market if prices rise. Conversely, supply will contract if price
falls.
There are many costs involved in offering coffee for sale in a
given market place. At low prices per cup, only the most efficient,
low-cost suppliers can afford to produce this beverage and the
quantities offered for sale will be limited. If consumers are willing
to pay higher prices, however, then other suppliers will be tempted
to enter the market and existing producers will also increase their
provision. At very high prices, businesses which had never previ-
ously thought of making this product may well switch production
plans and become coffee suppliers.
We can illustrate the relationship between the price of a product
and the quantity supplied by the supply curve S in Figure 2.10.
Note that, as before, the slope of the supply curve indicates the
responsiveness of producers to alter supplies as price changes. If, for
example, a small increase in price calls forth a proportionally large
increase in quantity then supply is said to be price-elastic. The
rather steep curve shown here illustrates the opposite: relatively
low price-elasticity of supply.
Price-elasticity of supply is affected by time – the longer busi-
nesses have to adjust production plans, the more responsive they
S
Price
Quantity
Figure 2.10 A supply curve.
© 2004 Tony Cleaver

can be to any market changes. A sudden increase in demand for
almost any product cannot be accommodated instantly, no matter
how high a price a customer is prepared to pay. Supplies of oil, cars
or coffee, for example are fixed by current stockpiles. If someone is
desperate to buy something then a high price may persuade another
consumer to leave the market (as in an auction) but supply itself
cannot be increased.
Over time, depending on the technology involved in production,
high prices call forth greater supplies. For oil, more may be pumped
out of the existing wells and refineries. More cars can roll off the
assembly line. In the case of coffee, if all existing stocks are already
committed, consumers will have to wait until the next harvest.
Typically, economists can identify three trading periods: the
instantaneous or
SPOT MARKET
, when supplies are fixed to existing,
identifiable stocks; the
SHORT TERM
when supplies are price-inelastic
and the
LONG TERM
when supplies are price-elastic (Figure 2.11).
The dividing line between the short term and long term is a
matter of judgement. The short term usually refers to the increase
in supplies that can be gained by relying on existing resources and
working them harder; the longer term tends to imply employing
more factors of production.
S h i f t s i n S u p p l y
What other factors than price affect supplies? A supply curve for
any good or service shows the distinctive relationship between
just one variable, price and the quantity of supplies that each price
will call forth to the market. As before, if any exogenous variable
Fixed
supply
Price-inelastic
supply
Price
Price-elastic supply
Quantities
(a)
(b)
(c)
Figure 2.11 Changes in price-elasticity of supply over time. (a) Spot market,
(b) the short term and (c) the long term.
© 2004 Tony Cleaver
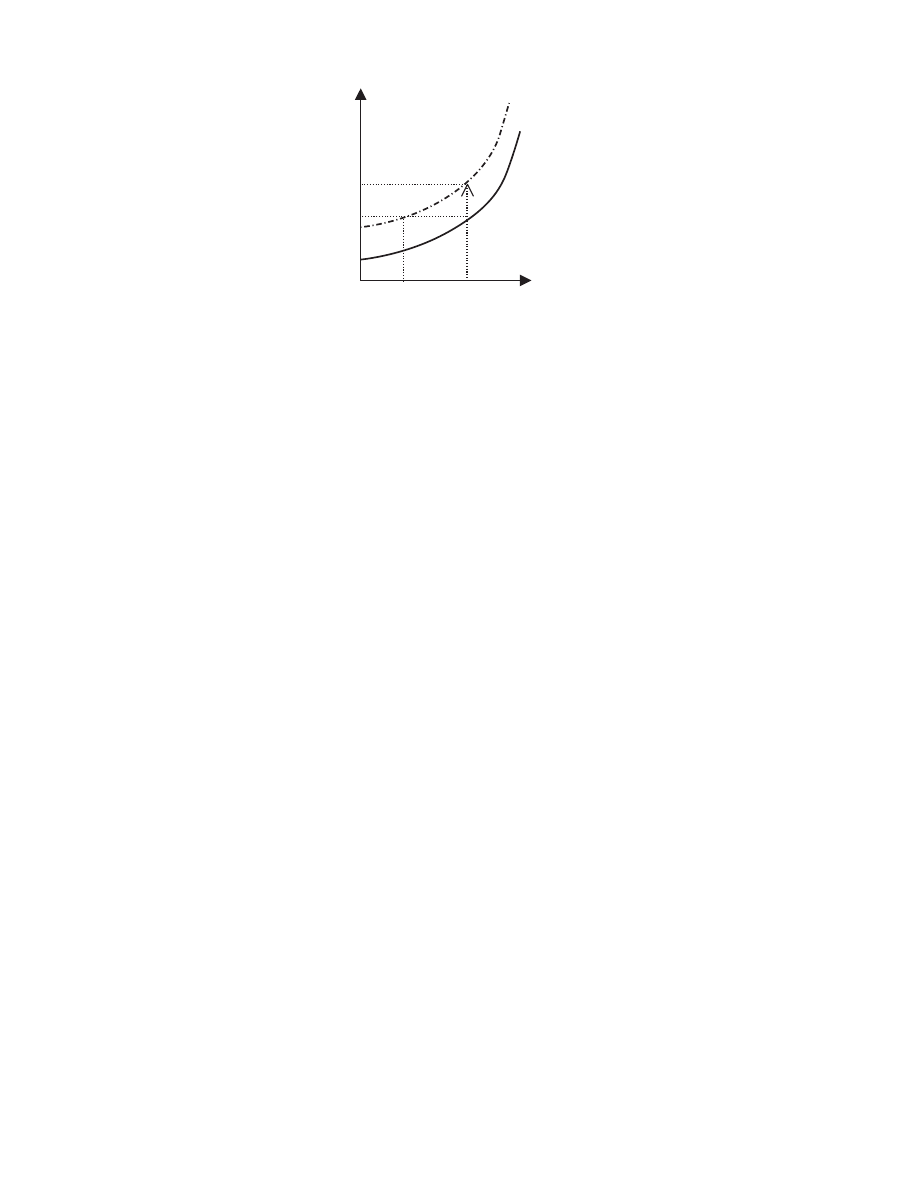
outside of this relationship changes then the original supply curve
will shift in its entirety – showing that at whatever price that existed
before, now at that same price a new supply relationship exists.
Any sudden change in production costs, say due to a technological
breakthrough or breakdown, an increase in wages, any transport and
distribution hold-up, will all effect a shift in supply (Figure 2.12).
Government tax and regulation can also affect supplies of certain
goods and services.
If a local brewery was prepared to supply quantity Q1 of beer to
town at a price of P1 and then the government raises the beer tax
by £x per pint sold then this will shift the supply curve as shown.
That is, the brewery will only be prepared to sell the same quantity
as before at a price of P1
⫹ £x. Equally, if they had to pay the tax at
the old price P1 then the brewery would only be prepared to supply
the much-reduced quantity Q2.
P R I C E D E T E R M I N AT I O N : A C A S E S T U D Y
We now have all the analytical components in place to complete our
theory of price. To recap, price changes signal how resources in the
economy must automatically re-allocate so as to match consumer
demand to potential supplies. How does this work? How are sudden
changes in market preferences or in production conditions accom-
modated in an economy and what are the implications for the
people involved?
Consider again the world market for coffee, which is the most
important agricultural commodity that is traded internationally and
Supply after tax
Price of beer
(per pint)
Supply curve of beer
0
Quantity
P1 + £x
P1
Q2
Q1
£x
Figure 2.12 A shift in supply.
© 2004 Tony Cleaver
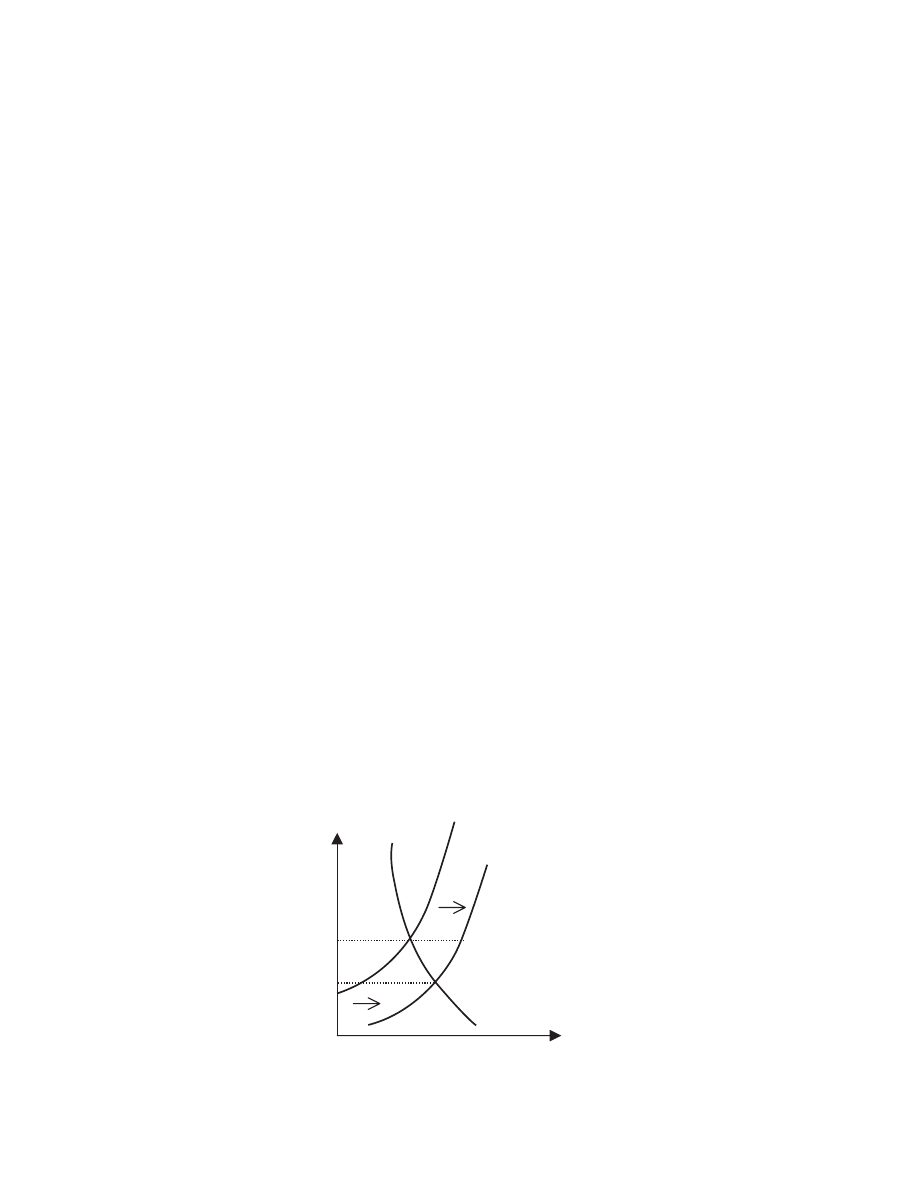
is currently exported from fifty-two countries. Since the mid-1990s,
world production of coffee has dramatically increased, mainly due to
continued expansion in Brazil and the recent entry of Vietnam as a
major producer with its new plantations now bearing fruit. (Coffee
production in Vietnam has increased 1400 per cent between 1990
and 2000!) Other big producers of coffee, such as Colombia, have
maintained stable or slightly falling supplies over the same period.
Global demand for coffee has not shown an increase on the same
scale as supply over the last few years. There is a change in consumer
tastes within the coffee market – in favour of more organic, environ-
mentally friendly products – but overall consumption has increased
hardly at all, relative to supply.
We can illustrate this in Figure 2.13 as follows. World demand
for coffee is stable and relatively price-inelastic as illustrated by the
demand curve shown. World supply is also relatively price-inelastic
and is illustrated by supply curve S1. Supply, however, is unstable
in that Vietnam’s drive to increase exports and incomes at home has
meant increased efforts to plant and produce coffee. The supply
curve therefore shifts to S2, there being no reduction in supplies
elsewhere in the world.
At the old price P1, the world demand for coffee is represented by
the distance P1A. World supply is now greater and equals P1B. With
an excess supply of AB in world markets, the price will be under
pressure to fall. As it does so this induces some extension in demand
(an increase in quantity illustrated by movement along the demand
curve from A to C) and simultaneously some contraction in supply
(movement from B to C). In time, a new market equilibrium will
Quantity
Demand
Price
S2
S1
A
B
C
0
P1
P2
Figure 2.13 Prices in the world coffee market.
© 2004 Tony Cleaver

evolve at C at a lower price P2 and a small increase in the quantity
of coffee traded, equal to P2C.
Note that so long as the demand curve is stable and price-
inelastic (relatively steep) then relatively small shifts in supply (due
to sudden increases or decreases in coffee harvests) will cause rela-
tively large changes in price, as shown earlier. The irony is that for
small producers who are anxious to increase outputs and increase
their incomes, if they are collectively successful then the result of
their efforts is to drive coffee prices down a long way – thus signifi-
cantly reducing their incomes! Individual farmers may not increase
production so much themselves, but they are dependent on world
markets and as prices fall, they and their family will face increased
hardship, if not actual poverty.
In this example, the chain of events has been as follows: a change
in the factors affecting production (sudden entry of a new, large
producer) has caused excess supplies, which has pushed down the
world market price and this has called forth just enough increased
demand to buy up the excess.
The truth is that almost all agricultural markets are vulnerable
to sudden fluctuation brought about by exogenous shocks. Good
harvests can produce bumper crops one year, which push prices
down, or another year natural disasters can decimate production,
causing prices to soar. Farmers have uncertain incomes, therefore,
and the ill fortune which visits one family and destroys their crop
may push up prices and reward another lucky enough to escape and
bring their supplies to market (see
Box 2.7
).
Sudden shocks in supply conditions are common in agriculture.
In contrast, movements in consumer demand tend to be less
frequent and more long-drawn-out since peoples’ consumption
habits are typically slow to change. The final example for this
chapter looks at the effects of one such development in demand – the
environmental movement.
Although it has been mentioned that aggregate world demand
for coffee has been stable over recent years, there has nonetheless
been a swing within the market towards purchasing the product of
more sustainable agricultural practices. The World Bank estimates
that demand for certified organic coffee is currently increasing
at around 15–18 per cent per year. Such a demand is delivering
a considerable price premium to the farmers involved.
© 2004 Tony Cleaver

Consider the supply conditions for traditional, smallholder
coffee, grown on mountain slopes at the interface between primary
tropical rainforest and cleared agricultural land. Such coffee natu-
rally grows in the shade of a forest canopy that supports a rich flora
and fauna and is not uncommon for many small farms in Central
America. Some investment will be required to have this traditional
practice certified as ‘organic’ or ‘shade-grown’ but the benefit for
the smallholder of such certification can be illustrated as seen in
Figure 2.14
.
Box 2.7 Coffee prices: part 2
In reality, all sorts of factors change all the time so that prices
are constantly on the move. In 1997 a severe drought in Brazil
destroyed a large fraction of the coffee harvest which caused a
sudden peak in world prices (see
Figure 2.9
). Since then
however supplies have steadily increased and prices fallen to an
all-time low, as already explained. The International Coffee
Organisation report that world production in the crop year
2001/02 totalled 109.8 million bags, rising to 120 million bags in
2002/03. This data compares to a relatively stable demand, esti-
mated at 108.3 million bags in 2002. No wonder that prices
slumped!
Predictions for the future, however, indicate cutbacks in
production. This is so particularly in Brazil for the following
reasons: First, there is a biennial production cycle which means
that very good harvests are normally followed by poor ones.
Second, recent low prices, earnings and profits in the planta-
tions have meant maintenance difficulties which inevitably
depletes future production potential. Last, there has been a
recurrence of drought. Add to this contractions in production
predicted for other countries where agricultural costs have also
risen whilst coffee revenues have fallen and the outlook for world
prices looks uppish. The forward shifts in supply illustrated
earlier which have caused prices to fall should be followed by
shifts back in supply to return the market to close to where it
was before. Farmers are hoping for higher earnings.
© 2004 Tony Cleaver
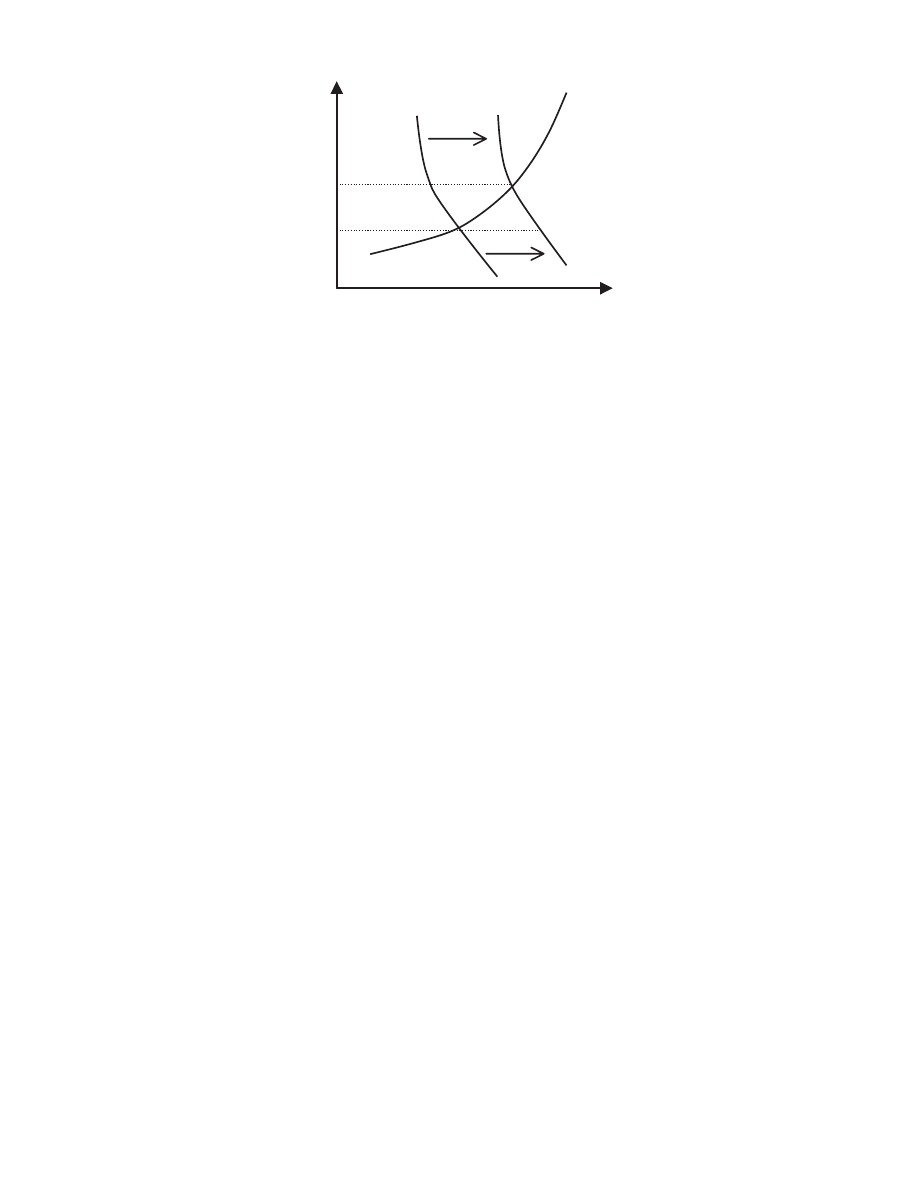
Assume the supply of smallholder coffee increases with price as
indicated by the standard supply curve shown. Demand in the
market place is given at first by the demand curve D1 but, over
time, there is an increasing growth in consumer preferences for this
traditional, environmentally friendly product such that demand
shifts to D2.
If the old market price, P1, were to persist, supply would equal
the distance P1M but demand would now exceed this, at P1N. The
excess demand MN would force the price up in the market to a new
premium price P2. Such a price induces more smallholders to enter
the market, to certify their product and increase the supply of this
sustainable coffee, corresponding to a movement along the curve,
MR. Meanwhile, the price rise from P1 to P2 has reduced the
demand somewhat, illustrated by the move NR. The new equilib-
rium quantity of coffee now traded has grown overall to the amount
represented by the distance P2R (
Box 2.8
).
Thus we see the effect of changing consumer demand, transmitted
by higher prices, signalling to producers that increased earnings and
profits can be had by switching agricultural practices to more envi-
ronmentally friendly techniques. By such market mechanics, induced
by the ‘invisible hand’ of the price system, both the wishes of
consumers and the needs of the planet are efficiently met.
These are the workings of the price mechanism – an automatic
device that operates to balance supplies and demand for all goods
and services marketed. There is no national or international govern-
ment or bureaucracy involved, no official targets set and orders
Supply
D1
D2
R
M
N
Quantity
Price
P1
P2
Figure 2.14 Demand, supply and price for sustainable coffee.
© 2004 Tony Cleaver

Box 2.8 Sustainable coffee
The World Bank Rural Development Department identifies
different standards of sustainability: organic coffee, which is
grown without synthetic fertilisers and pesticides; shade-grown
coffee, farmed under a forest canopy which provides different
species habitat; and fair trade coffee which guarantees minimum
prices and a living wage for poor farmers when world market
prices are low.
To qualify for certification in any of these categories, farmers or
small producer co-operatives must establish appropriate moni-
toring and documentation of their agricultural practices for a
number of years. This can be an expensive process. Investment
in these procedures is essential however both for convincing
buyers that their product is genuinely complying with sustain-
ability criteria and to ensure a high quality taste. Gaining access
to high value markets is the key to success. This is critical if
producers are to reap the rewards for the costly and time-
consuming expenditures necessary to certify their product. A
substantial reduction in yields (down by 66 per cent!) can be
expected at first if farmers switch from high chemical inputs to
organic or shade-grown methods. Studies show that it may take
up to five years for yields to recover. The longer-term pay back will
be high since environmentally beneficial practices do not exhaust
the soil, but in the meantime punishing costs must be endured.
Provided marketing links can be established, long term contracts
with coffee buyers in niche European and North American
markets can ensure access to significant price premiums that can
generate high farm incomes, even if yields are lower. There are
external benefits too. Higher farm incomes mean that the exodus
of young people to city slums in poor countries is reduced, as is
the temptation to farm illegal crops. Additionally, the process of
certification and the requirements of village level organisation
together promote entrepreneurial practices that have a direct
educational and developmental benefit that may impact on a wide
range of rural activities. Environmentally sustainable farming thus
may produce a sustainable rural economy.
© 2004 Tony Cleaver

given – other than private contracts signed to purchase supplies and
promise payments. The prices paid and earnings gained are not
designated by some central authority and any changes that take
place are not necessarily planned or co-ordinated – they are
solely the outcome of privately agreed deals between buyer and
seller. But the result is that due to the combined efforts of dealers
all pursuing their own interests we can buy a decent drink at an
affordable price in a local coffee shop.
The free market may, as we have seen, reward people sometimes
arbitrarily and, according to its critics, unfairly (we will return to
this theme in a later chapter) but the system works and adjusts effi-
ciently to exogenous shocks that are part and parcel of the world we
live in. It signals where people can work for profit, which produc-
tion techniques are best employed and what goods and services
serve society’s needs most. Quite some mechanism!
Summary
• Resources transfer their employment in response to price/income
signals, subject to their occupational mobility.
• Consumers buy those goods and services that maximise their utility,
subject to income constraints. A change in price of any one good
that a consumer purchases represents a marginal change in real
income such that it may effect a change in consumption patterns of
this good and/or others.
• Demand or supply for any good is said to be price-elastic if it is very
responsive to a change in price; price-inelastic if not.
• Other factors which affect demand for goods can be consumers’
incomes, tastes, advertising, etc. Other factors affecting the supply
of goods and services can be sudden changes in costs or technology
or exogenous shocks and disasters.
• Any change in the factors affecting market demand or supply will
trigger price changes and thus a reappraisal of consumer and
producer decisions.
• A market society thus automatically responds to consumers’ wishes
and exogenous shocks, and in so far as people want to buy environ-
mentally friendly produce so the economy will react to those
demands and evolve more sustainable production practices.
© 2004 Tony Cleaver

F U R T H E R R E A D I N G
Friedman, M. (1953) Essays in Positive Economics, University of
Chicago Press. This is a very readable classic on the philosophy of
economics by the subject’s most famous and distinguished exponent.
The following are useful if you wish to follow up my references on
the economics of coffee:
International Coffee Organization, Coffee Market Reports,
www.ico.org
Sorby, K. (2002) ‘Coffee Market Trends’, World Bank background
paper, June.
World Bank (2002) Agriculture Technology Notes, No. 30, June.
© 2004 Tony Cleaver

3
T H E B U S I N E S S O F S U P P LY
It is now time to analyse in more detail the factors that influence
the supply of goods and services to market. How are resources
organised in production and what are the economic constraints
involved? How do costs and revenues impact on prices and outputs,
and how does the state of business competition affect a firm’s
decision-making? First of all, however, consider the very foundation
stone of a market society.
P R I VAT E P R O P E R T Y
Private property rights represent a fundamental building block of
modern, developed economies. Being able to define what is mine
and what is yours enables us to trade, agree prices and thereby
organise the allocation of society’s resources. Property rights are
thus an essential starting point – if we cannot agree ownership
today, we cannot bring together diverse resources, invest in produc-
tion and distribute future rewards according to some arranged
formula.
Peruvian economist Hernando de Soto has argued that what holds
back people in poor countries is lack of legal title to the assets – land
they live on and buildings they have constructed – they informally
possess. Because their possessions are not legally recognised, people
are not willing to pool capital and start a business. The risk is too
great: they may lose what little they have and then have no legal
© 2004 Tony Cleaver

In modern capitalist states, however, one of the most important
socio-economic inventions that underpinned the Industrial
Revolution and drove subsequent economic growth was the
creation of the
JOINT STOCK COMPANY
. Large numbers of owners of
relatively small amounts of capital could together pool their assets,
pledge this stockpile as security to raise even more in the form of
bank loans and thereby equip a large factory, a ship or some other
productive enterprise capable of securing future profits.
Not that production needs always to be on a large scale. But
whether large or small, business cannot be conducted without rules,
without contracts enforceable in law. A promise to deliver a given
supply at some time in the future must be kept if economic organi-
sation is to be successful. If people do not trust one another to
complete a deal then no progress can be made. Everyone would
have to provide everything for him or herself since no one else
would be relied upon to fulfil their part of the bargain. What stan-
dard of living could you then aspire to if you had to provide for all
your own shelter, clothing, food and transport – let alone other, less
urgent needs? Yet, this is precisely the reality faced by many in
societies that fail to codify private capital.
Property rights protect owners and facilitate trade. Specialisation
becomes possible. Market values can be estimated and this allows
for subdivision and exchange through time. You can buy or sell a
share of some existing or future asset and have the confidence you
can retain this long term, so that when you die this property will be
passed on to your heirs. Such confidence in the future promotes
investment and thus growth.
Poor peasants, meanwhile, who may have farmed communal
lands for ages may have no recognised assets, no means to raise
capital, no pathway to increasing incomes. Quite the opposite, they
risk eviction if they have no formal title to the lands they work on
and they may lose any crops or livestock they may possess if they
cannot physically defend them.
C A P I TA L , I N V E S T M E N T A N D G R O W T H
C
APITAL
is a stock of assets capable of producing consumer goods
and services. It will include a business’s plant and machinery, its
resources in the process of production and even abstract concepts
© 2004 Tony Cleaver

such as its logo, certain business ideas and customer ‘goodwill’ –
providing that they can be defined in law and ascribed a value.
I
NVESTMENT
is a flow of funds that is devoted to creating more
capital. It may be from funds retained out of past profits, or from
private savings or it may be loans gained from a bank, but the action
of allocating finances to build capital stock defines investment.
For existing production to be maintained in any business it
requires that old capital stock is replaced as it wears out (
DEPRECIA
-
TION
) and to secure growth, capital stock must be added to.
Investment must respond to both business needs. In addition, as
capital stock increases so requirements for other resources (land,
labour) will change and it is most likely, for example, that a busi-
ness will also need to invest in its labour force or its
HUMAN CAPITAL
with improved training programmes.
The relationship between land, labour and capital and the effects
of increased investment lie at the heart of analysis of production
and market supply. We resort to economic theory to clarify the
issues involved.
P R O D U C T I O N T H E O R Y
Increasing the supplies of any consumer good or service requires
the relevant producers to employ more resources and/or to
increase the
PRODUCTIVITY
of each resource. Leaving aside produc-
tivity for the moment, consider the issue of how many and what
sort of factors of production to employ. What is the ideal mix of
resources to secure the most efficient level of output for any one
consumer good and also, given this factor combination, is there
some ideal size or scale of enterprise to produce the good or service
in question?
The first question relates to the optimum employment ratio of
land/labour/capital; the second refers to the
OPTIMUM SIZE OF FIRM
.
T h e L a w o f D i m i n i s h i n g R e t u r n s
If an entrepreneur experiments with employment ratios to find the
ideal blend of, say, labour to capital in production, he/she will run
up against one of the oldest laws in economics. Consider the
employment of labour and capital in, for example, running a coffee
shop in the centre of town.
© 2004 Tony Cleaver

What would your choices be if you were the entrepreneur making
the business decisions? Suppose first of all that the service you
provide is winning you lots of custom – people are queuing up to
come in to your premises. Clearly you want to expand the service –
sell more coffee and make more profits – but if there are so many
customers that you cannot maintain the same high standards, you
will lose the opportunity to make money as potential sales are lost to
rival suppliers. Solution: employ more waiters and bar staff. Taking
on one more worker may boost sales and profits significantly. If
customers keep on coming, you may need to employ more, and
more labour.
But what about capital equipment? Additional seating, the
crockery and cutlery, the espresso machine, and so on? If there is no
corresponding increase in these inputs to match the increase in
labour to your business then you cannot expect your profits to keep
growing.
If all other factors remain fixed, therefore, each additional input
of labour soon results in the increase in gains being eroded. What at
first may have led to a 25 per cent increase in outputs may soon lead
to an increase of, say, 10 per cent then 5 per cent then 2 per cent then
less and less. Each additional worker hired brings falling benefits.
It is the law of diminishing returns: a principle as old as economics
itself. Output grows with additional inputs – but in steadily
decreasing amounts. There is clearly a limit to how much growth can
be stimulated if you continuously increase employment of only one
factor where others are fixed. (This law was famously outlined by
Thomas Malthus in 1798 who argued that there was a tendency of
the population, if unchecked, to increase faster than the food supply
until poverty for all resulted. More and more people trying to farm
the Earth would lead to smaller and smaller increases in outputs: a
pessimistic scenario shared by many environmentalists today.)
This having been said, there are still great differences between
businesses as to what is the optimum combination of capital to
labour and, therefore, when the point of diminishing returns sets
in. Generally speaking, service industries tend to have a higher
proportion of labour to capital compared to manufacturing – but
even that is changing. Improvements in technology embodied in
the latest capital equipment can, for example, greatly increase
productivity, increase the most efficient capital/labour ratio and
© 2004 Tony Cleaver

thereby postpone the onset of diminishing returns to the employ-
ment of capital. (This may change the demand for labour – creating
jobs for some, creating unemployment for others. Information tech-
nology has completely transformed employment in banks and
financial services, for example. Far fewer office clerks and secre-
taries are now employed per unit of capital in such workplaces
whereas higher skilled job opportunities have mushroomed.)
T h e O p t i m u m S i z e o f F i r m
Whatever the eventual decision on which mix of land, labour
and capital to employ in production, assuming a given state of
technology, what happens if all inputs are, say, doubled? The same
mix of resources is maintained but now at a much larger scale of
enterprise – does efficiency increase or decrease?
The results can be measured by considering the average costs
(ACs) of production. Does the unit cost of producing, say, a cup of
coffee, or a haircut, or public transport, or a barrel of oil, increase or
decrease as the scale of production increases?
Answers differ according to the product in question. In general,
the more the consumers want a standard, homogenous product the
more this will lend itself to large-scale production. In contrast, the
more individualised the good or service in demand, the smaller will
be the most efficient size of firm. Oil refineries therefore can be
huge, capital-intensive complexes that churn out millions of litres
of petrol per day – each one identical in its composition (car engines
wouldn’t work if the chemical content was variable). Meanwhile a
giant, centralised hairdressers supplying indentikit haircuts is
unlikely to efficiently meet consumer demand.
As demonstrated, the optimum size of firm will differ between
industries according to the nature of the product in demand and the
technical possibilities in production but, in addition to this, most if not
all businesses will experience a similar cost–efficiency relationship as
they vary their own scale of production.
E c o n o m i e s a n d D i s e c o n o m i e s o f S c a l e
Starting at low production levels, ACs of production will be initially
high and, as scale increases, efficiency is likely to increase – and unit
© 2004 Tony Cleaver
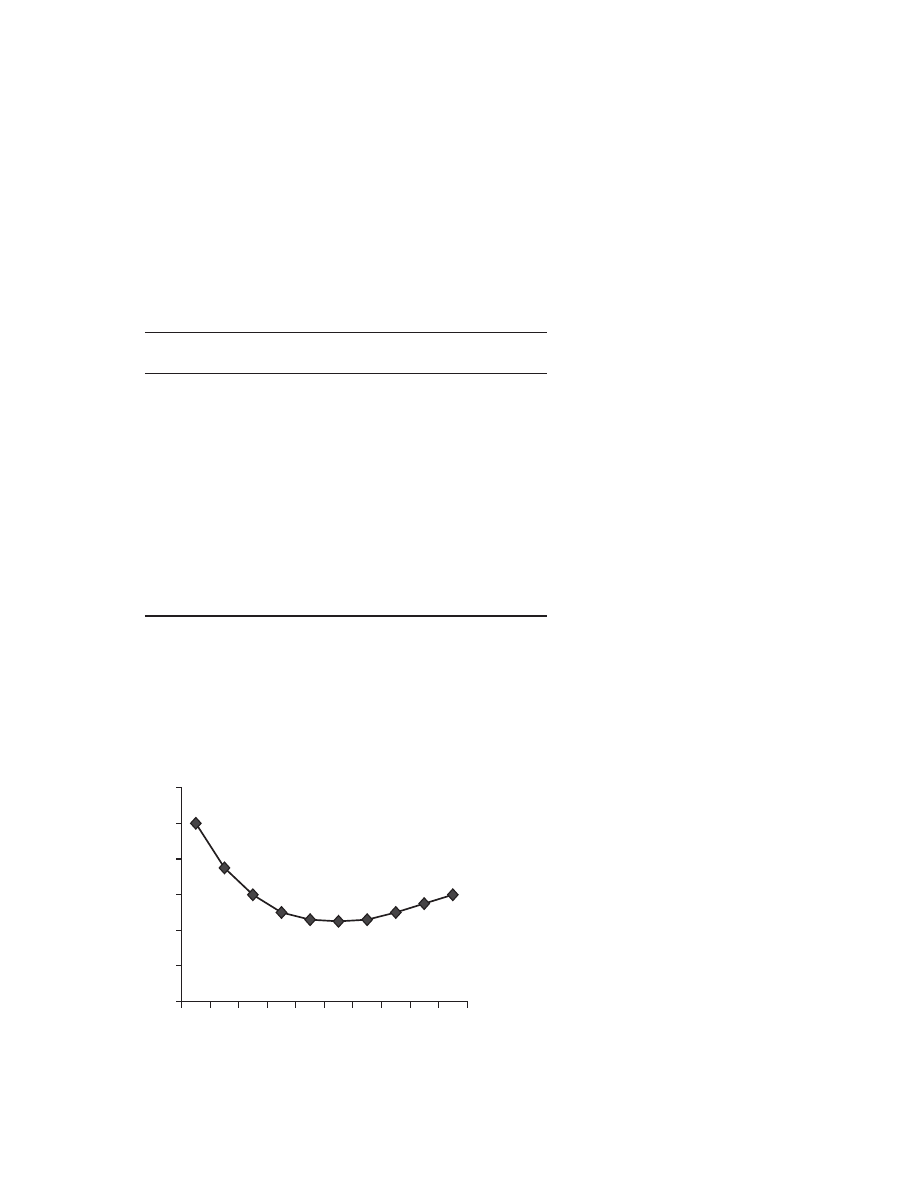
costs fall – until the optimum size is reached. Beyond this point,
inefficiencies begin to appear in the production process and unit
costs begin to rise again (Table 3.1 and Figure 3.1). What are the
reasons for this pattern of costs? They relate to the balance of
advantages and disadvantages of bigness in business.
Table 3.1 A typical profile of average production
costs.
Output
Total cost
Average cost
1
100
100
2
150
75
3
180
60
4
200
50
5
230
46
6
270
45
7
322
46
8
400
50
9
495
55
10
600
60
Note
The optimum scale of output in this example is at
6 units.
Output
0
20
40
60
80
100
120
Average costs
1
2
3
4
5
6
7
8
9 10
Figure 3.1 A typical profile of average production costs.
© 2004 Tony Cleaver

As a firm grows in size it benefits from certain cost advantages or
ECONOMIES OF SCALE
. For example, storing or processing goods in a
large container is cheaper per unit volume than producing them in
small packages. This is relevant to processes that involve constructing
buildings, transporting oil, selling boxes of soap powder and indeed
in making almost anything. Second, a large firm buying inputs in
bulk can negotiate better discounts than those gained by small
firms. Last, the capital threshold for technologically sophisticated
products may be very high such that large sums have to be invested
even before production can begin. Thus the research costs and start-
up costs of implementing new ideas may well be prohibitively
costly for small enterprises.
Over certain production ranges, depending on the nature of busi-
ness in question, size may not confer significant benefits such that
TCs rise almost exactly in proportion to output and there are thus
constant returns to scale. There may nonetheless come a point where
the complications involved in producing more and more leads to
greater inefficiency and rising average costs. These
DISECONOMIES OF
SCALE
are most often related to the difficulties of management in
complex organisations. Any bureaucracy where decisions are made at
some distance from the scene of operations is likely to make mistakes
but delegating management to the lowest effective level becomes
more difficult the larger the firm. Discriminating between which
issues should be centralised and which delegated to where cannot be
practically determined for every single business decision.
A S h i f t i n A v e r a g e Co s t s
Derivation of the standard, U-shaped, AC curve is explained in the
previous section but this does not allow for the impact of sudden
changes in production circumstances. Growth of the firm so far
analysed has considered steady increases in the employment of all
factors of production (internal growth) but we can hypothesise two
causes of sudden exogenous transformation. The firm in question
may take over or merge with another enterprise (external growth)
or it may experience a technological revolution that transforms its
business practice.
Whatever the cause, such indivisibilities in the growth process
are illustrated by a shift in the AC function. The AC curve may
© 2004 Tony Cleaver
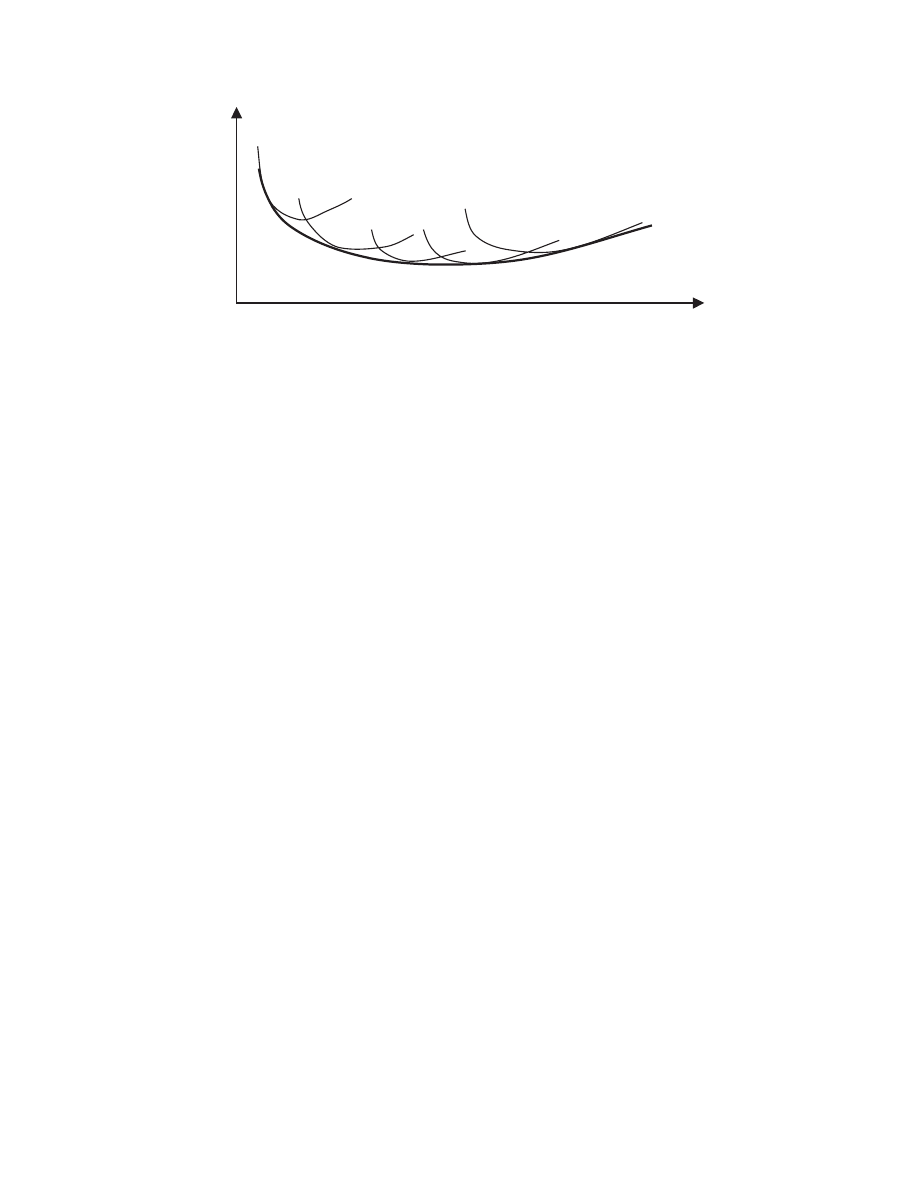
shift a number of times, trending upwards or downwards, according
to the number of exogenous shocks experienced and their overall
impact on long-run costs:
The long-run AC curve is illustrated by the darker ‘envelope’
curve in Figure 3.2. (Note this example shows almost constant
long-run returns to scale over the middle range of outputs between
Q1 and Q2 where there is no unique optimum size of firm which
enjoys a distinct cost advantage.)
C O M P E T I T I O N , P R I C E S A N D P R O F I T S
Costs of production are one element in the analysis of supply but
we now need to contrast this with an understanding of prices and
profits. However cost-efficient an enterprise may or may not be,
whether it can stay in business, or fail, depends on its ability to
make long-term profits.
A company can weather a short-lived downturn in trade only so
long as it can cover all its costs and return a reasonable profit over
the longer run. This depends on the success of each individual firm
in the market place: can it deliver what consumers want to buy at
the right price? If not, if the price at which a firm sells its goods
cannot be maintained above its average production costs, then losses
will be made. If these continue, the firm will close down.
This raises the interesting notion of how market prices are influ-
enced by the setting up or closing down of firms. Assume for the
Average costs
Shifts in short-run AC
Long-run AC
0
Q1
Output
Q2
Figure 3.2 Long-run AC with exogenous shocks.
© 2004 Tony Cleaver

time being there is a stable, unchanging industry demand for a
given good – if the number of firms producing this good decreases,
and industry supply therefore decreases, a shortfall in market
supply will push up prices (see
Chapter 2
). Conversely, an increase
in the number of producers may lead to falling prices over time.
The state of competition in industry, therefore, affects prices and
thereby profits of all involved.
In some industries there may be thousands, if not millions of
suppliers. In the market for coffee or tea, for example, if one more
producer enters or exits the industry it will have a negligible affect
on overall supply and therefore price of the product. The entry of a
new airline company in long haul, transatlantic flights, however,
may well have a significant impact on ticket prices.
P r o f i t M a x i m i s a t i o n u n d e r P e r f e c t Co m p e t i t i o n
Consider, first, the market structure where there are many
competing suppliers but no one in particular is big enough to exer-
cise a commanding lead. In such a scenario, typical of agricultural
commodity markets such as coffee, tea or wheat, the product of one
supplier is a close if not identical substitute to that of another and
the price of this product is set in the market place by the competing
forces of demand and supply. An individual producer, therefore, has
no effective power over the important decision as to what price to
charge for his/her product (the enterprise is a price taker, not a price
maker) and can only decide how much to produce, given that price.
If we assume that the supplier aims to maximise profits in this
competitive situation, we can deduce that output will expand so
long as each additional unit produced adds more to revenue earned
than it does to costs. That is, production can continue so long as
selling prices are maintained above costs – but, as we have seen,
costs eventually begin to rise. Profits will thus be maximised where
the cost of the very next bag of coffee/tea rises to just equal its
price. To produce beyond this point incurs a loss on each additional
unit sold.
Economists define this point of profit maximisation in terms of
marginal revenue (MR) being equal to marginal costs (MCs). That is,
the point where the revenue earned from the sale of one extra unit
equals the costs incurred in the production of that unit (
Box 3.1
).
© 2004 Tony Cleaver

What would be the profit maximising output if the price of the
product, determined in world markets, was stable and given as
60 per unit? That would give a table of total, average and marginal
revenue as shown in
Table 3.3
.
In the example of Table 3.3, profits are maximised at where
output equals 7 units. Check, if you wish, the TR and TCs at each
output level and you will find the greatest difference between the
two occurs at 7 units. The quickest way to find this profit
maximising output, however, is simply to compare MCs and MRs.
At output 7, MC equals 52, just short of MR at 60. That is, the
cost of the seventh unit is less than the revenue it earns and so it
is worthwhile producing it. The eighth unit, however, has MC of
Box 3.1 Total, average and marginal costs and revenues
To clarify the issues involved here requires us to discriminate
carefully between total costs and revenues; average costs and
revenues; and marginal costs and revenues:
Note our earlier outline of total and average costs given in
Table 3.1
. We can add an extra column illustrating the increase in
TCs as output increases: from 1 to 2 units the increased TC is 50;
from 2 to 3 the increase is 30; and so on. This is the column of
MC seen in Table 3.2.
Table 3.2 Total, average and marginal costs.
Output
Total Average
Marginal
cost
cost
cost
1
100
100
—
2
150
75
50
3
180
60
30
4
200
50
20
5
230
46
30
6
270
45
40
7
322
46
52
8
400
50
78
9
495
55
95
10
600
60
105
© 2004 Tony Cleaver
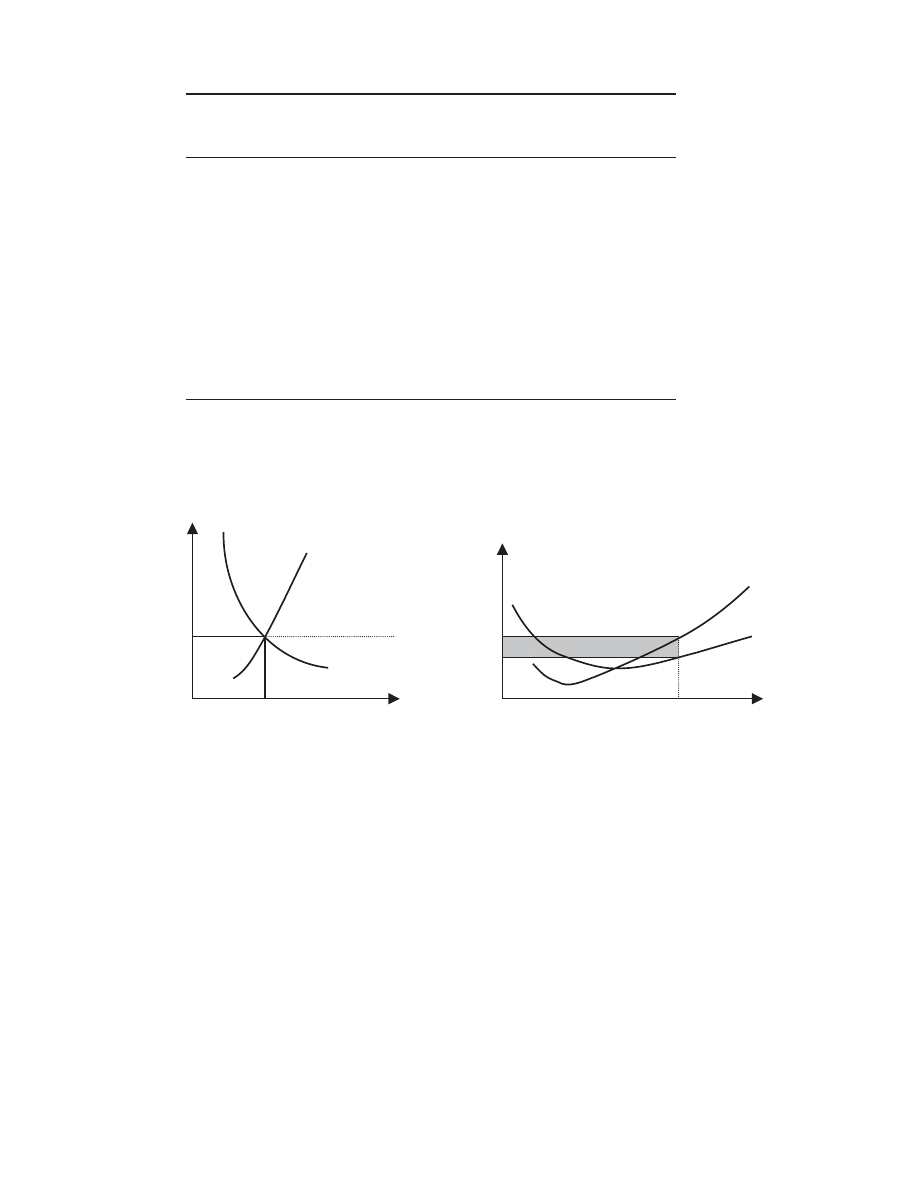
78 – much higher than the MR of 60. The enterprise loses by
pushing production this far.
This analysis can be summarised in Figure 3.3.
Note that the ruling price is determined in world markets (at 60)
and the individual producer compares this to his/her costs of
production. With average and marginal costs as illustrated, the
profit maximising output is shown at 7 units. At this level of
output, the MC rises to equal the MR (equal to price).
Table 3.3 Total, average and marginal revenue.
Output
Total
Price, or average
Marginal
revenue
revenue
revenue
1
60
60
—
2
120
60
60
3
180
60
60
4
240
60
60
5
300
60
60
6
360
60
60
7
420
60
60
8
480
60
60
9
540
60
60
10
600
60
60
World market
Costs and revenues of one supplier
Price
Costs/revenues
World supply
MC
AC
60
AR/MR = 60
AC = 46
World demand
0
7
World output
Output of one supplier
Figure 3.3 Short-run profit maximisation for a competitive producer.
© 2004 Tony Cleaver

If there are large profits being made in a competitive market
place there is bound to be an incentive for outsiders to enter and
seek to do the same. This raises the theoretical notion of
NORMAL
, as
opposed to
ABNORMAL
profits. Normal profits can be defined as a
just and sufficient reward for an entrepreneur to conduct his/her
business. Any less than this and the entrepreneur would not be
getting enough compensation for the hard work and risks under-
taken; any more than this and the business would be earning an
excess above what is considered necessary. An enterprise earning
less than normal profits would thus leave the market it is operating
in and go look elsewhere to conduct its business; conversely a
market place where existing businesses are earning above-normal
(or abnormal) profits would act as a magnet for other firms to enter.
(Note: since entrepreneurs would not set up a business without
the promise of normal profits, economists would define this level of
reward as an essential cost of enterprise. It may at first acquaintance
seem confusing to call ‘normal profits’ a sort of cost but that is
indeed what they are in the view of economic theory!)
In a competitive market place, if outsiders are not restricted from
entry, abnormal profits would lead to more businesses setting up,
thereby increasing industry supply. The higher the original
abnormal profits, the stronger the signal would be to attract outside
interest and the more new entrants would flood in. The longer-term
outcome is not difficult to see (
Figure 3.4
). As industry supply
grows, (illustrated by a supply curve that shifts further and further
TR, TC and total profits (TP) can all be derived from
Figure 3.3
.
TR equals the price (AR) times output:
60
⫻ 7 ⫽ 420
TC equals the average costs times output:
46
⫻ 7 ⫽ 322
TP equals TR
⫺ TC, or AR ⫺ AC times output: 14 ⫻ 7 ⫽ 98
Thus TP, which are maximised at 7 units of output, are illus-
trated by the shaded area in the figure. It shows the difference
between the price (AR) and unit costs (AC) at that level of
output (7) where MR is closest to MC.
© 2004 Tony Cleaver
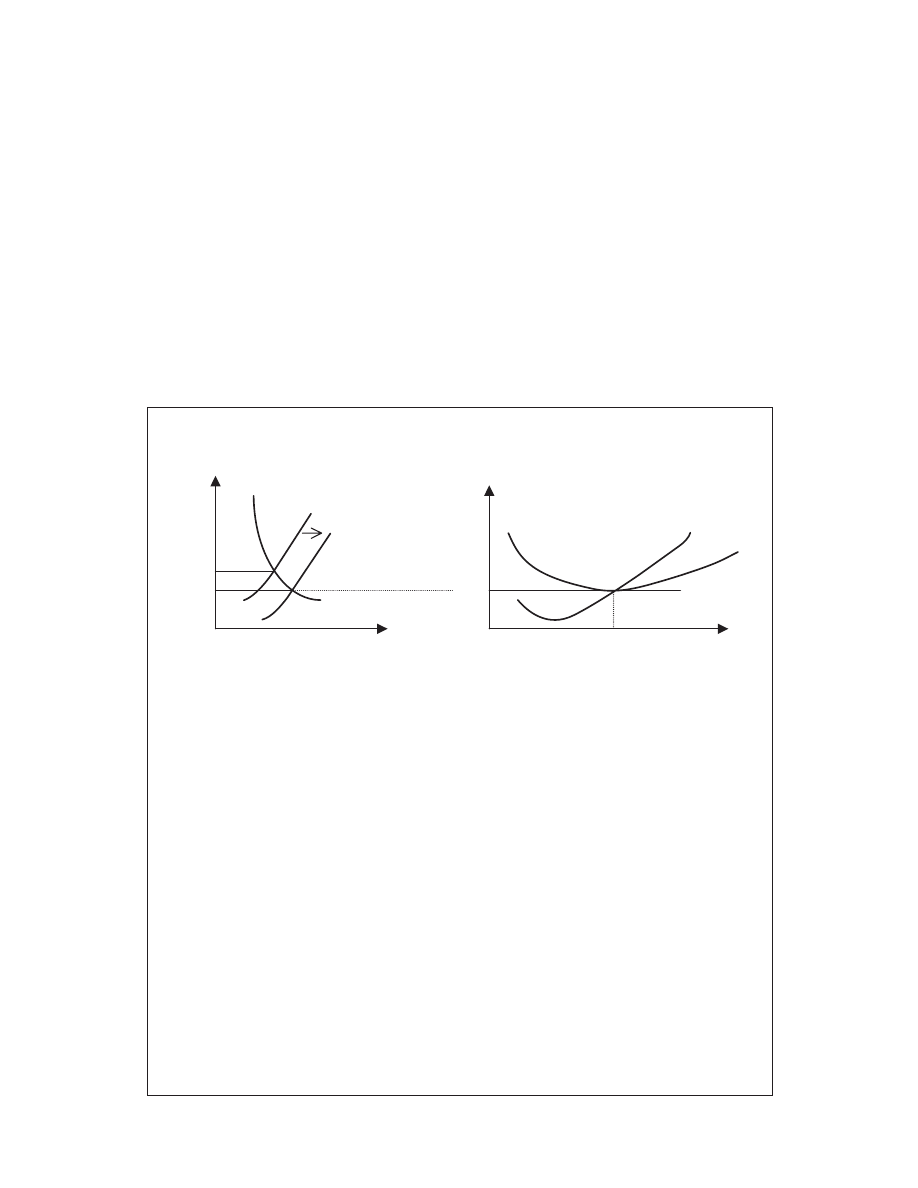
to the right, see
Chapter 2
) the more market prices will fall,
squeezing down the profits earned by everyone until only normal
profits remain for the latest newcomer.
High short-term prices and profits for Internet companies – the
so-called dot.com boom – led precisely to this outcome in world
markets at the turn of the millennium. First, there was a rush to
create all sorts of dot.com businesses – which attracted much media
interest, promised great future profits and thus prompted soaring
share prices for start-up outfits that seemed to have nothing but
young entrepreneurs with big ideas. Then a bust followed the boom
when an oversupply of such enterprise could not return anything
like the profits that were originally hoped for.
Figure 3.4 Long-term profit maximisation for a competitive producer.
Note the difference from the
Figure 3.3
. Abnormal profits (the
shaded area in Figure 3.3) have all been eroded as market prices
have fallen. The long-run equilibrium for producers in a competi-
tive market is thus where prices and MRs equal MCs just where
ACs are at their lowest and no abnormal profits remain to tempt
the entry of further competition. Two conditions of equilibrium
now exist – for the individual firm and for the industry as a
whole. The firm or enterprise is at its profit maximising equilib-
rium where its MCs equal its (lower) MR, and the industry is in
equilibrium with only normal profits being available and thus
where no further movements of suppliers in or out of the market
place will take place.
World market
Costs and revenues of one supplier
Price
Costs/revenues
MC
World supply 2
AC
60
45
45
AR/MR
World demand
0
6
7
World output
Output of one supplier
World supply 1
© 2004 Tony Cleaver

Note that a highly competitive market environment is generally
considered to be the most efficient and equitable form of economic
organisation. Profits are earned by catering for public demand and
the more successful the producer is in this respect, the more other
competitors will follow. Increasing rivalry drives each business to
look for ways to reduce costs and economise on society’s resources
and, simultaneously, so long as competition prevails it prevents any
one producer from accumulating excessive profits and abusing its
market power.
M O N O P O LY A N D O L I G O P O LY
The reality in many business contexts, however, is that a small
minority of giant firms dominate the market place such that small
producers feel relatively powerless. For almost any industry you
can think of, you can probably also think of the handful of famous
names that bestride it – from sophisticated, high tech. products like
passenger aircraft (Boeing, Airbus) to the mundane household
items like washing powder (Proctor and Gamble, Unilever); from
things you can hold in your hand (Nestle, Coca-Cola) to abstract
ideas and entertainment (AOL TimeWarner, Sony).
A monopoly is a single large firm that sells its product in a
market place with no effective rival. If such a development were
allowed in the supply of an essential good or service, the monopolist
would exercise great economic power – customers would have to pay
the price the monopolist wanted or go without, since there would be
no alternative supplier. Most countries therefore have legislation to
prevent the growth of private monopolies to anything greater than
25 per cent of market share, with the result – as mentioned earlier –
that industrial concentration stops short of single firm dominance
and thus competition occurs between a small number of very large
firms. This is a market structure known as
OLIGOPOLY
.
Industries dominated by a few big rivals still means that each busi-
ness wields an impressive economic influence, however. The European
Commission calculates that 0.2 per cent of the total number of busi-
nesses on the continent control over 37 per cent of market sales
and these large firms, on average, employ over a thousand people
each. When it comes to multinational corporations – businesses
that own and control assets in more than one country – the top
© 2004 Tony Cleaver

200 multinationals across the globe jointly produce about one third
of the world’s total output. Not much evidence here of the forces of
competition preventing the accumulation of market power!
What accounts for the prevalence of such large corporate enter-
prises and why has their growth to such dominance not been
constrained by follow-my-leader-competition as theorised earlier?
In some cases it can actually be the forces of competition, over
time, leading to the survival of the fittest. The more efficient firms
in an industry may be able to reduce costs and prices below those of
their rivals, drive them out of business or take them over and thus
convert what was a competitive market place into one dominated by
a few large corporations.
Modern banking has sometimes been described in these terms.
The nature of banking as a business lends itself to over-optimistic
expansion on the one hand, followed by financial crashes where the
weakest go to the wall. Where this process has worked its longest –
in Europe and the USA – a few very large enterprises have
emerged, each with considerable financial muscle that simultane-
ously acts as a safeguard against crises that would destroy smaller
brethren and also provides a key competitive advantage. (Bigger,
safer banks are more likely to attract more custom.)
Note, however, that this process of industrial or commercial
evolution could not succeed in producing a dominant few – in
banking or anywhere else – if the businesses that remain could not
somehow retain a competitive edge: some advantage that inhibits
the entry of new, lean and hungry enterprises looking to capitalise
on the profits that the lead oligopolists feed off.
B a r r i e r s t o E n t r y
Economies of scale provide one explanation for oligopolies being
able to resist dilution of their market power by the entry of new
businesses. Financial and risk-bearing economies are relevant in the
case of banking referred earlier (large financial enterprises can buy
and sell money in bulk and thus can offer lower price deals to
customers) but other economies of scale include technical factors.
For example, in aerospace, the oil industry and also in pharmaceuti-
cals, the capital threshold that new firms have to cross before they
can bring their costs down to a level commensurate with existing
© 2004 Tony Cleaver

suppliers is simply immense. Where technically complex production
processes are involved in bringing goods to markets, then the set-up
costs for new entrants are a natural barrier to the forces of competi-
tion. In some sectors, only very big businesses can be efficient and
the market place – even world-wide – may not be large enough to
support more than two or three firms. (For example, just three
enterprises dominate world aero-engine supply: General Electric,
Rolls Royce and Pratt & Whitney.)
We can discriminate, however, between barriers of entry like
those described earlier, which are structural or due to real economic
forces and those which are behavioural, or due to the manipulation
of power by existing oligopolists. Massive advertising campaigns, for
example, may be resorted to by existing firms which inflate produc-
tion costs on the one hand and create a brand image, on the other,
which new producers find hard to overcome. The technology
involved in producing carbonated soft drinks, for example, is hardly
rocket science (quite the opposite, it is one of the first industries that
low-income countries can invest in to develop their own emerging
industrial sector and serve their own peoples). Nonetheless, the
powerful presence enjoyed by the duopoly of Coca-Cola and
PepsiCo greatly reduces the room for poor countries to promote
industrial expansion in this particular market place.
Product differentiation is a strategy pursued by large firms to
increase the range of items they sell. Varying superficial qualities of
the product – colour, packaging, logos, special offers and other
marketing gimmicks – helps create a different
BRAND
in the mind of
the consumer. Thus the many supermarket offerings of breakfast
cereals seem to the untutored eye to illustrate very active competi-
tion between a large number of rival producers but, on closer
inspection, the scores of different brands on display are all produced
by two or three large oligopolists. (Even supermarket ‘own brand’
items are simply purchased from these same producers and retailed
in cheaper packaging.) Product differentiation is a ruse employed by
such enterprises to block out the market. Any genuine new entrant
to this industry therefore faces having to establish its identity
against a wealth of dazzling alternatives.
Vertical and horizontal
INTEGRATION
refer to directions of
industrial growth that large firms may indulge in to exercise
greater market control. In the late part of the nineteenth century,
© 2004 Tony Cleaver

Rockefeller’s original Standard Oil (SO) company accumulated vast
profits by buying up or building all the pipelines serving North
Eastern US markets with oil from the Southern producer states. This
was horizontal integration – monopolising all business at one stage of
the production process, in this case the transporting of oil. (In 1911,
SO was broken up by US anti-trust legislation as a result of this
abuse of its power. It was such a huge business, however, that the
several parts into which SO was cut up all evolved to become interna-
tional oil majors in their own right.) As a result of this experience,
many oil producers have since resorted to vertical integration to
ensure they always have some degree of control over supplies and
markets – buying up, building or signing exclusive long-term
contracts with upstream suppliers or downstream distributors in the
production chain. Modern day Exxon (which Esso became) therefore
owns and controls a stake in all the processes involved in the interna-
tional oil industry – from oilfields, to pipelines and oil tankers, to
refineries and gas stations that operate all around the world.
Finally, an important reason for industrial concentration, if not
actual monopoly, is government legislation or patronage. An inno-
vating firm may apply for a
PATENT
or sole licence to supply a
unique product or process. Drug companies, for example, may spend
fortunes developing a new medicine but such innovations, though
costly to develop, may be very cheap to imitate. Without patent
protection, therefore, such firms would be unlikely to invest in new
ideas. Monopoly status is thus conferred with an official patent that
sets a time limit to the innovation – guaranteeing the firm suffi-
cient time and thus reward to recoup the investment before other
imitators can enter the market.
State monopolies or nationalised industries are those enterprises
owned and controlled by public authority where the law actually
forbids competition. There has been a world-wide trend to privatise
much state enterprise therefore fewer examples remain today, but
nonetheless in many countries the post office remains a monopoly,
as are certain public utilities (the distribution of gas, electricity and
water). In defence industries and in the provision of nuclear energy
the state may or may not own the production process but via exclu-
sive government contracts it will determine outputs and restrict
competition in this area for security reasons.
© 2004 Tony Cleaver

In all these cases, where monopolists or oligopolists dominate a
market place they are able to exert greater control over prices and
thus their sales and profits. Industry supply in these circumstances
will differ from the perfectly competitive model described earlier in
a number of vital ways.
M o n o p o l y D e m a n d
There is an important distinction between the demand conditions
for monopoly and for oligopoly and this is examined in this section
and in further detail in the boxes that follow.
First, the more a large firm monopolises a market place the more
the demand for its particular product will come close to that for the
industry’s output as a whole. Oligopolists attempt to mimic this situ-
ation which is why corporations invest large sums in product
differentiation. The objective is to create customer loyalty – that is,
the monopoly of a brand. (‘The one and only – accept no substitute!’)
The ideal situation for the firm is that demand for its product
thus becomes price-inelastic: consumers are so accustomed to
buying their favourite brand that sales do not fall appreciably even
if its relative price rises.
Profit-maximising enterprises operating in conditions of
monopoly will deliberately restrict production if this forces prices up
more than unit costs. We can predict that if margins between
average prices and costs can thus be widened, and barriers to entry
to the industry can be maintained to frustrate new competition, then
abnormal profits can be realised even in the long run (Box 3.2).
Box 3.2 Profit-maximising monopoly
In the case of a pure monopoly where there is only one producer
and no competition whatsoever, the demand curve for the
firm must be identical to that for the industry. Unlike a competi-
tive firm that must accept whatever price the free market
dictates – see
Figures 3.3
and
3.4
– the monopolist in contrast is
© 2004 Tony Cleaver

a price maker. The firm dictates what price will rule simply by
deciding what level of supply to produce. Restricting production
will push prices up since consumers are forced to outbid each
other to secure their purchases; increasing supplies will cause
prices to fall.
Note the effect this has on MRs. For a normal, downward-
sloping demand curve, since the monopolist must reduce prices
if sales are to be increased, MR (earnings gained on the last
item sold) must always be less than the average.
Check the derivation of average and marginal revenues in
Table 3.4 and
Figure 3.5
.
TR is derived from multiplying the price (P) of the good, times
the quantity (Q) sold. Note, in reverse, that dividing TR by Q
gives you P which is the same as AR. This relationship shown
between P and Q is actually the demand curve of the firm – which
Table 3.4 Monopoly costs and revenues.
Q
TC
AC
MC
P/AR
TR
MR
TP
⫽ TR ⫺ TC
1
100
100
135
135
35
50
105
2
150
75
120
240
90
30
75
3
180
60
105
315
135
20
45
4
200
50
90
360
160
30
15
5
230
46
75
375
145
40
⫺15
6
270
45
60
360
90
52
⫺45
7
322
46
45
315
⫺7
78
⫺75
8
400
50
30
240
⫺160
95
⫺105
9
495
55
15
135
⫺360
105
⫺135
10
600
60
0
0
⫺600
Note
MCs and MRs are calculated on the difference between one level of output and
the next which is why they are recorded between the lines.
© 2004 Tony Cleaver
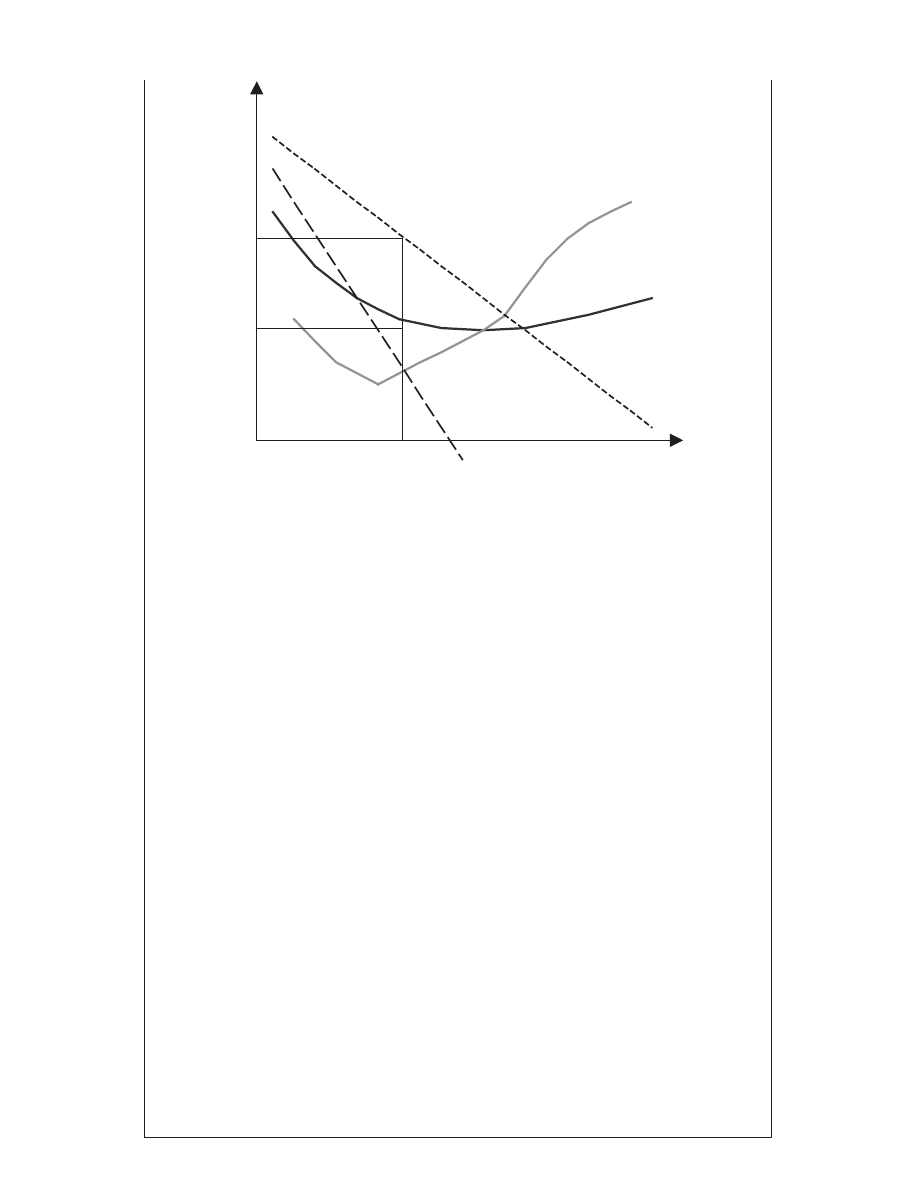
Figure 3.5 The profit-maximising monopolist.
in the case of a pure monopoly is the same as the demand curve
for the industry.
The MR curve shows the increase in TR brought about by the
sale of one extra unit and it falls faster than AR.
Remember that no profit-seeking enterprise will expand produc-
tion to the point where the last good sold nets less revenue than it
costs to produce. That is, the firm – whether it be operating in
conditions of competition or monopoly – will produce only up to
the point where MCs equal MR. In
Table 3.4
, check that the
monopolist will produce 4 units of output but not 5. In Figure 3.5,
the firm is at equilibrium at 4 units of output where Price/AR is
90 and AC is 50. Total (abnormal) profits (TP) thus will be
maximised at 90
⫺ 50 ⫻ 4 ⫽ 160, confirmed by reference to the
table of data.
Note: The profit maximising equilibrium as illustrated is stable
only so long as new competitors are barred from entry to the
industry. If, in time, new suppliers gain access to the market then
the demand/AR curve for the existing monopolist will shift back
as sales are lost. This squeezes out some of the abnormal profits
as the distance between price (AR) and unit costs (AC) closes.
p y
Output
4
50
90
AC
MC
AR
MR
© 2004 Tony Cleaver

O l i g o p o l i s t i c R i v a l r y
Oligopoly, remember, is a market structure where there are a few,
very large corporations sharing power in an industry with substan-
tial barriers to entry restricting access to any other firms. In such a
situation, each business would ideally want to dominate the market
and so rivalry is intense: every firm has to keep a close eye on the
actions of its competitors.
Imagine the scenario with five firms dominating an industry –
each with 20 per cent market share. If one supplier wishes, say, to
cut the price of its product and thus compete more business away
from its rivals then you can be sure that the other four firms will be
equally determined not to let this happen. In an example of price-
cutting, all would promptly follow suit. The end result would thus
be all five businesses would retain the same market share but now
at a lower, less profitable price.
Driving prices down to the limit where average revenues equal
average costs and only normal profits remain is the inevitable
outcome of competitive industry where new entrants cannot be
excluded. But where barriers to competition limit production to a few,
very large businesses, each one warily watching the other, it is
extremely unlikely that the rivals would want to engage in price wars.
More likely they would want to collude and push prices up to all
firms’ mutual advantage. The oligopolists thus act as one – joint profit
maximisation – which is the typical outcome of a
CARTEL
(
Box 3.3
).
Rigging prices is against the law, however. Active collusion must
be avoided since it can be severely punished – though this still does
not remove the incentive, under oligopoly, for competition to be
constrained. What results, therefore, is tacit collusion: a passive,
unspoken (and thus unpunishable) understanding not to exces-
sively stir up deep waters.
There is an inevitable reluctance to engage in extremely rival-
rous and damaging ‘cut-throat’ price wars and instead a preference
to move competition into the realms of advertising, marketing,
‘special offers’ and other sales promotions. Investing in large
marketing divisions and resorting to creative ways to practice
NON
-
PRICE COMPETITION
can also be costly but it is a safer, less
unpredictable business practice and mutually beneficial to the
existing rivals in that it builds up even higher barriers to potential
new competition.
© 2004 Tony Cleaver

O l i g o p o l y D e m a n d
The demand curve for the firm – which shows the relationships
between the price of the product and its quantity sold – given the
oligopoly conditions just described can be quite unique. Consider
what would happen if one of the rival corporations was determined
Box 3.3 Cartels
It is precisely the tendency to
COLLUSION
that governments need
to monitor and legislate against in order to prevent the public
from being exploited. Setting up a cartel – a formal agreement
between rivals to rig the market – is illegal in most countries,
though cartels between international operators are more difficult
to outlaw since there is no one world body that can be relied
upon to stop them (especially if it is national governments that
actively collude!)
The Organisation of Petroleum Exporting Countries (OPEC) is
frequently cited as a cartel but in fact it has been far less
exploitative than the cartel of major oil companies that preceded
it and formerly controlled international oil supplies (see
Box 6.9
).
The national governments represented by OPEC now regularly
meet to arrange production quotas between them but disagree-
ment is common.
What conditions are likely to be conducive to the successful
operation of a cartel? Under what circumstances must govern-
ments be most vigilant to protect the interests of consumers?
Collusion is most likely to succeed:
1
the smaller the number of rival producers and the higher the
barriers to entry;
2
where the interests and objectives of each producer are
similar;
3
where the product is homogenous, difficult to differentiate
and thus highly substitutable;
4
where the actions of each producer are highly visible to all;
5
where market demand is stable;
6
where legal restrictions can be easily bypassed or bought off.
© 2004 Tony Cleaver
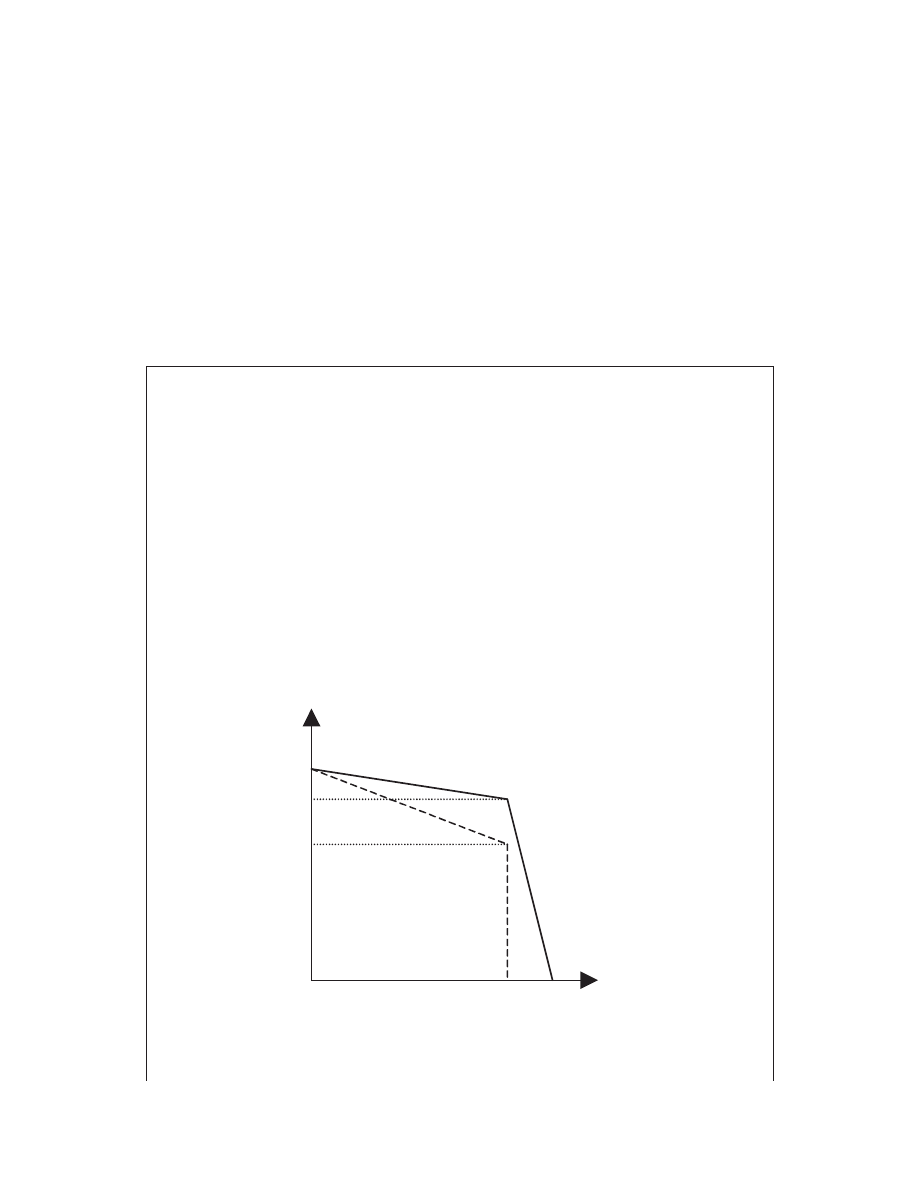
to change its selling price: as Firm A cuts its price, so too would
Firms B, C, D and E. The sales of all products in the market place
may grow a little overall but the individual demand for each firm
would not change by much. If, in contrast, Firm A puts its price up
then it is unlikely that any of its rivals would follow suit. Firms B,
C, D and E would benefit from extra sales if they kept their prices
low, picking up consumers of product A who would now switch to
the rivals’ lower price alternatives (Box 3.4).
Box 3.4 Price stickiness
With asymmetric demand in the market for the products of
oligopoly, the shape of each firm’s AR/demand curve would be
kinked at the point of the current ruling price, P
⬘ as illustrated in
Figure 3.6.
Demand for the oligopolist’s product is price-elastic above
price P
⬘ and price-inelastic below P⬘. Note the MR curve that is
derived from a kinked AR/demand curve is shown as vertical at
quantity Q
⬘. What this implies is that – since the oligopolist
maximises profit at that output where MC equal MR – no matter
if production costs increase quite considerably (e.g. anywhere
Price/revenue
P
⬘
C
⬘
Demand/AR
MR
0
Q
⬘
Output
Figure 3.6 The oligopolist’s demand curve.
© 2004 Tony Cleaver
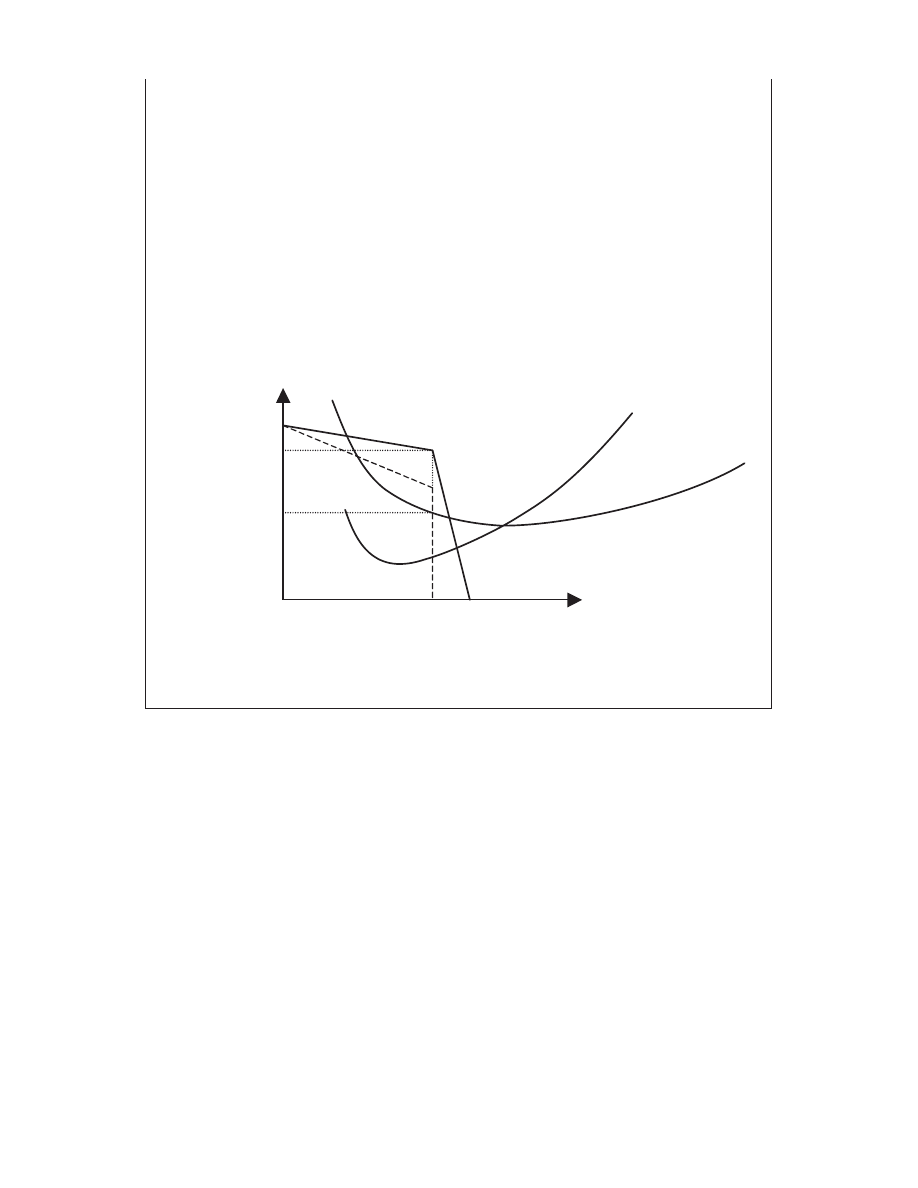
Prices under oligopoly tend to be stable, therefore. At least they will
be so for relatively long periods until something occurs to upset the
equilibrium. The sudden appearance of a new competitor, a techno-
logical breakthrough or a revolutionary new product or process
may then turn the relative stability of the status quo into turmoil.
For a brief period, an intense battle over market shares will take
place as the original ‘pecking order’ or hierarchy between rivals is
challenged. Cut-throat price competition may be resorted to in
order to eject an upstart interloper from the market place or to re-
examine the economic efficiency and thus supremacy of the
remaining firms. After a period of aggressive activity where short-
term profits are sacrificed in the quest for a new order, eventual
from 0 to C
⬘) price and output will still not change. This is
shown in Figure 3.7.
Adding the oligopolist’s cost structure to the pattern of
demand identifies the firm’s equilibrium price P* and output Q*.
Abnormal profits are given by the box (P*
⫺ C*)Q*. Note that
the effect on this equilibrium of any increase or decrease of MC
and AC here would be minimal, whereas a shift back in demand
(AR) caused by any increase in competition from rivals would
have, in contrast, a serious impact on price, output and profits.
Price/costs/revenue
MC
P
*
AC
C
*
AR
MR
0
Q
*
Output
Figure 3.7 Profit-maximising oligopoly.
© 2004 Tony Cleaver

calm will be restored as all survivors realise that mutual interests
are best served again by tacit collusion.
A highly dramatised and fictional (?) illustration of oligopolistic
conflict is given in the novel The Godfather by Mario Puzo – a
fascinating study of rivalry between New York Mafia organisations
which gives new meaning to cut-throat, corporate blood-letting!
Only slightly less colourful have been reports on the antics of
international airlines in trying to carve up North Atlantic passenger
routes. The end of the twentieth century saw the major players in
this market accused of all sorts of dirty tricks designed to prevent
the entry of new budget airline operators such as Laker Airways
(successfully beaten off in the 1960s) and, later, Virgin Airways
(forewarned, forearmed and able to establish itself in the more
competitive 1990s).
Many examples of oligopolistic rivalry can be quoted where, in
between the extremes of intense competition or secretive collusion,
the pre-occupation of business leaders in protecting market share
and pursuing profits seems to be at the direct expense of the
public’s interest. Big tobacco companies have deliberately
suppressed information of the harmful effects of their products;
international banks have promoted cheap loans and increased the
indebtedness of poorer peoples before hoisting up interest rates;
pharmaceutical giants charge exploitative prices for AIDS vaccines
and other life-saving medicines that consumers must purchase, or
perish (
Box 3.5
).
Large, oligopolistic corporations that have built up business
empires that span the globe wield an enormous amount of
economic power, therefore. The challenge to governments is how to
channel this corporate muscle so that the ends it pursues suit the
public, as well as business, interests.
Adam Smith famously commented in 1776 that the individual in
a market economy ‘is led by an invisible hand to promote an end
which was no part of his intention. By pursuing his own interest he
frequently promotes that of society more effectually than when he
really intends to promote it’. That sentiment still exerts a persua-
sive influence on Western economic policy making: the claim that
all will be for the best if only private enterprise is left alone.
Oligopoly theory predicts otherwise.
© 2004 Tony Cleaver

Box 3.5 Big pharma
At the time of going to press, the world’s largest pharmaceutical
company, Pfizer, reported corporate profits of US$4.7 billion for
one quarter of 2002. It competes with a handful of other US and
European firms world-wide to develop and distribute branded
drugs to combat a variety of medical ailments.
Drug companies such as these do not nowadays act so much
as primary innovators in the field – their home-grown supply of
new products is less important than contracting new ideas from
a host of small, specialist biotech firms. That is, ‘big pharma’
increasingly uses its economies of scale to raise finance, buy out
competition, negotiate/bribe supportive regulations from
governments and international agencies, run lab and field tests
on the latest drugs and to launch massive sales promotions
around the globe. In 2001, the top ten US drug companies spent
$19.1 billion on research and development and more than twice
that, $45.4 billion, on marketing, advertising and administration.
(Quoted in The Times, 20 March 2003.)
Profit-seeking has implications for which markets to serve
and what prices to charge. The biggest killer of children in the
world today is malaria – the prime cause of infant mortality in
the developing world. But poor children and their families have
little purchasing power and no drug company is therefore much
interested in researching better treatment. In contrast, the
biggest killer in the rich world where populations are rapidly
ageing is heart disease. Cholesterol-reducing drugs are a huge
money-spinner, investments are massive and there is much
product differentiation as each oligopolist tries to sell its own
product. (Equally profitable is developing lots of ‘me too’ drug
copies of viagra – to address a less than fatal affliction of older,
richer men.) To maximise profits, prices are highest in those
markets where people are richer, where government regulations
prohibit cheap copies and where the medical consequences of
not buying the drugs are serious . . .
© 2004 Tony Cleaver

C O N C L U S I O N
The dominant concern of any oligopoly is to preserve or increase its
economic power in the market place. In an ever-changing world
where markets are subject to sudden fluctuation and where busi-
ness rivalry is intense, an individual firm may at turns appear very
aggressive, or defensive, or very passive in its operations. But,
subject to short-term expediency, the analysis so far leads to the
following conclusions:
Oligopolists will
●
attempt to increase their share of whichever market they
operate in;
●
sacrifice short-term profits in order to secure long-term, compet-
itive advantage;
●
generally prefer to collude rather than compete on prices;
●
keep prices high and stable for as long as conditions allow;
●
exploit economies of scale to widen the difference between prices
and unit costs;
●
pay handsomely for any innovation that gives them a lead on
their rivals;
●
drive out or vigorously resist entry of new competitors;
●
manage the media, public opinion and government contacts to
resist any restriction on their operations;
●
not initiate any increase in supplies that weakens prices and
profits;
●
exploit any consumer dependency on their products.
It is not intended to portray all executives of big business as
heartless, greedy capitalists intent on grinding the fate of others
under the wheels of the corporate machine! Most business people
are hard-working family types intent on doing a professional job
and keeping their budgets in balance and their heads above water.
It is just that the structure of modern, competitive oligopoly
rewards ruthlessness, not compassion.
Where the temptation exists to make a fortune by bending the
law, ologopolists may frequently go too far (see box on Enron).
Large business empires can then go bust frighteningly quickly –
especially where rivals are only too happy to exploit any weakness
© 2004 Tony Cleaver

amongst their number. This merely increases the penalty of failure
and yet, by the same token, rewards are always greatest where
others fear to tread. Thus the incentive still remains to choose
investments that are morally questionable but highly profitable. It
is in such circumstances that ordinary members of the public must
hope that elected governments can set the rules of the game to
prohibit corporate abuses – and that they get to their political
leaders before big business does (Box 3.6).
The father of economics knew. In his famous book The Wealth of
Nations from which the quote earlier was taken, Smith also wrote:
‘People of the same trade seldom meet together, even for merriment
and diversion, but the conversation ends in a conspiracy against the
public, or in some contrivance to raise prices.’ It is a warning to
public authorities everywhere that oligopoly needs policing.
Box 3.6 Enron, Arthur Andersen and the dangers of crony capitalism
Enron began as a pipeline company in Houston, Texas, making
profits by selling gas to selected businesses at a future date at
an agreed price. The company successfully lobbied government
to deregulate electrical power markets and subsequently
expanded into trading electricity and other commodities. Soon it
was buying and selling all sorts of future contracts, making
money on the difference between buying and selling prices but
keeping its books closed so that few could see the profits it was
making.
Enron grew to become a giant financial and energy empire,
the volume of financial contracts eventually far outstripping its
trade in commodities. It subsequently poured millions of dollars
into US political parties, cultivating contacts in the White House,
in Congress and in the regulatory agencies that were
critical to the company’s growth. The Chief Executive Officer of
Enron, Kenneth Lay, became a close friend of President George
W. Bush.
By law, every publicly listed joint-stock company is required to
have its finances audited so that private investors can have
© 2004 Tony Cleaver

confidence that its accounts are an honest and fair record of its
business. This was undertaken by Arthur Andersen, one of the
United States’ largest accounting firms. But Andersen was also a
major business partner of Enron – selling it consultancy services
and using its name to solicit custom from other potential
clients. Andersen was responsible for some of Enron’s internal
bookkeeping, and executives from one enterprise would some-
times seek employment in the other. Each business had a vested
interest in promoting the other. The relationship was uncomfort-
ably close.
In January 2001, Enron’s stock rose to over US$80 per share
on the New York Stock Exchange (NYSE) but not much later that
same year, rumours began to circulate that Enron’s profits were
not all as they had been reported to be. Internal whistleblowers
eventually alerted independent banks, regulators and congres-
sional investigators to inspect and uncover a complex web of
warped and off-balance-sheet dealings that concealed millions
upon millions of Enron debt.
By December 2001, Enron’s share price had collapsed to zero.
The company had in effect been declared worthless and its stock
was de-listed from the NYSE. Thousands of employees were
made unemployed and, worse, having been encouraged to
invest in Enron, they lost all their savings as well.
Several Enron executives were charged with breaking the law.
Andrew Fastow, the Chief Financial Officer who personally
gained around US$30 million (!) in corrupt management deals,
and his assistant Michael Kopper, who made US$7 million, were
variously charged with fraud, money laundering and conspiracy
to inflate Enron’s profits.
Meanwhile, auditors Arthur Andersen who were supposedly
responsible for uncovering the truth became instead the first
ever accountancy firm to be convicted of obstructing justice and
as such it can no longer perform audit work. As a result, the Big
Five US accountants (others being Deloitte & Touche, Ernst &
Young, KPMG International and Pricewaterhouse Coopers) are
now the Big Four.
Source: The Washington Post.
© 2004 Tony Cleaver

F U R T H E R R E A D I N G
Atkinson, B., Livesey, F. and Milward, B. (1998) Applied Economics,
Macmillan. The first seven chapters are a readable and comprehen-
sive analysis of business organisation and competition.
For a fascinating insight into monopoly, oligopoly and conspiracies
against the public’s interest, see the history of the oil industry at
http://www.micheloud.com/FXM/SO/,
which features John D.
Rockefeller and Standard Oil, and
http://www.washingtonpost.com/
wp-srv/business/enron
which features the Enron collapse.
Summary
• Market economies are built upon recognised private property. Only if
ownership is defined and protected in law can contracts be entered
into, trade expanded and economic growth secured.
• If an enterprise increases either its labour force or its capital stock
alone it will find that output grows but in steadily diminishing
amounts.
• A business experiences economies of scale if, by increasing all inputs
in proportion to one another, it becomes more efficient and reduces
average production costs. In contrast, diseconomies of scale will
lead to an increase in ACs as the size of the business expands.
• Any profit-maximising business will expand production up to the
point where the cost of the next product just rises to equal the
revenue earned – that is, up until MCs equal MR.
• In a perfectly competitive business environment, the nature of
competition keeps prices down level with ACs so that only normal
profits are earned.
• Monopoly results from erecting barriers to the entry of new firms.
One producer can then dominate a market, keep prices high and
enjoy abnormal profits in the long run.
• Oligopoly is a market structure where there is an inevitable tempta-
tion for a few, very large enterprises to collude to make profits at the
public’s expense. In the last resort it is incumbent on government
watchdogs to safeguard the public interest.
© 2004 Tony Cleaver

4
I N F L AT I O N A N D
U N E M P L O Y M E N T – B O O M
A N D B U S T
The wonderful, automatic mechanism of market forces has
a powerful hold over the mindset of most economists. Unrestricted
competition between buyers and sellers leads to the evolution of
a market price that equates scarce supplies to effective demand.
Market equilibrium results with costs close to revenues, normal
profits rewarding enterprise and prices signalling what, how and for
whom goods should be produced. The role of government in such
an ideal world is to establish market institutions and enforce the
rules of trade – especially outlawing monopolistic practices that
threatened the public interest.
There are many critics of such a system of economic organisa-
tion, however. Many ordinary people complain about its inequity:
incomes are determined by the fickle nature of consumer demand;
essential goods may be priced out of reach of those in need; precious
environmental assets may be degraded. This is an argument of
normative economics: one that accepts that the market mechanism
works – but it produces outcomes which some people consider
socially unacceptable.
The argument that will concern us first, however, is one of posi-
tive economics – one which expresses doubt about the market
mechanism’s efficiency. Will it actually work to equate demand and
supply of all resources as its advocates say it will? Economists have
argued between themselves for decades about whether or not the
© 2004 Tony Cleaver

unregulated market is capable of reaching and sustaining general
equilibrium for a country as a whole. This is the ongoing debate
over
MACROECONOMICS
.
There is no doubt that markets work very efficiently in the
production and distribution of fresh food. They have for centuries –
from mediaeval market places to sophisticated modern supermar-
kets. As mentioned in
Chapter 2
: we take such complex organisation
for granted, but producing and distributing such perishable produce
as coffee, milk, oranges and so on is generally amazingly successful.
We neither trip over rotting fruit and vegetables in city centres nor
are we starved of choice – markets clear with no waste. Vast popula-
tions are catered for around the world in a mind-boggling maze of
trading relations that ensures demand meets supply.
If the market for perishable fruit achieves balance then surely all
markets together will similarly secure
GENERAL EQUILIBRIUM
of an
economy as a whole?
T H E F A L L A C Y O F C O M P O S I T I O N
Not necessarily. Because one action on its own is efficient, it does
not mean that all similar actions added together will bring about
the most efficient, economical allocation of resources as a whole.
That is the
FALLACY OF COMPOSITION
.
Suppose you leave work early to avoid the rush hour and miss
all the traffic. That is a perfectly reasonable and rational action that
succeeds on its own. But if everyone chooses to do likewise then, in
aggregate, this action fails. Everyone gets stuck in the traffic.
John Maynard Keynes, the brilliant twentieth-century econo-
mist who revolutionised the subject, applied the same logic to
money, incomes and employment. Two examples will suffice.
First, consider the role of savings. If you and I save a larger
proportion of our income this year then next year we will be that
much richer. Put, say, 10 per cent of our income away then next
year not only will we have 10 per cent more but we might get
added interest too. Save more this year and we earn more next year.
Now think through the consequences if the whole country did
the same. If everyone stopped spending 10 per cent this year and
saved more, then national consumption will drop. All businesses
would sell less, earn less and thus would have to reduce costs and
© 2004 Tony Cleaver

outputs – lay off workers and/or cut wages. National income would
fall by 10 per cent. So, if everyone saves more, everyone loses.
Next look at the case of wages. Market economics asserts that if,
in your job, you ask for wages that are too high you won’t get taken
on by employers. Conversely, if wages are too low there may be
plenty of businesses willing to employ such cheap labour but there
will be too few workers willing to sell their skills for so little. Wages
will adjust over time, therefore to a level that just equates the
amount of work offered to the supply of the labour willing to take
it on. The equilibrium wage equates demand (from employers) to
the supply of labour.
This is the key function of the price mechanism – to clear
markets. By this argument, there can be no unemployment. If there
was, the excess supply of labour would bid wages down, employers’
demand for labour would increase such that the unemployment
would gradually disappear.
You should be able to see that this self-adjusting mechanism,
even if it does work in one labour market, cannot work in all
markets added together. A fall in wages in one sector, say the
restaurant trade, might well attract employers to employ more
waiters, kitchen staff, etc. But if wages fell across the whole
economy, assuming no immediate and corresponding fall in prices,
national income would again fall, aggregate consumption must fall,
there would be less business for everyone, and so employment in all
sectors would fall in the short run, not rise.
We thus enter the world of macroeconomics – the economics of
all markets in a country aggregated together. We need different
theories, analyses, models to understand the workings of entire
nations since, as has been demonstrated, what works efficiently at
the level of individual consumers and producers need not work in
aggregate for society as a whole.
T H E C I R C U L A R F L O W M O D E L
To analyse an economy as a whole it is useful to start with a break-
down of society into households and firms. Households on one
hand act as consumers of all final goods and services; they also act
as owners and providers of land, labour, capital and enterprise: an
economy’s productive resources. Firms, in contrast, act as the
© 2004 Tony Cleaver

suppliers of consumer goods and also as the employers of all
resources. Households and firms, employment of resources and the
demand and supply of all consumer goods and services are all linked
together in one nation-wide circular flow as illustrated in Figure 4.1.
Note that the top half of the Figure 4.1 illustrates a market for
all consumer goods and services: money and goods are exchanged
between buyers and sellers; and the bottom half represents the
market place for factors of production: where employers pay for the
productive resources they wish to hire.
Money flows around the economy therefore in the direction of
the arrows – in the form of spending on consumer goods and serv-
ices in the top loop, and in the form of incomes exchanging for the
hire of resources in the bottom loop.
There is a qualification we need to make to this national circular
flow, however. Not all household income is immediately spent on
CONSUMPTION
. Some fraction may be saved and, of course, some
percentage of income is always taxed away by governments.
For the time being we can ignore the influence of government
taxes and concentrate on what happens to
SAVINGS
– all money not
spent. Where does income saved actually go?
Consumption spending
Households
Firms
to land, labour, capital and enterprise
Incomes from work
Figure 4.1 The circular flow of incomes and consumption.
© 2004 Tony Cleaver

In modern, financially sophisticated economies, much of those
savings will go into banks. Nowadays a variety of commercial
financial institutions have evolved to hold your savings in one form
or another – private banks, building societies, savings-and-loans
institutions, unit trusts and pension funds. The more trustworthy
the financial infrastructure in an economy, the higher a fraction of
a nation’s savings will find its way into these accounts.
The corollary of this for less developed countries is, of course,
that a much lower fraction of the nation’s savings will be re-cycled
into financial institutions. It is not so customary to deposit hard-
won incomes in less well-understood banks and commercial houses;
and savings may not always be in money form but stored in the
Box 4.1 Informal finance
Much economic activity in poor countries comes from what is
called the
INFORMAL SECTOR
– small-scale enterprise, unlicensed,
unrecognised and operating for the most part beyond the protec-
tion of the law. This sector includes small farmers, artisans,
independent traders and a whole host of self-employed who
operate in rural and urban settings with whatever funds they can
command. Any savings from this sub-economy are in the form of
goods and services in kind, promises of support that might be
called on in the future, rarely in unspent revenues. On the other
hand, credit needed to re-stock, or hire simple equipment must
come from informal moneylenders, pawnbrokers, or larger land-
lords who can charge exorbitant rates of interest on loans. There
is no formal banking system that can cater for such small-scale
operations that are spread across the entire country – the admin-
istration and information costs of serving such a clientele are
prohibitive, given the small turnovers involved. Aggregate
production can nonetheless be great in total – representing
between a third and a half of national income in some cases. But
as a result of such fragmented and missing financial markets in
poor countries, informal savings cannot be easily recycled to
meet investment needs. This is a major obstacle to develop-
ment, as will be seen.
© 2004 Tony Cleaver
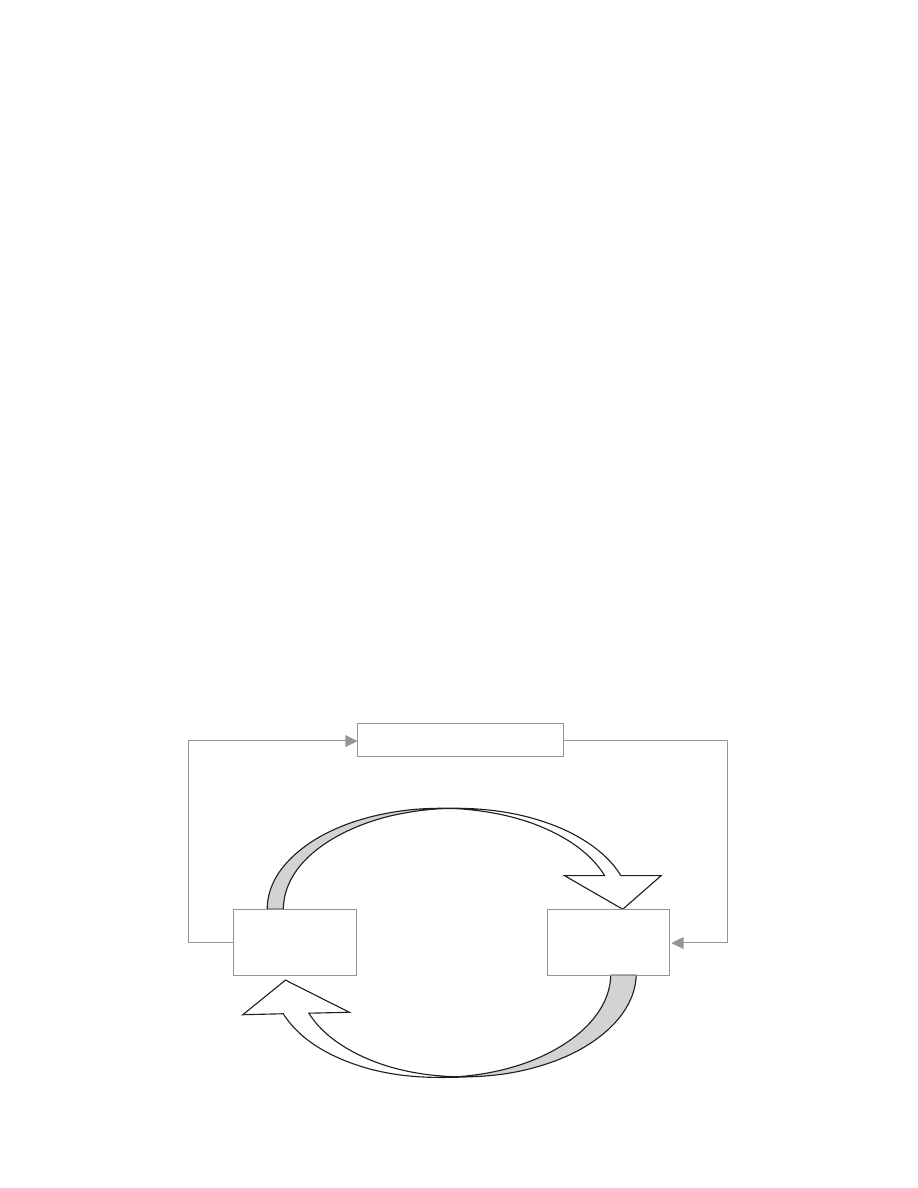
form of local produce or even in promises owed by friends, family
and associates.
In the developed world, national savings rates may be relatively
high and the great bulk of these funds flow into formal financial
institutions. In poorer countries, not only will the percentage of
national income saved be lower but also much saving will not find
its way into the formal banking sector at all (
Box 4.1
).
In the circular flow diagram illustrated in Figure 4.2, all savings
represent a leakage from the system – a decision to postpone
current consumption. Insofar as these savings are placed in financial
institutions there is the possibility, however, that these funds can be
recycled back into the national economy: banks make loans to firms
in order to fund
INVESTMENT
.
For the sake of simplicity, we need to consider only bank loans
which finance industrial investment (in reality, many savings go to
finance consumption but we can ignore these and assume these
funds never left the circular flow in the first place). The issue that is
important for macroeconomic purposes is what happens if the flow
of savings which leak out of the system on the one hand does not
equal investment which is injected back into the economy on the
other. There is, after all, no reason why these two flows should be
equal since they represent decisions by very different people and
institutions in the community.
Figure 4.2 Savings and investment in the circular flow.
Households
Firms
Financial intermediaries
Savings
Investment
Con
sumption spending
Incomes
© 2004 Tony Cleaver

It should be seen that, as in any fluid system, if the
LEAKAGES
from the flow are just a little more than
INJECTIONS
then the aggre-
gate level of money and incomes circulating the economy must
slowly decline. Conversely, if injections into the flow are larger
than leakages, aggregate incomes must rise over time.
We can begin to see here the illustration of what Keynes called
the
PARADOX OF THRIFT
: that, although saving seems to be a virtue for
the individual, if a whole community saves then aggregate incomes
fall. There is no guarantee that national income will remain stable,
therefore, so long as savings and investment are out of line.
Free market economics is not so easily confounded, though. It is
asserted that a country’s banks act as
FINANCIAL INTERMEDIARIES
–
dedicated to matching up savings on the one hand with loans (for
investment) on the other. What happens if these two flows do not
equal each other? Banks in a free market will set into operation the
price mechanism to ensure financial, and thereby national, equilib-
rium. We return to the operation of demand and supply that was
analysed before.
Check
Figure 4.3
overleaf. Consider that savings represent the
supply of funds into financial markets; loans that go to facilitate busi-
ness investment represent the demand for funds. If supply exceeds
demand the price of funds will fall. Conversely, if demand exceeds
supply the price of funds will rise. Changes in the price of money –
known as the market rate of interest – act like prices in the market
for oranges, or coffee, to ensure that there is always equilibrium.
According to mainstream, or
NEOCLASSICAL ECONOMICS
, the
supply of savings in a country rises as the rate of interest (the
reward for saving) increases. Conversely, the demand for funds for
investment will fall if borrowers have to pay too high a price. The
two conflicting objectives meet at the market equilibrium rate r*
where the aggregate total of savings just equals the aggregate total
of investment at q*.
What happens if there is an exogenous rise in the country’s
savings S to S1? The equilibrium rate of interest will fall to r** so
that there is no occasion when leakages and injections to the
national income are not equal.
In this case, therefore, financial markets play an enormously
important role in the national economy – adjusting interest rates in
order to secure balance between leakages and injections into the
© 2004 Tony Cleaver
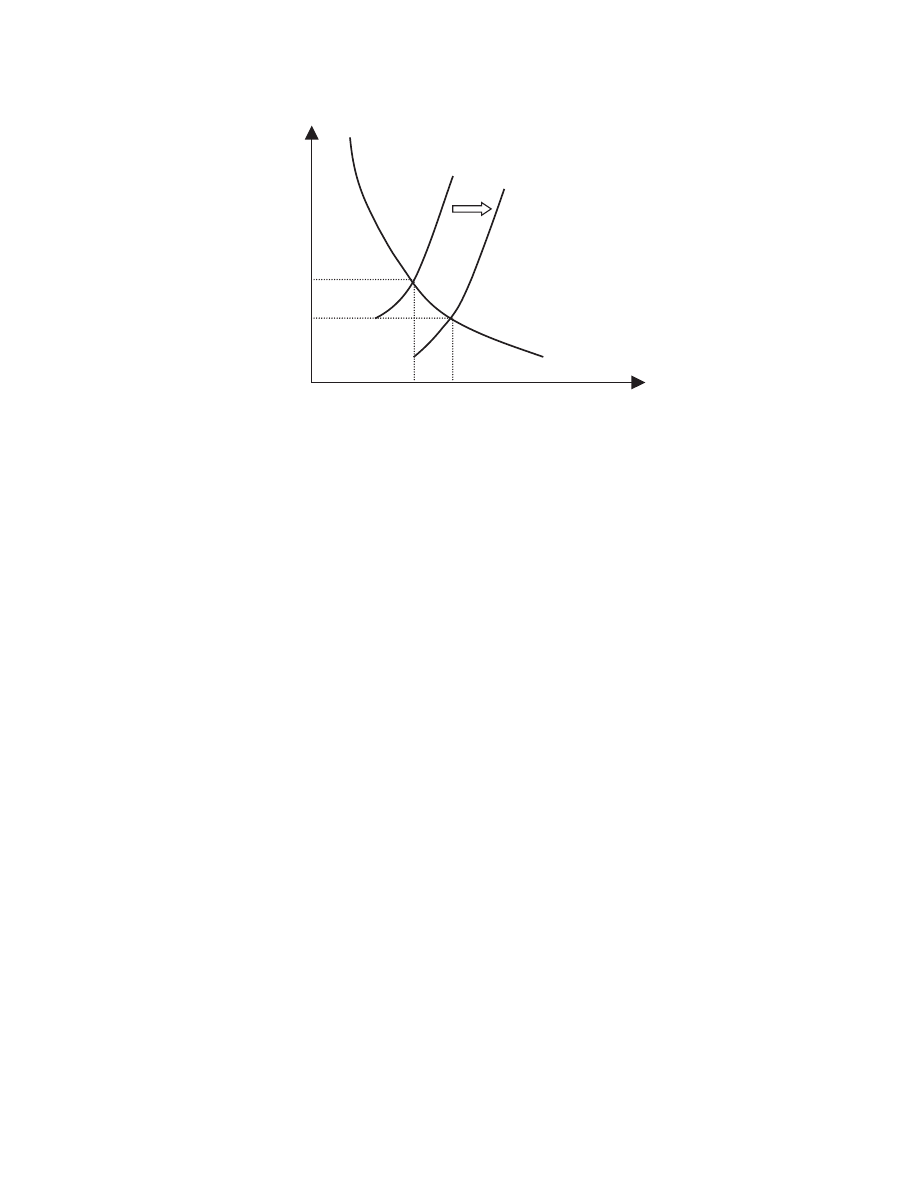
flow of incomes, between savings and investment, so that the
economy as a whole experiences neither
INFLATION
nor
RECESSION
;
neither boom nor bust. With flexible markets, therefore, the
economy as a whole attains general equilibrium at full employment
where the aggregate supply of goods and services creates just suffi-
cient income to generate an equal and opposite aggregate demand.
B o o m s a n d S l u m p s
If only it was always like that. The fact is that there are times when
economic events do not work out as market theorists maintain and,
in such times, it is very difficult to give an explanation as to what is
going on and what is the best that should be done.
The 1930s Great Depression was just such a time – when millions
were thrown out of work in all developed countries around the world –
and similar fears have been expressed recently in Japan and, to a
lesser extent, in Germany and the USA. Depression, or recession, is a
time of rising unemployment and – in the extreme –
DEFLATION
(falling prices). When prices are falling, though it seems welcome to
the individual consumer, for the economy as a whole it is dangerous
because people will stop spending. This is another example of the
fallacy of composition. For you and I, if we can buy certain goods
The rate of
interest
Supply of savings
S
S1
r
*
q
*
r
**
Investment
demand
Quantity
Figure 4.3 The financial marketplace.
© 2004 Tony Cleaver

later at lower prices than today then it makes sense: we make money
by delaying purchases. But if everyone stops spending then the
circular flow of money, consumption and incomes in the country will
inevitably fall. The national income goes down and unemployment
will certainly rise. Ouch!
In Japan today (see
Box 4.2
), like in North America during the
Great Depression, leakages and injections to the circular flow have
not been balanced by the movement in rates of interest, as market
economics dictates. In deflationary circumstances, net leakages from
the economy are still positive even though rates of interest are at
rock bottom.
As was said at the opening of this chapter, free market theory
has a powerful hold over the mindset of many economists. The
dominant
PARADIGM
, or worldview, so influences thinking that it is
a struggle to see the phenomena in any other terms. It takes genius,
plus the accumulation of lots of other evidence, to shift received
perceptions. In 1936, the Great Depression provided the evidence;
Keynes provided the genius.
Re-read some of the circular flow analysis earlier – especially
related to how savings differ for low, as opposed to high, income coun-
tries. This implies a different way to model savings and investment in
an economy than neoclassical market economics.
Keynes argued that the main determinant of the volume of
savings in an economy is not the market price of money (the rate
of interest) but the level of income. That is, if rates of interest rise
by a relatively large amount, people will still not save more in their
bank accounts. But if people’s incomes rise substantially then they
will put money aside. (It can thus be argued that savings are
price-inelastic but income-elastic in supply.)
Keynesian macroeconomics holds that savings are a leakage from
the circular flow and that they are primarily a function of income,
rising from some negative amount at very low income levels but
then increasing more steeply as incomes rise (see
Figure 4.4
).
In contrast, the demand for funds for investment – the key stim-
ulus to the economy – is neither primarily determined by rates of
interest nor levels of national income. The most potent influence on
investment is business
EXPECTATIONS
of future profits. If the outlook
is profitable then even high rates of interest on borrowing will not
dissuade the eager investor, and equally if future expectations are
© 2004 Tony Cleaver

Box 4.2 Japan: a modern case of Keynesian demand deficiency
Japan has recently been stuck in a Keynesian recession – the first
of its kind, some would argue, since the Great Depression held
the USA in its grip.
A
GGREGATE DEMAND
in Japan is well below that necessary to
generate full employment, the rate of inflation is close to zero
and so are interest rates. US economist Paul Krugman noted
that the 10-year bond rate in 1998 was less than 0.7 per cent, that
is, financial markets were then betting that recession would last
for at least ten years.
Savings ratios in Japan have always been high and well above
those in the USA and so a contemporary fall in consumer
spending cannot be the cause of the recession. Krugman attrib-
utes the problem to low investment and even lower expectations:
a typical Keynesian explanation of aggregate demand deficiency.
Why should investment be so low? There are a number of
contributory causes. First a speculative boom (particularly in
property prices) burst at the end of the 1980s, which provoked a
recession as people then saw their assets tumble in value.
Misguided government monetary policy in the early 1990s
pushed up interest rates and prolonged the squeeze on spending
still further. Several banking and financial scandals eroded public
confidence, as did the government’s slow and inadequate
response. And beneath it all, the ageing population and slow
productivity growth have created a less innovative culture.
Business expectations are poor and pessimism is self-reinforcing:
things are bad because they have been bad for so long.
Krugman estimated that Japan suffers an output gap below its
potential full employment level of between 7 and 8 per cent of
GDP. There is sizeable room for expansion, but how to fill this
demand deficiency or output gap?
The government cannot help. The amount of public spending
that would be needed to plug the void that the private sector has
created is simply too great. Such a conservative ruling elite that
fills Japanese public office would anyway not countenance
anything like the sort of excessive spending needed, even if the
finances could be found.
© 2004 Tony Cleaver

gloomy then it is likely that even very cheap loanable funds will
not change the entrepreneur’s pessimistic mood.
Investment is thus exogenously given by a factor other than
income. It is assumed fixed at Q, by forces (expectations) outside
this simple model.
Simple though it is,
Figure 4.4
carries a very powerful message.
Look what happens at low income levels, that is below the level Y*
illustrated. Over this range of incomes – from 0 to Y* – the level of
savings or leakages in the national economy is less than Q, less than
the level of exogenous investment. So long as more money is being
injected into the system than is being taken out, the circular flow of
incomes and spending must therefore grow.
Conversely, at levels of national income greater than Y* the
amount of savings leaking out of the circular flow is greater than
the level of injections. National income must decline. Either way,
the economy moves to a unique equilibrium at Y* – through
a movement of income levels.
The Japanese financial sector cannot help. Banks have been
guilty of over-lending, making too many bad and corrupt loans
and thereby fomenting the crisis in confidence. Outside
observers have argued the whole mess needs to be cleared up
and this implies tightening money controls – not a recipe for
economic stimulus.
If nothing else can be done then the only solution is somehow
to encourage an exogenous increase in consumer spending.
Since deflation – falling prices – gives the incentive for the
Japanese to withhold all household purchases (in anticipation of
lower prices later) so Krugman argues for the opposite. If people
were convinced that inflation will rise, they would go out and
spend more immediately, rather than wait and have the real
value of their money reduced by higher future prices. His recom-
mendation – for the Japanese Central Bank to create inflation:
‘How about a 4% inflation target for 15 years?’, he asks.
Source: Krugman, P. (1998) ‘It’s Baaack: Japan’s Slump and the Return
of the Liquidity Trap’ Brookings Papers on Economic Activity, No. 2.
© 2004 Tony Cleaver
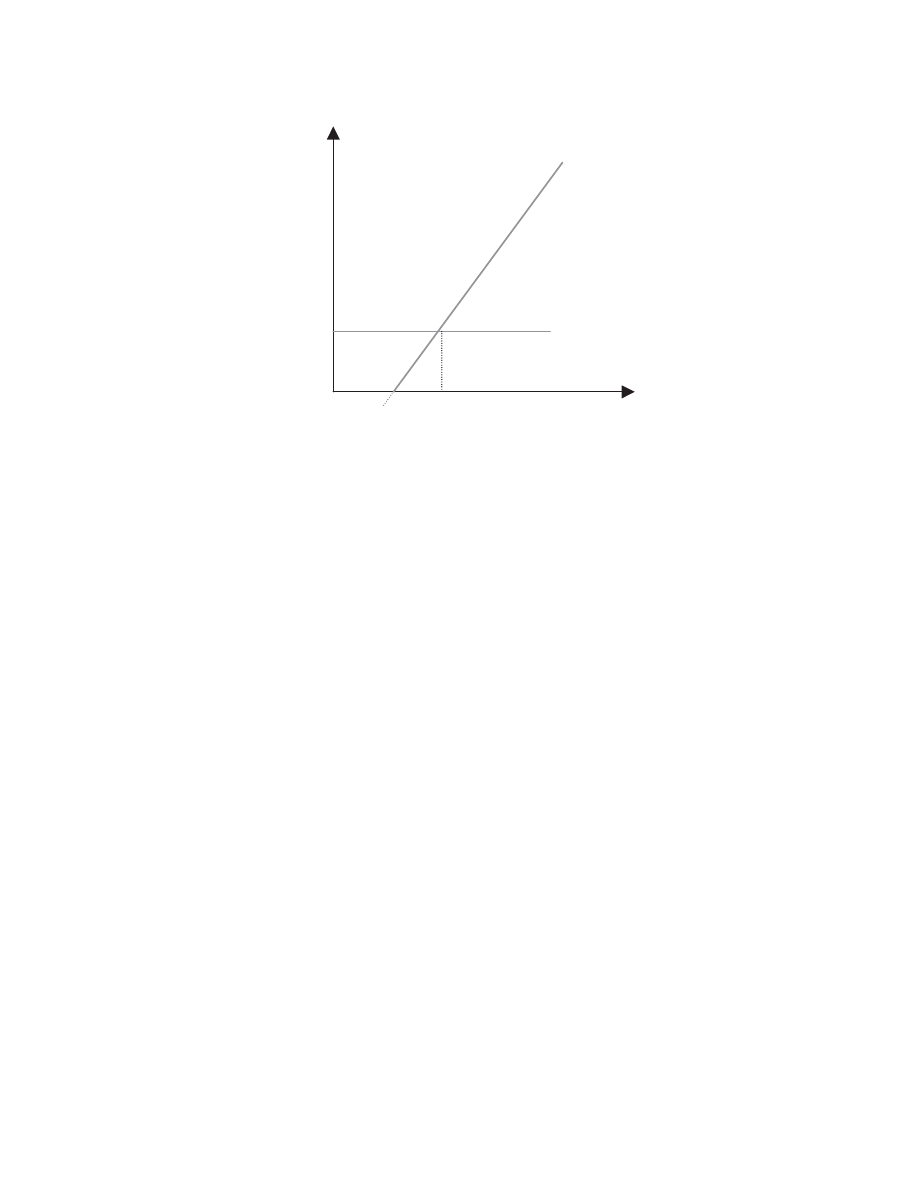
This needs emphasising. According to the Keynesian macro-
economic model any imbalance of savings and investment, leakages
and injections, in the economy is not matched up by a mere move-
ment of interest rates in financial markets but by a relentless
movement up or grinding down of all income levels in an economy.
What are the implications of this? It means that if, for some
reason, business confidence in aggregate is low and there is thus a
fall in the general level of investment in the country then, despite
financiers’ temptations to lower interest rates and practically give
money away, there will be a net flow of un-recycled money piling
up in banks and finance houses. Aggregate spending will fall, profits
will fall, industrial production will either fall or result in increasing
stocks of unsold inventory, unemployment will eventually rise and
the country’s level of income will slowly, relentlessly fall. The
economy will enter a slump, which will be prolonged until incomes
fall low enough for the level of aggregate savings to decline to the
already low level of autonomous investment. We can call this the
LOW
-
LEVEL EQUILIBRIUM TRAP
.
The opposite scenario is now easy to predict: if business confi-
dence and investment rises then, at the existing level of national
income, injections will exceed withdrawals from the system and so
Savings
(leakages)
Q
Investment
(injections)
0
Y
∗
National income
Quantity of savings
and investment
Figure 4.4 Savings and investment functions.
© 2004 Tony Cleaver
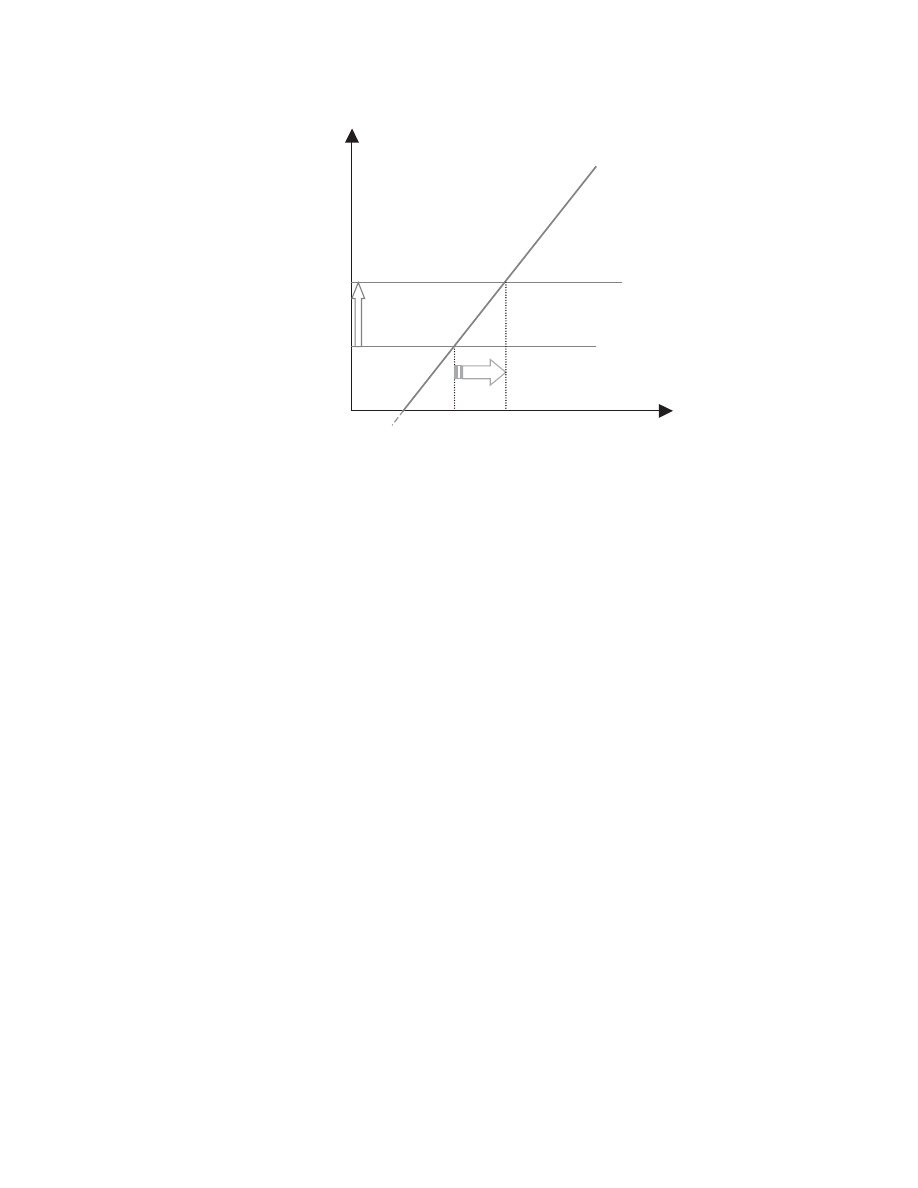
the circular flow will increase. Income levels will continue to
rise until the new equilibrium is reached, as illustrated at Y** in
Figure 4.5.
Investment rises from Q to Q1. At original income level Y*, the
amount of investment/injections (the distance 0 to Q1) is now much
higher than savings/leakages (0 to Q). National income grows there-
fore from Y* to Y** where the two flows are again equal.
Note that how far income grows, given an increase in invest-
ment, depends on the slope of the savings function (see Figure 4.5).
The steeper this line, the less income will grow; conversely the
more slowly savings rises with income, the more any given stim-
ulus to the economy will cause greater growth of income (
Box 4.3
).
An important implication of this Keynesian model is that a
country’s income level need not be stable over time. Contrary to the
market paradigm, it suggests that there are no guarantees that the
movement of prices will always keep the economy in some happy
balance. The variable flows of savings and investment may bring
the economy to rest at some level of aggregate spending too low to
secure employment for everyone or, conversely, spending may be
greater than domestic production can satisfy – in which case a surge
in inflation (continually rising prices) may be the result. Neither
outcome is particularly pleasant.
Quantity of savings
and investment
Savings
Q1
Q
0
Y
*
Y
**
Investment
Income
Figure 4.5 An increase in investment.
© 2004 Tony Cleaver

Box 4.3 The investment multiplier
Any autonomous increase in investment in an economy may
have a multiplied impact on incomes. Suppose, for example, it
was decided to build £10 millions worth of more houses in a
given region. First of all there would be purchases of land,
increased employment of labour, more spending on construc-
tion materials, etc. This represents an injection of £10 million to
the incomes of resources immediately employed. The house-
holds receiving those increased incomes would, subject to
a certain propensity to save, then increase their spending on a
whole host of consumer goods. This flow of spending promotes
a second round of income increases as the providers of these
consumer goods benefit from the surge in spending. Then, in
turn, the recipients of second round incomes increase their
spending and so we can begin to see that what started as an
increase in construction spending in one part of the economy
slowly spreads and multiplies around the entire economy. What
began as an injection of £10 million could result in an increase
in aggregate incomes of very much more than this as the
impulse of spending goes round and around the circular flow.
The extent to which incomes multiply in the economy is deter-
mined by how much of the injection in spending is passed on as
extra consumption, as opposed to saved (or leaked) out of the
system. If the
MARGINAL PROPENSITY TO SAVE
(mps, i.e. that fraction
of an increase in income that is saved) is high then clearly not
much will be passed on to local traders in the form of extra
spending. Incomes will not multiply very much. If this propensity
to save is low, however, then spending rapidly passes on to
others who pass it on to yet more others, and still others, and
national income as a whole will keep rising until, eventually, total
savings just rises enough to equal total investment again – but
now at a much higher income level.
This principle is illustrated in
Figures 4.5
and
4.6
. The mps is
illustrated by the slope of the savings function – it shows how
fast savings rise as incomes rise. A high slope, or high mps, as
shown in Figure 4.5 means that less income is re-cycled and thus
© 2004 Tony Cleaver
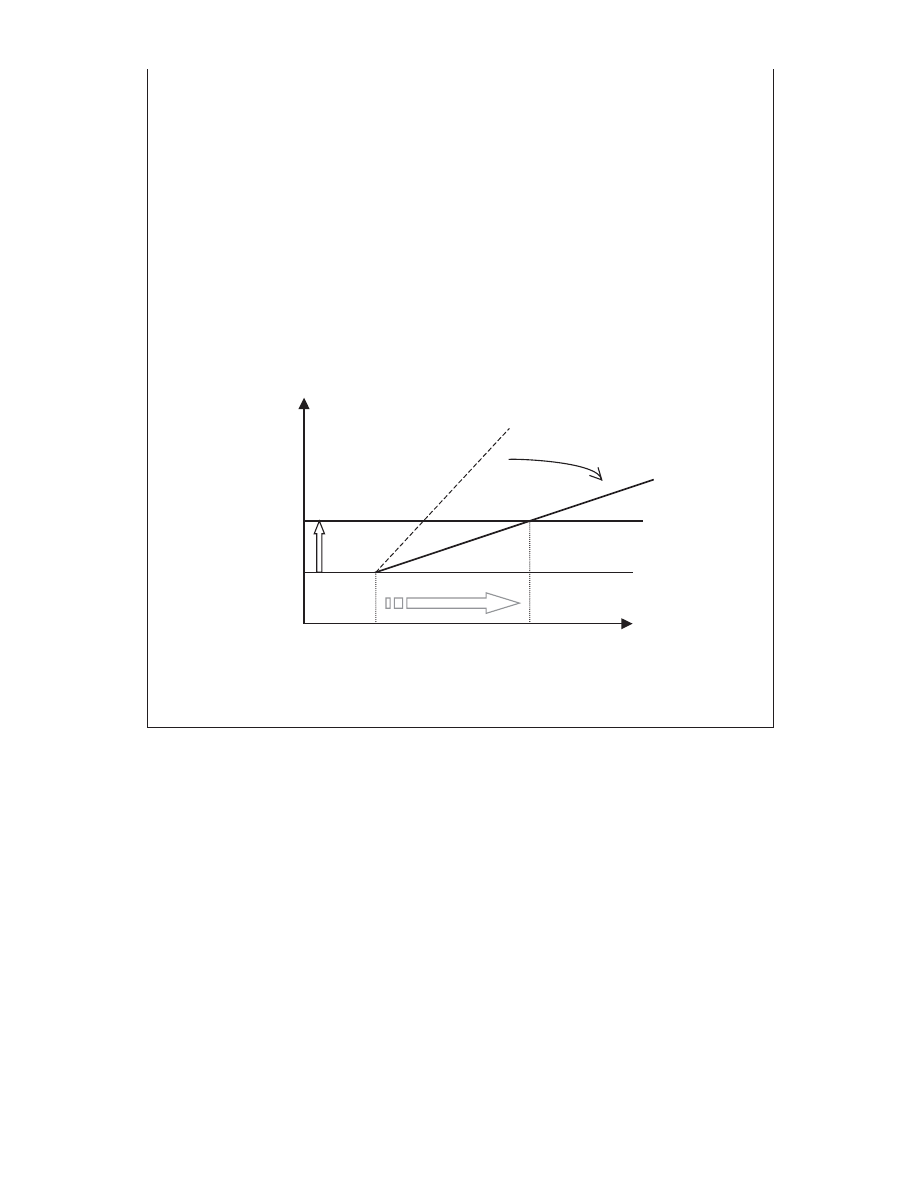
In the short run, a country’s stock of productive resources is given.
The maximum level of potential national output – which corresponds
to the maximum level of national income – that can be produced in
any one year is thus relatively fixed. Whether this level – which is
consistent with full employment of all resources – is actually
produced or not, according to Keynes, depends on the aggregate
level of demand in the country.
Consider Figure 4.6. Suppose that savings rise with income as
illustrated by S2, investment varies between Q and Q1 yet full
employment of the economy is reached at income level Y**. Clearly
there is no a priori reason why savings should equal investment,
and the economy thus be in balance, at this precise level.
a given injection of investment leads to a small multiplier.
Income grows from Y* to Y**. In Figure 4.6, however, the mps
is much lower and so with the same injection it produces a
greater increase in income, Y* to Y
⫹. (Spontaneous changes in a
country’s mps, though uncommon, can arise due to momentous
national events, such as the end of a war. For modern-day
Japan, we noted earlier, Krugman recommends a similar positive
shock to spending brought about by a shift in inflationary
expectations.)
Quantity of savings
and investment
S1
A change in mps
S2
Q1
Investment
Q
Y+
0
Y
*
Y
**
Income
Figure 4.6 A larger multiplier.
© 2004 Tony Cleaver

Equilibrium might just as well be below this (at Y*) in which case
some resources in the economy will suffer unemployment; or equi-
librium might be above this level (at Y
⫹) in which case, if
production cannot rise above Y**, then inflation will persist.
(Aggregate spending will exceed the economy’s capacity to produce.)
Result? The Keynesian model predicts that national income is
inherently unstable – that is, booms and slumps in fortunes are to
be expected – all depending on the size of injections to and leakages
from the circular flow of aggregate demand.
T H E C O N T I N U I N G D E B AT E
So, is the market economy a fully automatic, self-regulating
system capable of securing general equilibrium for a country as
a whole? The Keynesian critique, in the previous section, says no.
Unemployment at one extreme or inflation at the other are the
inescapable consequences of an economy where aggregate demand
adds up to either insufficient, or too much, spending to balance
aggregate supply. Any self-righting market forces within the
economy working to restore balance are said to be too weak to be
effective.
This is a major, positive-economic criticism of the market system
and, since its first articulation way back in 1936 (in Keynes’ master-
piece, The General Theory of Employment, Interest and Money) it
has provoked an ongoing controversy.
That all economies experience periods of inflation and unem-
ployment is self-evident. What accounts for these unwelcome
phenomena is something much more contestable.
The Keynesian argument is clear – that variations in unregulated
aggregate demand (particularly caused by the instability of private
investment) are the prime culprit. Note that the important twentieth-
century policy recommendation derived from this thinking was that
if private markets were too volatile to keep injections equal to leak-
ages at the full-employment level of national income required, then
governments had to intervene. Governments should increase their
own spending when aggregate demand was otherwise too low and
decrease their spending when aggregate demand was so high as to
be inflationary. Such a policy recommendation was known as
DEMAND MANAGEMENT
(see
Box 4.4
).
© 2004 Tony Cleaver

Box 4.4 Demand management and government budgets
Governments spend money on education, health, transport,
defence and a whole range of services to the nation which must
be paid for – if not by direct pricing – by levying taxes. The
balance of public sector spending on one side, against tax
revenues on the other, is recorded in the government’s
BUDGET
.
Note that government expenditure acts as an exogenous injec-
tion into the domestic economy whereas taxes act as a leakage
to reduce people’s incomes and spending. This fact enables
governments to use their budgets in an active
FISCAL POLICY
to
directly influence the circular flow of national income.
Suppose business expectations are pessimistic, investment is
less than aggregate savings and financial markets cannot induce
further investment, even though interest rates are rock bottom.
National income will fall as recession grips the economy. In such
circumstances, Keynesian economic policy is for governments to
spend more than they tax. If the government’s budget is in
DEFICIT
then the domestic economy must be receiving the money
the government is losing (assuming no outflow of international
funds). Private sector investment may be low but net injections
will rise if public sector investment compensates to build more
roads and hospitals, employ more people and pay them wages.
An economy in recession can thus be stimulated if the govern-
ment makes the injections which the private sector is unwilling
to provide. Notice in this example that savings outweigh private
investment so therefore the government can finance a budget
deficit by borrowing from the financial markets which are flush
with funds that no one else wishes to employ. As the economy
recovers due to the fiscal stimulus, incomes will grow and along
with them tax revenues will rise to pay off the (low-cost) loans
the government originally borrowed.
The converse of all this also applies. If investment is greater
than savings, injections exceed leakages and inflation threatens,
then governments can aim to increase taxes and make a budget
surplus to take the heat out of the economy and ensure that
aggregate demand attains equilibrium at full employment level
and not higher.
© 2004 Tony Cleaver

In his time, Keynes’ writings were so revolutionary that he
became the world’s most famous economist and his legacy on the
subject as we know it today is immense. His theories and the policy
implications that flowed from them changed the accepted paradigm
such that the post-Second World War international economy was
dominated by governments, think tanks and policy makers of all
stripes all advocating demand management policies.
But just as he challenged the orthodoxy of classical economics
which preceded him, so other economists have since had to over-
come the intellectual stranglehold that the Keynesian paradigm
exerted in the post war years.
The most famous economist living today, Milton Friedman, is
one who has been in the forefront of re-establishing neoclassical
economics and in challenging both the Keynesian notions that
market economies are not self stabilising and that they therefore
need government macroeconomic regulation.
Friedman, and other neoclassical economists, do not dispute
there is a role for government intervention in
MICROECONOMICS
(e.g. to break up monopolies and promote competition amongst
suppliers, as discussed in the last chapter). But they say there is
more likelihood that government spending at macroeconomic level
will be actually destabilising and lead to more problems of unem-
ployment and inflation, rather than the opposite.
This neoclassical position, at its extreme, asserts that Keynesian
theory gives governments the excuse to increase spending beyond
budgets and, once you let this particular genie out of the bottle you
will never get it back in. Government spending increases year on
year as public officials find more and more reasons to overshoot
budgets; budgets are thus revised and yet again they are overspent.
The end result is an increasingly bureaucratic public sector that
grows with a mind of its own and crowds out the private sector –
which loses revenues, dynamism and the potential for supporting
the national economy in the long term.
Inflation, Friedman argued, was and is the result of central authori-
ties allowing excessive monetary growth. Cut back the money supplies
and you cure the problem. The opposite extreme experienced by the
US in the Great Depression of the 1930s was caused by a sudden and
severe collapse in money supplies due to a chain reaction of commercial
bank failures. Remedy? Governments should set a steady course with
© 2004 Tony Cleaver

money supplies growing at a rate just equal to the rate of growth of
all goods and services in the economy and then they should leave the
market well enough alone. Markets may not be perfect but they are
better than the alternative – ham-fisted attempts by governments to
‘stabilise’ the macroeconomy.
T H E C O N T R O V E R S I A L C O R R E L AT I O N
The Keynesian notion that a country’s aggregate demand determines
the level of economic activity was supported by the empirical find-
ings of Professor A. W. Phillips in 1958 which seemed to show
beyond contention that, for almost a century, the UK’s rate of infla-
tion had varied inversely with unemployment in a remarkably stable,
almost predictable way. As unemployment went down, inflation went
up, and vice versa. It thus supported the Keynesian theoretical model
that said you either get unemployment if aggregate demand is too
low or inflation if aggregate demand is too high. It also supported
political advisors who suggested you could get less unemployment,
and thus more votes, by increasing government spending.
The Phillips correlation dominated policy thinking of the time. It
was an incontrovertible piece of analysis that seemed to prove you
had to live with either one extreme or the other or find some not-
entirely-happy medium. The compromise that most developed
countries chose to live with in the immediate post war years was a
degree of creeping inflation. It was thought to be the necessary
price for reducing unemployment.
Friedman’s voice (also that of another US economist Edmund
Phelps) arguing to the contrary was not heeded outside the field of
theoretical economics. Notwithstanding the irrefutable evidence of
an inflation/unemployment trade-off stretching way back into the
nineteenth century, these two economists separately argued that if
governments began spending money to try and reduce unemploy-
ment, in effect opting for a bit more inflation, then the supposedly
reliable correlation would break down.
Friedman, in a famous address to the American Economics
Association in 1967, said that the Phillips’ curve illustrated in
Figure 4.7
offered a reasonable prediction of policy alternatives in a
world where zero inflation was the norm; that is, where years in
which there was inflation were counterbalanced by years of deflation.
© 2004 Tony Cleaver
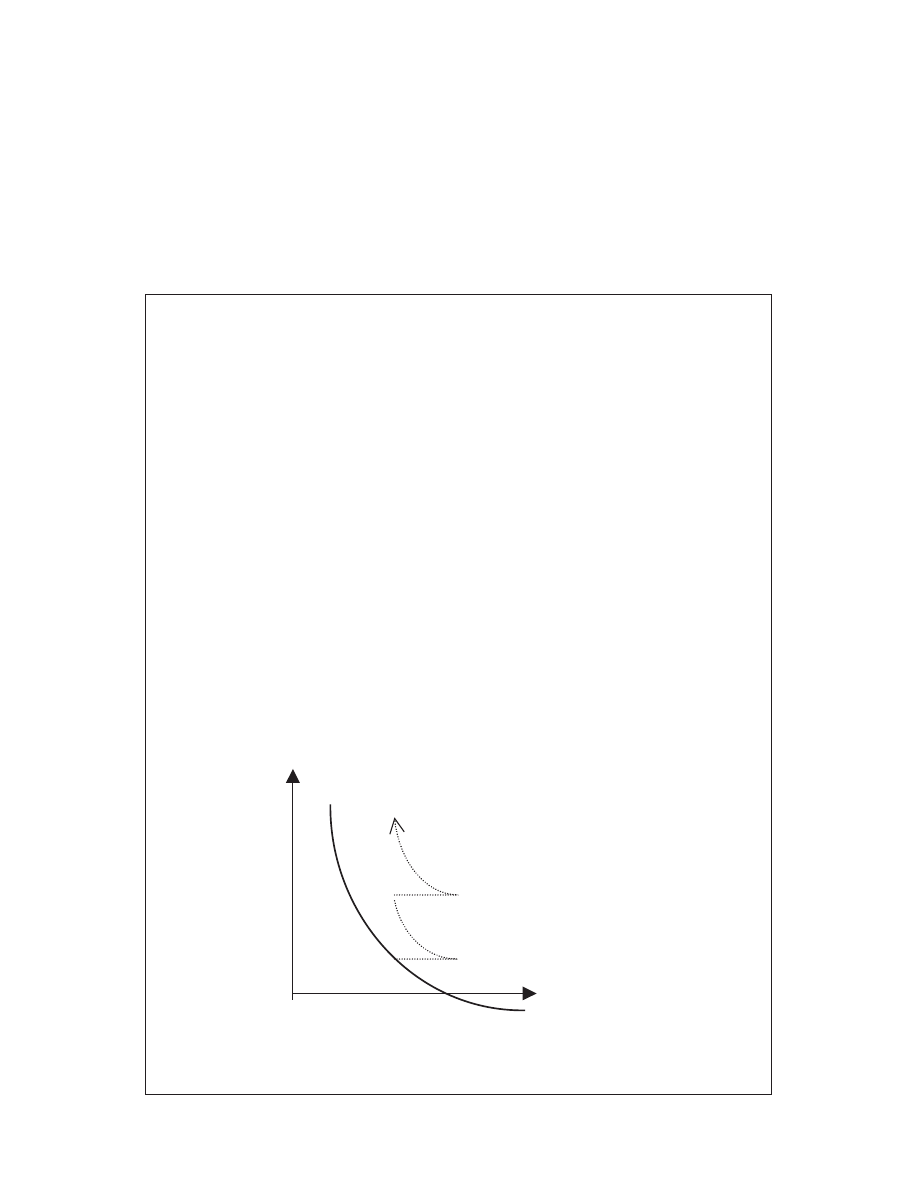
But as soon as people expected governments to fuel inflation over a
continuing period then they would build that into their wage
demands. And as soon as that happened, if governments still
persisted in their spending plans to reduce unemployment, there
was the potential for inflation to accelerate (Box 4.5).
Box 4.5 The trade-off that shifted
The
PHILLIPS CURVE
PP (Figure 4.7) illustrates data for UK wage
inflation against unemployment over the entire period
1862–1958. It shows a remarkably stable trade-off. Friedman
predicted, however, that if governments deliberately attempted
to peg unemployment to some level B below what he called the
natural level A then this original trade-off would inevitably break
down as the Phillips curve shifted up and out.
Assume government spending reduces unemployment below
A (1) but leads to an increase in inflation (2). Next round wage
claims would build in this increase – which would then lead to a
fall in demand for labour (3). If government increases spending
yet again, inflation now rises to (4). This leads to even greater
wage demands – returning unemployment to (5). If the cycle
keeps repeating, the end result will be that inflation/unemploy-
ment locii explode off the curve: 6, 7, etc.
Inflation
P
4
5
6
7
2
3
1
Unemployment
0
B
A
P
Figure 4.7 The Phillips curve and movements off.
© 2004 Tony Cleaver

In the 1970s it was more than economists who took note of what
Friedman said. Most of the western world, in reaction to the OPEC
oil shocks of 1973 and 1979 (see Box 4.6), experienced accelerating
inflation almost precisely as predicted. A shift in inflationary expec-
tations provoked a wage–price spiral and many democratic
governments – unwilling to take the political risk of allowing
unemployment to rise – opted to spend money instead with the
exact consequences as illustrated earlier.
The world seemed to have adjusted to living with inflation –
only to find that once started, it was a notoriously difficult process
to hold in check. For economists and advisors of the Keynesian
school, the events of the late 1970s condemned them to the margins
of policy-making whereas Friedmanite analysis and recommenda-
tions now captured the centre-ground. The macroeconomic
paradigm shifted once more.
Box 4.6 OPEC and the oil price shocks
The Organisation of Petroleum Exporting Countries was formed in
1960 in an accord between original members Iran, Iraq, Kuwait,
Saudi Arabia and Venezuela. But it was not until the USA in partic-
ular, in 1973, began to import increasing amounts of oil as its own
supplies fell short of demand that OPEC could act as a successful
cartel. The spark that lit the oil crisis was the 1973 October War
between Arabs and Israelis when OPEC shut off oil supplies in
retaliation to Western support of Israel. The price of world oil
soared 400 per cent between October 1973 and January 1974.
For oil-consumer countries in the rich and poor world alike,
the 1970s was a time of painful adjustment to high oil prices and
the inflation this fuelled. Just as they thought they were coming
out of it, in 1979 oil prices surged again. This time it was the
Iranian revolution when the pro-Western Shah of Iran was
deposed by Muslim fundamentalists who again shut down sales
of Iranian oil. By the 1980s, however, governments in the West
had changed and economic policies had changed with them (see
section ‘The supply-side consensus’).
© 2004 Tony Cleaver

T H E S U P P LY - S I D E C O N S E N S U S
Economics is not an exact science. Things never turn out quite the
way theory predicts since – unlike the ‘hard’ sciences such as
Physics – there are so many variables beyond the economists’
control. But for evidence to confirm theoretical predictions as
comprehensively as was demonstrated in the inflationary 1970s was
really remarkable. Friedman, famous already, became even more
renowned and his influence now extended to policies advocated by
decision-takers all round the world, just as had been the case with
Keynes, earlier.
Any attempt by governments to spend their way out of reces-
sions was now condemned. By extension, almost any initiative for
governments to intervene in the economy was heavily criticised.
Right-wing, free-market conservatism – with the ascent to power of
Margaret Thatcher in the UK and Ronald Reagan in the USA – now
dominated the political agenda.
In the short term, it was alleged that a country’s productive
resources were more or less fixed and their allocation between
competing uses was best decided by unrestricted market forces.
Trying to reduce unemployment below its ‘natural’ level by increas-
ing aggregate demand could not increase national income/
output/aggregate supplies one iota – it could only stimulate increasing
inflation as already described.
This implies that the original Phillips curve PP becomes super-
seded by the new version: an
EXPECTATIONS
-
AUGMENTED PHILLIPS
CURVE
, which is a vertical line at point A (
Figure 4.8
).
What are the policy recommendations that flow from this?
Ignore inflationary meddling with aggregate demand – focus
instead on the microeconomic features of the
SUPPLY
-
SIDE
of the
economy.
Only policies that are aimed at making resources more flexible
and responsive to market forces could hope to reduce unemployment
and improve a nation’s fortunes.
L
IBERALISATION
,
deregulation,
privatisation,
removing the
allegedly dead hand of government, were all the new buzz words
of the 1980s supply-side revolution. Markets had to be set free so
that they would restore flexibility and dynamism to Western
economies.
© 2004 Tony Cleaver
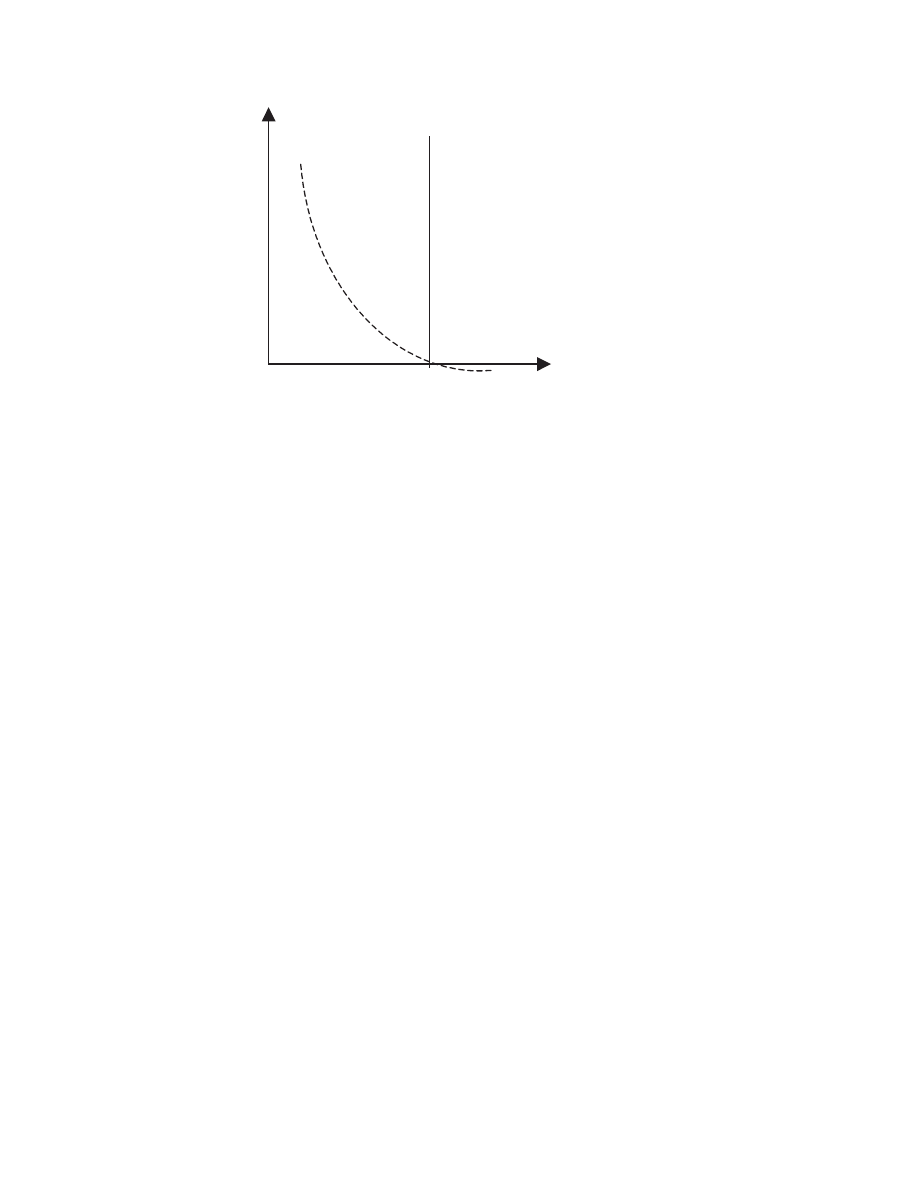
The tenets of this latest orthodoxy in macroeconomics were now
as follows:
●
Central authorities varying money supplies cause most of the
instability in an economy. Money growth should be fixed at
a rate commensurate with that of long-run trend growth of the
economy and then left alone.
●
There is no long-run trade-off between inflation and unemploy-
ment.
●
The economy is inherently stable such that if disturbed by
misplaced government meddling then it will return eventually to
the long-run equilibrium at the
NATURAL RATE OF UNEMPLOYMENT
.
●
The natural rate of unemployment is increased by the provision
of welfare payments which allegedly give people an incentive
not to work, and by minimum wage laws and protective labour
legislation that inhibit hiring and firing workers.
●
Future expectations, the actions of unions and the flexibility of
prices and wages all impact on inflation and misguided government
intervention can exaggerate these influences.
Such an economic philosophy dictates a detailed restructuring of
the relationship between the government and the economy as
a whole.
Inflation
P
P
A
0
Unemployment
Figure 4.8 The expectations-augmented Phillips curve.
© 2004 Tony Cleaver

F i s c a l D i s c i p l i n e
First, supply-side economics requires governments to balance their
budgets, live within their means and thereby stop inflationary
spending. Loss-making industry should not be bailed out in the
mistaken pursuit of trying to protect jobs. Similarly, it also means
reducing welfare payments and handouts to workers. This saves
government money, lets failing industry fail and prompts workers
to move to new, growing firms. On the side of taxation, high
MARGINAL INCOME TAX RATES
should be cut and the tax base broad-
ened. Such discipline also addresses the problem of incentives (Why
should industry strive to be efficient if government bails out
failure? And why should the individual work if earned income is
highly taxed and unemployment brings you benefits?).
P r i v a t i s a t i o n
State-owned or
NATIONALISED INDUSTRIES
should be sold off to
whichever private investors might be interested (e.g. telephones and
telecommunications) and closed down where industries have no
buyers (e.g. coal). One-off sales of public industry will net large
revenues for the government which can be used to pay off the
NATIONAL DEBT
and balance budgets over the longer term and simul-
taneously they remove altogether the permanent drain on the
public purse of otherwise loss-making dinosaurs.
D e r e g u l a t e a n d Fr e e - U p Tr a d e
Competition should be promoted wherever possible. Barriers to
entry and exit in private industry should be removed. In the public
sector, quasi-markets can be introduced in health, education services
and in public broadcasting to simulate competition between
suppliers. In labour markets, improve labour mobility by breaking
up restrictive trade unions that act as monopoly suppliers of labour
whilst increasing job information and training to allow workers to
move. In finance, remove restrictions on the international move-
ment of money, the barriers to foreign banks, and the demarcation
of different loan markets between building societies, banks and all
other money houses.
© 2004 Tony Cleaver

P r i c e F l e x i b i l i t y
Release the price mechanism to operate unhindered. The price of
domestic money, the price of labour and the price of international
currencies should, in particular, all move up and down without fear
or restriction. That is, rates of interest, wages and foreign exchange
dealings should be determined by free markets and not fixed by
some rule, regulation or legislation.
D e - P o l i t i c i s e M o n e y
Last but certainly not least, remove politics from the determination
of the money supply – that is, make the nation’s
CENTRAL BANK
independent of day-to-day control by government. Give the
governor of the central bank a target to keep inflation down and
under control and leave him/her to get on with it, irrespective of
unemployment effects and free from political interference.
The short-term
SOCIAL COSTS
of implementing these measures
have caused much debate. Cutting industrial subsidies and closing
down businesses whilst at the same time reducing spending in the
public sector must mean increasing unemployment. Such policies
combined with reducing and re-targeting unemployment benefits
are likely to increase poverty and hardship. ‘Broadening the tax
base’ is coded language for increasing taxes on a wider range of
goods and services – that is, increasing prices. Reducing marginal
income tax rates may leave high-income earners with more money
to spend but doesn’t help the lower paid.
Widening extremes of poverty and wealth are the inevitable
result of such policies – but this is justified, according to this new
classical paradigm, if the value of money and the efficiency of
markets is to be restored. It is worth the risk if incentives to work,
invest and produce are all improved and opportunities to climb out
of the lower income levels are similarly increased. The overall
impact on the economy, it is alleged, is to make it more dynamic,
entrepreneurial and growthfull. National income will thus grow
faster and raise everyone’s standard of living over time. And the
quicker these reforms are implemented the better – it will reduce
any social costs involved in adjusting to the new economic realities
(see New Classical school later).
© 2004 Tony Cleaver

This revolution in economic philosophy – turning back from
Keynesian thinking in favour of unfettered markets again – drove
major changes in the 1980s not only in the developed countries of
Europe and North America but also in the developing world. It was
a shift in priorities to address inflation, curtail government excesses
and to play down attention to unemployment. The Washington-
based and highly influential institutions of the International
Monetary Fund (IMF) and the World Bank actively promoted these
views (see Box 4.7). There continued some disagreement over the
short-term costs of implementing the recommended package of
market reforms but mainstream macroeconomic analysis was, on
the whole, won over by the new consensus.
Box 4.7 The Washington Consensus
The early 1980s, a time of inflation and recession for many in the
developed world, saw the emergence of a major debt crisis for
poorer countries. The policy package to reduce inflation, listed
earlier, meant cutting back money supplies in the rich countries –
which inevitably raised interest rates. (A shift back in world
supplies forces up the price of money.) Poorer nations that had
borrowed from them now faced huge debt repayment charges
that they could not afford.
The IMF and the World Bank were asked for help – which they
offered at a price. In return for providing financial assistance,
these Washington institutions insisted that market-friendly,
supply-side reforms must be put in place in all countries that
had become heavily indebted. Some might argue this was
holding a gun to the head of the poor. Others would insist it is
simply forcing bad debtors to put their financial houses in order.
Either way, the new economic orthodoxy was spread from policy
advisors and governments in the rich world to the poor. It
became known as the Washington Consensus and it had a bitter
taste for the many whose standards of living were worst affected.
Poor country governments were forced to cut back on costly
welfare programmes, to reduce
TARIFF
barriers and other trade
restrictions that protected domestic industry, to devalue their
© 2004 Tony Cleaver

currencies and to free up their internal markets to foreign
capital. This entails promoting freer international competition in
goods and free movement of (rich country) investment funds to
buy and sell (poor country) indebted business.
Taxes were raised, incomes and consumption reduced,
budgets balanced and funds generated to pay off debts. But as
anyone in debt knows, it is not the overall amount of capital you
owe that is important, what counts is how much time you have
to pay it off. For many in the developing world the complaint was
that they were forced to pay too high a price, too quickly.
For mature market economies, I have described the paradigm
shift that occurred in the 1970s: government intervention was
now held to blame for subsidising declining industry, over-
protecting labour and ossifying wages and prices. In such
circumstances, one can understand the call for markets to be
freed up and cajoled into competitive efficiency – but even for
the rich world this analysis is hotly contested and its dangers are
emphasised (see the New Keynesian argument in the section
‘Monetarist, classical and New Keynesian differences). For poor
countries where modern markets are missing, fragmented or
underdeveloped, there is even less justification for promoting
such radical, neoclassical policies.
Where labour is unskilled and uneducated, where land is tied
into traditional practice, where capital has accumulated in
informal and untitled assets, these resources cannot move freely
to new and productive employments in response to market
signals. If free trade is introduced in countries where industry is
struggling to develop, such business is likely to collapse in the
face of unrestricted competition from foreign multinationals.
Those skills which the local populace have acquired can be
tempted away to take up employment overseas (the
BRAIN DRAIN
),
and untapped natural resources such as mineral deposits and
native flora and fauna can be exploited too cheaply. With heavy
debts, poor countries might even offer cut-price
DEBT
-
EQUITY
SWAPS
where foreigners are offered large shares in local business
in exchange for paying off the loans these businesses have
incurred. (A strategy criticised as ‘selling off the family silver’.)
© 2004 Tony Cleaver

M O N E TA R I S T, N E W C L A S S I C A L A N D
N E W K E Y N E S I A N D I F F E R E N C E S
For Europe and North America, starting from a situation of high
inflation and high unemployment in the early 1980s, what are the
problems involved in attempting to bring a country back to stable
equilibrium?
This is a question about the disinflation costs or sacrifice ratio of
curtailing aggregate demand and trying to return a country from
point 7 back to point 1 on the Phillips diagram (
Figure 4.9
).
Mainstream economists following Friedman’s
MONETARIST
philos-
ophy would argue that money supplies must be cut back – the
initial cost involves a short-term increase in unemployment as
industry slowly adjusts to falling demand. This involves a move
from 7 to 6. As inflation lowers, however, and the real value of
money increases, more workers offer themselves for work at the
going wage and employment thus increases from point 6 to 5.
A further reduction in money supplies leads to another fall in
inflation and, as expectations shift down again, so the market
economy slowly adjusts to living with less and less inflation – from
The Washington Consensus is not necessarily a policy
package that fits the needs of all countries, therefore. The direc-
tors of the World Bank and of the IMF eventually conceded this –
though only after years of forcing painful cuts on Latin America
and Africa, in particular. In November 1999, in an IMF confer-
ence on what were called ‘second generation reforms’ both
Michel Camdessus (then managing director of the IMF) and
James Wolfensohn (president of the World Bank) signed up to
policies focussed on helping the poor and improving equity.
Camdessus actually agreed that ‘too much attention is focussed
on how markets operate rather than on how they develop’. They
realised (painfully late) that premature implementation of poli-
cies that assume the existence of efficient markets actually
inhibits their evolution.
© 2004 Tony Cleaver
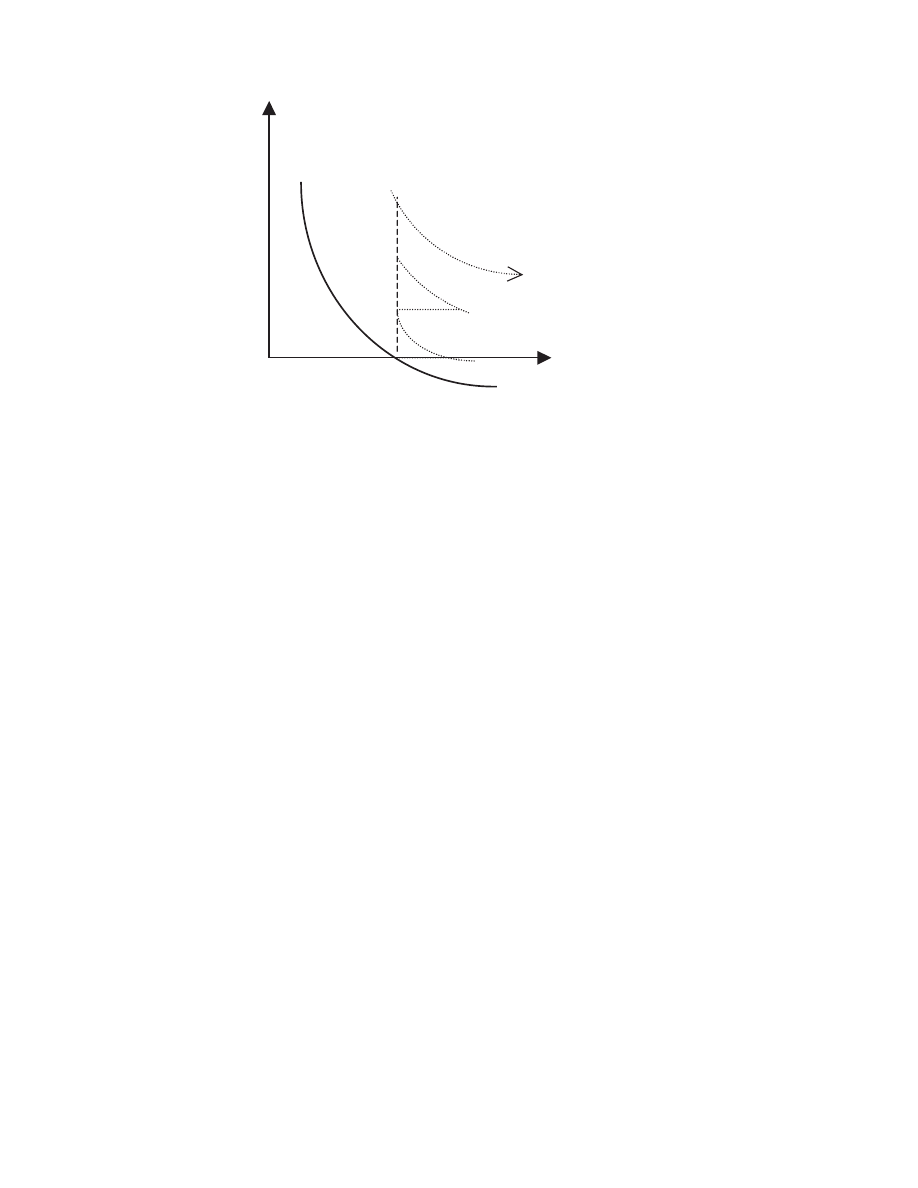
points 4 to 3 to 2 – until the stable equilibrium at the natural rate of
unemployment is reached at point 1.
This deflationary process of shifting back down short-term
Phillips curves thus reverses the inflationary spiral that Friedman
warned about, earlier. In sum, the sacrifice the economy makes to
restore eventual market equilibrium is fluctuating unemployment,
around the distance 2 to 1 (or 4 to 3, or 6 to 5) on the diagram,
which continues for the period of time necessary to squeeze infla-
tionary expectations out of the picture. It is an argument for
short-term pain to achieve longer-term gain.
This analysis was developed further by the
NEW CLASSICAL
school
of thought – which followed Friedman’s original tenets of mone-
tarism yet applied to it the logical extreme of rational expectations.
If governments firmly establish their credentials as hard-line anti-
inflationists; if they act consistently, relentlessly and publicly, then
their actions will swiftly impact on expectations and markets will
clear straightaway. There would not even be a short-term increase
in unemployment. If expectations are converted instantly into
actions then, they argue, just as inflationary spending will immedi-
ately push prices up a vertical Phillips curve, so deflationary cut-backs
will bring prices straight down again, from point 7 to 1 on the
diagram. The unemployment sacrifice is minimal (a very attractive
proposition to politicians!).
Inflation
Unemployment
P
P
7
5
6
K
3
1
4
2
0
Figure 4.9 Disagreement over disinflation costs.
© 2004 Tony Cleaver

The only economists to disagree with the bulk of this modern
consensus in economics were the
NEW KEYNESIANS
. Swimming
against this tide (like Friedman before in the 1950s and 1960s) they
still rejected any notion of a stable macroeconomic equilibrium at
some ‘natural’ level of unemployment. If inflation was to be
reduced by a cut-back in aggregate demand then, far from markets
clearing instantly or even in the short term, the market economy
might not clear at all. Unemployment might get stuck at high
levels. Their analysis implies a move from point 7 on the diagram to
a point like K, or even further out. Keynesians argue that it is the
level of aggregate demand which determines where an economy
comes to rest – so long as spending in the economy is suppressed,
so will be employment and incomes.
C O N C L U S I O N
What does the evidence show as the correct interpretation between
these three rival schools of thought? Typically in economics, the
macroeconomic realities at the onset of the new millennium are
sufficiently varied as to leave plenty of room for disagreement.
Contractionary monetary policies were pursued by many devel-
oped nations in the 1980s which did provoke industrial closures,
increasing unemployment and widening income differentials.
Clearly many institutions in countries all around the world had
grown used to government protection and were highly resistant to
change. (The same argument continues to be repeated today for
much of Europe’s agricultural and labour markets which have not
taken all the free market medicine swallowed by other nations.)
Considerable pain was thus endured by many peoples for many
years before inflationary expectations were squeezed out of their
economies.
For less developed countries, the 1980s was ‘the lost decade’ since
living standards were lower in 1990 than they had been ten years
earlier (see
Table 4.1
). Similarly, in the USA and UK, though
average incomes increased, the gap between the richest and poorest
nonetheless widened.
The economic sacrifice made by those suffering these defla-
tionary policies was certainly not minimal, therefore, prompting
Friedman to comment in 1993 that the New Classical argument
© 2004 Tony Cleaver

‘as a hypothesis about the real world . . . has been contradicted by
experience’. His monetarist assertion that it was necessary only
to control money supplies to reduce inflation and, further, that the
macroeconomy would return to equilibrium after suffering only
short run unemployment could equally be contested, however.
Money supplies both in the UK and the USA proved impossible to
contain in liberalised financial markets (see
Chapter 5
), prompting
additional deflationary measures. And the short run is a very
elastic, imprecise concept. How long can democratic governments
leave a country languishing in recession before the free market
supposedly returns to equilibrium? Ten years or more is a long
‘short run’ and would seem to lend support to New Keynesian
assertions that economies can get stuck in a recession.
Through the 1990s and into the new millennium, however, we
have seen steady improvements in certain countries that have
persevered with supply-side policies. Nations as different and
distant as the UK, Chile, New Zealand and the USA have all experi-
enced consistent falls in inflation and increases in employment and
economic growth as the reforms instituted have slowly brought
results. Microeconomic supply-side policies to free up markets have
begun to work, making resources more mobile to adjust to changing
world demand. At the same time, however, as global fortunes have
been buffeted by one crisis or another, central banks in the USA and
the UK (less so in Europe) have similarly acted to stabilise aggre-
gate demand by swiftly bringing down interest rates as private
sector consumption has faltered.
In conclusion, both macroeconomic and microeconomic reforms
are necessary to secure growth with stability. The level of aggregate
demand must be high enough to prevent recession, and government
monetary and fiscal policies can work to offset booms and slumps,
Table 4.1 Gross National Income per capita (US$).
1980
1990
Sub-Saharan Africa
560
480
Latin America and
1,960
1,730
Caribbean
Source: World Bank, World Tables 1994.
© 2004 Tony Cleaver

as Keynes advised. Equally, however, if resources are protected in
inefficient and unchanging employments then an economy cannot
escape long-term sclerosis and decline. Much time, encouragement
and painful effort may be needed to facilitate the occupational and
geographical mobility of a nation’s productive assets.
Has recent experience demonstrated the failure of Keynesian
economics and the success of the supply-side revolution? It is a
false dichotomy. Keynesianism does not recommend unrestricted
interventionism and neither can deregulating and liberalising trade
guarantee growth and development. There is a role for both govern-
ment action and free markets.
Summary
• Classical economics asserts that flexible prices will ensure equilib-
rium in labour, financial and all other markets such that there is
attained one unique level of income and employment for an eco-
nomy as a whole, where the aggregate supply of goods and services
just equals the level of aggregate demand.
• The experience of the 1930s depression confounded such confidence.
Keynes argued that market economies are inherently unstable and
may require government demand management policies to maintain
general equilibrium.
• Phillips’ original findings that inflation increased at the expense of
unemployment seemed to corroborate Keynes’ analytical model,
though the 1970s experience of inflation and recession served to
overthrow the Keynesian paradigm and promulgate Friedman’s
monetarist and neoclassical views.
• Friedman argued that monetary discipline combined with microeco-
nomic reforms to liberalise markets could contain both inflation and
unemployment.
• Such policies have been widely adopted since the 1980s, though
unemployment and widening income disparities have proved to be
a significant social cost. Despite this, macroeconomic policies to
adjust interest rates and aggregate demand, and microeconomic
policies to free up trade are today both accepted as important instru-
ments of government economic management.
© 2004 Tony Cleaver

F U R T H E R R E A D I N G
Friedman, M. (1968) ‘The Role of Monetary Policy’, American
Economic Review, Vol. 58, No. 1, pp. 1–17. A classic monetarist
paper, readable and still very relevant, this is Friedman’s address to
the American Economic Association in 1967 where he first intro-
duced the world to concepts such as the natural rate of
unemployment and what was later to be called the expectations
augmented Phillips curve.
Cleaver, T. (2002) Understanding the World Economy, Routledge.
My own text with more explanation of microeconomics and macro-
economics (
chapter 3
); unemployment and inf
lation (chapter 4).
For masses of fascinating detail and data on different countries in
the world, check the websites for the IMF and the World Bank:
http://www.imf.org
and
http://www.worldbank.org
© 2004 Tony Cleaver

5
M O N E Y, B A N K S , B U B B L E S
A N D C R I S E S
Money makes the world go round. In order to trade, dealers must
use a recognised and acceptable form of money and this then
enables goods and services to be exchanged and incomes to be paid.
The need to use money and yet safeguard its use led to the first
banks, and the subsequent creative manipulation of other people’s
money has since given rise to the modern, massive, international
financial industry.
In general, the growth of banking and the resulting globalisation
of finance has accompanied the increasing wealth of nations, but it
has been a roller-coaster ride at times. On occasions, too much
money has been loaned out – only to be followed by recriminations
all round when creditors, in the attempt to get their money back,
close down banks and sell off the businesses they supported. Money
is essential to conduct trade; it requires the growth of financial
specialists, and there arises, therefore, the occasional irresponsible
use and abuse of financial power. It is to these issues that the study
of economics must now turn.
T H E N AT U R E O F M O N E Y
Money is a unique commodity that is only as good as other people
think it is. The notes and coins that you have in your pocket may
look pretty tangible and appear valuable to you but, first, most
money in the world does not have any physical form at all (it exists
only as a matter of computer record on bank balance sheets) and
© 2004 Tony Cleaver

second the value of any currency is only determined in exchange –
and if someone else won’t accept it, it’s worthless.
A M e d i u m
Money is first and foremost a
MEDIUM OF EXCHANGE
. It thus
facilitates the circular flow of national income and output described
in
Chapter 4
and, indeed, without money far less trade and income
growth would be possible. Money allows each of us to specialise in
our chosen profession, exchange our labour for money income and
then trade this for any and all commodities that we may choose to
buy in the market economy. Without money we are reduced to
BARTER
– perhaps swapping work for payment in goods and then
attempting to pass off whatever we are given for something else we
want from another. Successful barter is very rare since it requires a
double coincidence of wants (we can strike a deal only if you’ve got
exactly what I want and I’ve got exactly what you want). The trans-
actions costs involved in everyone trying to trade in this way are so
huge that it inhibits any economic growth for society above subsis-
tence level. Everyone would wear out shoe leather trying to go
around bargaining for an acceptable deal, trades agreed in one place
would vary with others elsewhere and perishable commodities like
essential foodstuffs would deteriorate in the process. Agreeing to an
acceptable medium of exchange obviates all this.
What is an acceptable medium? It used to be gold. Something
that everyone valued intrinsically for itself, which could be verified
for its purity, could be measured out in fine, divisible units, easily
carried and which did not deteriorate. It thus possessed most of the
ideal
QUALITIES OF MONEY
. Key to its use as money was its accept-
ability across cultures – all round the world, people valued gold as
a precious asset.
Due to its success as a form of exchange, gold in fact became
too scarce. With trade made profitable for payment in gold, produc-
tion increased, trade expanded and merchants plied the world.
But with insufficient gold to support the increase in world output
the price of gold must rise and the prices of all other goods and
services must correspondingly fall (deflation). The use of other
precious metals (principally silver) was thus resorted to. This gave
rise to the first quarrels over
EXCHANGE RATES
– the price at which
© 2004 Tony Cleaver

one currency could exchange for another – but markets grew up to
deal with this.
Note however an important distinction: the first monies therefore
differ from today’s by possessing an
INTRINSIC VALUE
. Gold and silver
had a street value for themselves, based on their usefulness in
jewellery and craftwork. This carried advantages and disadvantages. It
guaranteed the acceptability of precious metals – thus ensuring they
could function as a medium of exchange – but it also meant that world
money supplies were susceptible to a steady deflationary drain as
these metals were pressed into service as raw materials in the industry
of fine craftsmanship (i.e. as gold and silver were slowly taken out of
the money supply, that which remained in circulation went up in
value. All other goods must go down in price, therefore).
The invention of paper money avoided this problem. The use of
coins – standardised units of precious metal – predates the Roman
Empire but we have to thank the medieval goldsmiths in London
for the invention of a paper promise to gold or silver. A promise to
pay the bearer on demand the sum of ten pounds of sterling silver
is the origin of the UK ten pound note. The promise is still there on
banknotes today – but the paper itself has little intrinsic value and
the promise now cannot be claimed. It is not backed by any precious
metal. It is thus
FIAT MONEY
: its value is declared by fiat, by the
central authorities.
In fact today, in the twenty-first century, we have a world mone-
tary system that Friedman calls unprecedented in that no major
currency has any link to a commodity and nor is there a commit-
ment anywhere to restoring such a link. Throughout history, he
argues, the only times that governments departed from basing their
currencies on some recognised and accepted commodity (such as the
GOLD STANDARD
) were either very short-lived or disastrous, or both.
The reason for this claim is that if there is no physical limit to
the money supply imposed by, say, the amount of gold or silver that
can be mined then there is always the temptation to issue more
paper promises – banknotes – by whomsoever holds the licence to
print money. And there is no quicker way to undermine a market
society that to debase its currency, as hyperinflations throughout
history have proved (see
Box 5.1
). Once people lose confidence in
the money supply then, unless a ready alternative is available, it
becomes impossible to trade.
© 2004 Tony Cleaver

At the beginning of the twentieth century the world monetary
system operated with all main currencies fixed to a given gold price.
The First World War impoverished Europe, most countries came off
the gold standard and in the case of Germany hyperinflation ensued
since it was unable to pay reparations without printing money.
After the Second World War, under the Bretton Woods agreement
in 1944, all world currencies operated a dollar standard (
Box 5.2
).
That is, they fixed their currencies in terms of the US dollar and
this in turn was fixed to the price of gold – and this system lasted
right up until 1971 when the system broke down. Since then there
has been no anchor to world money.
Confidence has wobbled at times, though so far the international
financial system has avoided disaster. The 1970s, as explained in
Chapter 4
, were times of abnormal inflation and the debt crisis of
the 1980s brought real fear that the world’s system of banking
Box 5.1 The German hyperinflation, 1923
The economic consequences of the peace negotiated at the end
of the First World War proved to be disastrous for Germany. The
victorious nations in the conflict demanded that Germany pay
reparations for the costs imposed on, particularly, French soil.
But Germany was an impoverished country and could only pay
the massive sums demanded of it by printing banknotes. The
more it did so, the more the value of these notes fell and the
more, inevitably, were demanded. And so Germany printed more
and more and more. Eventually, the banknotes became almost
worthless – in the domestic economy people were paid in suit-
case loads of cash which they desperately tried to exchange for
anything of intrinsic value before the notes devalued even
further. Hyperinflations – where prices increase by hundreds and
thousands of per cent – destroy people’s confidence in currency,
make market exchanges impossible and thus provoke economic
collapse. In Germany’s case, the economic and political chaos
created in 1923 led to a vacuum that would later be filled by a
nationalist strongman who would only lead his country into an
even greater trauma.
© 2004 Tony Cleaver

would come crashing down but these difficulties were overcome
despite calls from some critics to bring back the gold standard.
Indeed, the mythical attachment to a gold anchor is neither neces-
sary nor sufficient to guarantee the success of paper money. There
is only one guiding rule. It is financial discipline imposed by central
banks and governments over the long term and the subsequent
confidence that this instils in the public that ensures that a given
banknote is accepted as ‘good as gold’.
A M e a s u r e
A second important function of money is to act as a measure of
value. A common medium of exchange allows you to put a price, or
exchange value, on all things in trade and it is by the operation of
the price mechanism that signals of shortages and surpluses can
thus be conveyed to all consumers and producers in a market
society. Note that no given form of money can fulfil this essential
Box 5.2 The Gold Standard and fixed exchange rates
Prior to the First World War, the currencies of all major trading
nations were freely convertible into gold at a fixed exchange rate.
This implied they were simultaneously all fixed with one another.
Any nation in debt to another would pay the difference in gold
and the outflow of reserves from one country would enforce a
contraction of money supplies, just as a gold inflow would
prompt a monetary expansion. Different countries can only fix
their currency exchange rates between themselves over time,
however, if they all grow in wealth at the same rate. After the
Second World War, the rapid economic growth of West Germany
and Japan, in particular, meant that by the 1970s the
Deutschmark and the Yen possessed an intrinsic worth greater
than their Bretton Woods value fixed in the 1940s. A realignment
of exchange rates was long overdue and since there was no
agreement on fixed values in the inflationary 1970s, exchange
rates were left to float, or vary, according to demand and supply.
© 2004 Tony Cleaver

signalling function if its own value is subject to variation. Hence
the importance of containing inflation.
Measuring value requires some baseline to which all prices can be
compared and it also requires a scale of units. The baseline against
which money itself is valued is a
SAMPLE BASKET
of everyday
commodities – a long list of items which the ‘average household’ in a
society will buy and which is weighed according to their relative
importance. (A 10 per cent rise in the price of bread will imply a
more important fall in the value of money than a 100 per cent rise in
the price of golfballs, for example.) All governments appoint statisti-
cians to compile records and regularly calculate whether or not, and
by how much, inflation has risen and the value of money fallen.
All modern money has a metric scale of units nowadays, though
it was only in 1971 that the UK changed from 240 to 100 pennies
per pound. The larger the number of divisible units, the finer the
gradations of value can be signalled, though you might argue it is
meaningless to retain units that are smaller than any perceivable
differences in value (if one UK pound exchanges for 194.7 yen
which equals 1.8 US dollars, what is one yen really worth?).
A S t o r e
Money should act as a store of value – if it is perishable in any way
then it cannot safely be banked. It makes no sense to accumulate
money if it costs to do so – people might as well stockpile all sorts
of other assets with intrinsic value instead (salt?). Note the accumu-
lation of capital allows the financial services industry to grow and
to invest in all sorts of productive enterprise. People all over the
world put their savings into pension funds so that they have some
income when they retire. This is only possible if people can trust
their money to hold its value over time. What distinguishes ‘hard’
currencies from ‘soft’ ones (terms used at times by financial jour-
nals to describe various currencies) is that the former are a better
store of value – they are less likely to suffer inflation. This function
then facilitates a major feature of all modern money: the ability to
buy now and pay later.
Take care – not all that is a good store of value is necessarily
money. The price of fine wine increases with age and if you have
a lockable cellar it costs little to keep it. Similarly you can have
© 2004 Tony Cleaver

a safe full of stocks and shares that will more than keep their value.
Are they money? No. That is because an essential feature of money
is that it is a perfectly
LIQUID ASSET
that is exchangeable at any time,
at no cost, for anything you want. Selling off wine or stocks and
shares for their full present value (which may have appreciated
considerably) means you have to wait for an appropriate buyer.
Money, on the other hand, is perfectly transferable or convertible at
an instant’s notice. It wouldn’t be money otherwise.
A S t a n d a r d
Money functions as a standard for deferred payment which allows
consumers to buy expensive items (houses, cars) over a phased
time period, enables producers of such goods to sell more and
better regulate their income streams, and provides the opportunity
for bankers to create all sorts of innovative forms of debt and paper
money. Even if the particular form of money in question is a poor
store of value, so long as its value deteriorates (i.e. inflation rises) at
a predictable rate then a compensating rate of interest can be
charged and deferred payment still accepted. (You agree to loan me
85 ducats today for the period of one year. Suppose that in order to
compensate you for the opportunity cost of that money – that is,
the sacrifice of you not using that sum for 12 months and giving it
to me instead – we agree on a deal of an extra 15 ducats. Thus I
should pay you 100 next year. But if the rate of inflation of ducats
is 10 per cent over the year then I am going to have to pay you 110.
Agreed? If so, we can do business even in a ‘soft’ currency.)
T H E F O R M S O F M O N E Y
As has been illustrated already, money comes in many different
forms: such as given weights of precious metals that have since
evolved into coins and notes. The former were originally standard-
ised units of precious metals – like the UK gold sovereign which
was a specific cut and design of gold stamped with the sovereign’s
head to authorise its value. The latter were originally promises to
pay a given weight of precious metal. Coins and notes now are
tokens with no intrinsic value but, interestingly, they have assumed
the mythical property of ‘real money’ like gold since today what
© 2004 Tony Cleaver

mostly changes hands in trade is not cash but pieces of paper or
plastic (cheques or credit cards) that represent cash. You know that
if shopkeepers or traders won’t accept your promise to pay then
they will accept cash (someone else’s . . .). The transaction is the
same, the form of money has changed. In fact the form of money
changes all the time – according to what society you are dealing in
and what it best recognises and accepts. Money, like beauty, is in the
eye of the beholder.
C O M M E R C I A L B A N K I N G
One unit of currency is as good as another. If I borrow 100 units
from you and repay it later it makes no difference if some of
the notes are a bit dog-eared. Assuming no inflation, the value is
unchanged. Unlike if I use your horse to plough my field and it
comes back exhausted, in the case of money there is no deteriora-
tion in its worth. Why pay interest on a loan, therefore?
Exactly this reasoning used to operate up until the Middle Ages.
To charge interest, to early traders and to many even today, is to
commit the sin of usury.
This argument, while understandable, is at odds with modern
economics. It ignores opportunity cost. Money is
LIQUID CAPITAL
– it
is capable of productive employment just like any other capital
good – and if it can be invested in some profitable enterprise then
I lose out if I loan that opportunity to you for free.
Modern Islamic banks are prohibited from lending money at
interest so they must instead find other ways to charge for their
services. One common solution is to become part owners, not
creditors, of an enterprise that they finance and so be entitled to a
share in any profits. That is, they thus receive
DIVIDENDS
on funds
invested, not interest on a loan.
Commercial banking for profit in the Christian world first started
in the Northern Italian states of Lombardy and Florence, where
certain families with wealth at their disposal held court for poten-
tial entrepreneurs. People sat at benches (Italian bancos) to arrange
the loaning of monies and shrewd deals soon led to increases in
investment, production, trade and economic growth of all parties.
Northern Italy, therefore, prospered – fuelling the Renaissance, early
advances in science and the progress of European civilisation.
© 2004 Tony Cleaver

What banking then and now demonstrates is that by mobilising
idle funds – lending on the savings of some for the use of others –
society gains by employing all its resources. As demonstrated in
Chapter 4
, capital that just accumulates in unproductive bank vaults
acts as a leakage from the society’s circular flow of incomes and
employment. The most important function of any banking system
is thus to circulate these funds from savers to investors and thus
stimulate increased production and exchange. For this reason all
banks and money lenders are known in aggregate as
FINANCIAL
INTERMEDIARIES
– mediating between those who have funds surplus
to their needs and those who have insufficient (Box 5.3).
Box 5.3 Banking for the poor
Banks are in business to lend money for profit. Their transaction
costs are reduced if they lend large sums to big, recognised, low-
risk customers rather than making lots of small loans to poorer
individuals who might struggle to provide evidence of their trust-
worthiness. In fact, of course, poor people who can offer little or
no
COLLATERAL
, or security, do not get loans.
In low-income countries in particular, only a small fraction of
the population holds bank accounts. If people in such countries
want to raise capital they typically go to informal moneylenders
or pawnbrokers. The rates of interest on loans that such agents
charge can be punitive – 50 per cent or more. In this way, credi-
tors can sometimes claim what few resources poor peasants
possess: a large share of the output of whatever is produced, for
example. Excluded from the formal banking sector, the poorest
stay poor.
How can these problems be avoided? Financing development
is so essential, yet how can poor communities ever raise capital
and fund economic growth if banks will not serve their needs?
One encouraging development is illustrated by the Grameen
Bank, or Village bank, in Bangladesh. This is a
MICRO
-
CREDIT
scheme that its founder, Muhammad Yunus, set it up in 1983 on
the principle that a small amount of money would be loaned out
to a nominated individual in a group of rural poor. No collateral
© 2004 Tony Cleaver

T H E C R E AT I O N O F M O N E Y
Financiers from Italy set up in London (in Lombard Street!) and
oversaw the next stage in the development of banking. By issuing
paper promises to return your gold to you whenever you so
demand, banks change the form of money that is used in everyday
transactions. Instead of gold exchanging hands in trade, promissory
notes do. The gold never leaves the bank, therefore – it is just trans-
ferred from one person’s account to another’s. (Note, with several
competing banks it may be that after thousands of exchanges at the
end of a given trading period, the customers of bank A may owe
more to the customers of bank B than vice versa. This net sum is
thus transferred – there is no need to transfer gold from one bank
to another on each and every transaction.)
As the form of money circulating in the economy changes from
gold to paper this leaves banks with stockpiles of gold that are, in
effect, idle. This is too good an opportunity to miss! Consider that
there will always be a certain percentage of customers who will
return to their bank, cash in their promissory notes and claim their
gold. But so long as confidence in banks is maintained, relatively
is required but all members of the group sign up as witnesses to
the deal and have an incentive to ensure that the individual
sticks to the terms of the agreement and repays on time since
others then may become eligible for future loans. This banking
strategy turned out to be incredibly successful. Repayment rates
of 98 per cent were far better than those achieved in the regular
commercial bank sector.
Yunus reports (2003) that more than half a million houses
have been built with loans from the Grameen Bank. Five per cent
of borrowers come out of poverty each year. Housing conditions,
nutrition, health and education have all improved. As a result,
this initiative has been promoted by the World Bank and now
nearly 100 countries have introduced Grameen type micro-credit
programmes. By building on the one asset that poor people do
have – community spirit – there is hope that this ingenious
innovation can liberate the lives of millions from poverty.
© 2004 Tony Cleaver

few will do this. (After all, it is safer to hold your money in the
bank than to store it under your mattress at home.)
Suppose on an average day only 5 per cent of paper promises are
ever cashed in. This means that 95 per cent of banks’ gold holdings
are performing no economic purpose. Why not create more paper
promises therefore? People are always coming into banks asking for
loans. If they can be given bank notes, then the money supply can
be greatly expanded and more investment, production and trade
financed. Providing that banks are responsible and fund genuine
enterprise that increases the flow of goods and services in the
economy, then the growth in money circulating will be matched by
an increase in outputs. Inflation will not result.
In the previous example, a prudent bank might work on keeping a
safe ratio of 10 per cent gold in reserve. If it has 100 units of gold in its
vaults this means it can safely create up to 1000 units of banknotes.
Money creation is thus ten times the gold supply! You should see that
a more nervous, less confident banking system would need to keep
a higher
RESERVE ASSETS RATIO
and thus be able to create less money.
A more financially sophisticated, trusting society may have a much
smaller reserve and thus be able to create much more money.
The practice of modern
FRACTIONAL RESERVE BANKING
follows
from this observation. The difference today is that, again, the form
of money has changed. Now it is cash that banks hold in reserve
and loans/credit, exchanged by cheques or plastic cards, that forms
the bulk of the money supply.
What exchanges as money and thus becomes prudent to practice
in banking depends entirely on what society is willing to accept.
Over time, as a financial community gains a reputation for respon-
sibility and caution, so the smaller the reserve asset ratio it can
retain and thus the higher the
MONEY MULTIPLIER
it can employ. (In
the UK at the turn of the millennium, total money circulating in
the economy was 27 times official reserves, implying a reserve
assets ratio of 1 : 27 or 3.7 per cent.) At the same time, however,
banks have learnt the hard way when they have got it wrong –
when, for example, they have issued too many notes and kept
insufficient in reserve. If ever customers sense that a bank has made
more promises than it can keep then there follows an inevitable run
on the bank – everybody rushing to try and cash in their accounts
and, of course, in such circumstances very few can ever be saved.
© 2004 Tony Cleaver

C E N T R A L B A N K S A N D T H E M O N E Y S U P P LY
Individual bank collapses are relatively rare these days (though
financial panics are not! See later.) Central banks – such as the US
Federal Reserve, the Bank of England, The European Central Bank –
have grown up in all modern economies to regulate the practices of
private, commercial banks and moneylenders and in some countries
they still insist on a statutory minimum reserve assets ratio to try
and prevent over-lending. In fact central banks will offer to bail out
reputable financial institutions if ever they are caught short of
money. This is known as acting as the
LENDER OF LAST RESORT
.
Central banks control the issue of cash that forms the
MONETARY
BASE
of society. They also hold accounts of all recognised financial
intermediaries so that, for example, if bank A needs to transfer
money to bank B (as explained earlier) the easiest form of so doing
is to adjust their respective accounts in the country’s central bank
(Box 5.4).
In performing all these functions, the central bank at the heart of
a financial system is thus in a position to control, or rather to
attempt to control, the national money supply. The mechanisms
Box 5.4 Measures of money
In a society where gold has become demonetised, cash now
represents the base which supports a country’s total money
supply. The amount of cash circulating in an economy can be
measured by that quantity which is changing hands in everyday
trades, plus that which is held in commercial banks’ tills, plus
that which is held in these banks’ balances at the Central Bank.
The sum of this form of money is denoted M0.
As already explained, much money that finances everyday
transactions comes in the form of cheques and plastic cards that
serve to transfer payments from one person’s bank account to
another. Actually, this means that it is the
BANK DEPOSITS
(numbers registered on computer records) that rest in people’s
accounts that really represent money – cheques and plastic only
serve to transfer these funds and these tokens will not be
© 2004 Tony Cleaver

accepted if clients doubt that there are insufficient deposits
in the bank to back them up. Monies which you deposit in your
bank’s current account are called
SIGHT DEPOSITS
(they are with-
drawable ‘on sight’). Adding commercial bank sight deposits to
M0 gives a wider definition of money, which is M1.
A complication is added in that many non-bank financial inter-
mediaries now hold sight deposits. For example, building societies
used only to deal in long-term loans to finance house buying.
With financial deregulation – the removal of restrictions on
financial market places referred to in
Chapter 4
– there is now no
longer strict specialisation and separation of banks from
building societies, there is thus little to distinguish one from
the other. M2 is the measure of cash plus sight deposits of all
financial intermediaries that serve the public.
M2 totals all sight deposits but does not include people’s
savings accounts, which normally require a period of notification
before withdrawals or transfers can be made. Such accounts are
called
TIME DEPOSITS
and, almost by definition, they are not quite
so liquid as sight deposits. Nonetheless individuals and compa-
nies do use their savings to pay for transactions on occasions
and including these time deposits in the measure of money
supply gives us M3.
Add to this what we can call wholesale deposits – large accounts
managed by businesses rather than by members of the public –
gives us the widest definition of the money supply, M4.
In reality, it is almost impossible to distinguish between some
very short time deposits and sight deposits (indeed, people use
some savings account cards to back consumer purchases). Nor
is it easy to draw the line between retail bank deposits and
wholesale bank deposits. It is, moreover, impossible to distin-
guish between what were once traditional commercial banks and
now other financial intermediaries which provide a range of serv-
ices to all sorts of customers. Definitions M1, M2 and M3
become meaningless, therefore. We are left with only two real
measures: narrow money M0 (cash) and broad money M4 (all
liquid, exchangeable assets).
© 2004 Tony Cleaver

employed all operate on changing the banking system’s reserve
assets and, thereby, having a multiplied impact on the economy’s
total money supply. (With a money multiplier of 10 times reser-
ves, for example, if the central bank can engineer a reduction in
commercial bank reserve holdings of, say, 12 million units then the
economy’s money supply will fall by 120 million.)
1 Changing Reserve Requirements. The central bank (hereafter
known as the Bank) is the fulcrum of a country’s banking system and
can insist on a minimum reserve assets ratio that all financial inter-
mediaries must observe. Suppose, however, the Bank wishes to boost
consumer spending to stave off recession. If the Bank decreases this
ratio then, with their existing reserves, all intermediaries can imme-
diately issue more loans and thereby increase the money supply (see
Box 5.5). The money multiplier increases. Conversely, if the Bank
increases the ratio, the money multiplier must fall, loans must be
called in and the money supply must contract.
2 Open Market Operations. Rather than enforcing a change in
legal requirements, a more indirect (and more popular) measure to
employ is what is known as open market operations.
The Bank in its every day dealings goes into open money markets
and lends money to some institutions and borrows from others. The
FINANCIAL INSTRUMENTS
it uses to do this are variously called bonds,
bills, or securities – all specific promises to pay sums of money over
different time periods. Now if the bank buys a bond, it is in effect
exchanging cash with some other agent in return for a legally binding
promise of future payment. The agent selling thus receives cash which
that institution can now place in its own commercial bank account.
Box 5.5 The money multiplier: an example
Suppose financial intermediaries hold one dollar in reserve for
every eight loaned out. That represents a reserve assets ratio of
12.5 per cent. If they now change to a ratio of 10 per cent, one
dollar in reserve can support ten dollars in circulation. That is,
banks can now loan out an extra two dollars for every one they
hold in reserve. More customers can be given more money and
encouraged to spend it.
© 2004 Tony Cleaver

By this measure, commercial bank reserves of cash increase and
so they can increase the money supply by a multiplied amount.
Conversely, if over a period of time the Bank sells more private
bonds and bills than it buys, then clearly there will be a drain on the
private sector’s cash reserve into the central coffers. The money supply
must therefore be reduced by a multiple of the loss in reserves.
3 The Discount Rate. A third measure that might be used to
exercise monetary control is for the Bank to change its discount
rate, or the interest rate it charges on its own loans.
With all sorts of traders operating in a modern financial system
to buy and sell money, to issue and accept loans, there will naturally
evolve a competitive rate of interest. This equilibrium rate will, as
in any market, serve to equate demand and supply between
commercial dealers.
In free financial markets with no legally enforced reserve ratio to
observe nowadays, private bankers have no wish to keep cash
reserves above the lowest practicable levels since stockpiling cash
earns them no interest – better to loan it out even for short periods
if this can earn them something. Reserves can thus be kept at a bare
minimum to meet customer demand and if a recognised bank is
caught short of cash at any time it can always lend from the Bank at
no major cost, providing the discount rate is equal to the going
market rate anywhere else.
If the Bank looks like raising its discount rate, however, financial
intermediaries have an incentive to keep more cash in their vaults –
to avoid having to pay higher than market rates for last resort
loans. (Note: If everyone scrambles to increase cash reserves,
demand shifts to push up the market price anyway!) Either way, as
cash reserves rise the money supply is reduced by a multiplied
amount. Fewer loans can be issued.
T H E D E M A N D F O R M O N E Y
The money supply, in theory at least, can be adjusted by the
institutions of a country’s banking system. What determines the
demand for money?
It depends on the alternatives. People may hold their wealth in
the form of non-interest earning money or in the form of some
income-earning asset (e.g. bonds, shares, fine art or property). For
this reason, Keynes called the demand for money – a perfectly
© 2004 Tony Cleaver
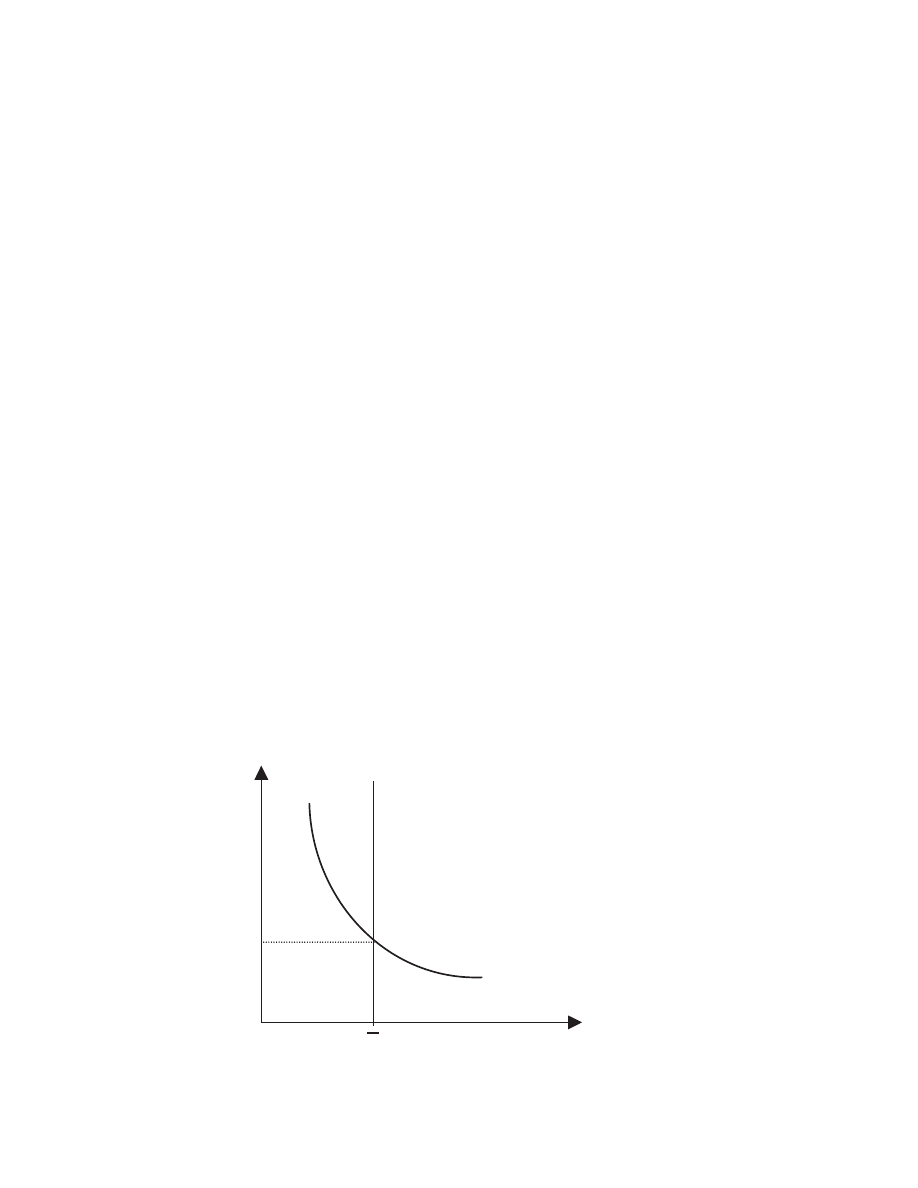
liquid asset, as opposed to demand for other, less liquid assets –
LIQUIDITY PREFERENCE
.
For simplicity, we can assume like Keynes that the best alterna-
tive to accumulating wealth in the form of money is holding it in
risk-less, interest-earning assets such as government bonds. (Such
a legally binding promise from the government to pay a fixed sum
of interest over a stated period frequently comes in the form of a
fancy, gilt-edged document. It is a no-risk, 100 per cent secure
investment, unlike promises from some other parties. See junk
bonds,
Box 5.6
.) Thus, the opportunity cost of holding money is the
interest forgone in not holding bonds. The higher the interest rate,
therefore, the greater the cost of holding money and the lower will
be the demand for it.
Society’s demand for money can thus be illustrated by a normal
demand curve where the rate of interest is the price of money
(Figure 5.1).
The demand for money is illustrated by the liquidity preference
curve LP. The supply of money M
–
is given by the institutions of the
banking system. The equilibrium market rate of interest r* is thus
determined by the interaction of the supply and demand curves.
There are, of course, benefits in holding money. Keynes identi-
fied the transactions motive and the precautionary motive, amongst
others.
The rate of interest
Supply of money
r
*
LP
Quantity of money
M
Figure 5.1 Liquidity preference and the market rate of interest.
© 2004 Tony Cleaver

T h e Tr a n s a c t i o n s M o t i v e
People demand money for its use in conducting trade or trans-
actions. We all need money to finance our spending over each month
though most of us also divert some monthly income into savings or
investments such as pension funds. How much money I demand for
financing transactions depends on the general level of prices and the
frequency at which I am paid. If all prices doubled, for example, I
would need to double the size of my money balances. Similarly, if I
were paid on a weekly basis, rather than a monthly basis, I would
need to hold smaller money balances. Last, my transactions demand
would increase if my real income increased – I would want to spend
more money, more often and so would therefore keep larger money
balances.
T h e P r e c a u t i o n a r y M o t i v e
People tend to keep a small, stable fraction of their income in
money form so as to meet unexpected contingencies. We can all
expect something unexpected (!) on which we may need to spend
some money – an unanticipated celebration or a need to drown our
sorrows. The demand for money for this precautionary motive also
tends to be affected by the size of real incomes.
What these motives imply is that as real incomes increase the
demand curve for money illustrated in
Figures 5.1
shifts forward
(just like any other demand curve, see
Chapter 2
), thus causing an
increase in the market price of money if supplies stay constant.
Likewise a fall in incomes leads to a shift back in demand and
falling interest rates.
A rise in real income is not the only reason why societies might
hold more money balances over time. Since financial deregulation
swept the Western world in the 1980s there has been much greater
competition between banks and all other financial intermediaries, both
nationally and internationally. One result of this is that many institu-
tions now offer all sorts of temptations to consumers to open bank
accounts. Interest is offered on many sight deposits as well as time
deposits and overall the real cost of holding money has decreased
significantly over the last twenty years. The incentive to hold bonds
and other alternatives to money is correspondingly less (
Box 5.6
).
© 2004 Tony Cleaver

Box 5.6 Speculative demand, bond prices and the rate of interest
Financial markets allow traders to loan or borrow money over a
variety of time periods. For example, you may decide to purchase
a bond promising £100 in one year’s time – in which case you
are in effect loaning out money for a year. What price would you
pay for this bond? If you offer £95 then you have accepted a rate
of interest of approximately 5 per cent. If the seller will accept
nothing less than 98 then the price of bonds has risen and the
rate of interest has fallen. (Thus the price of bonds and the rate
of interest are conversely related.)
For all financial assets, key influences are the going market rate
of interest, the degree of risk involved in the particular asset being
traded and the predicted rate of inflation. If the rate on risk-less
government bonds (where there is no chance the government will
default) is 5 per cent and the rate of inflation is 2 per cent
then the real rate of interest is in effect 3 per cent. (Getting back
5 per cent when inflation has devalued the currency by 2 per cent
means you only really earn an extra 3 per cent over the year.)
Buying a
JUNK BOND
from a not so well known trader, you might
thus insist on a real rate of 6 per cent or more, depending on
your assessment of the risk involved. That is, a nominal rate
(including inflation) of over 8 per cent.
A one-year security is not necessarily an illiquid asset. You
don’t have to wait for 12 months to get your money back if you
change your mind after you have bought it. You can simply sell it
tomorrow for whatever price the market values it for. Dealers buy
and sell assets of varying dates of maturity like this all the time
since it allows a finance house to possess a portfolio of holdings
of differing liquidity. (Generally, the more liquid the loan the
lower the risk but the lower the rate of interest it earns.)
What happens if you think that the price of bonds (or any other
asset you hold in place of cash) will fall in the future, and market
rates of interest rise? If you believe that next Thursday the central
bank will put interest rates up you will sell bonds now – and thus
demand more money today – rather than wait for prices to fall.
Going to the markets to sell bonds/demand money for this
reason is to express the
SPECULATIVE MOTIVE
in demand.
© 2004 Tony Cleaver

The central bank sells and then buys back, or ‘repossesses’, bonds
and gilt-edged securities before their maturity dates in order to
supply the markets with assets of varying liquidity. The Bank can
thus use these instruments either in open market operations to try
and influence money supplies or to dictate a given discount or repos-
session (‘repo’) rate. As will be explained in the following section,
central banks in fully deregulated and global money markets have
really given up on trying to influence money supplies, but what
happens in an economy if the Bank does indeed signal a rise or fall
in its discount rate? In the first few years of the new millenium,
with increasing worries about stagnating economic growth, the
USA, the UK and (more lethargically) the European central banks
have all cut their interest rates. We need to see why.
M O N E TA R Y P O L I C Y W I T H G L O B A L M A R K E T S
Most economists support the policy of financial deregulation in
money markets since greater competition between banks – as with
all industry – increases efficiency and brings prices down to the
consumer. Opening frontiers to allow foreign banks to compete is
just the extension of this principle.
The City of London is one of the world’s major financial centres
and the process of deregulation started here back in 1979. The oper-
ation of free enterprise in finance, however, once started built up an
unstoppable momentum. Breakthroughs in technology helped since
it became possible to move money costlessly from one centre to
another across the world with just the push of a few buttons. Most
money, after all, has no physical form – it is just a record on a
computer screen.
Now if banks in one centre can buy and sell money with little
government penalty or tax then clearly banks in other centres
subject to stricter controls will lose custom and profits. Finance
houses in such a situation have usually found ways round central
controls since it is in their interest to do so – the end result is that
deregulation quickly catches on everywhere.
The problem for central banks is that they must inevitably lose
control of their domestic money supplies. Remember that if a
commercial bank’s reserve assets can be reduced by the central
authorities then it must call in its loans, reduce its money supply,
© 2004 Tony Cleaver

by a multiplied amount. But if a bank loses cash reserves to the
central bank and then can compensate for this loss by gaining other
liquid assets from alternative sources (overseas if necessary) it no
longer has to worry about supporting its existing pattern of long-
term loans. Money supplies need not contract. Moreover if all sorts
of financial intermediaries can now enter the industry and buy and
sell money, the reserves of which institutions does the Bank try to
control? Where do you draw the line?
For these two reasons, in a global financial environment, most
countries’ central banks have stopped trying to fine-tune their
domestic money supplies. If a central bank can no longer monopo-
lise the supply of money in its own backyard, however, it can still
affect the money markets by changing its own discount rate.
Cutting prices will stimulate demand; raising rates will stifle it.
T h e Tr a n s m i s s i o n M e c h a n i s m
The transmission mechanism by which a change in the central rate
of interest impacts on an entire economy can be quite long drawn
out but it is still an important influence.
This is particularly so if the change is unexpected. Since specula-
tion is rife in financial markets, the decision of a forthcoming meeting
of the central bank committee may have already been built in to the
pricing of marketable assets. (Suppose you think the Bank’s rate will
come down next week and prompt bond prices to rise from 95 to 98
as explained in
Box 5.6
. If you are selling bonds today, you will hold
out for 98 – bringing forward the fall in the market rate of interest.)
Expectations affect everything in modern economies.
If, of course, the Bank is reducing its discount rate to counter a
prevailing mood of depression then key to the markets’ reactions
will be how the Bank’s actions are interpreted. Is it too little, too
late? A signal of official desperation? Or is it a necessary corrective
measure that everyone applauds and thus comes as a stimulus to
trade sufficient to counter the markets’ gloom? (It is generally
accepted that the actions of the US Federal Reserve to reduce its
discount rate in a continuing series of cuts from 2001 onwards has
helped mitigate an American, and world, economic slowdown.)
A fall in the discount rate will normally be followed by a fall in
most other rates of interest in the market place since, as earlier
© 2004 Tony Cleaver

explained, other rates are based around this. All things being equal,
falling rates bring a boom in asset prices – from speculative paper to
property prices. Mortgages will be cheaper and thus more demand
for houses will push their prices up. People will feel wealthier.
With loans coming easier, if manufacturing industry can quickly
expand production – or where they retain large stockpiles – there
will be more sales of consumer durables. People will buy more cars.
A fall in market rates will bring a reduction in foreign monies
entering the economy to be placed in interest-bearing accounts in
domestic banks. Less demand for the currency, therefore, will cause
a fall in the exchange rate. (This may or may not affect the earn-
ings from export sales or spending on imports, depending on how
price-elastic the respective demands are. The country’s balance of
payments may thus be affected – see
Chapter 6
.)
As all these effects cascade through the economy the level of aggre-
gate demand will rise over time. Particularly influential will be the
impact on investment. Cheaper bank borrowing means it is less costly
to raise funds to invest but an even greater stimulus occurs if business
expectations are shifted. If the change in discount rate secures a more
optimistic business outlook then investment will rise and a multiplied
increase in national income may result (see
Chapter 4
): Employment
will rise and, providing the economy has the capacity to expand,
output and incomes will increase and inflation will not result.
E x c h a n g e R a t e s
With global financial markets, note that no one country can imple-
ment domestic monetary changes without considering external
influences. If a nation places no restriction on money entering or
leaving its shores then it must take the consequences. In particular,
a country cannot fix its exchange rate with other world currencies,
deregulate its financial markets and hope to pursue an independent
monetary policy. This is known as the ‘impossible triangle’.
As explained above, reducing domestic interest rates to stimulate
domestic demand will result in a
DEPRECIATION
of the exchange rate.
A country can only keep a fixed price of its currency on the
FOREIGN
EXCHANGE MARKETS
if it imposes strict capital controls – that is,
prevents dealers from buying and selling the currency in the
quantities they desire.
© 2004 Tony Cleaver

Fixing exchange rates of the domestic coinage to major world
currencies such as the US dollar or the euro (see the gold standard,
Box 5.2
) is something that many countries’ governments have
desired – now as in the past – as a means of lending stability to
their own financial systems.
Especially true with a newly introduced currency that people
may not yet have confidence with, if the new paper carries a fixed
value in terms of a trusted external currency then dealers are more
likely to accept it.
Even with well recognised currencies, fixed exchange rates gen-
erally help trade (Box 5.7). For example, if you are planning a foreign
Box 5.7 Discipline in international trade
A fixed exchange rate imposes discipline on central banks and
governments.
Consider the following scenario: if a country is losing out in
trade – such that export revenues are insufficient to cover import
spending – then there are more domestic importers selling the
currency than foreigners wanting to buy it. The price or exchange
rate of this currency will be expected to fall in a free market or, in
a system of fixed exchange rates, a country’s central bank must
sell off its gold or foreign currency reserves to cover the differ-
ence and thus maintain the fixed rate. No central bank can afford
to do this for very long. What a fixed regime ensures therefore, is
that the central authorities must do something to address the
root of the problem: to prevent the country from living beyond its
means and buying more in international trade than it is prepared
to sell. (This generally means cutting back on domestic demand
and attempting to switch resources to promote export produc-
tion. It generally implies consuming less – a policy that bankers
and politicians like to recommend for others . . .)
The gold standard, when it operated for all trading counties at
the beginning of the twentieth century, imposed just this disci-
pline on world economic affairs and some observers with long
memories still hark back to these days and the certainties that
this system embodied.
© 2004 Tony Cleaver

holiday the last thing you want is continually changing foreign
prices – which is exactly what would happen if the exchange rate is
floating, not fixed. Whether it is trying to arrange a holiday or to
secure a vital business contract, varying prices impose a cost – and
thus a disincentive – on trade. Such an argument is particularly
relevant if you are in a small country that deals regularly with a big
neighbour. With so much business at stake, it is better to fix the
exchange rate so everyone knows the costs involved.
F I N A N C I A L C R I S E S
The trouble is, trying to maintain fixed exchange rates at times
when global markets question the value of the currency concerned,
has been a contributing factor in most modern financial crashes.
The East Asian currency crisis in 1997, Russia 1998 and Argentina
2001 are only the most recent at the time of going to press. They
are hardly likely to be the last.
At first, international financiers are reassured by fixed exchange
rates. The risk in buying foreign securities is reduced if you know
that the overseas earnings you later receive will not be devalued by
some future fall in price of the currency.
A developing country which perhaps has a change of govern-
ment and pegs its currency to the dollar, removes restrictions on the
international movement of money and pursues prudent financial
policies familiar to Western bankers may become very attractive to
overseas investors. Especially if it is resource rich, needful of capital
and with fledgling industry and commerce welcoming to interested
outsiders. Local bankers quick on their feet can now call on far
greater supplies of finance if foreign creditors are confident about
exchange rates. And it is easy to make money when everyone else is
getting in on the act – entrepreneurs find that in setting up a new
company in boom times, everybody wants a share and prices on the
bonds and securities they issue keep rising. Does it matter that
projected future profits are based on scarce or over-optimistic data?
If confidence holds, not really. Those people rushing in to get rich
quick will not worry if the paper they hold is over-priced – so long
as they are confident that they can sell it later for even higher
prices. The market succumbs to feverish buying . . . until sometime,
somehow, somebody blows the whistle.
© 2004 Tony Cleaver

All crashes occur when assets become overvalued in a speculative
bubble. The readjustment that is inevitable and which everyone
knows is coming sooner or later, typically occurs in one traumatic
collapse rather than in a gentle and less painful slowdown over
time. Why? Because no one wants to hold on to their stocks if
prices are falling. Once started, fear of loss terrifies everyone into
panic selling.
To just blame the herd instinct, collective myopia or capitalist
greed getting the better of wisdom is to describe the problem
without explaining it. The reality is that the prices of speculative
assets repeatedly diverge from their underlying values, financial
intermediaries can provoke rather than contain binge buying, unre-
stricted international money flows add to the pressure and, when
sentiments change, sudden price readjustment can be catastrophic.
Piling in and out of foreign currencies can quickly force exchange
rates apart. Immature financial sectors in developing countries can
perhaps be forgiven, but when international markets get in on the
act it is not just a few local businesses that go under – no exchange
rate can hold out against vast and rapid speculative money flows
across borders as everyone rushes to sell one currency and buy
another. Then whole countries can suffer.
The history of any one financial crisis will always illustrate
special factors that lead people to think that this time, this place, in
this case, things will be different. In the case of Japan and other East
Asian economies like Thailand, South Korea, and Indonesia they
had been amongst the fastest growing economies in the world for
the last half of the twentieth century and international banks
everywhere were happy to lend them money. The fact that this was
fuelling rapid property price rises was nothing special – owning real
estate in such a dynamic quarter of the globe seemed a good invest-
ment. But, if the backing or collateral on too many bad loans is
unproductive property and banks all try at the same time to cash in
that property to get their money back, then these prices collapse.
Confidence is shaken. Many local intermediaries thought at first to
be rock solid can be exposed as issuing too many risky loans to
undeserving cronies. Then there is panic and wild selling. Forei-
gners want to get their money out. Dollar-denominated loans,
incurred from overseas to fund local Asian investment, have then to
be paid back when the domestic currency is skydiving. It can’t be
© 2004 Tony Cleaver

done. Foreign debt holders won’t accept your paper anymore. So
businesspeople go bankrupt. Companies fold. Governments which
have similarly borrowed internationally now have to default on
loans since their interest payments in dollars have soared whilst
their domestic tax revenues have collapsed. Economies as a whole
slump into recession.
Argentina is different. Surely fixed exchange rates were justifi-
able here? Rampant inflation at the end of the 1980s was eventually
cured in 1991 when the old currency was reformed by the govern-
ment’s Convertibility Plan – which instituted a fixed, one-for-one
peso to the dollar exchange rate. Control of the money supply was
thus secured. The domestic currency could now only be created if
the country possessed equal reserves of US dollars. In one fell
swoop, this prevented financial intermediaries from over-issuing
credit and stoking up more and more spending. From 4,000 per cent
in 1989, the rate of increase in prices came down to single digits
by 1992.
This was a revolutionary reform. Now at last the Argentines had
a currency they could trust. Pesos were interchangeable with dollars
in every shop and on every street corner in the land. The
Convertibility Plan and the government which produced it became
enormously popular. Indeed, the international financial community
led by the IMF widely applauded Argentina’s policies of financial
deregulation and monetary discipline and the country was offered
as a model for other developing countries to emulate.
But one country can only tie its currency to that of another over
the longer run if it experiences similar economic fortunes (growing
or declining in parallel at roughly the same rate) and, in particular,
if domestic monetary policies and practice give foreign investors no
cause for concern (incomes and spending are balanced; borrowing
and lending are transparently prudent).
In the course of the late 1990s neither condition held for
Argentina. The US economy was booming; Argentina was not. The
strength of the dollar meant that Argentine exports – pegged to the
same high rate – struggled to find sales. In January 1999 Brazil
devalued the real to help its own industry compete, which only
increased the difficulties for its South American neighbour.
Meanwhile Argentina’s Achilles’ heel – excessive public sector
spending – became increasingly exposed. Even when domestic
© 2004 Tony Cleaver

incomes were growing in the early 1990s, tax revenues had been
insufficient to cover needs. At the turn of the millennium, with
recession yawning and social spending demands mounting, more
and more resort to foreign borrowing was necessary.
Box 5.8 Central bank independence
Amongst other functions, central banks act as bankers to the
government and so have a direct role in arranging their financial
affairs. In addition, through the exercise of the three monetary
instruments listed earlier in this chapter, and also just by advice
and persuasion, a central bank exerts an important influence on
the overall health of an economy. For both reasons, therefore,
central banks have an important relationship with the country’s
political leaders and there is always the possibility that this
relationship might be manipulated, therefore, for political ends.
Governments in some countries have urged central banks to
directly create more money or to arrange greater and greater over-
seas borrowing – in many cases to fund overtly political spending.
Less obviously, central banks regularly come under pressure to
give a boost to aggregate demand and thereby reduce unem-
ployment before election times. (Any inflationary costs tend to
filter through after people have voted and politicians have been
elected.)
For these reasons there is a growing call for central banks to
be made independent of political influence – enshrined in laws
that limit the authority of governments to overrule central banks
with regard to monetary matters. (Typically, the central bank is
charged by government to keep inflation within a certain maxi-
mum target, say 2 per cent, and politicians are not allowed to
interfere further.) Certainly, recent research shows a correlation
between the independence of central banks and their success in
controlling inflation and facilitating economic growth: Those
countries where political influence is greatest tend to have the
highest rates of inflation and the most unstable growth rates.
Conversely, central banks freer from interference have managed
national finances better.
© 2004 Tony Cleaver

Confidence in the exchange rate evaporated – the real value of
the peso was nowhere equal to the US dollar and foreign and
domestic creditors would accept it no longer. The financial crisis
when it hit at the end of 2001 brought down the government and
ruined the economy. Banks had to close their doors against the
thousands of people clamouring to get their money out. In the end,
many people and businesses had to resort to barter and national
income shrunk by almost 20 per cent in a matter of months. Such is
the result when money fails to fulfil its primary function as a medium
of exchange (
Box 5.8
).
Summary
• A banking system functions to cycle funds from savers to investors
and thus facilitates growth in trade and the circular flow of money,
incomes and employment.
• Financial intermediaries create credit: commercial banks have every
incentive to use idle reserves to back increasing numbers of loans to
potential investors.
• Providing banks are prudent, the increased money supply generated
will be matched by increasing production of goods and services and
so inflation will not occur and confidence will hold.
• Increased globalisation of financial markets has meant that, for most
countries, controlling the domestic supply of money becomes
impossible and most central authorities now opt to control its price
by adjusting rates of interest.
• The demand for money in financial markets comes from the desire
to fund transactions, and for precautionary motives, which are
directly related to rising incomes. There is also much speculative
demand, which is affected by expectations of changing interest rates.
• Where monetary flows across frontiers are unrestricted – which they
have increasingly become – then exchange rates cannot remain fixed
for long. The most spectacular financial crashes have involved local
debtors taking on large loans denominated in foreign currencies –
only to see the domestic exchange rate slump and thus be faced with
repayment demands that are inordinately expensive.
© 2004 Tony Cleaver

F U R T H E R R E A D I N G
There is a wealth (!) of reading in money and finance. You can
choose between theoretical texts in monetary economics and more
descriptive texts in banking and finance. An excellent synthesis of
the two is found in Hallwood, C. P. and Macdonald, R. (2000)
International Money and Finance, Blackwell.
Up to date analyses of financial crises can be found in economics
journals and on websites as soon as possible after they occur (econ-
omists are very good at being wise after the event). Check
www.imf.org
in particular. A very good publication from a recent
IMF staff member is Mussa, M. (2002) Argentina and the Fund:
From Triumph to Tragedy, Institute for International Economics.
For more detail on the Grameen bank, see
www.grameen-info.org
© 2004 Tony Cleaver

6
N AT I O N A L I N C O M E ,
W O R L D T R A D E A N D
M U LT I N AT I O N A L
E N T E R P R I S E
What did you have for breakfast? Here is a traditional English way
to start the day: Florida fruit juice; cereals made from processed US
corn; local milk; Demerara sugar; bread made from a mix of local
and Canadian wheat; Scottish marmalade made from Seville
oranges; New Zealand butter; an English egg with Danish bacon;
sea salt and Cayenne pepper and a choice of Colombian coffee or
Indian tea.
We daily consume a variety of products that come to us from all
over the world — so common an occurrence that we take it for
granted. But it is a remarkable feature of modern life nonetheless
and it has implications for all parties involved. There may be some
people so nationalistic that they wish to purchase only their
country s own produce but, first, such people could hardly get out
of bed in the morning (bed sheets woven from Indian cotton,
mattress of Malaysian foam rubber and a Japanese alarm clock . . .)
and second, they would be so much poorer if they did indeed
achieve this. A country s income and welfare is enhanced by trade,
not reduced.
This last point warrants closer examination. The impact of trade
on national income; the balance of international payments; the
© 2004 Tony Cleaver
issues of free trade versus protection and the implications for rich
and poor countries, domestic and multinational business are there-
fore the subjects for study in the forthcoming pages.
T H E C I R C U L A R F L O W O F I N C O M E S
We analysed the circular flow model in
Chapter 4
and noted how
domestic incomes fuel consumption, subject to some leakage out of
the system by savings and some injection into aggregate spending
by investment. We should further note that some fraction of
domestic consumption goes on imports — which represent a leakage
(they are earnings for foreign suppliers) — and there are additional
injections into the circular flow of incomes from domestically
produced exports sold overseas.
Equilibrium in the circular flow requires that injections equal
leakages. As before, if the sum total of injections is greater (or less)
than leakages then national income will grow (or decline). In cases
of disequilibrium, remember, Keynesian theory recommends that
governments adjust their own spending and taxation (fiscal policies)
to ensure that aggregate demand equals aggregate incomes, leakages
equal injections, at a level of national income consistent with full
employment.
We need to add these qualifications to the diagram of the circular
flow model in Figure 6.1.
What does this diagram illustrate? That for equilibrium, all income
must equal all spending and leakages must equal injections (
see
Box 6.1
).
Households
Firms
Investment
Export revenues
Govt spending
Domestic consumption
National income
Injections:
Savings
Import spending
Taxation
Leakages:
Figure 6.1 The circular flow model with trade and government.
© 2004 Tony Cleaver

Note that equilibrium income requires only the equation of these
combined injections and leakages. It does not necessarily mean
imports must equal exports —
an imbalance in international payments
could be countered by an opposite imbalance in savings and invest-
ment or in government finances. An economy in equilibrium at full
employment could therefore persist, for example, with a deficit on
international trade and a compensating government budget surplus.
I m p o r t a n d E x p o r t Fu n c t i o n s
Leakages from the economy as a result of foreign trade include
spending on imports, speculative purchases of foreign assets and also
long-term direct investment by domestic firms in overseas markets.
Note that consumption of imported goods and services (M) is deter-
mined by the level of domestic incomes. Short- and long-run capital
outflows are affected by expectations of interest rate and exchange
rate changes. Assuming the latter two influences are exogenously
given, import spending M will tend to rise as domestic incomes rise.
All money incomes (Y ) are subject to government taxation (T).
The disposable income that remains after tax is spent on
consumer goods and services (C), though a fraction of dispos-
able incomes is saved (S). On the other hand, if we consider
total expenditure (E), we must note that a part of consumer
spending (C) is leaked out of the economy on imports (M), plus
we must add spending on investment (capital) goods (I),
government spending (G) and foreign spending on domestic
goods exported (X).
For equilibrium, national income must equal aggregate expen-
diture. Thus we get the equation:
Y
⫽ C ⫹ S ⫹ T ⫽ E ⫽ C ⫺ M ⫹ I ⫹ G ⫹ X
and, by cancelling out C and moving M across, we get:
S
⫹ T ⫹ M ⫽ I ⫹ G ⫹ X
or leakages must equal injections.
Box 6.1 National income analysis – a formal treatment
© 2004 Tony Cleaver
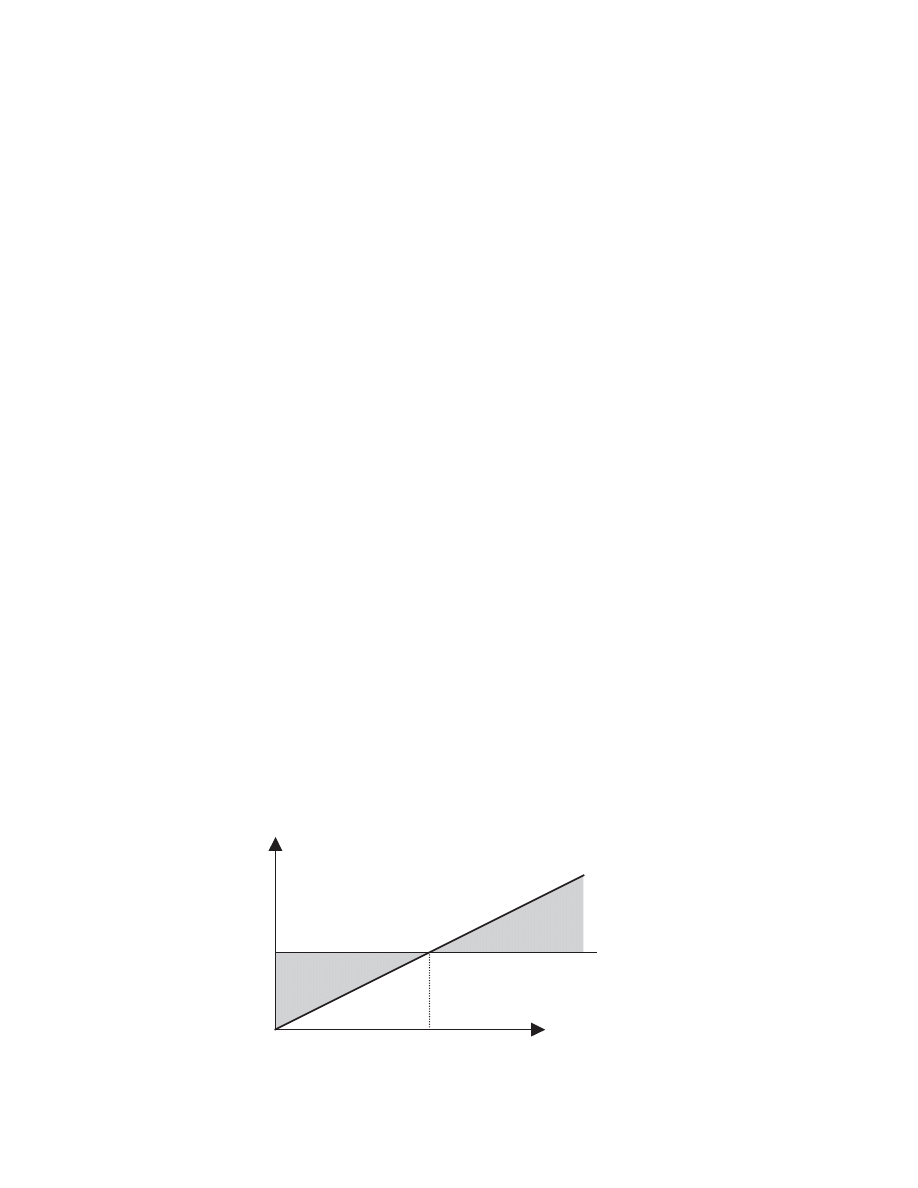
Export earnings (X), speculative inflows of capital and inward
foreign direct investment (FDI) are all injections and are unaffected
by domestic incomes. As the opposite of consumption of imported
goods and services (M), they are more determined by foreign
incomes and expectations.
Imports and exports can thus be illustrated as functions of
domestic income as illustrated. Imports rise with income; exports
are exogenously given. The
CURRENT BALANCE OF PAYMENTS
in inter-
national trade is in equilibrium at Ycb. For income levels lower than
this, exports exceed imports and there is a payments surplus. For
income levels above Ycb there is a payments deficit (Figure 6.2).
A similar analysis can be followed with respect to government
spending and taxation. A moment s thought should show you that
government direct and indirect tax revenues (based on incomes and
consumption) will rise as national income rises. Public sector spending
(on education, health, social services, defence, etc) is determined by
other, exogenous factors, however (i.e. government policy is liable to
change according to political factors outside the realm of economics).
As functions of national income, therefore, savings and investment
(see
Figure 4.4
), imports and exports, taxation and government
spending all follow the same outlines.
We can sum them altogether as aggregate injections (J) and leak-
ages (L) functions in the diagram
Figure 6.3
overleaf.
Savings, taxation and imports all rise as a function of income,
whereas investment, government spending and exports are exoge-
nously determined. Where all leakages equal all injections we
Imports and exports
M
Deficit
X
Surplus
National income
0
Ycb
Figure 6.2 Import and export functions.
© 2004 Tony Cleaver
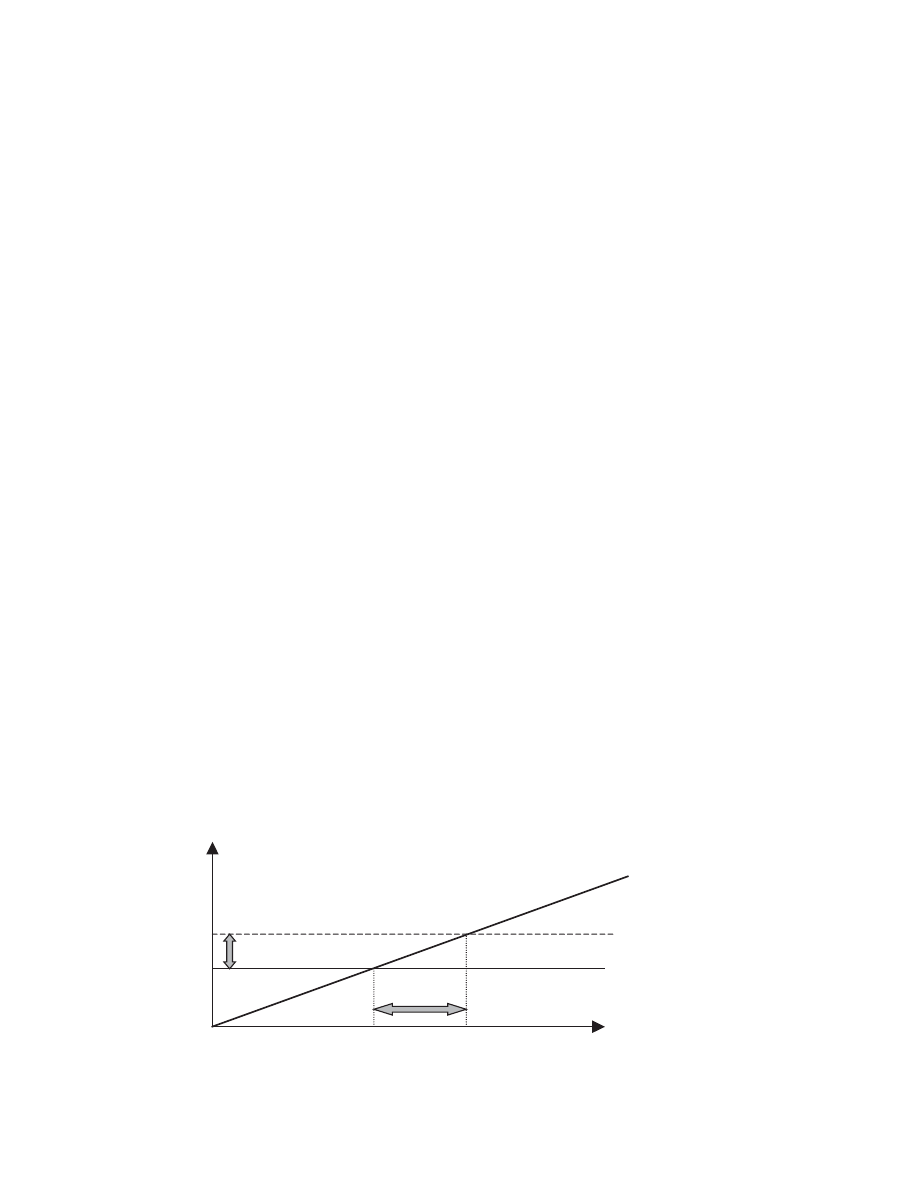
know that national income is at equilibrium Y* with no tendency to
grow or decline. An exogenous increase in injections, however (say
foreign incomes rise, leading to more export revenues, X to X1),
will increase injections from J to J1. At the level of income Y*
injections are now greater than leakages from the circular flow
and so domestic incomes must rise. A new equilibrium will be
reached at Y** when income has risen sufficiently for the leakages
to rise to the new level of injections. (Note, as mentioned, Y* or Y**
need not be compatible with Ycb in
Figure 6.2
. The economy can
come to rest where there is either an international payments deficit
or surplus.)
T h e Fo r e i g n Tr a d e M u l t i p l i e r
If exports increase and injections into the circular flow of domestic
incomes rise, as just explained, then although the increased export
revenues may be limited they may nonetheless induce a much
greater increase in national income. That is because the initial injec-
tion will be spent on local goods and services, which passes over an
increase in incomes to others, who in turn increase their spending
representing an increase in someone else s incomes and so on. The
mechanism by which a rise in foreign trade leads to multiplied
income growth at home is exactly the same as the investment
multiplier referred to in
Chapter 4
.
The amount by which incomes are ultimately increased by an
exogenous rise in (export) injections is illustrated in Figure 6.3.
Injections and leakages
L = S + T + M
J1
σJ
σY
J1 = I + G + X1
J
J = I + G + X
0
Y
∗
Y
∗∗
National income: Y
Figure 6.3 Aggregate injections and leakages functions.
© 2004 Tony Cleaver

Distance
Y is much greater than the distance J. Clearly, the
shallower the slope of the leakages function L, the greater the rise
in income any shift up in injections will cause. This illustrates that
the smaller the fraction of leakages as incomes rise, the more export
earnings are passed on domestically to others in the economy and
the less leaves the system. The greater the rise in national income
must result. Thus the
FOREIGN TRADE MULTIPLIER
is measured by the
ratio
Y/J that is, the change in income divided by the change in
injections from export earnings.
There are important conclusions here to this analytical model.
Export earnings generate multiplied income growth. Extending
this principle further we can see that if country A trades with
country B, and B with C and C with A then, first, all can stimulate
economic growth with each other. International trade is not a zero
sum game where if one country gets richer another must get poorer.
Second, the more that trade extends, the higher the proportion of
GROSS DOMESTIC PRODUCT
that is exported or imported, then the
greater will be the foreign trade multiplier. For good or ill, we tie our
fortunes into those of others the more we trade with them (Box 6.2).
Finally, not only will macroeconomic levels of income be
affected by trade as just demonstrated, but microeconomic realloca-
tions of resources — changes in the patterns of national output and
In
Figure 6.4
we can see the importance of international trade to
certain countries’ economies. Large nations such as the USA
may offer huge markets to smaller countries like Singapore but
nonetheless trade only impacts about 10 per cent of US
incomes. Singapore’s economy, on the other hand, revolves
around exports, imports and re-exports (which explains why the
total rises above 100 per cent!). Any slight improvement or dete-
rioration in the fortunes of others has immediate implications
for a small trading nation like this. Low-income countries like
Nigeria which export relatively few products can similarly be very
dependent on trade.
Box 6.2 The importance of trade
© 2004 Tony Cleaver
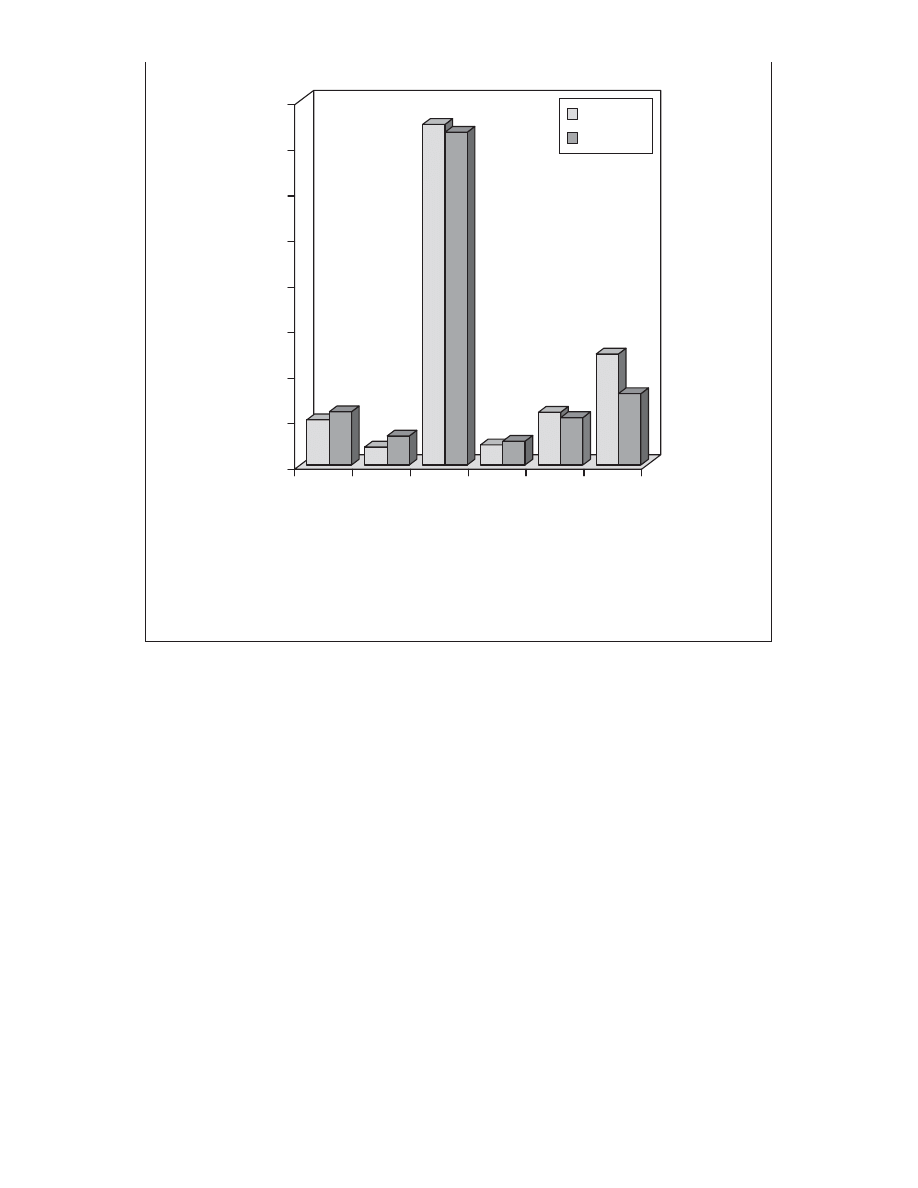
0
20
40
60
80
100
120
140
160
UK
USA
S'pore
India
China
Nigeria
Exports
Imports
Figure 6.4 Merchandise trade as a percentage of GDP (2000).
Source: World Bank Development Report, 2002.
employment — will result in all trading countries. These points will
be returned to later in this chapter after concluding the analysis on
the balance of payments.
T H E B A L A N C E O F P AY M E N T S
Money crosses a country s frontiers as a result of international
buying and selling of merchandise (the visible balance of trade);
purchase and sale of services (the invisible balance) and movements
on capital account — short-term, speculative (or hot money ) flows
or longer-term, cross-border investment in plant, machinery, etc.
Any imports of merchandise, for example UK purchasing Chilean
wine, result in an outflow of money; exports to overseas buyers of,
say, locally produced spirits will conversely bring in earnings.
Invisible imports are represented by, for example, purchase of
foreign holidays, which causes an outflow of money from a nation s
© 2004 Tony Cleaver

trade account. Invisible exports could be profits repatriated from
domestic businesses operating overseas.
The day-to-day money flows on visible and invisible trade are
summed up in the balance of payments on current account , some-
times referred to as the current balance. Add to this the inward or
outward movements of capital on the capital account and you arrive
at the overall net balance or total currency flow.
Net movements of money between countries can have important
implications and it is necessary to examine both causes and effects
of such currency flows.
Ca u s e s
As already mentioned, domestic incomes are an important determi-
nant of import spending. As the former grows, so must the latter —
like all consumption spending. The speculative demand for foreign
bonds is also in part determined by domestic incomes but is perhaps
more affected by changes in interest rates (see
Chapter 5
). Short-
term capital flows in particular are highly internationally mobile —
almost perfectly price-elastic. That is, a slight increase in rates of
interest on bonds and securities in country A above those prevailing
in country B will result in cashing in bonds in B and transferring
the money to A. As regards long-term overseas investment, the rate
of interest in the money markets is relevant though we noted in
Chapter 4
that a more important determinant is the expected future
profitability of such investment.
Assuming expectations are exogenously given, we can graph
total currency flows of the balance of payments on axes contrasting
national income with rates of interest.
The BoP line in
Figure 6.5
shows all the levels of income and rates
of interest at which a nation s balance of payments is in equilibrium.
Consider point Ycb. Derived from
Figure 6.2
, this shows the unique
level of domestic income where the current account is in balance.
(Recall that any income levels higher than this would see imports rise
and the current balance go into deficit; any lower income would
produce a current surplus.) Overall balance in the BoP requires that
the capital account is in balance at this point also — which it would be
if the domestic interest rate were equal to the prevailing market
interest rate r
w
obtained elsewhere in the world (
Box 6.3
).
© 2004 Tony Cleaver
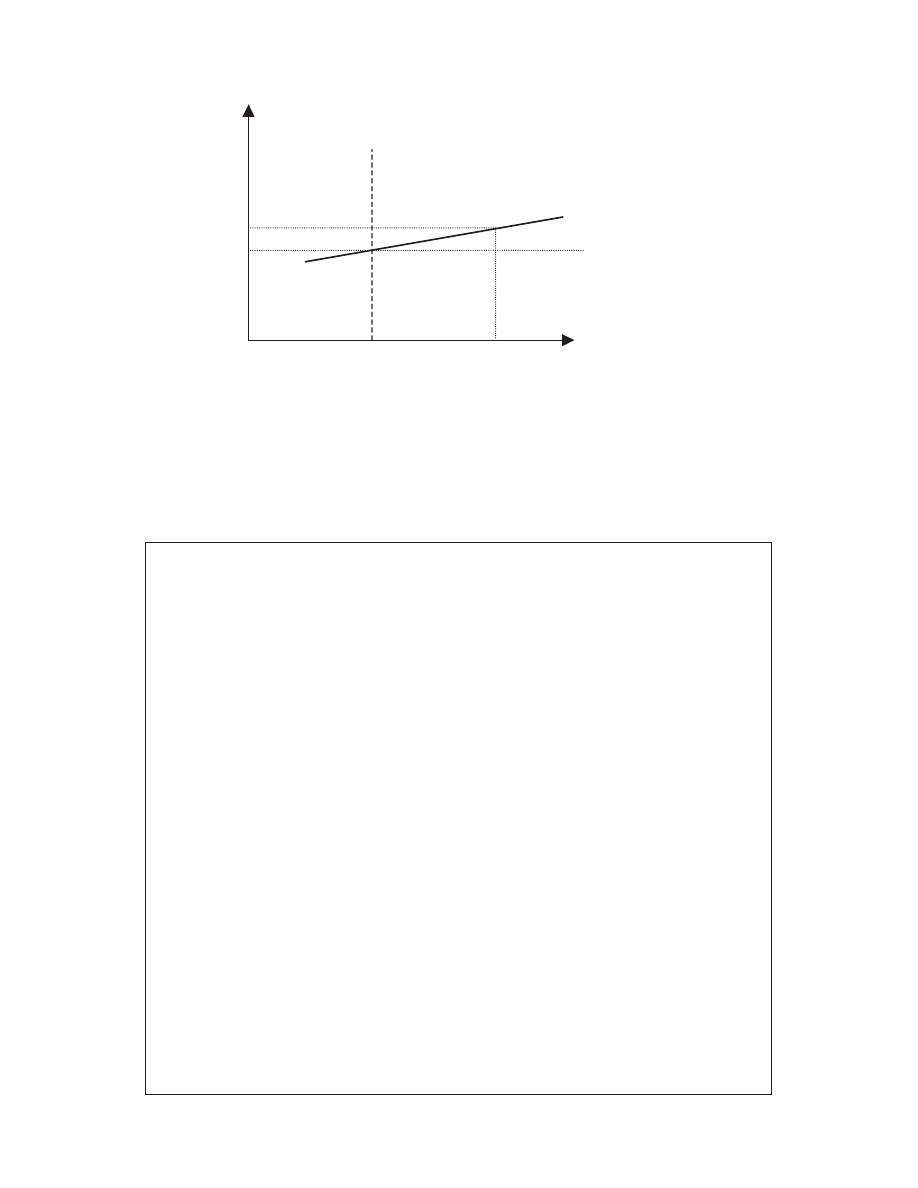
Rate of interest: r
Current account
Surplus
Deficit
BoP
r1
r
w
r
w
National income:Y
Ycb
Y
∗
Figure 6.5 The balance of payments curve.
World money markets offer a variety of different places you can
invest your funds – some a lot more risky than others. This is
much the same in principle to investing money in your own
country – some projects you might consider putting money into
are less secure than others. The international scene multiplies
potential investment outlets enormously but gilt-edged bonds
in, say, the US government will carry the same rate of interest as
their European equivalents, minus some percentage for the
risk of exchange rate variation over the period you are consid-
ering. For the purposes of this analysis, assuming no surprises,
if market rates of interest in any one country increase or
decrease substantially from what other, equally secure alterna-
tives are offering then international funds will flow in or out
in immediate response. For example, the London-based busi-
ness which has just sold an expensive building and has
several million pounds of cash in its coffers for the time
being will place this on Wall Street, New York, rather than in the
UK if the interest rate differential between the two is tempting
enough.
Box 6.3 World interest rates
© 2004 Tony Cleaver

A country s BoP line rises at a relatively shallow line from this
point r
w
— signifying it is highly interest-elastic. At income level Y*
the current balance is in deficit (imports of goods and services
exceed exports) but if domestic rates of interest are increased just a
little above world rates (r1 exceeds r
w
by a narrow margin) then
foreign capital will flood into the country sufficiently for the capital
account surplus to equal the current account deficit. The balance of
payments is maintained.
Balance of payments is thus illustrated for all domestic income
levels and interest rates, though note the more unresponsive, or
price-inelastic are world currency flows the steeper will be this
BoP line.
There is a problem here, however. If a country needs to raise its
interest rate to balance international currency flows it cannot at
the same time use monetary policies to stimulate domestic
spending and investment. As implied in the last chapter, you
cannot use interest rates to regulate the domestic money supply,
open your borders to unrestricted financial markets and use interest
rates to protect the balance of payments. If a country chooses to
opt for these first two variables in the impossible triangle it
must adopt measures other than monetary ones to adjust its trading
relations.
Astute readers might also have noticed another problem. If
interest rates are increased to secure a capital inflow needed to
balance a current account deficit, then it must repay this capital
sometime. In the future, the nation concerned must somehow
achieve the reverse of this situation: a current account surplus that
therefore allows a capital outflow. Countries cannot increase their
indebtedness forever.
The only long-term, sustainable position for a country in inter-
national trade, therefore, is to secure a level of income Y* that
represents full employment at home with balance in the current
account and balance on the capital account. This would mean a posi-
tion on
Figure 6.5
where Ycb is consistent with Y* and local rates of
interest equalled the world rate, r
w
.
How is this possible? The country must adjust its import
spending and export sales such that the current account obtains
balance at a higher income level than illustrated in Figure 6.5. This
© 2004 Tony Cleaver
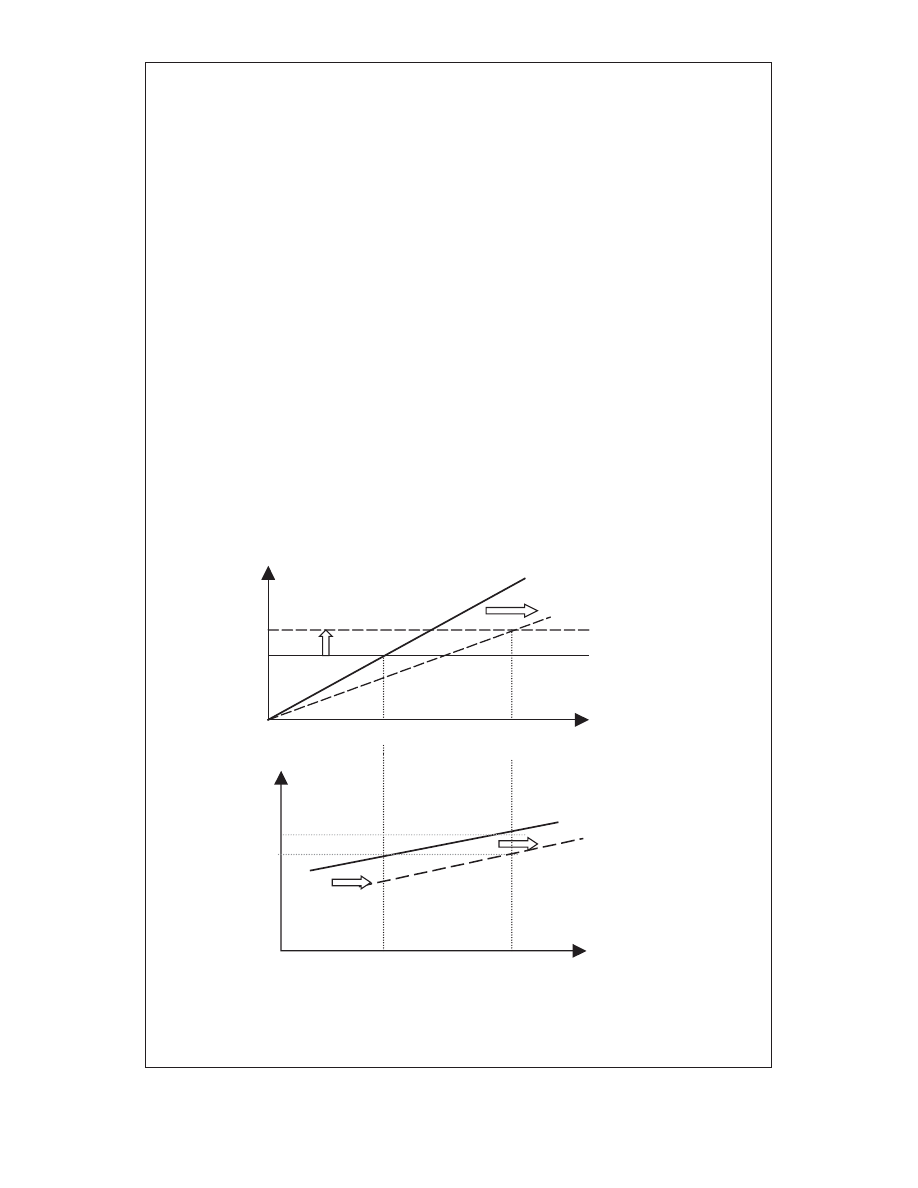
Like in
Figure 6.2
, the upper diagram in Figure 6.6 here shows
imports rising with income, exports exogenously given. If
imports were somehow decreased and exports increased by the
government then the two functions X1 and M1 would shift as
illustrated to give a new current account balance at income level
Ycb2.
On the lower diagram, the shift forward in the income level
where the current account balances from Ycb1 to Ycb2 means the
BoP line shifts similarly. Remember that the BoP line shows all
points where the current account and the capital account are
both balanced. The latter is only true where domestic rates of
interest equal r
w
, the former where national income equals Ycb2.
Line BoP2 now shows these properties. Both capital and current
accounts are thus balanced where Ycb2 equals Y*, which is
consistent with full employment.
Imports, exports
M1
M 2
X2
X1
Income: Y
Y
Ycb1
Ycb2
r
BoP1
r 1
r
w
BoP2
Y
Ycb1
Ycb2
Y
∗
Figure 6.6 A shift in trade relations.
© 2004 Tony Cleaver

can be done in one of two ways (see following sections): either by
direct controls or by devaluing the exchange rate. (Note, if Ycb
cannot be increased then the only other course of action is to reduce
or deflate equilibrium income Y* until it reaches Ycb — not a
pleasant option.)
D i r e c t Co n t r o l s
One way of reducing imports and increasing exports is for govern-
ments to resort to controls on trade. By imposing
TARIFFS
or
QUOTAS
on imports, and by giving tax concessions or direct payments to
encourage domestic industry to export, a country can improve its
balance of payments. Many different countries have used such poli-
cies at various times in the past but, particularly in the case of a
large economy, they are not at all popular with trade partners.
Direct controls are contrary to the spirit of trade liberalisation and
are likely to provoke retaliation. What then occurs is that trade
barriers go up in one country after another and all suffer in the end
(
Box 6.4
).
D e v a l u a t i o n
All of the discussion so far has assumed that exchange rates are
fixed, that trade deficits or surpluses result in continuing outflows
or inflows of money into an economy. This is a fair assumption
since for the most part countries resist short-term fluctuations of
exchange rates. They are very destabilising. Imagine a country
trying to sell its produce abroad when the price of its currency, and
therefore its exports, is continually changing. It would have great
difficulty.
Short-term imbalances in money flows can be financed by a
country running down or building up its reserves of foreign
currency. For example, a trade deficit means more people are buying
imports and thus selling local currency to buy foreign exchange.
Excess sales of the domestic currency will not result in a fall in its
price, however, if the country s central bank can provide the foreign
reserves to match supply with demand. Thus the exchange rate can
stay fixed.
© 2004 Tony Cleaver

But long-term deficits cannot be sustained in this way — reserves
will soon become exhausted. Sooner or later the local currency
must lower, or devalue, its exchange rate.
When this happens, exports have a lower price when quoted in
foreign currencies; imports become more expensive. (As all tourists
know, when the local currency is weak, foreign holidays become
more expensive.) Demand for imports falls as their price rises;
conversely export demand tends to rise.
T h e J - C u r v e E f f e c t
These changes tend to correct money flow imbalances and thus
restore equilibrium to the balance of payments — though not
In March 2002, the Bush administration imposed tariffs on
imports of steel to the USA. The move was an attempt to protect
jobs in America’s declining steel industry in states such as Ohio,
West Virginia and Pennsylvania. Coming from the world’s largest
economy and a valued market for steel-making countries in Asia
and Europe, this protectionist action was a powerful blow
against the interests of global trade as a whole. If other countries
followed the US lead in trying to restrict imports then all interna-
tional trade would suffer and growth in world incomes would
slowly grind to a halt.
An angry European Union was not slow to respond. It threat-
ened to place tariffs on Florida orange juice and a host of other
American goods if the steel duty was not removed. A fearful
WORLD TRADE ORGANISATION
(WTO) ruled the US action as illegal.
On 4 December 2003, President Bush declared that the
‘temporary measure’ to help the US steel industry had run its
course and he re-stated his belief that America was ‘better off in
a world that trades freely and a world that trades fairly’ and he
withdrew the steel tariff. Everyone (except US steel producers)
breathed a sigh of relief.
Source: The Economist, 6 December 2003.
Box 6.4 US controls on imported steel
© 2004 Tony Cleaver
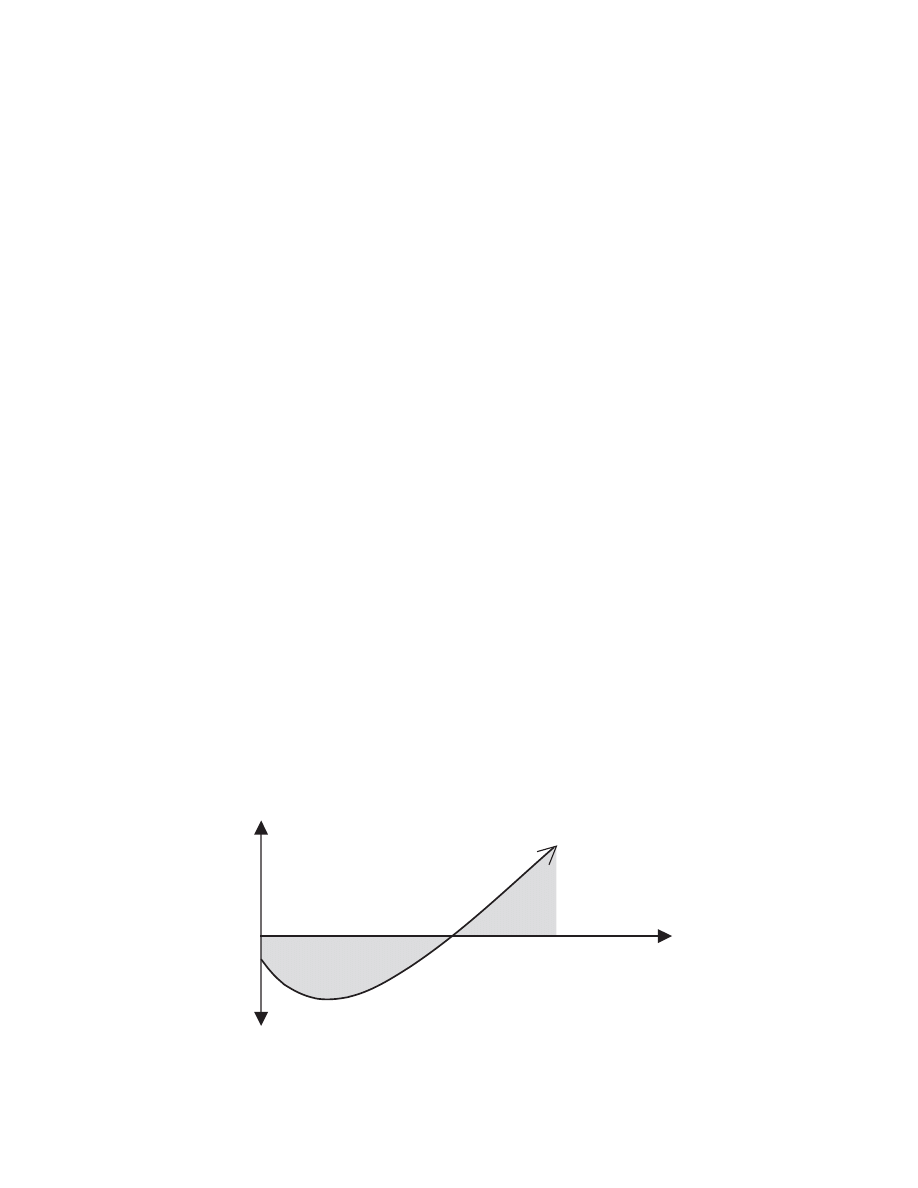
straight away. Because import orders may be fixed and contracts
signed, demand for them will not change as their foreign currency
price rises. The immediate effect is an even larger outflow of funds.
Demand, however, does become more price-elastic over time.
Consumers will place orders with domestic alternatives if foreign
sources are now more expensive.
The same tendency can be observed with exports. They will not
increase at once. First it takes time before foreign customers become
aware of price falls and respond by increasing demand and there is
also a time lag for domestic suppliers to react, to adjust production
schedules and to increase output. That is, both demand and supply
may be price-inelastic at first.
Total currency flow thus takes the following J-curve shape over
time: in Figure 6.7, starting from a deficit position at time 0, the
balance of payments becomes even more negative as an immediate
consequence of devaluation, but steadily improves thereafter.
How long things take before the balance of payments becomes
positive is crucially dependent on the supply elasticity of exports. If
suppliers can increase production quickly consequent upon an
increase in overseas demand then earnings will improve, but if
there is any reluctance on the part of resources (labour and capital)
to move into export production and to increase productivity then
the J-curve may be very flat and may not move into surplus for a
long time, if ever. In such a circumstance the country will inevitably
suffer deflation — a loss of income and the reduction of living
Total currency flow
+
Surplus
0
Time
Deficit
–
Figure 6.7 The effect of devaluation on the balance of payments over time.
© 2004 Tony Cleaver

standards — as the most painful way to reduce import spending and
thus eventually to balance its trade relations.
C O M P A R AT I V E A D VA N TA G E A N D T H E G A I N S
F R O M T R A D E
Throughout history, countries all round the world have resorted to
various measures to try and improve their balance of payments.
The 1930s in particular were years when direct controls and
competitive devaluations were attempted by some nations to
maximise injections and minimise leakages at the expense of others.
They were known as
MERCANTILIST
or beggar my neighbour poli-
cies and, as a result, only served to export recession and impoverish
trade for all.
If a country tries to protect its own industries from losing out to
imports and subsidises exports to try and steal overseas markets from
others then it cannot succeed in the long run. It commits the fallacy
of composition. What seems a good policy for one country to practise
cannot work if all do the same. If nobody wants to buy goods from
anyone else then clearly no one can sell any goods. (Even if one
nation could successfully and selfishly exploit a partner for some
time —
if country As income grows by reducing country B s — then
this cannot continue for long before the export market is exhausted.)
As a general rule, the WTO argues that free trade is the best
policy. It tries to promote the idea of all countries growing together.
Despite the popular protests against globalisation, the WTO insists
that all nations, whether rich or poor, benefit from a world regime
of unrestricted international trade. Rather than protest about
bringing down the barriers to commerce, it is alleged that this is the
one measure most likely to improve the fortunes of the poorest
nations on the planet.
The argument that supports this claim is the principle of
COMPARATIVE ADVANTAGE
, which has been lauded as the most impor-
tant, non-obvious principle of economics. Evidently it is a general
law that is not well understood by the general public. Certainly it is
difficult to implement since domestic voters (especially in rich
countries) who consider themselves vulnerable to trade can create a
lot of political obstacles. This is one of the most important issues in
© 2004 Tony Cleaver

basic economics and it is vitally important that we analyse it fully
here. To emphasise: the argument is that free trade would lead to
huge welfare gains (especially for poorer nations) if it were widely
implemented.
Some simple examples are necessary to explain the argument.
First, take the obvious case where two counties are efficient in
producing different goods (say, one in computers and one in cars). It
makes sense that each specialises in what they are good at and trade
for the other. Both nations clearly benefit.
Now consider the non-obvious case where one country appears
to be more efficient in all its industries compared to its less-
developed neighbour. What do these two nations have to gain from
trade? A common argument heard in the poor world is that they
have everything to lose by being exploited by bigger, richer trading
partners. On the other hand, a familiar cry that goes up in devel-
oped nations on these occasions is that free trade means exporting
jobs to low-wage countries.
Clearly in this scenario both rich and poor cannot claim they are
each losing out to the other. We have to look closer to examine the
economic consequences of trade between unequal partners.
Consider an analogy: the university professor of automotive engi-
neering who happens to be a good car mechanic. Is it worth fixing her
own car when it breaks down or should she take it to the local garage?
The engineering professor may be the world s leading expert on
the internal combustion engine but while she is producing a revolu-
tionary new design that is lighter in weight, uses less fuel and
comes at 10 per cent less cost, she cannot at the same time get
under her own car and fix the fault. What should she do?
This is an example of comparative advantage. The local garage
mechanics may not be able to redesign the future of the motor
industry but they can certainly help fix problematic cars. They
may not be as efficient as the engineer in diagnosing and
correcting the particular fault in question but, by leaving them to
get on with it, the professor can specialise in what she does best. It
is simply not worth her while trying to do everything she evidently
can do.
Meanwhile the local mechanics have work they can get on
with that otherwise they would have been denied and, even more
© 2004 Tony Cleaver

important, by starting with relatively low skill jobs they may
eventually develop more exacting careers.
This analogy should help explain the economic strategies open to
developed and underdeveloped industrial nations. For example, the
USA may be absolutely more efficient than Mexico in both indus-
trial engineering and in car assembly plants. Nonetheless it pays the
US to specialise in that pursuit in which it has the greatest compar-
ative advantage, engineering, and leave the car assembly plant to
locate south of the Rio Grande.
Mexico meanwhile can start work on producing cars. In this
example it has no
ABSOLUTE ADVANTAGE
but retains a comparative
advantage in car assembly (i.e. compared to engineering design). It
may employ more labour than would be the case in a similar
factory north of the border, productivity might be lower and
those employed may not develop many sophisticated skills at
first, but economic development has to start somewhere and, in
this example, car assembly is the place. (I
NFANT INDUSTRIES
like
this are in fact a typical way to start the process of growth and
development.)
How does a country know in which industries it possesses
comparative advantage? Two Swedish economists, Eli Heckscher
and Bertil Ohlin, argued that a nation will have an advantage in
industries which use intensively those factors of production that
the country has in abundance. Thus the USA can specialise in high-
tech goods that require abundant supplies of highly skilled labour;
Mexico can specialise in industrial goods that employ large
numbers of lower skilled personnel.
One dynamic implication of the Heckscher—Ohlin theory is that,
over time as specialisation occurs, the rewards will rise to the factor
in production increasingly employed in trade. This has income
DISTRIBUTION EFFECTS
for the countries concerned. In the hypothet-
ical example used here, it means that lower skilled workers in
Mexico should gain more earnings over time; similarly, returns to
technical qualifications in the USA should improve. Note that these
distribution effects can have important social and political conse-
quences for the countries concerned and any tensions that arise
must be carefully managed. There is no better example of this than
the case of Argentina (
see
Box 6.5
).
© 2004 Tony Cleaver

One hundred years ago, Argentina was a fast-developing country
with a high per capita income equal to or better than many
European states. It stood comparison with Canada and Australia
as a huge, resource-rich land of recent settlement that became a
world leader in the production of a staple product – beef – for
overseas markets.
Staple theory explains the way in which specialisation in the
export of a key primary product can create a network of linkages
in the developing country – the spread of transport and commer-
cial
INFRASTRUCTURE
and the development of port facilities that
typifies what occurred in and around Buenos Aires and the
Argentine Pampas. Note, however, that modern export-led devel-
opment is not just determined by advantageous overseas
demand conditions – it is crucially dependent on supply-side
factors. The fact that Argentina became a world leader in the
export of beef, rather than wheat which it could also produce,
was because the enterprise, investment and expertise that it
developed in cattle ranching was far more innovative and
dynamic than any other farming or industrial practice at the
time. It thus spawned complementary investment in the latest
techniques of stock breeding, refrigerated transport and modern
banking and financial facilities and attracted great inflows of
European capital and immigration in the three decades running
up to the First World War.
Argentina was the leading Latin American economy for most
of the twentieth century in terms of its national income and
national income per capita but the Great Depression of the
1930s resulted in a sudden collapse in overseas markets. The
political consequences were immense. The land-owning, liberal
aristocracy that favoured export led policies now lost out to
urban-based, nationalist, populist opinion that demanded policies
favouring industrial development.
Argentina entered the post-Second World War period with
a well-established, domestically-owned industrial sector, a
Box 6.5 Trade, specialisation and income growth – the social and
political consequences
© 2004 Tony Cleaver

well-integrated economy with efficient export-orientated agricul-
ture, little persistent unemployment, wide access to education
and, relative to the region, less inequality. It came closer to the
standard neoclassical ideal, with all factors of production scarce
and valuable in market terms, than almost any other less devel-
oped country. It was not a less developed country.
Juan Domingo Peron was elected Argentine President in
1946, principally by urban voters. He immediately set about
implementing an economic strategy that was industrialist,
protectionist, based on government direction and subsidy and
designed to transfer resources from agriculture and the land-
owning elite towards industrial working classes. The policy
stance was extreme: reducing farm export incomes by a half of
their real value by insisting all sales went through government
marketing boards at fixed low prices. (See monopsony,
Chapter 1
.)
Meanwhile urban real wages increased by around 62 per cent
between 1946 and 1949.
As a strategy to redistribute incomes, these policies were
outstandingly successful but their extremism built in to
Argentine society major long-term problems: bitter division of
industry against agriculture; government as patron and provider
rather than market policeman, and increasing fiscal deficits and
external trade imbalances. The country was set on a post-war
path of sluggish inefficiency and contradictory objectives.
An economy that was based on export agriculture but which
protects industry, depresses agricultural incomes and inflates
urban ones is bound on the one hand to reduce export revenues
while on the other promote increased expenditure on foreign
consumer goods. Further, when the main exports are meat and
wheat then increased urban incomes and consumption tend to
divert these potential exports into the domestic market.
The post-war Peron government thus ran into inevitable
balance of payments difficulties and stop-go growth. The only way
to stop trade deficits was to stop growth in spending. As soon as
spending resumed the deficits came back. Efforts to restore incen-
tives to primary exporters by devaluing the currency only
promoted demonstrations from well-organised urban workers and
© 2004 Tony Cleaver

industrialists. Trying to buy off both sides then resulted in fiscal
deficits and inflation. A spiral of inflation, devaluations, increased
wage demands, increased public spending, inflation etc was thus
institutionalised: the economic consequences of domestic social
conflict. The military forced Peron into exile in 1955 but the basic
fault-lines in Argentine society, polity and economy remained and,
to this day, they still hamstring attempts to secure economic
growth and development.
The Argentine experience shows that international trade can
bring immense rewards – and the market may distribute these in
ways that are not always popular. Government management of
the gains from trade can then be fraught with difficulty (though
see
Box 6.7
on Korea).
A R G U M E N T S F O R T R A D E P R O T E C T I O N
In all countries there are likely to be winners and losers as trade
expands. The most common argument against free trade is that it
creates unemployment in those domestic industries that cannot
compete against cheap imports. While this is undoubtedly true, it is
nonetheless argued that there are sufficient welfare gains to be
made by unrestricted trading to compensate the losers and still
leave a net gain for the country as a whole. The principle is as true
for individuals as it is true for communities: by specialising in
certain employments you can earn more than if you try to produce
everything yourself.
P o l i t i c a l A r g u m e n t s
While the economic equation is clearly weighted in favour of trade,
however, the political argument may not be. Try convincing the
farmers in industrial countries that they have no comparative advan-
tage. Inefficient (in world terms) farmers in Europe have been
blocking reforms to the
COMMON AGRICULTURAL POLICY
(the CAP) for
years —
much to the chagrin and cost of both poor country producers
and rich country consumers. While it is true that, in theory, a country
© 2004 Tony Cleaver

Agriculture is subsidised in many rich-world countries for a variety
of reasons. Farming is liable to large swings in output as unpre-
dictable weather, disease and other misfortunes have their impact.
Agricultural prices are thus very variable in free market conditions
– hence the demand for government intervention to stabilise
prices and farm incomes. In many countries, also, the agricultural
lobby is a powerful political force – partly as a result of strong
emotional attachment to the countryside and the historic (now
redundant?) strategic need to guarantee domestic food supplies.
Government subsidies to farmers in the developed world,
however, act against the interests of poorer countries who have
little else to export. Far from free trade, we have a global system
that fixes the rules to keep rich farmers’ incomes up and poor
countries’ incomes down. In the last round of world trade
discussions (The Uruguay Round, 1986–93) between rich and
poor nations, agriculture was deliberately kept off the agenda.
The World Trade Organisation has insisted that in the present
round of negotiations (The Doha Round, supposed to be
concluded in 2005) agriculture is kept very firmly in centre focus.
Unfortunately, the European Union is unlikely to make any size-
able concession to modify its system of farm subsidies in the
CAP and the USA, in response, is therefore unlikely to move
much either. It seems that free trade in agricultural products –
which would be the single most important measure to improve
developing country incomes – is still a long way off.
Source: see
www.wto.org
for a record of past and up-to-date news on
agricultural trade negotiations.
Box 6.6 Protecting the farmers
can compensate losers in trade this does not mean that all people who
stand to lose out will trust their governments to actually do that.
I n f a n t I n d u s t r i e s
The fastest growing economies in the world, in East Asia, have not
pursued blanket free trade policies as a means of raising their
© 2004 Tony Cleaver

incomes. They have, in fact, been careful to protect their infant
industries as a means of developing their potential.
Consider the case of car production. Korea had no comparative
advantage in this industry, at first. Enormous US, European and
Japanese car giants could exploit economies of scale to keep costs of
production down and —
with product names and logos well-
recognised all round the world — there were considerable barriers to
entry into this global market place. Nonetheless, the South Korean
government realised that comparative advantage is a dynamic, not a
static concept. What seems impossible today might not be so
tomorrow. Policies were therefore implemented to raise levels of
general education and to support management training. Similarly, the
growing capital markets (domestic banks and money traders) were
instructed to give low cost access to finance to certain chosen sectors,
and the government gave tax breaks, subsidised investment and,
directly and indirectly, encouraged the growth of fledgling export
industries that would otherwise have been unable to compete in
world markets. The strategy worked. Korea now has a highly skilled
and hard-working urban, industrial workforce and a capital market
structure that gives its motor industry a competitive advantage.
Infant industries need protection from world competition until
they have grown up enough to cope with it. Free trade may be the
best policy in the long run but in the short term there are sound
economic arguments to grant protection as a means to that end.
(Note, however, that all involved must accept that government
protection is short term only. Dependent infants have no incentive
to grow up otherwise.)
‘ E x t e r n a l ’ E f f e c t s
The Korean example given previously introduces the concept of
EXTERNALITIES
. Markets will fail to allocate resources efficiently if
their prices do not reflect all the external costs and benefits
involved in both production and consumption. If many of the
rewards for a certain enterprise are all external (e.g. workers receive
excellent training in accountancy then leave to set up their own
businesses) then it profits the entrepreneur little to start up.
Government must take a lead in these circumstances (
Box 6.7
).
© 2004 Tony Cleaver

The case of POSCO, Korea’s state-owned integrated steel
industry, is an excellent example of how governments can
overcome
MARKET FAILURE
. In the early 1970s the Korean govern-
ment applied for a concessionary loan (i.e. at a lower than
market rate of interest) from the World Bank to build a steel mill.
The application was rejected on the grounds that Korea
possessed no comparative advantage in steel. The World Bank,
using standard market valuation, was correct in its decision.
There are enormous economies of scale in building such capital
equipment, (see
Chapter 3
) which implies a long gestation
period before output is large enough to be efficient. And where
was the market for all the steel that was proposed? World
markets were glutted and domestic steel demands in this devel-
oping country were not great. Thus returns on any investment
in Korean steel seemed to be way below market rates for the
foreseeable future.
The government went ahead with the investment anyway and
found its own finance. Additionally, the government provided
essential infrastructure such as water supplies, port facilities,
power stations, road and rail communications. Manufacturing in
chosen sectors – like the motor industry – was also subsidised
so that steel production when it eventually came on-stream had
a ready-made market. Current market signals were, in effect,
ignored and producers were responding to government
commands – a system in East Asia known as
ADMINISTRATIVE
GUIDANCE
. Some years later, POSCO eventually won the World
Bank accolade of being ‘the world’s most efficient producer of
steel’, out-competing many other producers around the globe.
Moreover, its success stimulated a host of domestic supply
industries to set up which could now sell a range of products to
the steel mills: the fraction of local content in POSCO’s output
increased from 44 to 75 per cent between 1977 and 1984.
Source: Rodrik, D. (1995) ‘Getting Interventions Right: How South
Korea and Taiwan Grew Rich’ Economic Policy 20.
Box 6.7 Korean steel and administrative guidance
© 2004 Tony Cleaver

Direct government allocation can thus lead to greater efficiency
than free markets are able to secure on their own. Countries learn
by doing. Management skills improve in coping with developing
industries. Technology (like skills) can be expensive to develop but
quick to disperse. Linkages between industries can be exploited —
both forward and backward. A cement plant provides construction
materials for office blocks (a forward linkage), whilst pulp and paper
industries set up to produce sacks for cement (a backward linkage).
No one industry would contemplate starting on their own but if all
set up more or less together the costs for all would be reduced. Co-
ordinating such decisions and implementing them requires the
hand of government.
There are negative externalities that markets omit also. Free
trade and specialisation can promote the exploitation of exhaustible
natural resources. For example, Borneo in East Malaysia has a
wealth of tropical rainforest which supports irreplaceable ecologies —
yet the profits received by private logging companies for selling
hardwoods to customers overseas do nothing to compensate for the
loss of precious eco-diversity. Similarly, tourism is frequently cited
as an industry that many poor countries can develop but this too can
bring problems. Cultural pollution occurs — a superficial materialism
that begins to erode a rich cultural and spiritual heritage.
As a general aim, therefore, free trade has much to commend it
but arguments given in this section show that it must be carefully
managed. There are a variety of private and social costs and benefits
involved in opening up sectors of an economy to trade. National
income and welfare may be enhanced by trade in the long run but
development takes time and governments may need to give guid-
ance, support and, indeed, protection to certain natural and cultural
assets whose values are not recognised in the short term. Getting
the policy mix right in all circumstances is not easy.
M U LT I N AT I O N A L C O M P A N I E S
The dilemma of how best to secure free trade but not to lose out in
the process is central to the relationship between
MULTINATIONAL
CORPORATIONS
(MNCs) and host governments in the developing world.
Two thirds of international trade nowadays is handled by busi-
nesses that own assets in more than one country. For example,
© 2004 Tony Cleaver

much internal firm trade now crosses borders: a firm producing raw
materials in one country sells supplies to a manufacturing affiliate
in another and the finished product may be marketed by a sales
office of the same corporate family located in yet another part of
the world.
There is no doubt that one of the major economic trends of the
last fifty years or so has been the phenomenal growth and global
reach of MNCs. Business empires have built up all over the world
such that companies like the Swiss-based Nestle SA own assets
worth US$37.7 billion (1997), 93 per cent of which are held over-
seas and which are more highly valued than the GDP of many poor
nations (e.g. Ghana US$5.4 billion; Guatemala US$19.0 billion;
Morocco US$33.3 billion and Romania US$36.7 billion).
The concentration of economic power in the hands of profit-
seeking global enterprises has become a source of much
controversy. The huge flows of FDI into and out of different coun-
tries is potentially very unsettling for any national economy. What
represents a good business decision for any one MNC may not be
good business for the country that hosts its operations. At the same
time, nations can benefit greatly from the resources and technology
that foreign firms can bring into (particularly) developing coun-
tries. There are therefore arguments both for and against opening
borders to international business and governments, academics, jour-
nalists and many members of the public have all expressed concerns
over the issue (see Box 6.8).
Some high-profile MNCs make easy targets for anti-globalisation
critics. There are many arguments to be found in books, articles
and websites protesting about the injustices perpetrated by
global capitalism. It is the responsibility of all students to
examine the economic issues for and against these criticisms.
Here are two well-known examples.
In the Indonesian financial crisis of 1998, rioters in Jakarta
demonstrated outside a local McDonalds hamburger bar,
protesting about alleged US cultural imperialism. The owner of
Box 6.8 Multinationals at bay?
© 2004 Tony Cleaver

the
FRANCHISE
rushed out to try and placate the crowds. Contrary
to the shouts and criticisms being aired, he reassured those
outside that he was an honest local citizen, he and his assistants
were all devout Muslims and the shop was always closed in the
holy month of Ramadan.
Nike, the sports wear company, subcontracts the production
of shoes to owners of factories in China, Indonesia and Vietnam.
In 1992, critics pointed out that the basketball star Michael
Jordan was paid US$20 million for promoting its products –
which was as much as the entire annual payroll of four
Indonesian shoe factories where thousands of female employees
allegedly earned as little as 15 cents an hour.
In the first case, McDonalds hamburgers are undeniably an
American concept. Your friendly neighbourhood store is, however,
locally staffed and managed. The parent company sells franchises
to local owners who receive management training, start-up capital
and all the production technology to ensure that the final product
sold to customers is recognisably the same as any other Big Mac
sold anywhere else in the world. The franchise owner is free to
keep any profits after all costs including a fraction to the MNC,
are paid.
From the point of view of development economics, this is
excellent business for the host country – capital, management
training,
TECHNOLOGY TRANSFER
, increased employment are all
benefits gained. Linkages established with local supply chains
are similarly beneficial. So what is the problem here? There are
issues of cultural imperialism involved but they can be over-
stated. Are Indonesian customers selling their culture short by
buying American style products, rather than traditional meals?
Are they really innocent victims of sophisticated US marketing
techniques? (Could not the same be said of US customers
visiting Mexican or Indian restaurants
. . .?)
In the second case, Nike is a US-based marketing enterprise,
not a manufacturing company. It will send its designs to any
factory anywhere that can deliver on contract at least cost.
Developing-country firms that sign up to this are given access
to modern designs and knowledge of customer tastes in rich
© 2004 Tony Cleaver

overseas markets. They learn essential international business
practice where delivery to contract – honouring a deal – is the
key to economic development and growth. The producing facto-
ries are all locally owned, managed and staffed and rates of pay
are determined by local markets under the jurisdiction of
national governments. Poor countries have lots of unskilled
labour but scarce capital and enterprise. Pay scales will
inevitably reflect local demand and supply. If wages were higher
(in fact, those MNCs that do operate in low-income countries
usually pay above local rates for labour since they have more to
lose from poor publicity) more people would flood into the cities
than could be employed. (Hence the rise of shanty towns that
disfigure many urban areas in developing countries.)
The Michael Jordans and David Beckams of this world have
earnings that reflect their scarce talents. They may earn as much
or more than factory loads of workers but first, they are selected
from a strenuously competitive arena in an open international
marketplace and can only earn fabulous sums if millions of
sports fans are persuaded of their importance. Second, it can be
argued that developing-country sports stars like Brazil’s Ronaldo
and China’s Yao Ming have equal access to this high-paying
global industry.
Ca u s e s f o r G r o w t h
Economists must seek to understand why there has been such great
growth in multinational enterprise. What drives this particularly
successful economic animal? For example, given that there are
inevitable costs in any one business attempting to set up producer
affiliates abroad, why do it? Why not stay at home and export, or
sell the license to produce to a local, overseas enterprise?
One reason is to by-pass any host country restrictions on trade.
Japanese car producers were originally barred from access to
European markets by tight quotas on all imports. They thus
invested in building large-scale, host country car plants behind the
trade walls the European Community had erected. Exports may not
© 2004 Tony Cleaver

always be possible so in such circumstances MNCs are inclined to
invest in overseas production instead.
One reason for not taking out licensing agreements is to retain
tight control over all stages in the production and marketing
process. If a particular business thinks it has a winning formula for
its product in world markets it may not wish to let any other busi-
ness get within arm s length of it. Research and development costs
in some industries are immense yet imitation may be quite cheap
and easy to achieve. If the parent company is not able to secure
a high price from a potential licensee then the MNC will wish to
enter the foreign market itself rather than pass over the rights too
cheaply to an outsider. This is particularly relevant in developing
countries that offer little patent protection in law. (See the argu-
ment in earlier chapters about the importance of property rights —
no protection means no deal.)
Behind these political influences on the spread of multinational
enterprise there are some basic economic laws. These businesses are
all subject to significant economies of scale, not just in production
but, particularly, in co-ordination, administration and technological
research. MNCs are also an efficient form of economic organisation
in situations where sources of supply are spread around the world
in diverse locations and, similarly, potential markets are huge,
global and not subject to major national differences in tastes and
preferences.
An industry that demonstrates all these conditions par excel-
lence is oil (see
Box 6.9
). It is also true of industries such as
chemicals, pharmaceuticals and electronics. (The motor industry has
more problems since it has to accommodate differences in prefer-
ences but does so successfully by restricting choice to a limited
range of models. Giant food and beverage conglomerates have even
greater diversity to cope with; they seem to have grown in spite of
wide differences in consumer tastes. How? By maintaining a large
portfolio of varied products — Nestle s instant coffee, chocolate bars
and breakfast cereals are the same in South Africa as they are in
Singapore.)
International business looks around the world to answer a number
of different questions: where is the least-cost location for gaining raw
material supplies? Where is production best based? Is closeness to
sources or to markets more important? Driven by the pursuit of
© 2004 Tony Cleaver

Oil is a homogeneous product. My car cannot tell the difference
between one brand of petrol and another. The fact that different
oil company products are, therefore, perfect substitutes for each
other means this industry is characterised by intense rivalry and
thus sometimes collusion (see
Chapter 3
). The growth of the
major oil oligopolists has come as a result of fierce competition –
one company on occasions buying up another – and strategies
employed by the more successful to build huge vertically inte-
grated enterprises that safeguard production from finding the
basic raw material in one part of the world right through to
marketing the finished product on the other side of the globe.
For much of the twentieth century, the international oil
industry was dominated by a handful of oil ‘majors’ (famous
names such as Esso/Exxon, Shell, BP, Mobil, etc.) which
controlled all stages in production and distribution. Since most
oil was bought and sold between affiliates in the same company,
only relatively little was ever freely traded internationally. The oil
majors were thus able to dictate world oil prices and declare
profits in whichever country they wanted, according to where tax
laws were least.
Rich-world customers of petroleum products could be charged
high prices; poor-world producer countries could get relatively
little for their supplies of crude. The oilmen in the middle made
fortunes. All this changed, however, in the 1970s. This was when,
with consumption outgrowing production, the USA became a net
importer of oil and then the OPEC governments nationalised the
assets of the oil majors that had previously controlled the output
of crude oil. For the first time ever, a group of underdeveloped
nations could now exercise real economic power. A series of oil
strikes imposed by the OPEC nations forced up the international
price of oil and caused a major redistribution of world incomes –
away from consumer countries and into the pockets of OPEC, not
the oil companies (see
Chapter 4
).
Since those days, host countries have become much more
adept in bargaining for a good deal with incoming oil companies
Box 6.9 The international oil industry
© 2004 Tony Cleaver

profits and the need to seek a competitive edge, once a given market
or source of supply has matured, the MNC must move on.
Host governments in developing countries have different objec-
tives to MNCs wishing to locate within their realm. Whether or not
they welcome incoming FDI, and on what terms, depends entirely
on the nature of the agreement signed between the two parties.
There is no a priori reason why the economic activities of MNCs
should on balance be beneficial or harmful to the interests of host
countries. As implied earlier, opening frontiers to FDI can bring
both advantages and disadvantages.
T h e B e n e f i t s o f M u l t i n a t i o n a l E n t e r p r i s e
FDI can bring in much needed capital to developing countries. One
of the more significant obstacles to economic development in poor
countries is that their level of savings is low. They are caught in the
trap of low incomes, a low propensity to save and thus an inability
to invest. Additionally, given underdeveloped banking systems,
what savings are made are not necessarily efficiently recycled into
the most productive investment outlets. Low investment means
low, or no, growth.
MNCs can help raise the level of investment in developing coun-
tries by calling on resources denied to host countries. FDI also tends
to be the sort that is long term — the construction of plant and
machinery that will not be subject to de-stabilising, short-term
speculative movement: in one day, out the next.
and, with the hold of the majors weakened, the structure of the
industry is now more open, less collusive and more liable to
change. As a result, countries with significant oil reserves can
now play the field and hold out for better prices from MNCs.
Note, however, oil is a commodity that is much in demand and
few other natural resources confer such bargaining power on
developing countries fortunate enough to possess scarce
supplies. The road to riches pursued by OPEC governments is
unlikely to be followed by others.
© 2004 Tony Cleaver
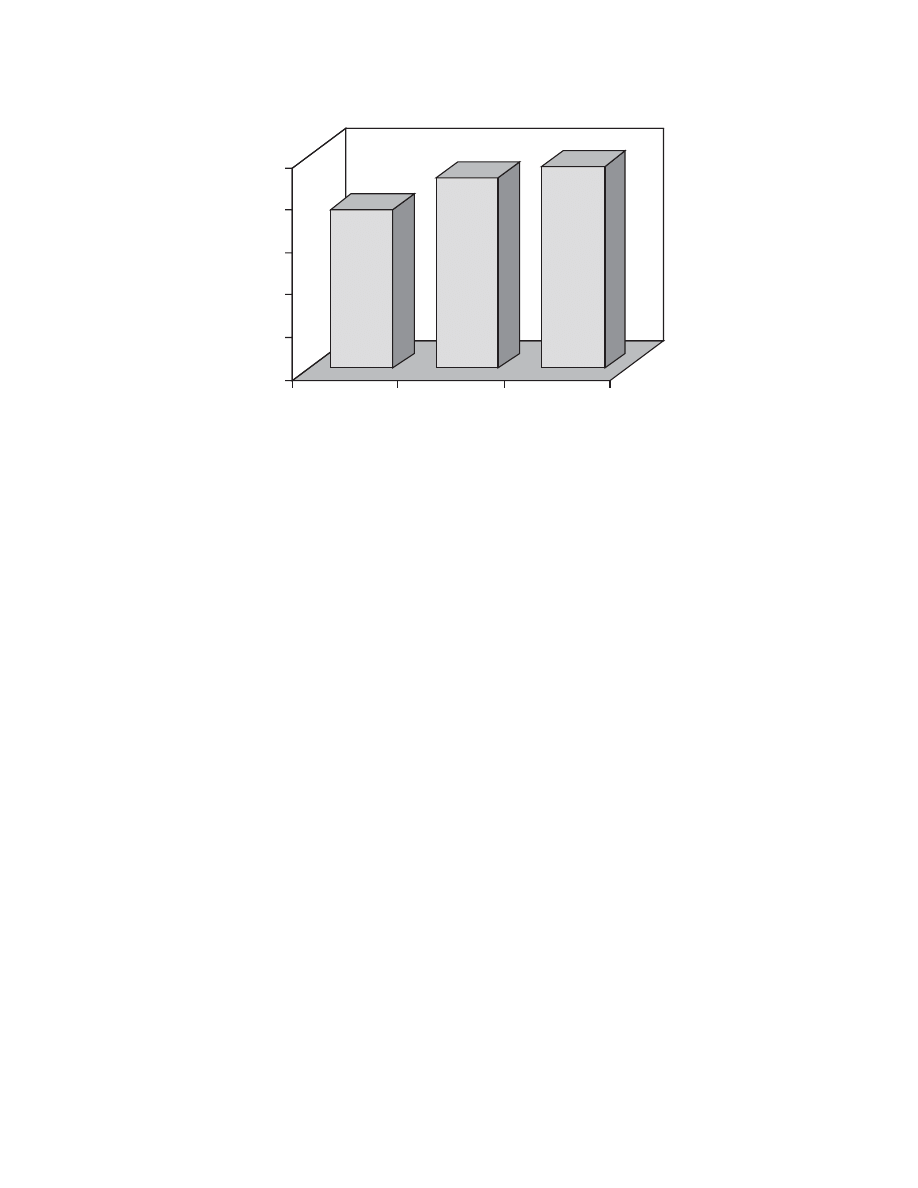
One of the benefits of increasing globalisation, therefore, is that
billions of dollars of investment have flowed into developing coun-
tries recently (see Figure 6.8) which would otherwise not have
occurred. Like any investment anywhere, these funds will be placed
in profit-seeking outlets (perhaps manufacturing products for the
domestic market) intended to reward the businesses concerned. This
does not mean, however, that the interests of the host country are
not also served.
First, of course, new investment means the creation of new jobs.
Many MNCs locate production facilities in poor countries to take
advantage of lower production costs — especially lower wage costs.
This is not prejudicial to local labour. As mentioned earlier, MNCs,
if anything, are guilty of providing better than local rates and
conditions — a practice that they should contain. Better to employ
thousands at relatively low (by Western standards) wages than give
out only a few jobs at much higher rates and leave the rest in
poverty.
If, indeed, a MNC affiliate is set up to serve the local market
then the welfare of domestic consumers is increased. (People only
buy goods if the value of the product consumed is greater than the
value of the money — and thus all other alternatives — exchanged
for them.) If the investment is instead designed to export local
produce then local infrastructure will be set up to facilitate this
0
50
100
150
200
250
1998
1999
2000
Inward investment to developing
countries (US$ billions)
Figure 6.8 Foreign direct investment in developing countries, 1998–2000.
© 2004 Tony Cleaver

trade (see
Box 6.5
on Argentine beef exports) and other domestic
enterprise in the host country can benefit by gaining knowledge of
how to access foreign markets. Recent evidence from Latin America
and Asia shows that multinational firms can and do act as export
catalysts for local businesses interested in following their lead.
Another spin-off from inward investment for the host country is
the possibility of increasing not only the quantity of capital but also
its quality, or productivity. Technology transfer takes many forms.
MNCs can bring in not only the latest glitzy machines, they can
also provide excellent management development opportunities plus
workforce training in high tech skills. If the skills gap between local
and foreign personnel is great then the MNC will bring in its own
people, and technology transfer will be relatively little, but
nonetheless the opportunity is there for increased skill transfer if
the host country can upgrade its own education systems and
provide the local labour force with the start-up human capital
required. There have certainly been complaints that some devel-
oping countries have not gained as much as they originally hoped
for from incoming technology. Other nations however, like
Singapore, have grown up on the back of FDI that has undoubtedly
added value to the local skills base.
The role of government is important in determining the distri-
bution of eventual rewards from MNC operations. The example of
the oil industry (see
Box 6.9
) is a classic case where MNCs can offer
countries with crude oil reserves the sophisticated technological
expertise to develop their untapped natural resources. One party
has supplies of capital and the latest technology; the other has the
undeveloped raw material. Clearly both parties stand to benefit: it is
all down to striking a mutually acceptable agreement. Note that the
deal will be better for the host country the more competitive, less
collusive, is the multinational industry with which it has to nego-
tiate and the more honest, incorruptible and commercially astute is
its government.
Lastly, free trade — wherever it obtains — brings with it the drive
for efficiency. So long as local businesses are not sheltered from
competition behind tariff walls they must be efficient in order to
survive. Giving access to the local market to MNCs means that
domestic monopolies cannot evolve and nor can they grow up
dangerously close to government. Efficiency is thus promoted not
only in industry but also in public service: government officials are
© 2004 Tony Cleaver

open to bribery and corruption if local business believes that the
path to profits is best pursued by
RENT
-
SEEKING
— securing subsidies,
tax protection or exclusive government contracts rather than
striving to be competitive.
T h e D i s a d v a n t a g e s
A popular, if well worn, argument against multinationals setting up
offices in host nations is that they act to siphon off profits back to
their parent. Over time, MNCs therefore act as a conduit for capital
to move out of developing countries, not into them.
Evidence for this particular argument needs to be convincing
nowadays. If the market is developing then MNC profits are
frequently ploughed back into further investment in the host
country. In those countries where local stock markets are up and
running, the MNC will raise share capital and thus distribute
profits to local owners. In total, MNCs generate a lot of trade, in
goods, services and some of it in financial instruments, and it would
be premature to conclude that the net balance for host countries
must always be negative. Nonetheless, the historical experience of
oil companies and other extractive industries has been one where
great profits have been made and contracts signed with developing
country governments have left the hosts with only a small slice of
the overall cake. There should be little surprise then if newcomers
are now greeted overseas with more cynical, distrustful attitudes.
Employment effects of MNCs may not always be beneficial. The
incoming, modern-equipped factory may out-compete domestic
rivals and lead to the closing down of many jobs. This is all the
more likely if the technology employed by the MNC is capital-
intensive. Relatively few employment opportunities in high-tech
skills for foreigners will therefore be created whereas thousands of
unskilled domestic workers may be forced out of their jobs in local
firms that now go bust.
By the same token, technology transfer may be minimal. MNCs
may jealously guard access to research and development benefits —
perhaps keeping the important value-added functions of design and
technology in the parent country and releasing only assembly oper-
ations to locations abroad where they are disparagingly known
as screwdriver plants . The first
MAQUILADORES
in Mexico were
originally of this type — US owned factories built just south of the
© 2004 Tony Cleaver

border in tax free zones set up to serve the markets further north.
Spin-off benefits to local industry, which might be expected to win
contracts to supply the MNC with a variety of inputs were also
disappointingly low where the said assembly plant just put together
mostly imported components.
Lastly, multinational corporations bring a way of life to devel-
oping countries that threatens local cultures. Western capitalist
culture promotes materialism and rewards individualism, not the
communalism of the extended family or village. It brings an obses-
sion with the pursuit of profit and economic growth and it
inevitably results in widening income differentials as some seize
opportunities to enrich themselves while others do not; where some
skills and attributes are valued by the market and others are not.
MNCs are enormously powerful engines of modernism. If this is
progress, not all communities are prepared for it.
C O N C L U S I O N
We live in an international marketplace nowadays. In fact it has
always been so: national sovereignty is a thing of the past, and the
long distant past at that. The chance to make fortunes in trade has
driven the expansion of empires from before Roman times, through
the race to establish European colonies, to the emphasis on globali-
sation today. World economic fortunes are inextricably intertwined.
There yet remain some corners of the world where the global
reach of trade has not made significant inroads — such places may
retain prized traditional cultures but they also support very low
material standards of living. Given the choice, people in such
communities usually want the increasing incomes that access to
world markets gives them.
Multinational corporations have played an increasingly dominant
role in world trade since the early twentieth century and we have
seen that their operations can bring advantages and disadvantages
to countries that host their operations. National governments,
however, are responsible for setting the rules for commerce within
their borders and MNCs can only do business within the terms
of contracts agreed. It is for host nations therefore to monitor
the balance of interests served. Economics argues that the more
the competition that obtains, the more the efficiency and less the
© 2004 Tony Cleaver

corruption that is likely to result. Note that efficient markets require
the free exchange of information — open access to the media can thus
help safeguard against closet deals being signed that enrich only a
minority. Lastly, growing multinationalism in business is, in the end,
the best defence against certain countries being exploited for the
alleged benefit of others. E
CONOMIC IMPERIALISM
, as it is called, was
the result of companies of one distinct nationality trying to
maximise their returns at the expense of a foreign nation. But the
more a MNC raises long-term capital from stock holders in host
countries and the more it employs local managers in senior positions —
that is, the more truly multinational it becomes — then no country
becomes foreign and thus the more likely the ethos within the firm
will seek to promote equitable outcomes for all parties.
Summary
• Imports act as a leakage, and exports an injection, into the circular
flow of national income in any country.
• For long-term equilibrium, a country must attempt to secure a
balance of all its international payments consistent with the full
employment level of national income.
• As a general rule, the more that international trade is free from controls
and restrictions, the more all participating countries can benefit.
• Free trade, for poor countries in particular, may be a long-term goal
that requires short-term management. It is important that they are
not shut out of rich country markets, nor are they stifled by the
economic power of huge multinational corporations.
• Where economies of scale exist and where markets, resources and
risks are all geographically dispersed, multinational corporations
have evolved as remarkably effective mediums in the organisation of
world trade.
• The experience of past abuses, the global spread of information,
increasing competition and the growing internationalism of multi-
national labour and capital can moderate the exploitative tendencies
of modern business. Growth in world trade and incomes, and the
increasing dispersal of both, is thereby possible for the future.
© 2004 Tony Cleaver

F U R T H E R R E A D I N G
An excellent and encyclopaedic coverage of international trade
issues can be found in Yarbrough, B. V. and Yarbrough, R. M. (2000)
The World Economy: Trade and Finance, Harcourt & Co.
For up-to-the-minute news and information on specific countries;
for regular surveys on trade, development, finance and the environ-
ment, and for a consistent argument in favour of free trade, The
Economist magazine is without equal.
For a contrary, more sceptical view on the forces of globalisation,
but also including a wide range of offerings from an interesting
selection of economists, visit the trilingual Chilean website:
www.rrojasdatabank.org
© 2004 Tony Cleaver

7
C A N W E R E D U C E P O V E R T Y
A N D P R O T E C T T H E
E N V I R O N M E N T ?
This final chapter brings together a number of the concepts, themes
and theories introduced and analysed in the preceding pages. We are
thus finally able to examine the two important questions that
opened this text: how to improve living standards for all without
sacrificing the needs of future generations.
Economics is concerned with scarcity and the need for choice.
Clearly, if Earth’s resources were limitless then there would be no
need to economise on anything – but instead humankind’s ideals
must always be constrained by the finite means at our disposal.
Since we cannot always have everything, we are faced with trade-
offs. What goals do we seek to prioritise and which do we therefore
have to sacrifice?
Society can employ one of three decision-making systems to
address these issues. Central authority can issue commands as to
what, how and for whom things should be produced. (What legit-
imises this authority is a question of political economy. It could be
democracy or dictatorship.) Free trade between independent buyers
and sellers may instead arrange all economic affairs, with market
prices signalling which, and how efficiently, social needs should be
met. Finally, there are some communities that leave economic
organisation to tradition – following the pattern of past decision-
making to embrace the demands of the present.
© 2004 Tony Cleaver

Economic logic dictates, and history demonstrates, that
communities are not always left alone to decide their future. The
more effective the decision-making system adopted by society, the
more it will secure economic growth and the more its influence will
spread. Market based societies have thus evolved to become domi-
nant. Command and traditional elements have their role within them
but, with the eclipse of the centrally planned economies, systems
which are predominantly market organised are now unrivalled in the
world.
What goods and services a market society produces depends on
the pattern of consumer spending. How production is organised is
determined by the nature of market competition. Whose needs the
market serves depends on the power of individual spending – which
in the long run is decided by each person’s productivity and thus
ability to earn income.
This neat circular ideal illustrates the importance of
CONSUMER
SOVEREIGNTY
. The market serves the individual; the individual serves
the market. It is a form of economic democracy where, as Friedman
has argued, everyone is free to choose. In all and every trade that is
undertaken, buyers and sellers agree a price that is freely arrived at
and therefore mutually beneficial. There would be no deal if the
welfare of both parties to an agreement were not enhanced.
The problem with this economic democracy, of course, is that
first, not everyone has an equal vote and second, we are not all
perfectly informed of the consequences of our choices. Markets are
not perfect. The productivity of some people may not be recognised
nor rewarded sufficiently and they will therefore exhibit very little
voting power. And those commodities and production processes that
do receive substantial votes of consumer confidence may in fact
prove to be very harmful to the environment and thus our overall
welfare.
Why some countries have grown rich while others have not is a
question that has troubled economists since Adam Smith wrote An
Inquiry into the Nature and Causes of the Wealth of Nations in
1776. Examining the costs and benefits involved in the economics of
the environment is, in contrast, of relatively recent concern. Both
issues are interlinked but we can begin by looking at recent
developments in growth theory.
© 2004 Tony Cleaver

G R O W T H T H E O R Y
In a recent article (What do we know about economic growth? Or,
why don’t we know very much? by Kenny and Williams, in World
Development, 2001) two economists list what mainstream
economics has come up with to explain economic development
worldwide. In chronological order, from the 1940s up to the 1990s,
the key factors explaining growth have been: ‘physical capital,
human capital, policy reform, institutional reform and social devel-
opment’. They add that ‘a cynic might note that this list moves
from the relatively simple to overcome toward the impossible to
change (even more so if we take the story into the later 1990s and
add geographic factors).’ There is much theorising and debate
summarised in this pithy comment. Some of the key points are
drawn out below.
P h y s i c a l Ca p i t a l
Investment in capital goods has always been emphasised as essential
for economic growth. If a wheat farmer wants to increase produc-
tion next year he must save some seed from this year’s crop, plant it –
along with quantities of fertiliser, water and other inputs – and wait
for the following year to harvest the result. The more seed is saved
and not consumed but invested, the more future outputs can
increase. Seed capital is thus vital for growth.
The economic history of the Soviet Union shows the importance
of investment in physical capital. This nation grew to become a
world power after the debacle of the First World War due mainly to
the Stalinist system of ruthless central planning that devoted
increasing resources to building up capital goods in oil, iron and
steel, transport and communications, machine tools, defence, and so
on. (Rates of investment in the Soviet Union in the interwar years
were the highest in the world.) Individual civil rights were trampled
upon but enormous economic and military might was thus
constructed. Recognising this, mainstream economics in the post
Second World War era made capital accumulation central to its
growth models also. N
EOCLASSICAL GROWTH THEORY
, however, empha-
sises the free market (not central command) as the key allocating
© 2004 Tony Cleaver

mechanism. The decision whether to consume or invest resources
is thus dependent on market price signals, not on orders from
government.
Neoclassical theory assumes perfect competition, mobile
resources, fixed technology and prices determined in free markets.
An important constraint on economic growth in this simple model
is the fact that investment in capital is subject to the law of dimin-
ishing returns (see
Chapter 3
). For example, in the example given
earlier, a farmer cannot keep ploughing-in more and more seed on
his land every year and expect that outputs will grow in constant
proportion. Future outputs are instead likely to grow in smaller and
smaller increments (unless, of course, the farmer adopts some new
revolutionary technology – which for the time being we assume he
does not).
What determines the level of investment as opposed to
consumption in any given year? It all depends on market rates of
return. A business may decide to invest past profits in new capital
goods if the expected return from taking such a decision is greater
than any alternative. Alternatives in a market society include
distributing these profits to shareholders for their own consump-
tion, or the return that might be expected by placing these profits in
a bank. Note that if the rate of return anticipated on a new invest-
ment project is likely to be above the going rate of interest in the
financial markets, the entrepreneur is likely to back his investment.
The market rate of interest is a measure of how the economy as
a whole values future versus present funds. Suppose you loaned out
£100 for one year to a friend. What interest would you charge? If
you say you wanted £105 back in a year’s time you have just
expressed a
RATE OF TIME PREFERENCE
. That is, you have placed a price –
of 5 per cent per year – on time. If now you as a shareholder can
consume £100 today or can invest and receive, say, £110 in a year’s
time then you will opt for the latter. The rate of return on the
proposed investment is greater than the interest needed to persuade
you to wait. You will thus prefer more money in the future to the
lesser amount now.
Putting all these elements together in 1956, Nobel prize-winner
Robert Solow derived a theory of economic growth. Investment in
capital will take place so long as the rate of return on each project
envisaged is above the market rate of interest/rate of time preference.
Given an unchanging population growth rate, if capital stock grows
© 2004 Tony Cleaver
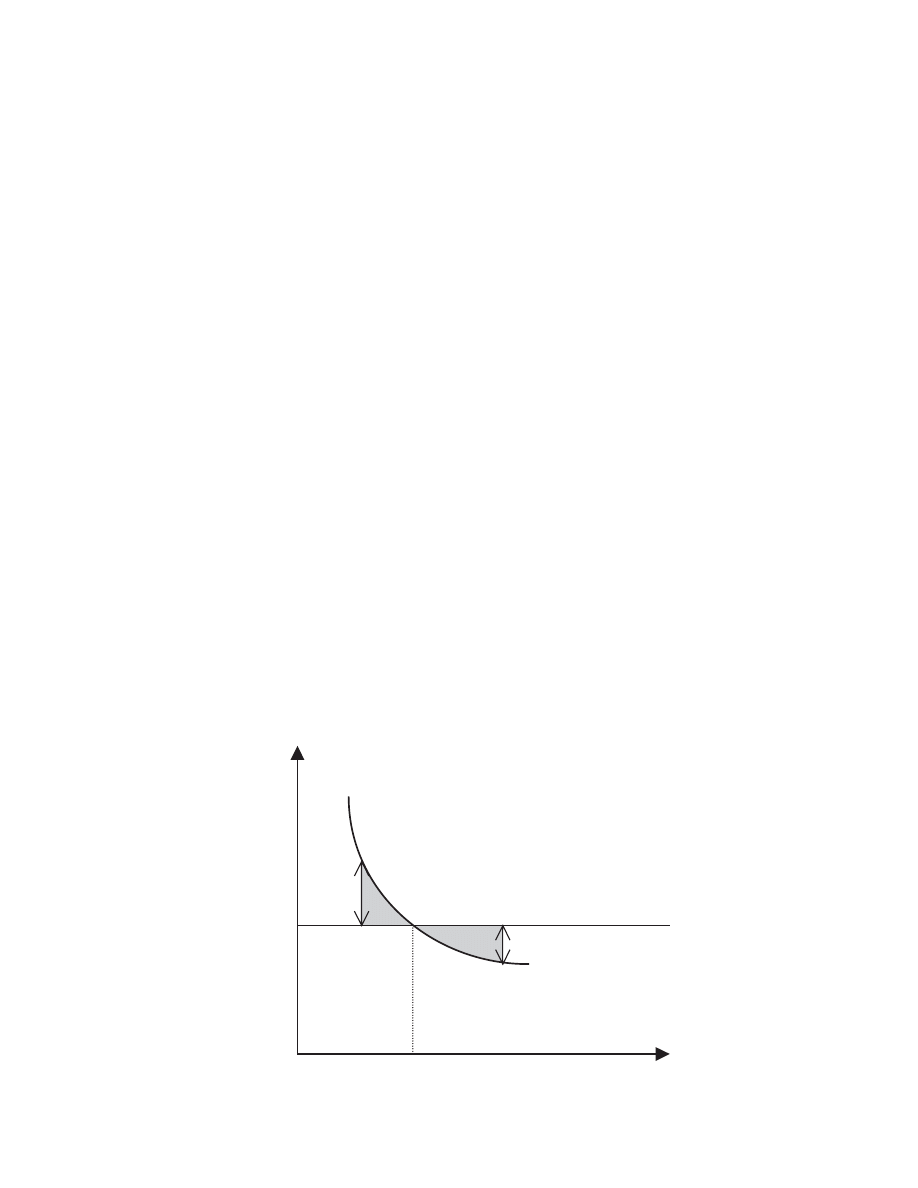
faster than the labour force then eventually the rate of return on
capital will fall as a result of diminishing returns. (As more and
more capital is employed for each person, the optimum ratio of
labour to capital is passed. Average productivity will fall.) The rate
of economic growth must slow down and eventually stop. There
must evolve a steady state where investment, and thus the stock of
capital, grows just fast enough to equal that needed to equip the
labour force. Faster than that means increasing capital stock, dimin-
ishing returns and thus a fall in investment. Slower than that, and
there will be higher than equilibrium returns, so investment will
increase – see Figure 7.1.
In Figure 7.1, the AP curve illustrates the diminishing returns to
capital, that is, the higher the level of capital per worker the lower is
its average productivity.
The market determines a rate of time preference equal to 5 per
cent per annum and thus the equilibrium quantity of capital per
person equal to k*.
If the capital stock is as yet insufficient to equip all the labour
force such that capital per person is less than k* then productivity
of capital will be above 5 per cent and investment will increase.
There will be positive growth in the economy. Conversely, if the
capital stock increases above k* then productivity will fall, invest-
ment will fall and the capital stock will eventually decrease as the
Growth/interest rate
AP: Average productivity
Positive
growth
5%
Rate of time preference
Negative
growth
0
k
*
Capital per person
Figure 7.1 Neoclassical growth theory.
© 2004 Tony Cleaver
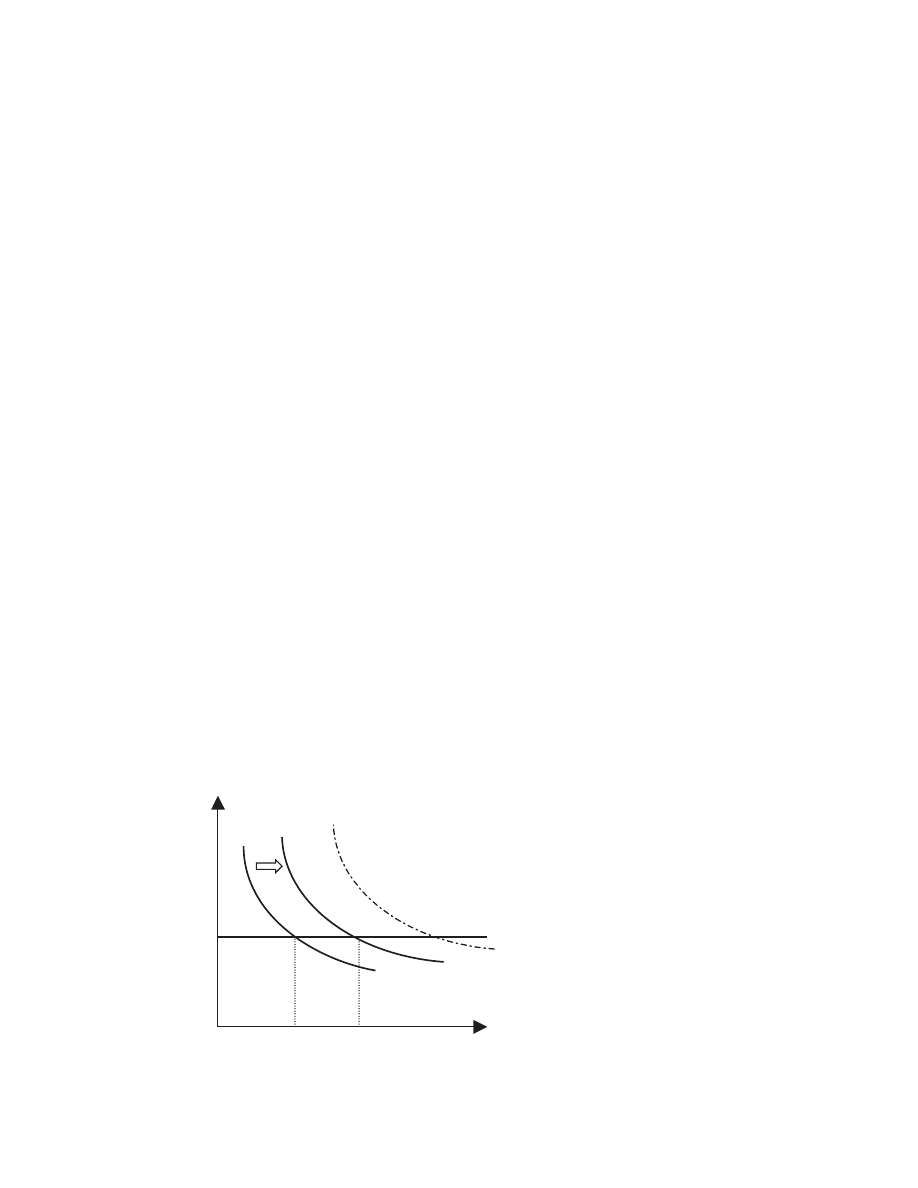
economy shrinks (negative growth). Eventually, the economy
evolves a steady state where the rate of growth of capital just equals
the rate of growth of the labour force such that capital per worker is
constant at k*.
The conclusion to neoclassical growth theory is therefore
pessimistic but consistent with the law of diminishing returns: if
capital and labour both grow at constant and equal rates, capital per
person must be constant and, since physical capital is the cause of
growth in the economy, income per head must remain constant.
That is, living standards can improve in the short run only – up until
capital per person has reached equilibrium value (k*). Thereafter,
living standards are condemned to stay the same. No further growth
is possible unless exogenous technological progress occurs.
Te c h n o l o g i c a l P r o g r e s s
What happens in the neoclassical model when technology does
change? A sudden revolutionary change can shift up the produc-
tivity of capital. The AP curve in
Figure 7.1
will thus shift to AP1 (see
Figure 7.2). Note that the downward sloping curve still remains –
diminishing returns to capital accumulation still operates – but now
the equilibrium capital per person will be arrived at point k**.
Standards of living have risen. A technological breakthrough in this
model causes a short-term boost in growth rates, only for the even-
tual result to be zero growth again (albeit at a higher income level).
Growth/interest rates
AP1
AP
AP2
5%
k
*
k
**
Figure 7.2 Exogenous technical change.
© 2004 Tony Cleaver

Thus with a one-off technical change, income per head will rise
to a new level and then remain constant again.
The only way that per capita incomes can continue growing,
according to this theory, is for technical change to keep happening;
for the stalemate of diminishing returns – where average product
equals the rate of time preference – to keep being postponed. Thus
AP shifts out from AP to AP1 to AP2 to AP3, and so on, and equi-
librium capital per person keeps moving from k* to k** to k***,
and so on.
Neoclassical theory predicts, therefore, that the only explanation
for long-run growth is technological progress (Box 7.1).
The late history of the Soviet Union seems to corroborate the
neoclassical claim that technical change is essential. In the last
decades of its life as a command economy, the USSR was faced
with declining economic growth. The nation had the highest
investment rates and the highest labour participation rates in the
world. More and more marginal lands were also devoted to
production of agriculture or industry but growth rates still
declined and, fatally, rates of productivity were stagnant. No
matter what innovations were tried, output per person and output
per capital both failed to rise. The command economy had
increased the quantity of inputs in production up to the limits of
full employment but the country could not increase the quality or
productivity of those inputs. It was thus condemned to suffer
diminishing returns. Advanced technology was employed in Soviet
military applications where its use could be strictly controlled but
the command system prevented its free deployment elsewhere. As
a result, the standard of living of the average Soviet citizen stag-
nated. There were queues for even the most basic of essentials
such as bread and meat. In the end it was the dissatisfaction of
ordinary people with their economic circumstances that brought
about the overthrow of central planning in the enormous
command empire that stretched from Berlin to Vladivostok.
Box 7.1 Technological progress and the Soviet Union
© 2004 Tony Cleaver

The problem with the neoclassical growth theory, of course, is that
it has no explanation for technical progress. Where does it come
from? In the earlier theories it is simply assumed to drop like
manna from heaven, yet this theory concludes that technology
is the only means to break the hold of diminishing returns.
Subsequent empirical studies showed that for countries such as
the US and other developed nations it was not so much physical
capital but increases in its quality,
TOTAL FACTOR PRODUCTIVITY
, that
accounted for a significant fraction of their modern economic growth.
How and why? More theorising was clearly called for.
E n d o g e n o u s G r o w t h T h e o r y
Solow’s neoclassical model led eventually to a growth theory that
was built upon, or endogenised, the process of technical change. If
growth spawns advances in technology and, in turn, such advances
are not subject to the principle of diminishing returns, then the
spread of technology will engender increased growth and this will
cause further technical change, ad infinitum. What might explain
such a chain reaction? In the 1980s, Paul Romer introduced just
such an
ENDOGENOUS GROWTH THEORY
by emphasising the roles of
ideas and of human capital.
Unlike most other economic goods, a profitable idea is non-
rivalrous. My use of this idea does not deny yours. For example, in
the agricultural revolution that first led to economic growth in the
UK in the eighteenth century, ideas like sowing seeds in straight
lines and rotating crops in fields represented a great breakthrough
in technology. So too was the invention of calculus; steam power;
flow line production; healthy diets; DNA; the Internet. Profitable
ideas like these may have taken years to evolve but they can be
copied quickly and without denying access to the original innovator.
One person or a thousand people can thus pursue a new technology
with no diminution in the productivity of the idea. That is, ideas are
not subject to diminishing returns.
Profitable ideas do not come like manna from heaven nor even
from a broad cross section of the population. They are themselves the
product of much education, training and active experimentation – the
accumulation of human capital. Primary and secondary education,
universities, research laboratories, media of mass communication all
© 2004 Tony Cleaver
need to be set up. As Thomas Edison said: genius is 1 per cent
inspiration and 99 per cent perspiration. True, there is an irreducibly
random element involved but there is nonetheless a lot that can be
done by investing in research and development if you want to
generate improved technological progress.
Romer’s growth theory makes the same starting assumptions as
the neoclassical model – competitive markets, flexible prices, mobile
resources – but not with respect to the returns to capital. As
explained, the productivity of ideas applied to industry – tech-
nology – will not lead to diminishing returns but instead to
constant returns to capital invested. Thus, in Figure 7.3, average
productivity does not fall as capital per person increases. And so
long as returns are higher than the rate of time preference, then
business will continue to invest and growth will continue to raise
incomes, engender more ideas, more technology, more growth and
on and . . .
S o c i a l Ca p i t a l
Endogenous growth theory gives a role to governments as well as
to markets. Although much investment in research and develop-
ment can be undertaken by private business concerns, it can only be
Growth/interest rates
AP
Average
productivity
5%
Rate of
time
preference
Capital per
person
Growth
Figure 7.3 Endogenous growth theory.
© 2004 Tony Cleaver

Pure public goods like national defence confer social benefits
that are non-excludable. They cannot be packaged, restricted in
supply and sold only to paying customers for a profit. (If I am
protected by my country’s armed services then so too is my
neighbour.)
MERIT GOODS
, such as education and health services,
are excludable (and thus can be provided to some by private
enterprise) but the social benefit in opening access to all is
judged to be so great as to warrant their public provision.
Formal education is an excludable merit good (schools can
decide which students to exclude or not) though it nonetheless
confers many external benefits on society. You and I benefit if we
both live in a community where everyone else is educated.
Primary and secondary education provided only by a market
system is likely to be highly inefficient and inequitable. Just a
minority would be able to afford private schooling and who
knows what talent would thus go undiscovered, uneducated?
How many potentially brilliant scientists, engineers, artists and
musicians escape the net in poor countries whose genius, if
cultivated, might otherwise transform these nations?
State provision of schooling is thus necessary, though expen-
sive. To produce one Einstein you have to educate millions at
primary level before a process of selection, much later, can iden-
tify the research abilities that can be employed at postgraduate
level.
Note that market allocation of educational services becomes
less inefficient, the more able it is to spot talent. The most pres-
tigious universities can pay for themselves in the private sector
since in their late teens and early twenties students can better
calculate whether or not they have a reasonable chance of
gaining the skills and career contacts from these institutions
that will enable them to earn high financial rewards. That is, at
this age, the private consumer can make a good guess that the
rate of return on his/her educational investment will, or will not,
be measurably above the rate of time preference.
Box 7.2 Private and social returns to education
© 2004 Tony Cleaver

based on the social capital that the public sector already provides
and it could not occur without it. Free markets fail to supply what
we know as
PUBLIC GOODS AND SERVICES
since there is no profit to be
had from so doing. Millions of people receive state primary and
secondary education because an educated populace confers external
benefit to society. For the same reason, the state builds transport
and communication networks of open access that facilitate the
mobility of resources. No independent business will educate all chil-
dren and provide roads for the entire nation since a private
enterprise cannot recoup this investment. But without basic educa-
tion and transport and communication services, how can the private
sector ever recruit the resources necessary to invest in technological
development? The state must provide the foundation upon which
the market can build (see
Box 7.2
).
Without the support of the state, therefore, technical progress
will be limited and insufficient to generate growth. But having
opened this Pandora’s box, Romer’s growth model cannot give
precise instructions as to what exactly must be done next. All sorts
of variables can impact on technological progress – for example,
should government allocate funds to basic research or should this
be left to the financial markets? Should infant technological indus-
tries be subsidised, and if so, for how long? Public officials might
find an excuse for all manner of government interventions. Where
do you draw the line?
Growth theories can go only so far. Reviewing the empirical
evidence helps to fill in the gaps in our knowledge and this has led
to an active debate over which precise policy recommendations are
important to stimulate growth.
P o l i c y R e f o r m s
Throughout this text, a number of instances have been quoted of
government successes and failures in framing economic policies.
Governments can protect infant industry or promote inefficiency;
can promote competition or promote corruption; can stimulate a
declining economy or stimulate inflation. Get the policies right and
sustainable growth is possible; get it all wrong and wild swings in
economic fortune result.
© 2004 Tony Cleaver

Chapter 4
describes the supply-side paradigm shift that captured
mainstream economic thought and policy-making in the 1970s
and 1980s. The early post-war, interventionist stance was rejected
in favour of a liberalising, privatising, free trade economic philos-
ophy, actively promulgated not only by academic economists but
also by institutions such as the IMF and World Bank – which had
the power to tie financial strings to such policy recommendations.
(see Box 7.3).
Cashew production in Mozambique has been an important
income earner for the country since Portuguese colonisation.
With independence in 1975 however, following the strategy of
many other developing countries, the incoming government
banned the export of raw cashew nuts as a measure to stimulate
the domestic packaging and processing industry.
Mainstream neoclassical economics disapproves of such
practice. A ban or export tax on raw materials depresses their
internal price and effectively subsidises the domestic proces-
sors. Cashew farming is discouraged and labour and capital are
drawn into urban industry which is protected and inefficient in
world terms. Urban employment and incomes are propped up
whilst poor farm incomes are depressed. That is what theory
dictates.
The World Bank became involved and insisted that (in a
country torn apart by civil war) if the Mozambique government
wanted to qualify for much needed World Bank and IMF finan-
cial support then it had to liberalise the cashew nut export trade
and reverse the trends outlined earlier. In spite of fierce opposi-
tion from the government and domestic industry, the World
Bank got its way. The ban on exports was removed in 1991/1992
and related tax restrictions were reduced from 60 per cent down
to 14 per cent in 1998/1999.
As a result, farm prices rose, raw cashew exports increased
and resources were pulled out of the domestic processing
Box 7.3 Cashew nuts in Mozambique: an example of World Bank
influence
© 2004 Tony Cleaver

industry. The benefits for the farmers were, however, very small
whilst the costs imposed on the infant packaging industry –
which went into steep decline – were substantial. Recent analysis
(published by the US National Bureau of Economic Research,
see following paragraph) shows that, so far as Mozambique’s
overall development was concerned, the World Bank got it
wrong.
Estimates have revealed that the extra income benefits
farmers stood to gain from liberalisation were probably ‘no
greater than . . . US$5.30 per year for the average cashew-
growing household’ and 50 per cent to 60 per cent of this gain
was anyway siphoned off by urban traders and middlemen. The
actual benefits were thus described as ‘puny’ compared to the
enforced unemployment of 11,000 processing-industry workers
in 2001. Neoclassical theory dictates that resources made redun-
dant in ‘inefficient’ industries that are forced out of business by
free trade should thus relocate in sectors in which the country
does possess a comparative advantage. But poor countries have
inefficient markets constrained by lack of transport, information,
and credit needed to aid the mobility of labour and capital.
Mozambique’s urban workers stayed unemployed.
Worse, the export trade in raw cashew turned out to be less
competitive, less beneficial than that for processed cashew.
(India is the dominant buyer – a monopsony – of raw cashew
and is thus able to keep its price, and Mozambique earnings,
down . . .) Had the government’s strategy of supporting an
infant industry been left to follow its course, therefore, the
nation’s overall earnings would certainly have been greater, and
dynamic gains would have been realised in domestic processing
technology and also in government economic management.
The real world is always more complicated than theory
presumes. The World Bank’s world view had been captured by
the ‘Washington Consensus’ – the policy paradigm of supply-
side economics – and this clouded its vision of what specific
measures were appropriate in a particular instance.
Source: McMillan, Rodrik and Welch (August 2002) ‘When Economic
Reform Goes Wrong: Cashews in Mozambique’ NBER Working Paper 9117.
© 2004 Tony Cleaver

There is no doubt that some developing countries’ policies have
been inflationary, destabilising and financially unsustainable. Others
have been protectionist, isolationist and anti-growth. Essential
reforms in some cases were necessary. But to insist on cutbacks
in all public spending, to tar all government intervention with the
same brush, is to fall foul of the fallacy that one extreme is better
than the other. The late 1980s and 1990s, in particular, has seen
the rise of a consistent challenge to the free market, neoclassical
paradigm.
N e w I n s t i t u t i o n a l E c o n o m i c s
It has been argued so far that economic growth cannot occur unless
investment takes place to create the capital goods necessary to
produce increased future outputs. Technological progress must also
occur to ensure that productive resources are liberated from the
constraints of diminishing returns.
Market economies use price signals to decide the pattern of
resources to be invested in capital but will need the hand of govern-
ment to provide support for technology.
In addition, sound macroeconomic policies that prevent inflation
and its distorting effect on the price mechanism, and policies to
guarantee free trade that give opportunities for all to participate in
wealth creation are equally held to be necessary conditions to
secure economic growth.
All these conditions taken together are still not, however, suffi-
cient to explain why some countries grow rich and others do not.
There is a growing consensus, particularly from economic histo-
rians who have taken a longer view of the process of development,
that the missing factor, the key explanatory variable that links all
these issues together is the presence or absence of stable social,
political and economic institutions.
In this argument, capital and technology are the product of
economic institutions that embody confidence in the future. Sound
government policies are similarly the product of sound, stable polit-
ical institutions. Secure property rights, legal systems, political
stability,
LAND REFORMS
and efficient capital markets, are amongst
those institutional features that facilitate economic growth and
development.
© 2004 Tony Cleaver

A country blessed with enormous natural resources (the Soviet
Union, Argentina) will make a mess of them if they have bad institu-
tions. Conversely, a nation with very few resources and/or starting
from a very disadvantageous situation (Singapore, Taiwan) can
nonetheless achieve rapid advance if it has good institutions. A
country with bad institutions will institute bad policies and be unable
to reverse them; whereas a country with good institutions may make
policy mistakes but will be able to recover and redesign them.
These are the views of an increasing number of different econo-
mists and historians who have studied the factors affecting the
economic development of a wide range of countries, past and
present. They include the very first, famous economist as well as
some recent Nobel prize-winners.
Adam Smith, the professor of moral philosophy of Glasgow
University in 1776 was well aware of the ethical foundations of a
market society. It was he who first emphasised that economic
growth takes place with increasing specialisation consequent upon
the expansion of markets. Trade can occur all over the world –
providing one party to a contract, trusts the other to keep their end
of the bargain. This emphasis has returned to modern economics in
a concern about transactions costs.
It is fascinating to see how different societies do business. One of
the problems of western tourists visiting developing countries, for
example in the Middle East or Latin America, is that many fail to
understand the culture of trade in these countries. In an Arab Souk
or bazaar, for example, there is much haggling – face-to-face trading
on a repetitive basis – over small transactions. A lot effort is thus
devoted to
CLIENTISATION
.
What you are in effect doing in these circumstances is estab-
lishing a personal relationship and reputation. In such societies,
reputation is everything. Other examples are on traditional caravan
trade in the Middle East, or in Native American culture, or in Mafia
trade – if you have the blessing of the local chief or sultan you go
with his protection and you can establish an efficient trade.
Similarly, the Latin American traditional method of doing business
is to go through the extended family – you rarely deal with
someone you do not know; you always go via family or personal
recommendation of someone whose reputation is recognised by
both parties.
© 2004 Tony Cleaver

What all these trades have in common is that they take place in an
environment where there is no over-arching rule of law – where
no dealer who is wrong has recourse to some authority that can
compensate him or her in full. Without such authority, the trader has
to bargain to establish his or her own rights. The essential economic
point to be made here is that the transaction costs involved in doing
business this way are excessive. Since trust in trade is established on
a personal basis, then market trade cannot develop very far. The cost
of doing transactions on this basis soon becomes prohibitive.
The contrast when people who are used to such personalised
dealings relocate in a wealthy market economy can be fascinating –
some are amazed at how trusting people can be in Western society.
To open a bank account, to buy a car or to make a deal and exchange
money over a telephone is so easy.
Highly specialised market societies can only operate if transac-
tions costs are minimised. We thus have elaborate systems of
monitoring and enforcing contracts that are embodied in law as
property rights. It is only because we possess such systems, that
transactions costs can be reduced and thus we can do business.
Property rights allow individuals in highly complex trading situ-
ations across space and through time to have the confidence to deal
with others of whom they have no personal knowledge, and with
whom they have no reciprocal and ongoing exchange relationship.
Even if you only deal such people once, you should be able to rely
on them just as much as if you were in daily contact and whether
they need your business or not.
Such trading is only possible if:
●
formal institutions exist to specify property rights and to enforce
contracts,
●
and
NORMS OF CONDUCT
exist to maintain the same confidence
where – even where authority exists – there are deficiencies in
measuring and enforcing compliance.
The importance of formal institutions (government) and informal
institutions (norms of behaviour) tend to be ignored by academics
of neoclassical persuasion who in the words of economic historian
Douglass North ‘persist in modelling government as nothing more
than a gigantic form of theft and income redistribution’.
© 2004 Tony Cleaver

Yet the key to growth and development is the same today as in
Adam Smith’s time – the increasing specialisation and development of
markets – which is absolutely dependent on a complex web of institu-
tions which run from measurable property rights to well-run legal
systems to incorruptible bureaucracies. There are vast differences in
the relative certainty of contract enforcement over time (empires have
grown and fallen according to the strength of their customs and laws)
and in space – between the developed and developing world.
It is argued that, without exception, countries grow slowest where
property rights are weak or absent, the rule of law is unreliable and
where governments are corrupt. In such cases the custom of trust
and respect between citizens breaks down, the costs of transacting
business soon becomes excessive and no great growth in trade
beyond personal contact is possible. In contrast, countries grow
fastest where these institutions are all in place and it becomes the
norm to abide by them (see Box 7.4).
Land in poor, agricultural economies is the main source of
wealth. Such societies tend to be feudal in organisation: where
ownership is concentrated in the hands of a few and peasant
labour is paid a low wage to till the fields and deliver the product
to the landlord. Quite apart from any injustice in such arrange-
ments, so long as labourers cannot earn the full reward for their
efforts, there is no incentive for those who do most of the work
to strive to be economically efficient. Both land and labour
productivity tends to be very low.
The Chinese communist revolution in 1949 was driven by a
sense of injustice to dispossess landlords and redistribute lands
in huge communes to be owned by ‘the People’s Republic’. In
this way, previously poor peasants were to be given altogether
greater access to wealth-creating land.
Agricultural production stagnated, however, despite all sorts
of efforts to inspire revolutionary zeal such as in the inappropri-
ately named ‘Great Leap Forward’. It was not until well after the
death of the communist leader Mao Tse Tung that China was
able to experiment with market incentives in the communes. In
Box 7.4 Institutional reform
© 2004 Tony Cleaver

G e o g r a p h y ?
One of the oldest and, curiously, most recent explanations for the
difference between rich and poor nations is alleged to be geography.
According to the traditional argument, tropical climates provoke debil-
itating diseases, inhibit agricultural productivity and militate against
hard work. Geographical reasons for poverty have been made for
centuries and on occasions they have been used to justify unsavoury
colonial, if not downright racist, attitudes. However distasteful they
may be, social scientists must nonetheless examine this old claim.
Recent research has in fact added a new twist to the story. There is
no denying that colonies of European settlement in temperate lati-
tudes have generally been more successful in achieving economic
growth than those established in the tropics. This is true, however, not
for the reasons given immediately above but because different geog-
raphy and climate has led to the establishment of different institutions
and it is these institutions which determine the pace of development.
Surveys have been undertaken of former colonies in different parts
of the world in order to control for a variety of factors. It is found that
where the death rate of settlers was high – typically due to diseases in
the tropics – the Europeans stayed away and set up institutions that
the 1980s, with the introduction of the Household Responsibility
System, individual households could lease their own land and
were able to keep or sell off any produce they made in excess of
official targets. As a result, farm production took off and China
has never looked back.
The moral of the tale is that where property rights are confined
to a few, or held in some collective ownership, then the majority
are denied access and incentive to utilise productive resources
efficiently. Give people entitlement to the fruits of their own
labour, however, and economic growth will result.
By this argument, land reform in agricultural societies,
privatisation and wide share ownership in industrial societies
and high levels of general education in knowledge societies are
all essential institutional reforms that promote growth and
development.
© 2004 Tony Cleaver

were designed to be extractive, using local or imported slave labour.
Whether it be mining precious resources (silver in Bolivia, diamonds
in South Africa) or farming in plantations (sugar in the West Indies,
rubber in Malaysia), the laws and institutions introduced were essen-
tially hierarchical – conveying economic and political power to a tiny
elite and denying any substantial rights to those below them in
society. Where geography and climate was agreeable to Europeans,
however, settler mortality was low and so colonists moved in, set up
property rights and democratic systems that devolved power,
promoted trade and generated growth. (The original inhabitants of
these temperate lands, it must be emphasised, generally lost out in
the face of this immigration. They had little say in what was to be
established in their homelands (see Box 7.5)).
Dances With Wolves (Orion Pictures, 1990), directed by and starring
Kevin Costner, is one of a long line of Hollywood Westerns that
depict the culture clash between native Americans and European
settlers. It only differs from its many predecessors in that it is
overtly supportive of the former in the dramatisation of the conflict
between a traditional society of nomadic hunter-gatherers and the
land-grabbing, modern market economy that overruns it.
The North American native experience was also shared by the
fate of aboriginal inhabitants of Argentina, South Africa and
Australia. Those not killed off by non-native diseases against which
they had little defence, were dispossessed of their communal lands
by immigrant settlers who recognised only private property rights –
established by their own laws and modern firearms. Removed from
the economic basis of their tribal societies, native populations
could not compete against the well-organised, economically and
militarily powerful newcomers who transferred the land they
acquired into alternative employments. US corn, Argentine beef,
South African gold and diamonds and Australian wool have since
been marketed around the world and enriched the lives of millions
of producers and consumers alike . . . though whether the ends
justified the means remains questionable to this day.
Box 7.5 Which is the Wild West?
© 2004 Tony Cleaver

An interesting illustration of this argument is the geographical
differences in institutions between the northern and southern states
of the USA. Types of farming, patterns of ownership, employment
and incomes in the more temperate climates contrast markedly
from those in the southern, plantation states where the nature of
society still bears the scars of its origins in slavery.
Geography in its own right, it should therefore be emphasised, is
not a good explanatory variable. Nor is colonialism, per se. Tropical
countries with good institutions can enjoy economic success (like
Singapore) – it is just that they have been the exception. The fact is
that even after the imperialists have gone, there are too few tropical
nations that have succeeded in throwing off their inheritance. Too
many countries with hierarchical social structures have still not
been able to change them, and remain saddled today with feudalistic
institutions that inhibit their advance. Those colonies established
with good, pro-growth institutions – typically but not always in
temperate zones – have meanwhile reaped the economic benefits
that have come with them.
C A N T H E P L A N E T A F F O R D I T ?
The population of China numbers 1.26 billion and for the last
twenty years or so it has enjoyed increasing economic growth that
has lifted the great majority of its people out of poverty. The wide-
spread introduction of market institutions and incentives has
transformed the former highly inefficient, centrally planned,
command economy into the latest, and biggest ‘Asian tiger’.
Although slower to introduce institutional reforms, India has
also shaken off some of its more restrictive economic shackles and,
with a population of 1.06 billion, it too has now found its way on a
steady path of economic growth that is beginning to bring
improved living standards to all.
The average annual growth rate for these two giant countries
(which together account for 40 per cent of the world’s population)
over the decade 1990–2000 was, in the case of China, 10.3 per cent
and, in the case of India, 6.0 per cent. This compares to a world
average of 2.6 per cent per year (an average, of course, pushed up by
these two outliers).
© 2004 Tony Cleaver

These statistics represent a steady improvement in the fortunes
of billions of lives and must accordingly be celebrated. The question
to ask, however, is can this trend be sustained?
The environmental pressure group, WWF, calculates how much of
the Earth’s resources are consumed to provide for its population. The
ECOLOGICAL FOOTPRINT
measures the total area of productive land or
sea necessary to produce the food, materials, energy and living space
currently used to provide for one person in each different country.
The results are given in Figure 7.4: the vertical axis registering the
hectares of land required per capita and the horizontal axis measuring
the relative population sizes for the respective continents.
As can be seen, the average North American citizen consumes
nearly ten times the resources of the average African or Asian indi-
vidual. Note, however, the numbers of those who consume least
greatly exceed those who consume most. What will happen there-
fore, if current Chinese and Indian growth rates are maintained,
and every Asian eventually gets to drive around in cars of the size
and gas-guzzling capacity of the average North American? The
column for Asia/Africa in Figure 7.4 will grow in size to the height
of the others. If this were to happen then the planet will be devoid
of resources and polluted with waste!
Quite clearly, this brief example shows that future populations
cannot enjoy the wasteful lifestyles practised at present by the
world’s richest. The heavy ecological footprints left on the earth
today by Americans and Europeans would devastate the natural
Hectares per capita
Ecological footprints
10
8
6
Western Europe
4
2
0
Asia/Africa
Population
North America
Figure 7.4 Hectares of land needed per capita to support consumption in
different continents, against population, 2000.
Sources: WWF, World Bank.
© 2004 Tony Cleaver

environment and exhaust the planet if repeated by future billions in
the rest of the world.
There seems to be even more injustice for the developing world
implied in this prediction. Just as soon as these countries seem to be
on the way to implement the institutions and policies to produce
growth, so the finite resources of the Earth will hold them back –
thanks to the profligate behaviour of those who got there first. Is this
really true? Would the replication of current North American
consumption patterns in developing countries impoverish the planet?
Fortunately for us all, that is unlikely to happen. The major reason
for this – despite some of the scariest scenarios painted by a few envi-
ronmentalists – is the operation of the free market. To explain how
markets can assist in protecting scarce resources we can take one
important example as an illustration: the supply of oil reserves.
In 1972, in a famous publication by a number of authors referred
to as the Club of Rome, The Limits to Growth (by D. H. Meadows
et al.) set out a pessimistic scenario where the world was destined to
run out of oil and other essential, exhaustible resources by the year
2000. World economic growth was thus destined to come to a full stop.
Evidently this has not happened. People can still fill up their cars
at the local petrol station with no restriction. Growth rates of the
wealthier consumer nations are still positive and the newly indus-
trialising countries are growing even faster. What went wrong with
the calculations?
Based on US patterns of oil consumption in 1972, if all other
nations as they grew richer emulated such practice then there is no
doubt that there would be much less oil left in the ground today.
Maybe world growth would have stopped. Similarly, if all Asia
tomorrow drives the US cars of today, then world economic growth
might indeed come to an end. But, of course, the problem of basing
predictions on current practice is that this assumes future behav-
iour will not change . . . and it always does. That is the fascination
of economics – it is a social science and people, unlike phenomena
in the ‘hard sciences’, are capable of choice and change.
Free markets, in particular, provide powerful incentives for people
to alter their consumption and production habits. Consider the
implications of continuing high demand for oil.
If the rate of world consumption continues to grow steadily, or
even accelerate, such that existing oil resources become depleted
then, in the open market, prices would rise – slowly at first but at
© 2004 Tony Cleaver

an increasing rate also, as supplies reduce. The effect of this price
rise is twofold: it immediately puts a brake on demand and it simul-
taneously increases the profitability of oil production.
Demand is affected in two ways. Some people may reduce their
consumption directly where possible (they may take fewer car jour-
neys). They will also seek out alternatives. Since oil is a basic
energy source, immediate change is unlikely but so long as the
price rise is sustained then consumers (in private homes and in
industry) will find ways to economise and will seek out alternatives
in the longer term – other forms of transport, other forms of
heating, and so on (see Box 7.6).
The major consumer of oil is transport. But consider what has
happened over the last 30 years or so to the technology involved
in producing the internal combustion engine. Because oil is
expensive, car engines today are far more efficient in their
consumption of fuel (and far less polluting) than they were in
1972. The cars that Asia buys tomorrow will certainly not be
anything like those Americans use today. Americans will not buy
today’s cars tomorrow either. In fact, if the price of oil does rise
much further then fuel cell technology (which produces energy
from water!) will receive yet another impetus. The big car multi-
nationals have already produced the prototype motors – they are
currently racing to try and get prices down and engine perform-
ances up. Their future profits depend upon it.
Imagine now if there is a breakthrough in fuel cell technology.
What would happen to oil prices? They would fall dramatically –
signalling much less demand than supply – and oil companies
and OPEC oil producers would stand to lose much income. The
fact that this threat is real is driving the producers to look for
alternative sources of income. The ‘oil majors’ have diversified
and are now more energy companies than oil companies these
days and the OPEC countries are urgently attempting to develop
other industries. Their worried actions are the clearest possible
indication that oil resources in future will not be exhausted and
put a limit to world growth.
Box 7.6 The motor car
© 2004 Tony Cleaver

Supply also responds to price changes. More exploration and
development will take place since anticipated future profits are a
spur to action. Oil reserves in diverse locations previously though
uneconomic to exploit now become profitable to do so. For example,
US and Canadian oil shales (rock formations that contain diffuse
organic matter within them) are still too technologically difficult
to exploit at present, but, if oil prices rise continuously then this
enormous resource may well one day be pressed into service.
The price mechanism is thus a sophisticated device that works to
economise on scarce resources. What are prices? Nothing more nor
less than an instant indication of relative scarcity. The fact that the
real price of oil today (corrected for a fall in the value of money) is
lower than it was in the late 1970s is an indication that oil is now
less scarce than it was. It changes in the daily or
SPOT MARKET
in
response to fluctuations in current demand and supply – and it will
continue to rise and fall in the future in response to the variety of
factors that impact on this (currently) important resource.
M a r k e t Fa i l u r e
If all Earth’s resources were marketed in the way described, then we
would have a fully automatic environmental protection system
already in place. We could all rest assured that there is no environ-
mental crisis. It has been argued consistently throughout this book,
however, that free markets frequently fail. The hand of government
is needed to adjust the price mechanism since markets do not factor
in to their signals all the many important influences that profoundly
concern people and the environment.
We have seen throughout this text a number of instances, where
markets fail to organise a society’s resources efficiently:
●
Where there are substantial externalities – where any individual
consumption or production decision impacts significantly on
third parties (see
Chapter 1
and further later).
●
Where there is a lack of information for consumers to exercise
efficient choices.
●
Where there is a need for pure public goods yet there is no
incentive for their private production (see earlier in this chapter).
© 2004 Tony Cleaver

●
Where economies of scale lead to monopoly or oligopoly and the
erosion of the public’s interest (see
Chapter 3
).
●
Where the sum of society’s choices add up to a level of aggregate
demand inconsistent with the level of aggregate supply (see
Chapter 4
).
The first two points are particularly relevant to environmental
economics.
E X T E R N A L I T I E S
Certain basic resources we depend upon – like the air we breathe –
are free goods. They are not marketed, are commercially costless
to utilise and carry no price. Economics predicts, therefore, that
consumption will rise up to the point where the marginal utility
equals price. That is, we will consume as much air as we want with
no limit up to the point where the usefulness of an extra breath is
zero. (That happens when we die!)
Since there is no economic restriction on the consumption of the
atmosphere, so air and road traffic will burn its oxygen and spill out
poisonous emissions with no market penalty. Farmers, logging
companies and crazy arsonists will burn off natural vegetation as
they so wish. Levels of carbon dioxide in the atmosphere will
continue to rise. If the market cannot reign in such practice, govern-
ment must – or we will be condemned to live (and die) with the
consequences of global warming, acid rain, climate change and all
the other effects of atmospheric pollution.
Such external costs to society are not included in market prices.
Neither producers of cars, or food, nor consumers of these goods,
pay directly for the costs imposed on society of excessive oxygen
consumption-hence the argument for governments to impose a
carbon tax to restore a ‘market’ incentive to economise on this
otherwise free good.
It is a good idea in theory. The problem is trying to calculate the
appropriate level of tax. Exactly how much oxygen is consumed by
farmers, car drivers, everyone else who burns anything? And even
if you could calculate the damage done by each individual consumer
or producer, how then do you charge them? Governments must
struggle with this conundrum.
© 2004 Tony Cleaver

If we could get the answer right, it would internalise in the price
of each good, or service all the external costs (and benefits). Markets
can thus operate efficient price signals. Unfortunately, the task is
immense: externalities are everywhere. How do you account for all
the possible environmental impacts that may exist with every
production and consumption decision?
I M P E R F E C T I N F O R M A T I O N
This last point pervades all environmental concerns. Exactly how
much damage are we doing to the environment in the course of our
everyday choices? Discharging aerosol cans and disposing of old
refrigerators, we now learn, releases CFC gases that harm the ozone
layer. Had we known earlier we might not have done this. No doubt
all sorts of other practices carry environmental consequences too.
First, we need to know of the damage we are doing to the planet and
second, we must also be able to place a monetary value on this data
for comparative purposes.
We can only adjust our collective behaviour on the basis of reli-
able information. This requires that those who speak out against the
wasteful excesses of economic growth do so with responsibility.
The essence of economics is opportunity cost: making intelligent
trade-offs where every option carries a price. For example, those
protesting about the construction of the Three Dams hydro-electric
power project in China ought to contrast the (undoubtedly serious)
environmental costs involved against the proposed benefits of
increased energy supplies to a poor population and the removal of
the threat of floods that have drowned millions in the past. Have
such protestors fully measured and valued the costs and benefits
concerned?
The Economist magazine reports that it comes as a shock to
discover just how little reliable information there is on the environ-
ment. Look at almost any scientific investigation and you get a
different picture. One scare story follows another in the popular
press but a balanced overview is impossible since, especially for the
larger concerns such as global climate change, comprehensive data
is not available. Environmental audits at present underway on
numerous proposed ventures are undoubtedly steps in the right
direction, but the road is infinitely long.
© 2004 Tony Cleaver

C
OST
-
BENEFIT ANALYSIS
is a form of educated guesswork at placing
monetary values on impacts that we know of. (It includes, in the
example earlier, attempting to measure the value of human life and
quantifying the reduced risk of drowning. There are sophisticated
procedures to follow; though they are not flawless.) But how do you
measure the value of environmental consequences that scientists
are at present only barely aware of?
Public officials designated to compile reports on these issues
must proceed with caution since in many cases environmental
impacts are long term, difficult to foresee but often irreversible, past
a certain crisis point. Issues are also frequently clouded by political
concerns. In the end, we have no choice other than to work with
uncertainty.
S U S TA I N A B L E D E V E L O P M E N T
A key concept for environmentalists is sustainable development;
defined as meeting the needs of present populations without
compromising the needs of future generations. This is a worthy
ideal. It is nonetheless difficult to achieve if we cannot measure envi-
ronmental costs and benefits accurately – although it is an important
principle that can give rise to valuable guidelines for practical policy.
All economic development is based to some extent on the
exploitation of natural resources. These include non-renewable
environmental assets such as fossil fuels, renewable resources such
as fish stocks and wildlife, and certain borderline assets that are
capable of regeneration though with a certain loss of uniqueness,
such as rainforests.
To insist that no exploitation of Earth’s rich bounty should take
place for fear of dispossessing future generations is nonsensical.
Living standards would collapse and there would then be no further
generations created to enjoy the future. The question, as always
in economics, is what price is acceptable in trading-off present
exploitation for the future? Paying too high a price to protect
the environment means condemning present populations – and
unborn future generations – to low levels of consumption and hard-
ship; too low a price means depriving our children of the
environmental opportunities we ourselves inherited. It is a matter
of
INTERGENERATIONAL EQUITY
.
© 2004 Tony Cleaver

E x h a u s t i b l e R e s o u r c e s
Depletion of some non-renewable assets is inevitable if present
living standards are to rise and embrace millions more of the
world’s poor. As technologies improve, humankind can be more
efficient in its use of Middle Eastern oil and South American rain-
forests, and alternatives can be increasingly generated, but there is
no ultimate substitute in the end for using some form of mineral,
exhaustible resource to fuel economic progress.
The loss of existing natural resources can be compensated for
to some extent by replacing them with man-made ones. Unique
native forests in much of the Earth’s temperate lands, for
example, have been largely replaced by agricultural landscapes
and plantations that are capable of much greater economic
outputs and yet are not environmentally impoverished. Similarly,
there may well be less coal, oil and iron ore left for the future
but maybe we can camouflage the holes we have left in the
ground and replace these supplies with more renewable energies
and materials.
If, however, we are bound to consume exhaustible resources by
some irreducible amount – albeit less in the future than at present –
what then is the
OPTIMAL DEPLETION RATE
of such assets that
balances present against future needs?
Consider an exhaustible resource that is a basic raw material
used in industry. If current extraction increases faster than demand
is growing, prices of this resource will fall. Conversely, if it is left in
the ground while current demand is mounting, prices will rise.
Should we mine it now or later, and by how much? It depends
on how we value the future – a concept we have met earlier –
embodied in our rate of time preference.
At equilibrium, the rate of growth of mineral resource prices
should just equal the market rate of time preference/rate of
interest. If interest rates are lower than the rate of growth of
mineral prices, we exploit and sell more resources now – bringing
their price down (see
Box 7.7
). If the prices are growing more
slowly than interest rates, then exploitation of resources will fall.
Prices will begin to rise faster. (As explained earlier, changes in
technology will impact on the rate of growth of prices and thus
slow down or speed up the rate of resource extraction accordingly.)
© 2004 Tony Cleaver

R e n e w a b l e R e s o u r c e s
The rate at which we can safely run down fish and animal stocks,
harvest timber and use fresh water reserves depends on their natural
regeneration rates. These differ for different species. Rabbits repro-
duce faster than rhinoceroses and can accordingly be hunted more.
Bamboo grows faster than oak. The costs of harvesting are impor-
tant too. The further and more expensive it is to travel to cut down
timber, or fish for disappearing stocks, will have to be compared
against the revenues gained from selling the scarce supplies.
Note that extinction becomes an imminent danger where:
●
property rights are ill defined (see
Box 7.8
),
●
the costs of harvesting are low,
●
the prices and revenues from selling scarce resources are high,
●
stocks have fallen to a
CRITICAL MINIMUM SIZE
for natural regen-
eration and,
●
people involved place little value on the future loss of the asset
concerned.
All these conditions are met, for example, in those African big game
parks where poachers are unlikely to be caught and their targets are
Suppose oil prices were rising at a rate of 12 per cent per year as
supplies cannot keep pace with demand. Suppose, however, that
the market values the future at 5 per cent. That is, invest 100
now and you will earn 105 next year.
Clearly you have an incentive to buy oil now and sell it in a year’s
time – you would make 12 per cent rather than 5 per cent that way.
With fast rising oil prices, there would be a surge of interest in
developing oil reserves and increasing supplies. This increased
rate of exploitation would eventually bring prices down, and the
rate of growth of oil prices would fall until eventually it equalled
5 per cent. There would be no incentive to increase exploitation
and drive down the rate of price increase below this.
Box 7.7 Depletion rates: an example
© 2004 Tony Cleaver

easy to identify. The same scenario obtains where certain large
wildlife species have nowhere to hide and are competing for habitat
with poor people (see
Box 1.3
, p. 15). The safety of your children
has a higher priority than the freedom to roam of tigers or wild
elephants in these circumstances.
M A R K E T S A N D G O V E R N M E N T
Economic development need not be at the expense of the planet if
we get our policies right. If market prices do not reflect substantial
environmental costs in the sale of certain goods and services then
taxes can be imposed to bring their production and consumption
in line with sustainable limits. Exploitation of common property
can be reduced by allocating property rights where possible and
by active policing wherever not. North Atlantic cod and African
elephants need not go the way of the Dodo.
Governments can use the ingenuity and efficiency of markets.
For example, given agreement on the amount of pollution reduction
Common property, by definition, belongs to everyone. No one
user has a strong incentive to conserve it, therefore. History
shows that, as populations rise, village pasture that is open to all
local farmers tends to be exhausted by the first ones to place
their livestock upon it. ‘Use it or lose it’ is the maxim.
The same principle applies to native forests, fish and wildlife
stocks, underground reservoirs of fresh water and oil – indeed
wherever there is a common resource and access is open to all.
Stocks of North Atlantic cod, for example, have been reduced
almost to their point of no return where there has been open
competition between rival nations’ fishing fleets – except in the
case of Iceland’s territorial waters. Where Icelandic waters are
concerned there has been a conservation policy observed and
enforced and cod stocks are healthy as a result. Where there is a
lack of international agreement, however, and property rights are
absent or weakly enforced, then excessive exploitation will take
place. That is the ‘tragedy of the commons’.
Box 7.8 The tragedy of the commons
© 2004 Tony Cleaver

that must be achieved by a certain date, different countries (or
regions within a country) can trade
POLLUTION PERMITS
between
themselves to determine who does what. If zone A finds it more
expensive to make cutbacks than zone B then A can pay B to do
more than its share of greenery. So long as there is agreement all
round and targets are met, then everyone gains.
Humankind’s ingenuity is the only resource that is not in short
supply and shows no sign of reaching exhaustion. Although there
are problems, scientists and economists can come together and
calculate the costs and benefits of each and every practice that
seems to threaten the environment and make their recommenda-
tions accordingly. The political will to apply our energies to safeguard
the future is hard to come by, but successes like the Montreal
Protocol in 1987 – which agreed to phase out the production of
CFCs and protect the ozone layer – show that, however difficult,
international accord is possible.
I finish on a note of caution, however. The poor world cannot
wait. Some countries are already growing fast and others are
desperate to follow in their footsteps. Having waited so long and
watched how others have enjoyed the fruits of the planet without
them, poor people naturally have a high preference to get rich
quick and may discount the effects on the environment quite
highly. Populations in temperate lands who have dammed their
rivers, consumed their native forests and burned off their coal
reserves in the course of industrialisation may be rudely received
if they protest about developing countries doing the same. If people
in the developed world want others to ease up on their exploitation
of the planet they will have to pay them to do so. That is the market
solution.
Summary
• The wealth of nations is derived from trade with expanding markets.
A country can only benefit from such trade, however, if it first has in
place the social, economic and political institutions that reduce
transactions costs and give people confidence that agreements will be
honoured over time and through space.
© 2004 Tony Cleaver

F U R T H E R R E A D I N G
A good first reference for economic growth theory is given
by Hall, C. I. (2002) Introduction to Economic Growth,
W.W. Norton & Co.
There is no general consensus on the nature and content of devel-
opment economics but an excellent book of readings is given by
Meier, G. M. and Rauch, J. E. (2000) Leading Issues in Economic
Development, Oxford University Press.
Particular insights into new institutional economics can be found in
North, D. (1994) ‘Economic Performance Through Time’, American
Economic Review, Vol. 84, pp. 359–68 and Hernando de Soto (2000)
The Mystery of Capital, Basic Books.
For a very readable account of research on institutions, geography
and growth, see ‘Tropics, Germs and Crops: How Endownents influ-
ence Economic Development’ by Easterly and Levine (2002):
http://www.nber.org/papers/w9106
Environmental economics can be appraised in either of two books
of the same name by Field, B. C. (2002) McGraw-Hill, and also
in Turner, R. K., Pearce, D. and Bateman, I. (1994) Harvester
Wheatsheaf.
• People will invest in the future if risks can be reliably calculated and
the rewards are judged sufficient. Capital can thus be accumulated
and technology can be employed to postpone the onset of diminishing
returns.
• As economic growth occurs, external environmental costs are likely
to be incurred. So long as these costs can be quantified, however,
and governments can adjust market prices and practices accordingly,
then a fine balance between present and future needs can be struck.
• Markets can and should be employed to determine the equilibrium
price that balances these contrasting, and ever-changing, needs – in
this way we
can reduce poverty and protect the environment.
© 2004 Tony Cleaver

G L O S S A R Y
A
BSOLUTE ADVANTAGE
Where one country is more efficient than
another in the production of a common range of goods and
services. (Contrast with
COMPARATIVE ADVANTAGE
.)
A
DMINISTERED PRICES
Prices of goods and services fixed by plan-
ners according to political or social considerations and they are
not, therefore, automatically responsive to economic shortage
or surplus. (See
BLACK MARKET
and
NATIONAL HEALTH SERVICE
.)
A
DMINISTRATIVE GUIDANCE
The East Asian model of development
where government, via industry and workers’ representatives,
has led industrial strategy and economic growth.
A
GGREGATE
DEMAND
All spending within the economy that
contributes towards national income:
CONSUMPTION
,
INVESTMENT
,
government spending, exports less imports.
A
GGREGATE SUPPLY
The total supply of all goods and services in
an economy, less exports plus imports. (See also
GENERAL
EQUILIBRIUM
.)
A
LLOCATION OF RESOURCES
How land, labour, capital and enterprise
are distributed between various employments.
B
ALANCE OF PAYMENTS
The record of a country’s payments in
international trade. The import and export of goods (trade
balance) and services (invisible balance) is included in the
current balance. The international movement of investment,
and speculative, funds is listed on the capital account. The
current and capital accounts taken together sum to indicate the
total currency flow.
© 2004 Tony Cleaver

B
ANK DEPOSITS
Money listed in people’s bank accounts – most of
which exists as a matter of record only and has no physical
form but which nonetheless acts as a medium of exchange and
is transferable via cheque or plastic card.
B
ARRIERS TO ENTRY
The cost incurred by a firm in entering a new
market and competing with existing suppliers.
B
ARTER
The exchange of goods and services in payment for other
goods and services.
B
LACK MARKET
Wherever scarce resources have an exchange value
greater than that assigned to them by officialdom then an
illegal, or black market will tend to appear.
B
RAIN DRAIN
The flow of highly skilled personnel out of a country
in pursuit of employment elsewhere.
B
RAND
The unique identity given to a product by its producer.
B
UDGET
A record of income and expenditure over a given time
period. The Budget is a reference to the government’s annual
financial record.
B
UDGET CONSTRAINT
The limits imposed by a finite income upon
a consumer, producer or public administrator.
C
APITAL
A man-made means of production.
C
APITAL INTENSIVE PRODUCTION
Where more capital than labour is
employed in production.
C
APITAL
/
LABOUR SUBSTITUTABILITY
How costly it is for capital to be
substituted for labour, or vice versa.
C
APITAL STOCK
A stock of assets that is capable of producing a flow
of goods or services over time. Note that the stock of
CAPITAL
can be fixed or variable as output changes. (See also
LIQUID
CAPITAL
and
INVESTMENT
.)
C
ARTEL
Firms that act in deliberate
COLLUSION
to avoid competi-
tion and thereby rig the market for their mutual benefit at the
expense of the consumer. (See
OLIGOPOLY
.)
C
ENTRAL BANK
The hub of a country’s financial system which acts
as banker to the government and to all recognised
FINANCIAL
INTERMEDIARIES
; it issues the domestic currency; it conducts the
government’s monetary policy and it monitors a nation’s finan-
cial affairs.
C
ENTRAL PLANNING
An economic system where the
ALLOCATION
OF
RESOURCES
is decided by some central committee of
administrators.
© 2004 Tony Cleaver

C
LIENTISATION
The process by which buyers and sellers bargain
with each other and thereby establish trustworthiness – typically
in circumstances where there is no overarching rule of law to
protect either party in case of default.
C
OLLATERAL
Some recognised asset offered by the borrower to
secure a loan.
C
OLLUSION
The action, usually of a
CARTEL
, of conspiring against
consumers to increase prices, revenues and profits. Such action is
normally illegal, unlike tacit collusion – which refers to an
unspoken, unwritten mutual understanding between oligopolists
not to actively compete.
C
OMMAND ECONOMY
An economy where all decisions about what,
how and for whom goods and services are to be produced are
communicated to subordinates via command.
C
OMMON AGRICULTURAL POLICY
The European Union’s costly
system of supporting agriculture.
C
OMPARATIVE ADVANTAGE
Where a country may be inefficient in
producing a range of goods and services but has a relative cost
advantage in specialising in the production of one, or a few,
only. (Contrast with
ABSOLUTE ADVANTAGE
.)
C
ONSUMER EQUILIBRIUM
That pattern of purchases which maximises
a consumer’s utility, given existing prices and incomes.
C
ONSUMER SOVEREIGNTY
How in an ideal market system, by the
pattern of their purchases, consumers determine what, how and
for whom goods and services are to be produced.
C
ONSUMPTION
The sum of a nation’s consumer spending on goods
and services.
C
OST
-
BENEFIT ANALYSIS
The comparison of all costs and benefits
(including
EXTERNALITIES
) which determines whether or not a
given course of action should be recommended.
C
OSTS OF PRODUCTION
Costs internal to a firm incurred in the
business of production. Fixed costs do not change as output
changes; unlike variable costs which do change. Fixed plus vari-
able costs equal total costs. Total costs divided by the number of
units produced equal average or unit costs. The increase in total
costs brought about by the increase in production of one extra
unit is defined as marginal cost.
C
RITICAL MINIMUM SIZE
The smallest viable population of a
threatened species.
© 2004 Tony Cleaver

D
EBT
-
EQUITY SWAPS
The sale of shares in domestic industry to
(typically foreign) investors in return for their agreement to
pay a given proportion of accompanying debt.
D
EFICIT
Expenditure exceeding income. (Contrast
SURPLUS
.)
D
EFLATION
1. A period of falling prices and incomes. 2. A process
of adjusting records to remove the distorting effects of
INFLA
-
TION
over the period under study.
D
EMAND
The quantity of a good or service consumers are willing
to purchase at a given price.
D
EMAND
-
DEFICIENT UNEMPLOYMENT
Resources that are unemployed
because of a lack of
AGGREGATE DEMAND
. Sometimes known as
Keynesian or cyclical unemployment.
D
EMAND MANAGEMENT
The attempt by government to adjust a
country’s level of
AGGREGATE DEMAND
by spending more when
such demand is low and less when demand is high.
D
EPRECIATION
1. The reduction in the value of a capital asset due to
wear and tear in production. 2. The fall in value of one currency
in exchange for others in international trade. (See
DEVALUATION
.)
D
ERIVED DEMAND
The
DEMAND
for any resource is derived from its
ability to produce.
D
EVALUATION
The reduction in the official value of a currency, a
term now indistinguishable from
DEPRECIATION
.
D
IMINISHING MARGINAL UTILITY
The decreasing additional satisfac-
tion one derives from consuming an extra item. ‘The more you
have of something, the less you want more of it’.
D
IMINISHING RETURNS
,
THE LAW OF
This refers to how, when other
resources remain fixed, increasing the employment of just one
factor causes output to increase – but in steadily diminishing
amounts. (Contrast with returns to scale.)
D
ISCOUNT RATE
1. The base
INTEREST RATE
offered by the
CENTRAL
BANK
. 2. The rate used to calculate the present value of some
future income.
D
ISTRIBUTION EFFECTS
The impact on the division of national
income between rich and poor.
D
IVIDENDS
The return distributed out of
PROFITS
to a company’s
ordinary shareholders – not to be confused with interest, which
is paid to creditors whether a business makes a profit or not.
E
COLOGICAL FOOTPRINT
The environmental resources it takes to
maintain an individual in his/her current lifestyle.
© 2004 Tony Cleaver

E
CONOMIC IMPERIALISM
The economic influence exerted by rich
nations, or
MULTINATIONAL CORPORATIONS
, over poorer coun-
tries’ consumption and/or production decisions.
E
CONOMIES AND DISECONOMIES OF SCALE
See
RETURNS TO SCALE
.
E
FFICIENCY
A production technique is X-efficient if it meets
the required standards at minimal cost. Such a technical defini-
tion of efficiency, however, does not indicate whether or not the
resource in question is optimally employed. Allocative effi-
ciency requires not only that each individual resource is giving
its best but also that no redeployment can lead to any improve-
ment in overall output.
E
LASTICITY
Price-elasticity measures the responsiveness of
demand, or supply, to a change in the price of a good. Income-
elasticity of demand measures the responsiveness of demand to
a change in consumer incomes. Cross-price-elasticity of supply
measures how quickly producers can switch resources to
produce an alternative which has now increased in price.
E
NDOGENOUS GROWTH THEORY
Devised by Paul Romer to explain
how economic growth generates technological change which
generates further growth, and more change, etc.
E
QUILIBRIUM PRICE
That price which evolves in a free
MARKET
to
equate
DEMAND
with
SUPPLY
.
E
QUITY
1. An equitable arrangement is that which is considered
socially just, or fair. (This may or may not be economically
efficient.) 2. Ordinary shares in a
JOINT STOCK COMPANY
.
E
XCHANGE RATE
The price of one currency in terms of another.
E
XHAUSTIBLE RESOURCES
Finite, non-reproducible, environmental
assets.
E
XOGENOUS
CHANGE
The variation of some factor assumed
constant in the model being considered.
E
XPECTATIONS
The view that agents possess of future changes in
economic variables – such that it influences current behaviour.
E
XPECTATIONS
-
AUGMENTED PHILLIPS CURVE
The assertion that there
is no
TRADE
-
OFF
between
INFLATION
and unemployment; that
any level of inflation can obtain at the
NATURAL LEVEL OF UNEM
-
PLOYMENT
if money demand so facilitates this.
E
XTERNALITIES
costs or benefits experienced by individuals or
firms other than those directly engaged in the market produc-
tion or consumption of a commodity. (See
SOCIAL COSTS
.)
© 2004 Tony Cleaver

F
ALLACY OF COMPOSITION
The erroneous belief that what holds
true for one action also holds true of all actions aggregated
together.
F
IAT MONEY
A form of money of little
INTRINSIC VALUE
and whose
worth is derived solely from the authority of the
CENTRAL BANK
.
F
INANCIAL INSTRUMENT
A written claim to some asset, such as a
promise to pay a certain sum at a future date, which itself can
be bought and sold.
F
INANCIAL
INTERMEDIARIES
Profit-making commercial banks,
finance houses and money dealers that act in the money
markets to match lending and borrowing.
F
ISCAL POLICY
The policy of governments with respect to levying
taxes and spending revenues.
F
OREIGN EXCHANGE MARKETS
Markets where foreign currencies are
bought and sold and
EXCHANGE RATES
determined.
F
RACTIONAL RESERVE BANKING
The practice of modern banks
whereby they create credit by some multiple of their retained
reserves. (See
MONEY MULTIPLIER
and
RESERVE ASSETS RATIO
.)
F
RANCHISE
Where a business supplies much of its own capital and
labour and contracts producer and marketing support to supply
a branded product, for which it pays a royalty.
F
REE GOODS
An asset which can be consumed for free. Typically,
a market does not exist for its exchange and the determination
of a price. As a result, its consumption, use and abuse might
proceed unchecked unless some means can be found to prevent
over-exploitation.
G
ENERAL EQUILIBRIUM
The simultaneous balance of all markets
in an economy and of
AGGREGATE DEMAND
with
AGGREGATE
SUPPLY
.
G
OLD STANDARD
Where all currencies are convertible into gold at
a fixed price.
G
ROSS DOMESTIC PRODUCT
(GDP) Everything a country produces
in a given year. Used as a close approximation of national
income, though note that some GDP of country A represents
income to citizens of country B, and vice versa.
H
AGGLING
The process of bargaining to determine an
EQUILIBRIUM
PRICE
that satisfies both buyer and seller.
H
UMAN
CAPITAL
The acquisition of skills that increases the
PRODUCTIVITY
of labour.
© 2004 Tony Cleaver

H
YPERINFLATION
An extreme form of
INFLATION
where the
percentage rate of increase in prices is measured in hundreds or
thousands.
H
YSTERESIS
The claim that high levels of unemployment lead to an
economy becoming stuck that way: workers lose skills and apti-
tudes and cannot easily re-enter employment even if
AGGREGATE
DEMAND
picks up. (A tenet of
NEW KEYNESIAN ECONOMICS
.)
I
NDIFFERENCE CURVES
Lines drawn on a diagram joining points of
equal consumer utility derived in the consumption of varying
combinations of two goods or services.
I
NFANT INDUSTRIES
A newly established industry, not yet grown to
its
OPTIMUM SIZE
.
I
NFLATION
The rate of increase in the general level of prices.
(See also
DEFLATION
.)
I
NFORMAL SECTOR
That part of a developing country’s economy that
functions without recognition, protection or official approval. An
unregulated market of small-scale native enterprise catering for
domestic, low income consumers and producers.
I
NFORMATION COSTS
Markets cannot function efficiently without
all relevant information concerning the trade in question being
made available to the parties involved. The extent of the
market through time and space for any given trade is in effect
determined by the information costs involved. (See also
TRANS
-
ACTION COSTS
.)
I
NFRASTRUCTURE
The
PUBLIC
and
MERIT GOODS
and services needed
to support industry – transport facilities, water, electricity
supplies, etc.
I
NJECTIONS
Money injected into an economy’s circular flow of
income via
INVESTMENT
, government spending and export
spending. (See
LEAKAGES
, also
MULTIPLIER
.)
I
NTEGRATION
The combination of businesses. Horizontal integration
is where a firm grows by joining with others performing
the same process in production (such as two bottling plants
becoming one) whereas vertical integration is where one firm
joins with another performing a different process in the stage
of production (such as a bottling plant joining with a transport
company). Lateral integration is where two firms performing
unrelated processes join together (such as a bottling plant with
a cement factory).
© 2004 Tony Cleaver

I
NTEREST RATE
This is the reward for investing capital. It is typically
paid at an annual rate for the use of productive services that a
stock of capital supplies and it will be higher the riskier the
INVESTMENT
. (See
CAPITAL STOCK
, also
RATE OF TIME PREFERENCE
.)
I
NTERGENERATIONAL
EQUITY
Equality of treatment between
generations. Intergenerational equity is best served if
exploitation of a finite resource proceeds at a rate inversely
proportional to its rising value. (See
OPTIMAL DEPLETION RATE
.)
I
NTRINSIC VALUE
The value of something in terms of the direct
utility it provides to the consumer, as opposed to its officially
declared value or
ADMINISTERED PRICE
.
I
NVESTMENT
The creation of new productive resources.
J-
CURVE
The way that total currency flow tends to decline and
then recover over time, consequent to a
DEVALUATION
.
J
OINT STOCK COMPANY
A business created by many owners jointly
pledging capital – each owner being liable for only the share
he/she has contributed.
J
UNK BOND
A
FINANCIAL INSTRUMENT
which carries a higher risk
(and a higher return) than those issued by the government or
the most recognised and secure commercial banks.
K
EYNESIAN ECONOMICS
The argument of John Maynard Keynes
and followers which claims that
AGGREGATE DEMAND
need not
equal
AGGREGATE SUPPLY
at a level sufficient to generate full
employment and therefore that
GENERAL EQUILIBRIUM
may not
be secured by the untrammelled forces of free markets.
L
AND REFORM
A redistribution of land ownership to benefit the
poor and, ideally, to increase agricultural outputs.
L
EAKAGES
Withdrawals from the circular flow of income of an
economy due to
SAVINGS
, taxation or import spending.
(Contrast
INJECTIONS
.)
L
ENDER OF LAST RESORT
This is an important function (and source
of influence) of the
CENTRAL BANK
– to lend money to recog-
nised
FINANCIAL INTERMEDIARIES
if they are caught short of cash.
L
IBERALISATION
The freeing up of markets by the removal of
controls, regulations and other impediments to the flexible
movement of prices, and of the entry and exit of economic
agents. (See also
SUPPLY
-
SIDE POLICIES
.)
L
IQUID ASSET
The ease at which a physical or financial asset can be
sold off and converted into money. Cash is 100 per cent liquid.
© 2004 Tony Cleaver

Assets which can only be sold quickly at a greatly reduced price
are illiquid.
L
IQUID CAPITAL
Money which is available for investment purposes.
L
IQUIDITY PREFERENCE
The
DEMAND
for money, in preference to
some income-earning asset.
L
ONG TERM
The time period in which all costs can vary and all
relationships originally assumed fixed can change.
L
OW
-
LEVEL EQUILIBRIUM TRAP
Where income and expenditure is
balanced at very low levels but there is no potential for incomes
to grow (typically because people cannot afford to save and
invest).
M
ACROECONOMICS
The economic theory of levels of
AGGREGATE
DEMAND
and
SUPPLY
,
GENERAL EQUILIBRIUM
and disequilibrium.
(Contrast
MICROECONOMICS
.)
M
AQUILADORES
Mexican assembly plants set up close to the US
border.
M
ARGINAL PROPENSITY TO CONSUME
/
SAVE
The fraction of the last
unit of income earned that is spent/saved. Given an increase in
income of £100, what percentage would you spend, and which
save?
M
ARGINAL TAX RATES
The rate of tax paid on the last unit of
income earned by an individual.
M
ARKET
An arrangement where buyers and sellers can trade and
determine
EQUILIBRIUM PRICES
.
M
ARKET FAILURE
The inability of a market to equate
DEMAND
with
SUPPLY
and avoid waste or hardship. (See
INFORMATION COSTS
and
TRANSACTIONS COSTS
.)
M
EDIUM OF EXCHANGE
Any money which acts to facilitate trade.
M
ERCANTILISM
The view that one country’s wealth should be
secured at the expense of another’s, if necessary.
M
ERIT GOODS
Goods and services (such as schools, hospitals)
provided on a limited scale by private businesses but which
convey substantial external benefits such that society may
choose to supply them nationally via public enterprise.
(Contrast with
PUBLIC GOODS
.)
M
ICRO
-
CREDIT
The provision of small loans to small-scale enterprise.
M
ICROECONOMICS
The economic theory of individual market
DEMAND
and
SUPPLY
, and partial equilibrium. (Contrast
MACRO
-
ECONOMICS
.)
© 2004 Tony Cleaver

M
IS
-
MATCH UNEMPLOYMENT
Where those people looking for work
do not possess the skills and abilities required for the jobs avail-
able. Otherwise known as structural unemployment.
M
OBILITY
Flexible markets which respond to changing
CONSUMER
SOVEREIGNTY
are only possible if resources are occupationally
and geographically mobile.
M
ONETARIST
The assertion that an increase in money supply is
the only cause of inflation.
M
ONETARY BASE
The reserves which act as the support for the
creation of a country’s money supply. (See
FRACTIONAL RESERVE
BANKING
.)
M
ONEY MULTIPLIER
Where an increase in
FINANCIAL INTERMEDIARIES
’
reserves by one unit can be used to support an increase in loans
by some multiple. (See
RESERVE ASSETS RATIO
.)
M
ONOPOLY
A single, large producer that dominates the market so
that consumers can only buy from this source or go without,
since they have no alternative supplier.
M
ONOPSONY
A single large buyer that dominates the market.
Suppliers can sell only to this outlet and have no other choice.
M
ULTINATIONAL CORPORATIONS
Commercial enterprises operating
in a number of different countries – the biggest with interna-
tional share-ownership, employment and management.
M
ULTIPLIER
The ratio by which an initial
INJECTION
is multiplied to
equal the overall income flow generated – hence investment
multiplier and foreign trade multiplier. (Not to be confused
with the
MONEY MULTIPLIER
.)
N
ATIONAL DEBT
The outstanding debt that a country’s government
owes to its citizens.
N
ATIONAL HEALTH SERVICE
The UK national supplier of health
services.
N
ATIONALISED INDUSTRIES
Former private sector industry that has
been taken over by the state and maintained under public
ownership for political, social or strategic reasons.
N
ATURAL LEVEL OF UNEMPLOYMENT
The level of unemployment
that remains when all labour markets are in equilibrium. Those
not employed are those allegedly not wanting work at the
going wage rates.
N
EOCLASSICAL ECONOMICS
Modern mainstream economic theory
that is built upon the classical writings of the founders of
© 2004 Tony Cleaver

economics. It emphasises the supremacy of flexible
MARKETS
and
GENERAL EQUILIBRIUM
and recommends limits to govern-
ment intervention. (See
SUPPLY
-
SIDE POLICIES
.)
N
EOCLASSICAL GROWTH THEORY
Based on neoclassical assumptions
of flexible
MARKETS
, this theory predicts that growth based on
increasing
CAPITAL
accumulation will slow down without
exogenous improvements in
TOTAL FACTOR PRODUCTIVITY
.
N
EW CLASSICAL ECONOMICS
An extreme form of
NEOCLASSICAL
ECONOMICS
which asserts that
MARKETS
can clear instantly if
people act according to rational
EXPECTATIONS
and are not frus-
trated by government intervention.
N
EW INSTITUTIONAL ECONOMICS
A restatement of the importance
of institutions, and the limitations of
NEOCLASSICAL ECONOMICS
,
in explaining market systems and the causes of economic
growth and development.
N
EW KEYNESIAN ECONOMICS
A modern school of thought that
asserts that there is no unique
NATURAL LEVEL OF UNEMPLOY
-
MENT
. Following K
EYNESIAN ECONOMICS
, it is argued that a low
level of
AGGREGATE DEMAND
will cause unemployment to rise,
with market forces being insufficient to restore
GENERAL EQUI
-
LIBRIUM
. (See
HYSTERESIS
.)
N
OMINAL INCOME
Income in money terms (which must fall as
prices rise). Similarly, the
NOMINAL RATE OF INTEREST
is that
which is quoted before correction for
INFLATION
.
N
ON
-
PRICE COMPETITION
A situation, typically in
OLIGOPOLY
, where
businesses find it too risky to alter the price of their products in
competition with rivals and thus prefer to compete in terms of
advertising, marketing gimmicks and other less provocative
promotions.
N
ORMATIVE
ECONOMICS
The offer of value judgements and
personal recommendations in the subject matter of economics.
N
ORMS
OF
CONDUCT
Informal but economically productive
customs which regulate and facilitate trade in the absence of
central authority.
O
LIGOPOLY
A
MARKET
dominated by a few large producers, each
keenly aware of the actions of the others.
O
PEN MARKET OPERATIONS
The dealings of the central bank –
buying and selling
FINANCIAL INSTRUMENTS
in the money
markets.
© 2004 Tony Cleaver

O
PPORTUNITY COST
All economic goods or services have an
opportunity cost – that is, the decision to pursue one course of
action means going without the opportunity to pursue the next
best alternative. Note that where there is no opportunity cost
involved, there is no need to economise.
O
PPORTUNITY SET
The choices of goods and services available for a
consumer to purchase, given his/her income and ruling prices.
O
PTIMAL DEPLETION RATE
The rate of exploitation of an asset that
minimises its environmental impact and balances present
against future needs. (See
INTERGENERATIONAL EQUITY
.)
O
PTIMUM SIZE OF FIRM
That level of production where the firm is
most efficient: where average costs are minimised. (This may
not be at the most profitable level of output.)
O
VERHEADS
The fixed costs of production.
P
ARADIGM
The conventional worldview, or set of beliefs that
inform general scientific opinion.
P
ARADOX OF THRIFT
The disconcerting finding that if everyone
saves in an economy, everyone becomes worse off as national
income falls. (See
FALLACY OF COMPOSITION
.)
P
ATENT
An exclusive government license to supply a given product.
P
ERFECT COMPETITION
A
MARKET
where no one producer is influen-
tial enough to determine the price of the product traded –
typically because there are no
BARRIERS TO ENTRY
to prevent
competition.
P
HILLIPS CURVE
The empirical finding, published in 1958, that unem-
ployment decreased as wage inflation increased. (See
TRADE
-
OFF
.)
P
OLLUTION PERMITS
A scheme which allows different consumers/
firms/countries to trade their respective responsibilities in
reaching an overall pollution target.
P
OSITIVE ECONOMICS
Economics that attempts to be objectively
scientific in providing testable propositions.
P
RICE MECHANISM
The way that changing prices automatically
organise the
ALLOCATION OF RESOURCES
in a market economy:
signalling shortages and surpluses, giving incentive for resources
to switch employments and equating demand with supply.
P
RIVATISATION
The return to private ownership of state-owned or
NATIONALISED INDUSTRIES
.
P
RODUCTIVITY
The ratio between outputs and inputs.
P
ROFITS
This is the reward for enterprise – the payment to entre-
preneurs for organising production and taking the risks
© 2004 Tony Cleaver

involved. Normal profit is defined as that minimum level of
reward required to keep an entrepreneur in business; any level
of profits above that is a form of producer surplus that can be
called abnormal profit or monopoly profit. See also
TRANSFER
EARNINGS
and economic
RENT
.
P
ROPERTY RIGHTS
For successful exchange to take place in modern
market systems, it requires that clear, unequivocal, private
property rights exist so that what is mine and what is yours
can be established without dispute. This extends not only to
material goods but also to unique ideas and intellectual prop-
erty rights. (A tenet of
NEW INSTITUTIONAL ECONOMICS
.)
P
UBLIC GOODS
Goods and services – such as national defence or
urban street lighting – that convey sizeable external benefits
but which cannot be supplied on a restricted basis to paying
customers only and thus will not be produced by private enter-
prise. (Contrast with
MERIT GOODS
.) Pure public goods are
non-rivalrous (my consumption of this service does not reduce
its availability to others) and non-excludable (if supplied to me
it is simultaneously supplied to my neighbour).
Q
UALITIES OF MONEY
Those characteristics a commodity must
possess if it is to function as a form of money – prime amongst
which is acceptability.
Q
UASI MARKET
A simulated market, usually of a public service,
where at least one of the following conditions are absent:
private ownership of resources, consumer choice, a market
price, producer competition.
Q
UOTAS
A fixed limit on the number of imports.
R
ATE OF TIME PREFERENCE
The price paid on time: how much the
market will compensate an owner for postponing his use of
risk-less capital. (Contrast
INTEREST RATE
.)
R
EAL INCOME
What your money or
NOMINAL
income can buy in
real goods and services. Similarly, the real rate of interest is the
return you can expect after inflation is accounted for.
R
ECESSION
A slow down or fall in the rate of growth of an
economy. An imprecise and less alarmist term than slump or
depression.
R
ENEWABLE RESOURCES
Environmental assets reproducible within
an economic time-frame.
R
ENT
1. Commonly used to refer to the payment for land or prop-
erty. 2. A surplus payment above that economically necessary.
© 2004 Tony Cleaver

R
ENT
-
SEEKING
The action of economic agents to seek government
favours, especially lucrative
MONOPOLY
licences, to restrict
competition.
R
ESERVE ASSETS RATIO
The ratio of reserves to loans that
FINANCIAL
INTERMEDIARIES
have created. (See
FRACTIONAL RESERVE BANKING
,
MONETARY BASE
and
MONEY MULTIPLIER
.)
R
ETURNS TO SCALE
How revenues perform in comparison to costs
as the size of a business increases. If total revenues increase
faster than total costs as all input and outputs expand then this
represents increasing returns to scale (also known as
ECONOMIES OF SCALE
). If revenues and costs expand at the same
rate, this implies constant returns to scale. If total revenue
increase more slowly than total cost as production increases
then this represents decreasing returns to scale (also known as
diseconomies of scale). (Contrast with
DIMINISHING RETURNS
.)
R
EVENUE
Earnings from sales. Total revenue equals the number of
goods sold, times their price. Average revenue equals total
revenue divided by number of goods sold (it thus equals price).
Marginal revenue is the addition to total revenue caused by the
sale of one extra unit.
S
ACRIFICE RATIO
How much unemployment must be sacrificed
to ensure a reduction in
INFLATION
. (See
PHILLIPS CURVE
and
TRADE
-
OFF
.)
S
AMPLE BASKET
A sample of everyday consumer purchases which is
used to calculate the rate of change of prices, that is,
INFLATION
.
S
AVINGS
Income that is not spent.
S
HIFTS IN DEMAND
/
SUPPLY
The movement of a demand/supply
curve caused by a change in some factor other than the price of
the good in question.
S
HORT TERM
The time period in which at least one factor under
consideration does not change.
S
IGHT DEPOSITS
Those
BANK DEPOSITS
(e.g. current accounts) which
can be withdrawn on sight.
S
OCIAL COSTS
External costs imposed on society in the process of
producing or consuming goods and services.
S
PECULATIVE MOTIVE
The demand for money for its use in financial
speculation.
S
POT MARKET
A market where goods or services are traded for
immediate (as opposed to future) delivery.
© 2004 Tony Cleaver

S
UPPLY
The quantity of a good or service producers are willing to
supply at a given price.
S
UPPLY
-
SIDE POLICIES
are those designed to increase efficiency of
AGGREGATE SUPPLY
. They include
LIBERALISATION
, deregulation,
PRIVATISATION
and reducing government spending and budget
deficits. (See
NEOCLASSICAL ECONOMICS
.)
S
URPLUS
Income exceeding expenditure. (Contrast
DEFICIT
.)
S
USTAINABLE DEVELOPMENT
Economic development that attempts
to conserve the environment such that it provides for both
current and future needs.
T
ARIFFS
Taxes placed on imports.
T
ECHNOLOGICAL UNEMPLOYMENT
People losing their jobs due to
some new technology making their skills redundant.
T
ECHNOLOGY TRANSFER
The passing of management or technical
know-how from pioneering firms/industries/countries to those
following.
T
IME DEPOSITS
Those
BANK DEPOSITS
(e.g. savings accounts) where
notice must be given before they can be withdrawn without
penalty.
T
OTAL FACTOR PRODUCTIVITY
The overall increase in
PRODUCTIVITY
of a number of resources which is not directly attributable to
any specific one.
T
RADE
-
OFF
Where gaining one outcome is only possible by
sacrificing an equal and opposite alternative. The price one has
to pay in trading off one for the other. Minimising this price
means minimising the
OPPORTUNITY COST
.
T
RADITION
Social custom. A form of organisation that relies on
precedent, which is resistant to change but which lends stability
and certainty to any society.
T
RAGEDY OF THE COMMONS
The degradation of a communal
resource since no one user has a vested and exclusive interest in
its protection.
T
RANSACTION COSTS
The cost of bringing buyers into contact with
sellers and facilitating trade. Where these costs are high,
markets will be small, underdeveloped, inefficient or unable to
function. (See
MARKET FAILURE
.)
T
RANSFER EARNINGS
The level of earnings required to keep a
resource in its present employment.
U
TILITY
Level of satisfaction.
© 2004 Tony Cleaver

W
AGES
The reward for labour.
W
ASHINGTON CONSENSUS
A term used to describe the
NEOCLASSICAL
,
pro-market,
SUPPLY
-
SIDE
POLICIES
actively promoted by
Washington institutions such as the International Monetary
Fund and the World Bank, amongst others.
W
ORLD TRADE ORGANISATION
The body responsible for negotiating
common rules in international commerce, with the intention of
reducing barriers and promoting free trade.
© 2004 Tony Cleaver
Wyszukiwarka
Podobne podstrony:
0415320186 Routledge Management The Basics Aug 2004
the best of 2004 www prezentacje org
F General government expenditure and revenue in the UE in 2004
Anthropology the Basics
Manga How to draw the Basics 1
(Routledge Classics) Bertrand Russell Power A New Social Analysis Routledge (2004)
H A Guerber Legends of the Middle Ages (2004)
Valerie M Hope Death and Disease in the Ancient City (2004)
Roland The Basics of Modern Recording
Quick Study Chart Medical Terminology, the Basics C Linton (BarCharts, 2005) WW
The Basics of Financial Mathematics Bass 2003
VX Reversing I, the basics
Modern Economy of Japan Year 2004
Barry McLoughlin, Kevin McDermott Stalin s Terror, High Politics and Mass Repression in the Soviet
The Human Equation (2004)
więcej podobnych podstron