
2539
[Journal of Business, 2006, vol. 79, no. 5]
2006 by The University of Chicago. All rights reserved.
0021-9398/2006/7905-0009$10.00
Sonya Seongyeon Lim
DePaul University
Do Investors Integrate Losses and
Segregate Gains? Mental
Accounting and Investor Trading
Decisions*
I.
Introduction
Recent studies have argued that prospect theory (Kah-
neman and Tversky 1979) and mental accounting
(Thaler 1985) provide possible explanations for in-
vestor behavior (e.g., the disposition effect) and for
outstanding asset pricing anomalies such as the equity
premium puzzle, the value premium, and the momen-
tum effect.
1
However, there are relatively few empir-
ical tests on whether and to what extent mental
* I thank an anonymous referee, Hal Arkes, Natasha Burns, Wer-
ner DeBondt, Anand Goel, Bing Han, Danling Jiang, Shane John-
son, Alok Kumar, Juhani Linnainmaa, Terrance Odean, Kelley Pace,
Carrie Pan, John Persons, Chip Ryan, Meir Statman, Rene´ Stulz,
Ju¨ergen Symanzik, Siew Hong Teoh, Ingrid Werner, and seminar
participants at CUNY-Baruch, DePaul University, Drexel Univer-
sity, HKUST, Louisiana State University, National University of
Singapore, Ohio State University, Queen’s University, SUNY-Buf-
falo, University of Georgia, University of Virginia–McIntire, and
the Society for Judgment and Decision Making annual meetings in
Minneapolis, for helpful comments. I am especially grateful to Da-
vid Hirshleifer for his encouragement, many insightful comments,
and help with the data. I thank the National Science Foundation
(SES-033905) for financial support. All remaining errors are mine.
Contact the author at slim1@depaul.edu.
1. On the disposition effect, e.g., see Shefrin and Statman (1985),
Ferris, Haugen, and Makhija (1988), Odean (1998), Locke and
Mann (2000), Weber and Camerer (2000), Genesove and Mayer
(2001), Grinblatt and Keloharju (2001b), Shapira and Venezia
(2001), Dhar and Zhu (2002); on the equity premium puzzle, the
value premium, and the momentum effect, see, e.g., Benartzi and
Thaler (1995), Barberis and Huang (2001), Barberis, Huang, and
Santos (2001), Grinblatt and Han (forthcoming).
I test whether investors’
trading decisions are in-
fluenced by their prefer-
ences for framing gains
and losses. I find that in-
vestors are more likely to
bundle sales of losers
than sales of winners on
the same day, consistent
with the hedonic editing
hypothesis (Thaler 1985)
that individuals prefer in-
tegrating losses and seg-
regating gains. In addi-
tion, the extent to which
mixed sales of winners
and losers are consistent
with the hedonic editing
hypothesis is greater than
what would be expected
under random sales of
stocks. These results sug-
gest that mental account-
ing is likely to play a
significant role in inves-
tors’ trading decisions.

2540
Journal of Business
accounting affects investor decisions. This article tests the effects of mental
accounting on investor trading decisions, which provides more direct insight
into whether the joint implications of mental accounting and prospect theory
provide plausible explanations for capital market anomalies.
In prospect theory, individuals evaluate outcomes using an S-shaped value
function. The value function is defined over gains and losses and shows
diminishing sensitivity to both gains and losses. Mental accounting concerns
the way investors evaluate outcomes using the value function. For example,
whether investors evaluate the overall outcome or evaluate each outcome
separately is a question of mental accounting. Diminishing sensitivity of the
value function implies that individuals attain higher utility by evaluating losses
together and gains separately. If investors try to evaluate outcomes in whatever
way makes them happiest, they prefer integrating losses and segregating gains
(the hedonic editing hypothesis; Thaler 1985).
Choices over the timing of events are likely to reflect preferences for in-
tegrating or segregating outcomes (e.g., Thaler and Johnson 1990): integration
is easier if events occur on the same day, and segregation is easier if events
occur on different days. If so, people prefer to have events occur on the same
day if integration is desired. Similarly, people prefer to have events occur on
different days if segregation is desired. When investors sell stocks, they choose
whether to realize gains and losses together or separately. Therefore, stock
sales by investors provide a natural setting to test the hedonic editing hy-
pothesis. We can infer investors’ preferences for framing gains and losses by
examining how they time the gains and losses from stocks sales.
Using the trading records of individual investors at a large discount bro-
kerage house during 1991–96, I document that investors are more likely to
bundle sales of stocks that are trading below their purchase prices (“losers”)
on the same day than sales of stocks that are trading above their purchase
prices (“winners”). Selling losers on the same day makes it easier for investors
to aggregate their losses, and selling winners on different days makes it easier
to segregate their gains. Therefore, investors’ selling behavior observed in
this study can be interpreted as a consequence of their preferences for mentally
aggregating or segregating events, preferences that are driven by their desire
to perceive outcomes in more favorable ways.
I consider possible alternative explanations for why losers are more likely
to be sold on the same day than winners. Tax-loss selling strategies imple-
mented near the end of the year, for example, may induce clustering of loss
selling. Margin calls can trigger sales of multiple stocks that are likely to be
losers. It is possible that investors have more losers than winners in their
portfolios, increasing the chance of selling multiple losers than of selling
multiple winners. Since the dollar value of a loser is likely to be smaller than
the dollar value of a winner, an investor who has a fixed proceeds target may
need to sell multiple losers, while selling one winner could suffice. Losers in
a portfolio might be more correlated with each other than winners and therefore

Investor Losses and Gains
2541
more likely to be sold together due to greater commonality. Good-till-cancel
limit orders may take longer than a day to be executed, and investors’ greater
use of limit orders for winners than for losers can spread out sales of winners
relative to sales of losers. I examine these alternative hypotheses in univariate
tests and also in multivariate tests. Some of the alternative stories provide a
significant explanatory power but do not fully account for investors’ tendency
to realize multiple losses than gains on the same day.
As an alternative testing approach, the probability of multiple stock sales
is modeled under the assumption that the selling decision of each stock is
independent. Under this assumption, the probability of multiple stock sales
increases with the number of winners and with the number of losers in the
portfolio, and the impact of an additional winner (loser) on the probability of
multiple stock sales increases with the investor’s propensity to sell a winner
(loser). Studies have documented that investors’ propensity to sell a winner
is greater than their propensity to sell a loser (the disposition effect). If so,
the impact of an additional winner on the probability of multiple stock sales
should be larger than that of an additional loser if selling decisions are in-
dependent. However, the result shows that the effect of an additional loser on
the probability of multiple stock sales is much larger than the effect of an
additional winner, opposite of what is expected when sales decisions are
independent and investors show disposition effect. Thus, this evidence sug-
gests that selling decisions of losers are more positively correlated than selling
decisions of winners.
For mixed outcomes of gains and losses, the hedonic editing hypothesis
predicts individuals prefer integrating them unless the gain is very small
relative to the loss. I find that the extent to which investors combine the
sales of winners and losers in a way consistent with the hypothesis is greater
than what we would expect if investors randomly chose which gains and
losses to realize.
The contributions of this article can be summarized as follows. First, it
develops testable hypotheses on investor trading behavior from the hedonic
editing hypothesis (Thaler 1985) and provides evidence that investors’ stock
selling decisions are consistent with the implications of prospect theory and
mental accounting. A growing body of theoretical models are based on as-
sumptions derived from psychological findings. However, as Hirshleifer
(2001) points out, it is often not obvious how to translate preexisting evidence
from psychological experiments into assumptions about investors in real fi-
nancial settings (Hirshleifer 2001, 1577). This study tries to fill this gap by
developing and testing a prediction from psychological theories on the be-
havior of market participants. Second, it complements recent studies on in-
dividual investor trading decisions, most of which have examined the trading
decisions for each stock separately.
2
In contrast, this article examines how
2. For example, Odean (1998, 1999), Barber and Odean (2000, 2002, 2005), Grinblatt and

2542
Journal of Business
selling decisions for multiple stocks interact with each other, even in the
absence of common fundamental factors. Finally, the empirical finding of this
article may have further implications on the study of equilibrium stock prices.
Investors’ asymmetric selling decisions for their winners and losers can con-
tribute to the asymmetry in the stock market. For example, empirical evidence
shows that correlations of stock returns are higher in down markets than in
up markets.
3
Higher correlations of stock returns in down markets could be
due to greater correlations in selling decisions on losers.
4
In addition, investors’
selective adoption of different mental accounting systems may affect asset
prices. Barberis and Huang (2001) consider two forms of mental accounting,
one in which investors care about the gains and losses in the value of
individual stocks (individual stock accounting) and the other in which in-
vestors care about the gains and losses in the value of the overall portfolio
(portfolio accounting) and show that the form of mental accounting affects
asset prices in a significant way. If investors mentally integrate losses and
segregate gains, portfolio accounting (individual stock accounting) will be
more prevalent in a down (up) market, implying different market behavior
in up and down markets.
The remainder of the article is organized as follows. Section II reviews the
literature on prospect theory and mental accounting. Section III lists the hy-
potheses to be tested, and Section IV describes the data and the empirical
results. Section V discusses further implications of mental accounting prin-
ciples and concludes the article.
II.
Literature Review
A.
Prospect Theory and Mental Accounting
Kahneman and Tversky (1979) propose prospect theory as a descriptive model
of decision making. According to prospect theory, individuals maximize over
a value function instead of the standard utility function. The value function
is defined over gains and losses relative to a reference point rather than over
levels of wealth. The function is concave for gains, convex for losses, and
steeper for losses than for gains.
The prospect theory value function is defined over single outcomes. Then,
a question arises as to how to use the value function to evaluate multiple
outcomes: Do people evaluate the aggregated outcomes, or do they evaluate
each outcome separately? This question is related to mental accounting (Thaler
1985), which refers to the way investors frame their financial decisions and
evaluate the outcomes of their investments.
Keloharju (2001a, 2001b), Dhar and Kumar (2002), Hong and Kumar (2002), Zhu (2002),
Hirshleifer et al. (2003), and Kumar (2005).
3. For example, Longin and Solnik (2001) and Ang and Chen (2002).
4. Kyle and Xiong (2001) show that simultaneous liquidation of unrelated securities due to
wealth effects can lead to financial contagion.
Investor Losses and Gains
2543
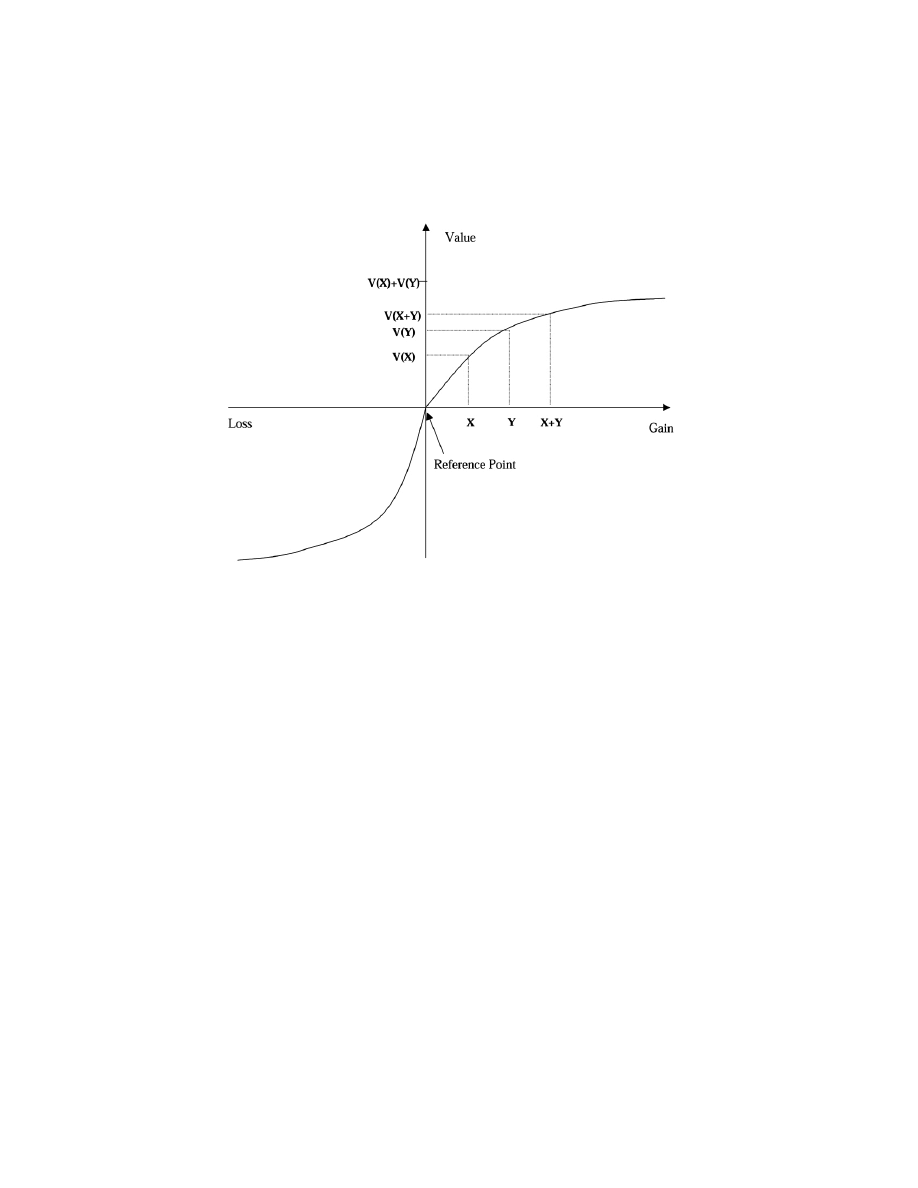
Fig. 1.—Multiple gains—segregation preferred
Thaler (1985) hypothesizes that people try to code outcomes to make them-
selves as happy as possible (the hedonic editing hypothesis). The hedonic
editing hypothesis characterizes decision makers as value maximizers who
mentally segregate or integrate outcomes depending on which mental repre-
sentation is more desirable. For a joint outcome (x, y), people try to integrate
outcomes when integrated evaluation yields higher value than separate eval-
uations,
, and try to segregate outcomes when segre-
v(x
⫹ y)
1
v(x)
⫹ v(y)
gation yields higher value,
. Under this assumption,
v(x
⫹ y)
!
v(x)
⫹ v(y)
Thaler (1985) derives mental accounting principles that determine whether
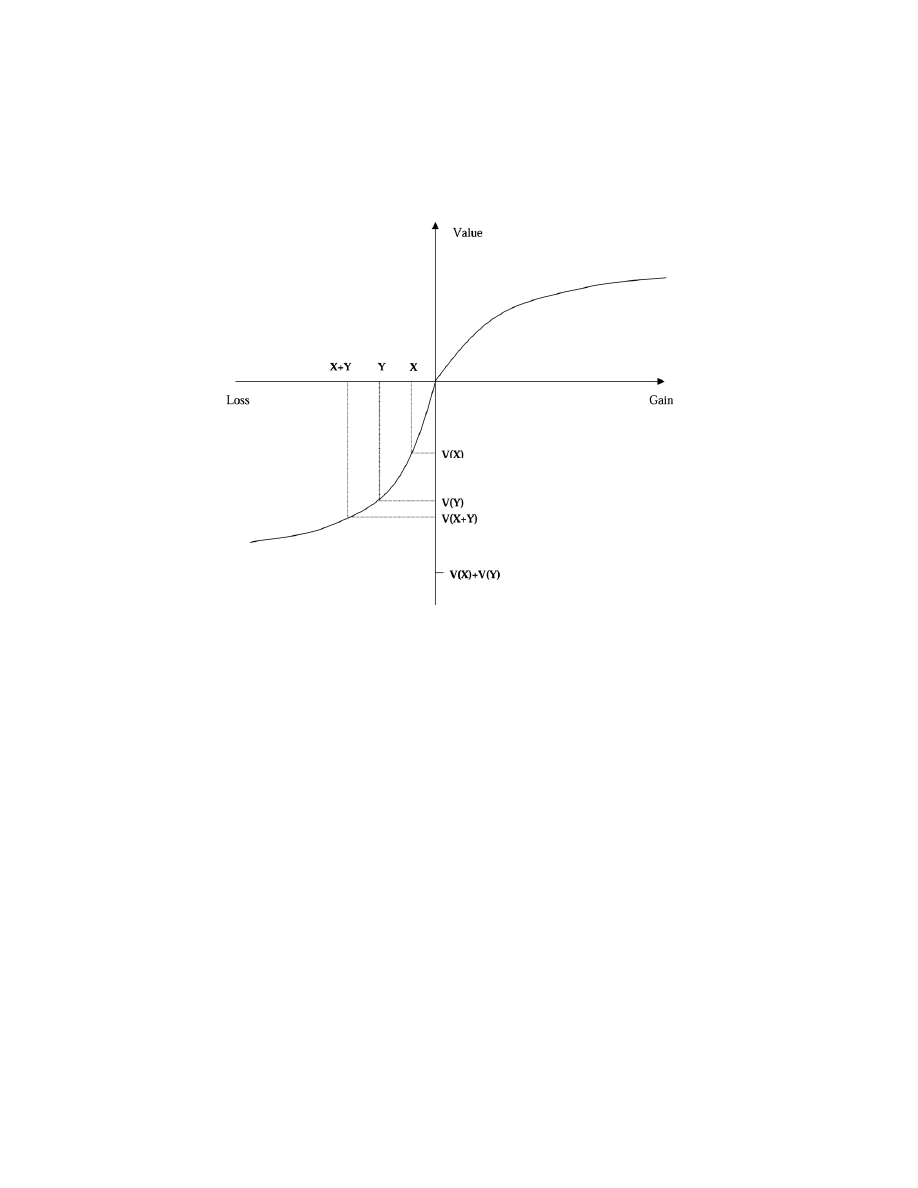
segregation or integration is preferred. The principles indicate that individuals
should segregate gains and integrate losses because the value function exhibits
diminishing sensitivity as the magnitude of a gain or a loss becomes greater
(figs. 1 and 2). Individuals can maximize their happiness by savoring gains
one by one and minimize the pain by thinking about the overall loss rather
than individual losses. For mixed outcomes, whether or not integration is
preferred to segregation depends on the relative magnitudes of the gain and
the loss. Since a loss hurts more than a gain of the same amount (loss aversion),
it is better to combine a loss with a larger gain. Diminishing sensitivity of
the value function implies that it is preferred to segregate a small gain as a
“silver lining.”
2544
Journal of Business
Fig. 2.—Multiple losses—integration preferred
B.
Test of the Hedonic Editing Hypothesis
In principle, individuals could divide or combine gains and losses completely
arbitrarily in order to maximize their happiness. However, there are limits to
the degree to which people can mentally segregate and integrate outcomes.
Thaler and Johnson (1990) propose that temporal separation of events facil-
itates segregation of outcomes and temporal proximity facilitates integration.
If so, the hedonic editing rules imply that people prefer to experience events
on different days when segregation is preferred and on the same day when
integration is preferred. Thus, we can test whether people engage in hedonic
editing by looking at their choices over the timing of events.
Relatively few papers have tested the hedonic editing hypothesis. For mixed
outcomes, Linville and Fischer (1991) find that people prefer to have a negative
event with an offsetting positive event on the same days. Hirst, Joyce, and
Schadewald (1994) find that people prefer to finance purchases of goods with
loans whose terms correspond with the life of the good.
5
For multiple gains,
Thaler and Johnson (1990) and Linville and Fischer (1991) find people prefer
to have positive events on different days.
5. As consumer purchases are voluntary, the costs of the goods (losses) are likely to be smaller
than their benefits (gains).

Investor Losses and Gains
2545
However, the experimental evidence so far does not support the hedonic
editing hypothesis on its prediction regarding multiple losses. Thaler and
Johnson (1990) and Linville and Fischer (1991) find people prefer to have
negative events on different days. These results are somewhat puzzling
because people think aggregated losses are better than segregated ones (Tha-
ler 1985). Thaler and Johnson (1990) argue that decision makers do not
engage in active editing of outcomes and propose the quasi-hedonic editing
hypothesis, where hedonic editing rules are followed only part of the time.
Linville and Fischer (1991) suggest that people have resources that are
limited but renewable over time (e.g., renewed after a good night’s sleep)
for dealing with emotionally impactful events.
If other factors such as limited daily gain-savoring and loss-buffering re-
sources are also important determinants of preferences for experiencing events
on the same day, a relative comparison of the preferences for combining
positive events and negative events can help isolate the effect of mental
accounting. Controlling for other determinants of timing choices is especially
important when we use stock trading data to test the hedonic editing hypoth-
esis, as mental accounting is one of many factors underlying investors’ trading
decisions. Thus, the main test of the article is based on a relative comparison
of investors’ propensities to sell multiple winners and losers to minimize the
influence of other factors on stock selling decisions.
A few additional differences of this study from the previous ones are worth
mentioning. While subjects in the previous experiments had no choice over
the type of outcomes, investors construct their own choices of gains and losses
to realize as well as the timing of the realizations. In addition, the previous
results are based on responses to questions about hypothetical alternatives,
while the results in this study are based on investors’ actual trading decisions.
6
One may argue that a price drop is economically the same negative event
regardless of whether the investor sells the stock or keeps it. However, people
seem to perceive paper losses and realized losses differently, with the latter
being taken more seriously.
7
In addition, selling a stock at loss forces investors
to admit that they have made mistakes in the past, which is a painful thing
to do (Shefrin and Statman 1985). As long as it is painful to sell a stock at
a loss, the pain will be minimized by selling losers at the same time according
to the principles of mental accounting. Similarly, selling a stock at a gain will
6. It is also possible that the difference of the results in this study from the previous ones is
partly due to the difference between predicted utility and decision utility discussed in Kahneman
and Snell (1990). Predicted utility is the anticipation of the hedonic quality of a future experience,
and decision utility is the sign and weight associated with a consequence in a decision context.
Kahneman and Snell (1990) find that a majority of subjects predicted their experience with
painful treatments would get worse over time, while their choices over treatment schedules are
rather consistent with decreasing marginal disutility. Thaler and Johnson (1990) ask subjects how
they would feel about an additional loss, which measures the predicted utility of multiple losses,
while investors’ trading decisions reflect their decision utility.
7. When Sam Walton lost $1.7 billion during the great stock market crash of October 19, 1987,
he responded, “It’s paper anyway” (Ortega 1998).

2546
Journal of Business
be registered as a positive event, so people will prefer selling winners on
different days to maximize their happiness.
III.
Hypotheses
The hedonic editing hypothesis implies that investors prefer to sell losers than
winners on the same day. Therefore the main hypothesis of this article is
posited as follows:
Hypothesis.
Investors’ propensity to sell multiple stocks on the same day
is greater when they realize losses than when they realize gains.
There are several alternative explanations for why investors may sell multiple
losers on the same day more often than multiple winners.
Tax-loss selling.—It is well known that tax-loss selling is concentrated at
the end of the year.
8
If investors sell disproportionately more losers near the
end of year for tax reasons, they may sell multiple losers on the same day.
Margin calls.—Margin calls force investors to liquidate their positions in
some stocks, possibly leading to multiple stock sales. Since margin calls are
triggered by stock price drops, disproportionately more losers than winners
are likely to be sold from margin calls. Therefore, margin calls may contribute
to the bundling of the sales of losers because such calls tend to result in sales
of losers rather than sales of winners.
More losers than winners in the portfolio.—The number of stocks that an
investor sells largely depends on his/her opportunity to do so. Investors with
a large number of stocks are more likely to sell multiple stocks on the same
day than those who have only a few stocks. Thus, the probability of selling
multiple losers will be higher than that of selling multiple winners if investors
have more losers than winners.
Difference in the preference for selling multiple stocks across investors.—
It is possible that a certain group of investors always prefer selling multiple
stocks per day, regardless of whether the stocks are winners or losers. If those
investors happen to have more losers than winners, investor characteristics,
not investors’ differential attitudes toward gains and losses, may drive the
asymmetry in investors’ propensity to sell multiple stocks.
Smaller proceeds from losers than from winners.—The dollar value of a
loser is likely to be smaller than the dollar value of a winner. This implies
that the proceeds from selling a loser are likely to be smaller than the proceeds
from selling a winner. If investors seek to achieve fixed proceeds from stock
8. Evidence for tax-loss selling near the end of the year can also be found in, e.g., Lakonishok
and Smidt (1986), Ritter (1988), Badrinath and Lewellen (1991), Odean (1998), and Poterba and
Weisbenner (2001).

Investor Losses and Gains
2547
sales on a given day, they may need to sell multiple losers, while selling one
winner could suffice.
Higher correlation among losers than among winners.—Losers in a port-
folio might be more related with each other than winners, and related stocks
are more likely to be sold together when news or events affect them at the
same time. If stock return correlations of losers are greater than those of
winners, or if losers are more likely than winners to belong to similar in-
dustries, losers are more likely to be sold on the same day than winners.
Delays in order execution.—Good-till-cancel limit orders may take longer
than a day to be executed. If investors are more likely to use limit orders for
winners than losers (Linnainmaa 2003), multiple sales orders submitted on
the same day and executed on different days are more likely for the sales of
winners than losers, contributing to the asymmetry in the observed investors’
propensity to sell multiple stocks. The next section describes the data and
presents empirical tests designed to address these alternative explanations.
IV.
Empirical Tests
A.
Data Description
The data set of individual investor trades used in this study is from a large
U.S. discount brokerage house. It contains the daily trading records of 158,034
accounts (78,000 households) from January 1991 to November 1996. The file
has more than 3 million records of trades in common stocks, bonds, mutual
funds, American Depositary Receipts (ADRs), and so forth. Each record con-
tains an account identifier, the trade date, an internal security identifier and
Committee on Uniform Security Identification Procedures (CUSIP) number,
a buy-sell indicator, the quantity traded, the commission paid, and the price
at which the stocks are sold or bought.
The brokerage house labels households with more than $100,000 in equity
at any point in time as “affluent,” households that executed more than 48
trades in any year as active “traders,” and the rest as “general.” If a household
qualifies as active trader and affluent, it is considered an active trader. There
are a total of 158,034 accounts that are cash, margin, or IRA/Keogh types.
Only trades in common stocks are examined in this study. All trade records
are adjusted for stock splits and stock dividends using the Center for Research
in Security Prices (CRSP) event files. Multiple trades of the same stock from
the same account on the same day are aggregated.
Following previous studies (e.g., Odean 1998 and Grinblatt and Keloharju
2000), I use the average purchase price as a reference point. When there are
multiple purchases preceding a sale, the average purchase price is calculated
as a split-adjusted share volume-weighted average. When a stock is sold, it
is considered a winner if the sales price is greater than the average purchase
price and a loser otherwise. Similarly, a stock that remains in the portfolio

2548
Journal of Business
is considered a winner if the closing price is greater than the average purchase
price and a loser otherwise.
9
Sales records are discarded if there is no matching
purchase record, since it is not possible to tell whether the sales are at losses
or gains. As a consequence, sales of stocks that were purchased prior to January
1991 are not included in this study. Also, observations are dropped if the entire
portfolio of stocks is liquidated, because the investor could be closing the account
or selling all stocks in the portfolio because of liquidity needs.
Table 1 describes the sample of investor trades used in this study. Sales
records from a total of 50,229 accounts are examined. Of these accounts, 17.2%
are cash accounts, 49% are margin accounts, and 33.8% are IRA/Keogh ac-
counts. The majority of accounts belong to general households (59.4%), and
affluent and trader households account for 18.3% and 22.3%, respectively (panel
A).
Panel B of table 1 reports the number of sales events by account type and
client segment. Each day on which an investor placed a sell order is considered
a sales event, and sales events from different accounts are treated as different
observations.
10
Of these sales events, 63.5% are from margin accounts, 11.1%
from cash accounts, and 25.4% from retirement accounts. When sales events
are classified by client segment, active traders account for the largest fraction
of total sales events (50.3%).
Panel C describes the characteristics of investor portfolios on the days of
stock sales, aggregated over all sales events. Investors’ portfolios are con-
structed from their purchase records since January 1991, and the profiles of
investor portfolios are examined at the sales event level. The median portfolio
size and the number of stocks in the portfolio over all sales events are $45,406
and five, respectively, for the entire sample. Investors on average have more
winners than losers (median number of winners, three; median number of
losers, two), and the dollar value of a winner is greater than that of a loser
(the medians are $8,725 and $5,577, respectively).
11
B.
Proportion of Multiple Stock Sales Conditional on Gains or Losses
Figure 3 shows the distribution of the time interval between two consecutive
stock sales from the same account separately for the sales of winners and for
9. The results are not sensitive to the way winners and losers are defined. The results are
qualitatively the same when the first or the most recent purchase price is used as a reference
point, when commissions are added to the purchase price and subtracted from the sales price,
and when stocks sold at reference prices are considered winners or dropped from the analysis.
10. Suppose there are only two accounts in the sample, account 1 and account 2. Account 1
sold stock A and stock B on October 9, 1991, and stock C on November 14, 1992. Account 2
sold stock B and stock C on November 14, 1992. In this hypothetical example, the number of
sales events is three (two from account 1 and one from account 2).
11. Since portfolios are constructed from the purchase records since 1991, the number of stocks
and the portfolio sizes reported in table 1 are not very accurate. Barber and Odean (2000) report
that the mean household holds 4.3 stocks worth $47,334, and the median household holds 2.61
stocks worth $16,210, which are calculated from the month-end position statements. It seems
averaging over sales events instead of examining month-end positions inflates the numbers by
disproportionately representing portfolios of the investors who trade frequently and have larger
portfolios.

Investor
Losses
and
Gains
2549
TABLE 1
Sample Descriptive Statistics
By Account Type
By Client Segment
A. Number of accounts:
Cash
8,623
17.2%
Affluent
9,169
18.3%
Margin
24,629
49.0%
General
29,853
59.4%
IRA/Keogh
16,977
33.8%
Trader
11,207
22.3%
Entire sample
50,229
B. Number of sales events:
Cash
47,178
11.1%
Affluent
45,770
10.8%
Margin
270,386
63.5%
General
165,757
38.9%
IRA/Keogh
108,180
25.4%
Trader
214,217
50.3%
Entire sample
425,744
Portfolio Size ($)
Dollar Value per Stock ($)
Dollar
Value per
Stock Win-
ner ($)
Dollar
Value per
Stock
Loser ($)
No. Stocks
No.
Winners
No.
Losers
C. Portfolio characteristics
at sales events:
Mean
156,089
17,922
20,964
13,501
8.6
4.6
3.9
Median
45,406
7,792
8,725
5,577
5
3
2
Note.—The table summarizes the sample of individual investor trades used in the study. The data contain records of each investor’s trades in common stocks during the period from
January 1991 to November 1996. All same-day trades in the same stock by the same account are aggregated, and sales without matching purchase records are discarded. Each day when an
account sells a stock is considered one sales event. Sales events in which the entire positions are liquidated are dropped from the sample.
2550
Journal of Business
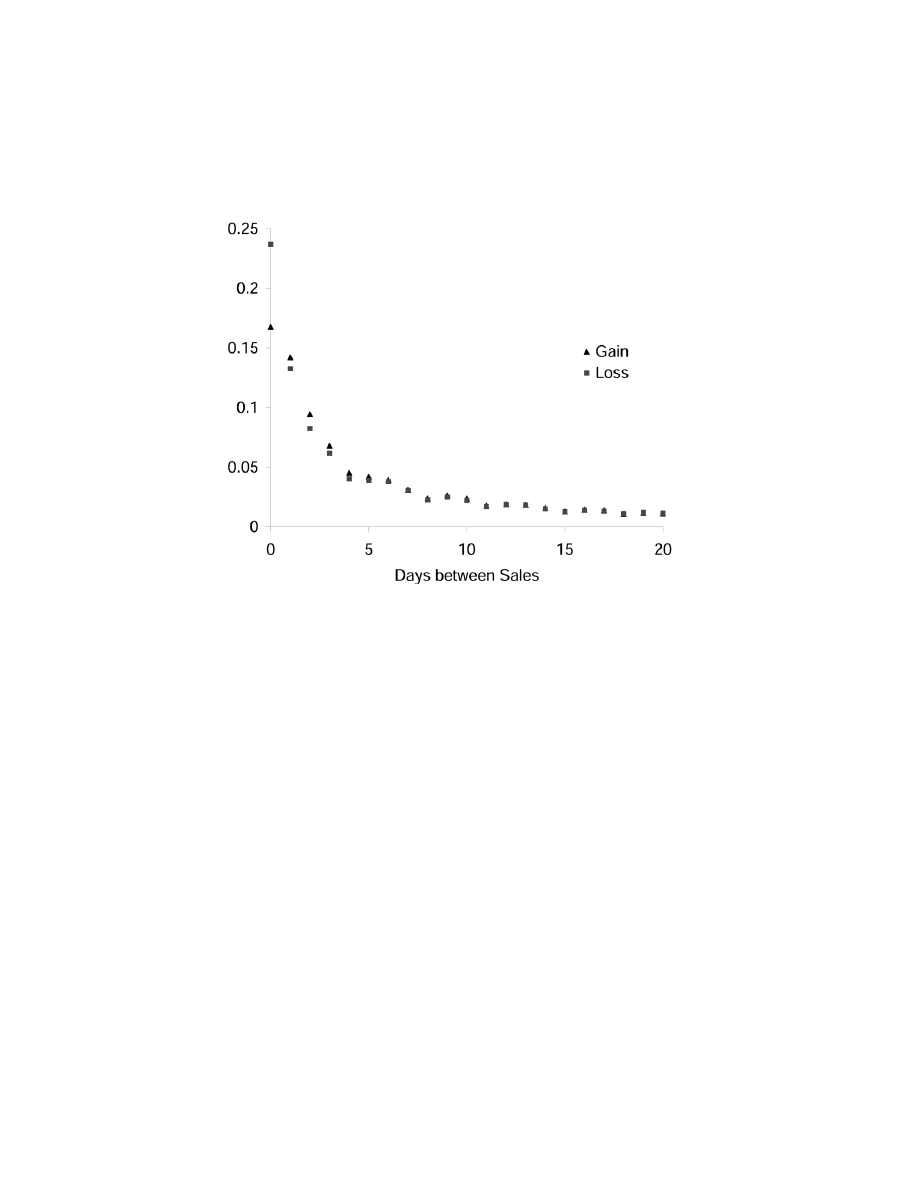
Fig. 3.—Distribution of the interval between sales
the sales of losers. There is not much difference between the sales of winners
and the sales of losers for the intervals greater than 5 days, but there is a
clear difference between them for the interval of 0–5 days. About 24% of
sales of losers occur on the same day as another sale of losers, while 17%
of sales of winners occur on the same day as another sale of winners. Figure
3 illustrates that the sales of losers tend to be bundled on the same day
compared to the sales of winners.
Table 2 reports the number of sales events separately for those at gains and
those at losses. To examine whether losses are more likely to be bundled than
gains, sales events are classified by whether the sales are at gains or at losses
and whether or not the investor sold multiple stocks on that day. I discard
sales events with mixed sales of winners and losers in this cross-classification
analysis since they are associated with both gains and losses (mixed sales
events are examined separately in Sec. IV.E). About 5.95% of the observations
are deleted because they are mixed sales (25,337 out of 425,749 observations).
Panel A of table 2 documents the results for the entire sample. When
investors are selling stocks at losses, they sell multiple losers in 10.44% of
the cases, while they sell multiple winners in 8.48% of the cases where they
realize gains. The difference between the two proportions is 1.96%, which is
highly significant with a t-statistic of 20.01.
12
The results show that losses are
12. The standard errors are calculated under the assumption that all sales events are independent.

Investor Losses and Gains
2551
TABLE 2
Proportion of Multiple Stock Sales: Gain versus Loss
No. Stocks Sold
Multiple
Stock Sale
1
≥ 2
A. Entire sample:
Loss
126,296
14,722
10.44%
Gain
237,406
21,988
8.48%
Difference
1.96%
t-Statistic
20.01
B. By client segment:
Affluent:
Loss
13,560
1,490
9.90%
Gain
26,501
2,031
7.12%
Difference
2.78%
t-Statistic
9.69
General:
Loss
50,651
4,770
8.61%
Gain
96,039
6,596
6.43%
Difference
2.18%
t-Statistic
15.40
Trader:
Loss
62,085
8,462
11.99%
Gain
114,866
13,361
10.42%
Difference
1.58%
t-Statistic
10.56
C. January–November
versus December:
January–November:
Loss
111,593
12,292
9.92%
Gain
222,899
20,738
8.51%
Difference
1.41%
t-Statistic
13.82
December:
Loss
14,703
2,430
14.18%
Gain
14,507
1,250
7.93%
Difference
6.25%
t-Statistic
18.24
No. observations
400,412
Note.—The table cross-classifies sales events by whether the sales are at gains or at losses and the number
of stocks sold during the day. Each (account, sales date) pair is regarded as one observation. If an investor
sells both a loser and a winner on the same day (mixed sales), the observation is dropped. All same-day trades
in the same stock by the same account are aggregated, and sales without matching purchase records are
discarded. The number of observations that belong to each
cell is reported. The proportion of sales
2 # 2
events with multiple stocks is calculated separately for sales events at losses and for sales events at gains, and
the difference between the two is reported with t-statistics; t-statistics are calculated based on the assumption
that all sales events are independent.
more strongly associated with bundling than are gains. Panel B shows the
results by client segment. Affluent households show the greatest difference
between sales at losses and sales at gains in their propensities to sell multiple
stocks (2.78%), and active trader households show the smallest difference
(1.58%). All the differences are highly significant.
Tax-loss selling.—It is well known that investors tend to realize losses near
the end of the year to take advantage of tax deductions from capital losses.
When sales events are classified by month, the difference is especially large
in December. Investors sell multiple losers in 14.18% of the sales events at

2552
Journal of Business
TABLE 3
Proportion of Multiple Stock Sales by Account Characteristics
No. Stocks Sold
Multiple
Stock Sale
(%)
1
≥ 2
A. Taxable versus retirement
accounts:
Taxable accounts:
Loss
96,255
11,579
10.74%
Gain
173,733
16,614
8.73%
Difference
2.01%
t-Statistic
17.58
Retirement accounts:
Loss
30,041
3,143
9.47%
Gain
63,673
5,374
7.78%
Difference
1.69%
t-Statistic
8.87
B. Margin versus nonmargin
accounts:
Margin account:
Loss
81,989
9,978
10.85%
Gain
146,994
14,600
9.03%
Difference
1.81%
t-Statistic
14.53
Nonmargin accounts:
Loss
44,307
4,744
9.67%
Gain
90,412
7,388
7.55%
Difference
2.12%
t-Statistic
13.40
Note.—The table cross-classifies sales events by whether the sales are at gains or at losses and the number
of stocks sold during the day separately for different types of accounts. Each (account, sales date) pair is
regarded as one observation. All same-day trades in the same stock by the same account are aggregated, and
sales without matching purchase records are discarded. The number of observations that belong to each
cell is reported. The proportion of sales events with multiple stocks is calculated separately for sales
2 # 2
events at losses and for sales events at gains, and the difference between the two is reported with t-statistics;
t-statistics are calculated based on the assumption that all sales events are independent.
losses and sell multiple winners in 7.93% of the sales events at gains (dif-
ference, 6.25%; panel C, table 2) in December. The result suggests that tax-
loss selling is likely to cause clustering of loss selling. However, tax-loss
selling may not be the only cause since the difference between the two pro-
portions is still significant (1.41%; t-statistic, 13.82) from January–November.
An alternative way of addressing the tax-loss selling hypothesis is to look
at stock sales from retirement accounts (IRA/Keogh). Panel A of table 3
documents the results separately for taxable and retirement accounts. As ex-
pected, the difference between sales events at gains and sales events at losses
in the proportions of multiple stock sales is larger for the taxable accounts
(2.01%; t-statistic, 17.58). However, the difference for the retirement accounts
is also positive and highly significant (1.69%; t-statistic, 8.87). Tax-loss selling
seems to play a role in the clustering of loss selling, but it does not explain
why investors are more likely to sell multiple losers than winners on the same
day from their retirement accounts.
Margin calls.—Stock price drops may trigger margin calls and force in-
vestors to sell some of the stocks in their portfolios. It is likely that there are

Investor Losses and Gains
2553
more losers than winners in the accounts that just experienced margin calls;
therefore, margin calls may result in sales of multiple losers more often than
sales of multiple winners.
Panel B of table 3 reports results separately for accounts that allow margin
trading and those that do not allow margin trading (cash and retirement ac-
counts). The difference in the percentage of multiple stock sales is actually
greater for nonmargin accounts (1.81% for margin accounts and 2.12% for
nonmargin accounts), which indicates that margin calls are not the primary
reason for clustering of loss selling.
Number of winners and losers and difference in preferences across inves-
tors.—Investors might simply have more losers than winners; therefore, they
may sell multiple losers more often than multiple winners as they have more
losers available for sale.
13
It is also possible that a certain group of investors
always prefer selling multiple stocks at a time regardless of whether the stocks
are winners or losers. If those investors happen to have more losers rather
than winners, multiple stock sales are more likely in loss sales events due to
the greater presence of those investors in loss sales events. One such possibility
is that frequent traders, who are more likely to execute multiple trades a day,
have more losers than winners due to their overconfidence (Barber and Odean
2000). If so, we may observe more multiple stock sales in loss sales events
because frequent traders are overrepresented in loss sales events.
Panel A of table 4 shows that the number of losers as a percentage of total
number of stocks in a portfolio indeed increases with trading frequency and
that frequent traders are more likely to sell multiple stocks a day. For the
most frequent traders (group 5), 46.23% of the stocks in their portfolios are
losers, and 10.8% of sales events are multiple sales events. For the least
frequent traders (group 1), 39.56% of the stocks in their portfolios are losers,
and 2.47% of sales events are multiple sales events. The investors in loss
sales events trade on average 153.1 times, while investors in gain sales events
trade on average 141.4 times during the sample period (untabulated), sug-
gesting frequent traders comprise a greater part of loss sales events than gain
sales events.
These results suggest that it is important to control for the difference in
investors’ opportunities to sell winners and losers. Thus I restrict the sample
to sales events on which investors have equal numbers of winners and losers.
This restriction ensures that investors had equal opportunities to sell winners
and losers and also controls for the possibility that differences in individual
characteristics might be driving the results.
The results are qualitatively the same after imposing the restriction of equal
numbers of winners and losers (panel B). The difference in the proportions
of multiple stock sales is 1.64% with a t-statistic of 8.91. Investors are more
likely to sell multiple stocks when they realize losses than gains, even though
they have equal opportunities to realize gains and losses. Also, the result rules
13. However, table 1 shows that investors actually have more winners than losers.

2554
Journal
of
Business
TABLE 4
Proportion of Multiple Stock Sales: Number of Winners and Losers
No. Trades
% Losers
Multiple
Stock Sale
(%)
Multiple
Stock Sale
(% Loss)
Multiple
Stock Sale
(% Gain)
(4)
⫺(5)
t-Statistic
No. Sales
Events
A. By trading frequency:
Account group by no. trades:
1
5.85
39.56
2.47
2.91
1.88
1.03
3.57
13,479
2
10.89
41.14
5.64
5.67
4.00
1.66
4.97
19,027
3
17.53
42.33
6.97
6.99
5.03
1.97
7.33
37,246
4
30.65
43.70
8.53
8.83
6.09
2.75
12.70
69,890
5
106.87
46.23%
10.80%
11.97%
10.36%
1.61%
12.42
260,770
No. Stocks Sold
Multiple
Stock Sale
(%)
No.
Observations
1
≥ 2
B. Equal number of winners and
losers—entire sample:
64,253
Loss
20,165
1,210
5.66%
Gain
41,155
1,723
4.02%
Difference
1.64%
t-Statistic
8.91
1991–94
1995–96
No. Stocks Sold
Multiple
Stock Sale
(%)
No. Stocks Sold
Multiple
Stock Sale
(%)
1
≥ 2
1
≥ 2
C: Equal number of winners and losers—
1991–94 versus 1995–96:
Loss
12,649
736
5.50%
7,516
474
5.93%
Gain
26,382
1,054
3.84%
14,773
669
4.33%
Difference
1.66%
1.60%
t-Statistic
7.25
5.15
Note.—The table examines the effect of the number of winners and losers on the propensity to sell multiple stocks. In panel A, accounts are grouped by the total number of stock trades, the
number of losers as a percentage of the total number of stocks in the portfolio (col. 2), the proportion of sales events with multiple stock sales calculated for all sales events (col. 3) and separately
for sales events at losses and for those at gains (cols. 4 and 5), and the difference between the two and its t-statistic are reported for each group. Panels B and C cross-classifiy sales events by
whether the sales are at gains or at losses and the number of stocks sold on that day, conditional on the number of winners and losers in the portfolio being equal. t-Statistics are calculated based
on the assumption that all sales events are independent.

Investor Losses and Gains
2555
out the possibility that the asymmetry is entirely driven by investors with
more losers than winners who tend to sell multiple stocks, as those investors
are excluded in this restricted sample.
Because I construct investors’ portfolios from their purchase records since
1991, stocks that were purchased prior to 1991 are not captured in the con-
structed portfolios. It is likely that there are more losers than winners among
those stocks since investors tend to hold on to losers longer (e.g., Shefrin and
Statman 1985; Odean 1998). Thus, the number of stocks in the portfolio is
downward biased, and the downward bias is likely to be greater for the number
of losers. Then the restriction of equal numbers of losers and winners may
actually result in a sample with more losers than winners, biasing the results
toward finding more bundling of losers.
To address this possible bias, panel C reports the results separately for the
subperiods from 1991 to 1994 and from 1995 to 1996. When holding periods
are calculated from round-trip transactions, less than 1% of stocks are held for
4 years or longer. Thus, the bias from omitted stocks should be minimal in the
later part of the sample period. It appears that the bias does not affect the result
very much, as the difference in proportions does not change much in the later
period (1.66% in the period 1991–94 vs. 1.60% in the period 1995–96).
Difference in sales proceeds.—Investors may sell stocks to meet liquidity
needs. The number of stocks an investor needs to sell to reach a desired level
of proceeds depends on the dollar value of each stock in her portfolio. Because
the dollar value of a loser is on average smaller than the dollar value of a
winner (table 1, panel C), investors may need to sell a larger number of losers
than winners to reach the same level of proceeds. If so, stock sales for liquidity
needs could be responsible for the observed pattern in investors’ selling be-
havior. To address this possibility, table 5 examines a subset of the sample
that controls for the difference in the potential proceeds from sales of winners
and losers.
For each sales event, the average dollar value per stock is calculated sep-
arately for winners and losers in the portfolio. Panel A of table 5 reports the
results when the average dollar values of losers and winners in the same
portfolio are close to each other (when the difference between the two is less
than 10%); panel B reports the results when the average dollar value of losers
is greater than the average dollar value of winners in the same portfolio. These
restrictions do not eliminate the asymmetry in investors’ propensity to sell
multiple stocks. The difference between gains and losses in the proportion of
multiple sales is 1.12%, with a t-statistic of 3.02 when winners and losers
have similar dollar values. The difference is 1.00% (t-statistic, 4.74) when
losers have larger dollar values than winners.
Commonality among winners and among losers.—If losers in a portfolio
are more related to each other than are winners, losers are more likely subject
to common shocks, contributing to the clustering of loss selling. For example,
it is possible that returns of losers are more highly correlated with each other
than those of winners, or that the proportion of losers in similar industries is

2556
Journal of Business
TABLE 5
Proportion of Multiple Stock Sales: Potential Proceeds Control
No. Stocks Sold
1
≥ 2
Multiple Stock
Sale (%)
No.
Observations
A. Difference in the
average dollar
values less
than 10%:
Loss
9,267
1,155
11.08%
30,879
Gain
18,420
2,037
9.96%
Difference
1.12%
t-Statistic
3.02
B. The average dol-
lar value of
losers greater
than that of
winners:
Loss
27,246
2,822
9.39%
77,796
Gain
43,725
4,003
8.39%
Difference
1.00%
t-Statistic
4.74
Note.—The table cross-classifies sales events by whether the sales are at gains or at losses and the number
of stocks sold during the day, when the difference in the average dollar values of winners and losers is less
than 10% as of the sales date (panel A) and when the average dollar value of losers is greater than the average
dollar value of winners in the same portfolio (panel B). The proportion of sales events with multiple stocks
is calculated separately for sales events at losses and for sales events at gains, and the difference between the
two is reported with t-statistics; t-statistics are calculated based on the assumption that all sales events are
independent.
greater than that of winners. To investigate if losers are more related to each
other than winners, table 6 reports various measures of relatedness separately
for winners and for losers based on return correlations and industry membership.
For each sales event, the portfolio from which sales occur is divided into
a winner and a loser portfolio. Indices of relatedness (RI) and the mean and
maximum correlations (CORR, MXCORR) of the winner and of loser port-
folios are calculated by pairwise comparisons of all possible pairs of winners
and losers within each of their respective portfolios. Specifically, for sales
event k, the index of relatedness and the mean and maximum correlations
of the winner and loser portfolios are calculated as follows (denotes either
W or L):
冘
I
冘
r
ij
ij
•
•
i, j
eS , i(j
i, j
eS , i(j
k
k
•
•
•
RI p
, CORR p
, MXCORR p max
r ,
(1)
k
k
k
ij
•
冘
1
冘
1
i, j
eS , i(j
k
•
•
i, j
eS , i(j
i, j
eS , i(j
k
k
where
is an indicator variable equal to one if stock i and stock j belong to
I
ij
a same industry group, and
is the correlation of daily stock returns of stocks
r
ij
i and j over 90 days prior to the sales event.
(
) is the winner (loser)
W
L
S
S
k
k
portfolio for sales event k. For the definition of industry groups, two alternative
definitions based on 2-digit SIC codes are used to make sure that the results

Investor Losses and Gains
2557
TABLE 6
Correlations of Returns and Index of Relatedness
No. Observations
RI (FH)
RI (MG)
CORR
MXCORR
All:
Loser
289,373
.1620
.1076
.0902
.2653
Winner
313,925
.1693
.1147
.1274
.3120
Difference
⫺.0073
⫺.0071
⫺.0372
⫺.0468
t-Statistic
⫺11.65
⫺12.85
⫺116.49
⫺86.45
:
N p 2
Loser
78,356
.1643
.1132
.0923
.0932
Winner
84,433
.1735
.1204
.1271
.1282
Difference
⫺.0092
⫺.0072
⫺.0348
⫺.0350
t-Statistic
⫺4.51
⫺4.96
⫺39.85
⫺39.88
:
N p 3
Loser
54,302
.1665
.1127
.0900
.2079
Winner
57,291
.1729
.1177
.1271
.2468
Difference
⫺.0064
⫺.0050
⫺.0371
⫺.0388
t-Statistic
⫺3.86
⫺4.41
⫺48.76
⫺40.89
:
N p 4
Loser
38,096
.1650
.1110
.0903
.2727
Winner
38,911
.1700
.1150
.1272
.3137
Difference
⫺.0049
⫺.0040
⫺.0369
⫺.0410
t-Statistic
⫺3.2
⫺3.64
⫺47.67
⫺37.28
:
5
≤ N ≤ 6
Loser
47,437
.1606
.1044
.0901
.3310
Winner
48,909
.1666
.1129
.1266
.3724
Difference
⫺.0059
⫺.0085
⫺.0366
⫺.0414
t-Statistic
⫺9.21
⫺6.11
⫺60.55
⫺42.94
:
7
≤ N ≤ 10
Loser
40,622
.1581
.1006
.0888
.3968
Winner
43,649
.1640
.1086
.1269
.4449
Difference
⫺.0060
⫺.0079
⫺.0381
⫺.0481
t-Statistic
⫺10.12
⫺7.31
⫺68.54
⫺47.49
:
N
1
10
Loser
30,560
.1515
.0939
.0876
.5011
Winner
40,732
.1639
.1072
.1299
.5528
Difference
⫺.0124
⫺.0133
⫺.0423
⫺.0517
t-Statistic
⫺20.73
⫺19.02
⫺81.09
⫺46.44
Note.—The table reports various measures of relatedness of winners and losers in a portfolio. On each
sales event, the investor’s portfolio is divided into winner and loser portfolios, and correlations of daily stock
returns calculated over days [
⫺90,⫺1] are computed for all possible pairs of winners and losers within each
of their respective portfolios. The mean and maximum of the correlations of each winner/loser pair are calculated
at the sale event level and aggregated across sales events. The mean correlations is CORR, and MXCORR is
the maximum correlations of returns computed across sales events. Similarly, percentages of winner pairs and
loser pairs that belong to same industries (RI) within each of their respective portfolios are computed at the
sales event level and aggregated across all sales events. Two alternative definitions of industry groups are
used: RI(FH) uses 12 industry groups as in Ferson and Harvey (1991), and RI(MG) uses 19 industry groups
as in Moskowitz and Grinblatt (1999). N is the number of stocks in the winner/loser portfolio. t-Statistics are
calculated assuming unequal variances.
are robust to different industry definitions. The index of relatedness using 12
industry groups following Ferson and Harvey (1991) is denoted RI(FH), and
the index using 19 industry groups following Moskowitz and Grinblatt (1999)
is denoted RI(MG). The index of relatedness and the mean and maximum
correlations of winner and loser portfolios are first calculated at the sales event

2558
Journal of Business
level, then averaged across sales events (
/
is the total number of winner/
W
L
N N
loser portfolios).
•
•
•
冘
RI
冘
CORR
冘
MXCORR
k
k
k
k
k
k
•
•
•
RI p
, CORR p
, MXCORR p
.
(2)
•
•
•
N
N
N
Table 6 reports the indices of relatedness and the mean and maximum
correlations of daily stock returns for winner and loser portfolios. The index
of relatedness is higher and the mean and maximum correlations of returns
are greater for winner portfolios than for loser portfolios, indicating that win-
ners are more related to each other than are losers. The results are robust in
relation to the number of stocks in the portfolio. If common shocks trigger
multiple stock sales, they should increase the probability of multiple winner
sales rather than that of multiple loser sales. Thus, we can dismiss the pos-
sibility that commonality among stocks is driving the asymmetry in investors’
propensity to sell multiple stocks.
Delays in order execution.—It may take longer than a day for good-till-
cancel limit orders to be executed.
14
Some sales may be counted as separate
events when they are from limit orders submitted on the same day but executed
over different days. Linnainmaa (2003) finds that investors are more likely
to submit limit orders when they realize gains than losses. If so, investors
may appear to realize gains over different days relative to losses even though
they are equally likely to bundle sales of winners and sales of losers.
Because the data set does not have information on whether a trade is from
a limit order or from a market order, I perform three different tests to control
for the possible effects of stale limit orders. First, I look at sales events in
which sales prices are lower than closing prices of the previous trading day
and also sales quantities are smaller than the previous day’s trading volumes
(panel A of table 7). If a stock is sold at a price lower than the closing price
of the previous trading day, and if there was enough trading volume on the
previous day, it is probably safe to assume that the order was placed and
executed on the same day. If the order had been placed on the previous day
or earlier, it would have been executed on the previous day, which closed
with a higher price than the limit price.
Second, I examine sales events in which none of the sales are at round or
half dollars (panel B). Goetzmann and Zhu (2003) argue that limit orders are
more likely to take place at round dollars or half dollars since investors are
more likely to use rounding when setting limit order prices. Under this as-
sumption, sales events examined in panel B are likely to consist of market
orders. Finally, sales events that are far apart from other sales events from
the same account are examined in panel C. Delays in order execution create
a problem when one sales event with multiple sales based on the timing of
14. In the sample of Harris and Hasbrouck (1996), about 82% of limit orders are day orders
that are automatically canceled if not executed until the close, and 17% of limit orders are good-
till-cancel orders.

Investor Losses and Gains
2559
TABLE 7
Proportion of Multiple Stock Sales: Control for Stale Limit Orders
No. Stocks Sold
Multiple
Stock
Sale
(%)
No.
Observations
1
≥ 2
A. Sales price lower
than the previ-
ous day closing
price:
Loss
67,656
5,251
7.20%
166,792
Gain
88,487
5,398
5.75%
Difference
1.45%
t-Statistic
11.89
B. No sales at round
or half dollars:
Loss
82,341
6,654
7.48%
240,521
Gain
142,454
9,072
5.99%
Difference
1.49%
t-Statistic
13.90
C. No other sales in
the 15-day win-
dow [
⫺7,7]:
Loss
82,204
8,952
9.82%
261,129
Gain
157,961
12,012
7.07%
Difference
2.75%
t-Statistic
23.63
Note.—The table cross-classifies sales events by whether the sales are at gains or at losses and the number
of stocks sold during the day, after excluding sales events that are potentially contaminated by stale limit
orders. Panel A examines sales events in which all sales prices are lower than the closing prices of the previous
trading day and sales quantities are smaller than the trading volume of the previous day. Panel B examines
sales events in which none of the stocks are sold at round or half dollars. Panel C examines isolated sales
events for which there are no other sales from the same account during the week before and the week after
the event.
order submission is counted as two or more sales events with a single sale
based on the timing of order execution. Panel C identifies sales events that
are not likely to be associated with this kind of double counting. The interval
between order submission and execution is probably less than a few days in
most cases. If sales events are double counted due to delays in limit order
execution, those double-counted sales events are likely to be within a few
days of each other. If there is no other sales event in the 15-day window
around the sales event [
⫺7,7], it is not likely to be associated with double
counting due to stale limit orders.
15
Table 7 shows that the results are qual-
itatively the same after excluding sales events that are possibly contaminated
by stale limit orders. Therefore, delays in limit order execution do not appear
to explain the asymmetry.
Account level analysis.—So far, the propensity to sell multiple stocks is
calculated by aggregating across sales events from all accounts. As an alter-
native, the propensity to sell multiple stocks is calculated at the account level
in table 8. The propensity to sell multiple stocks when the account realizes
15. The results are almost the same when I use longer windows like [
⫺14,14].

2560
Journal of Business
TABLE 8
Difference in the Proportion of Multiple Stock Sales: An Account Level
Analysis
No.
Observations
DIFF (%)
t-Statistic
A. Entire sample:
By account characteristics:
Cash
2,016
2.79
6.26
IRA/Keogh
4,306
.77
2.59
Margin
10,150
2.29
11.93
By household characteris-
tics:
2,180
2.67
5.52
Affluent
General
7,789
1.98
8.91
Trader
6,503
1.68
7.48
All
16,472
1.96
12.87
B. Excluding December sales:
By account characteristics:
Cash
1,770
1.71
3.65
IRA/Keogh
4,047
.89
2.80
Margin
9,232
.95
4.97
By household characteris-
tics:
Affluent
1,847
1.24
2.46
General
6,972
1.22
5.31
Trader
6,230
.74
3.23
All
15,049
1.03
6.59
Note.—The difference in the proportion of multiple stock sales between sales events at losses and sales
events at gains is calculated for each account with at least five sales events and then averaged across accounts.
In panel B, sales events in December are excluded.
losses and when it realizes gains and the difference between the two are
calculated for each account and then aggregated across accounts.
Let
(
) be the number of sales events when account i sells multiple
i
i
N
N
ml
sl
losers (one loser). Similarly,
(
) is the number of sales events when
i
i
N
N
mw
sw
account i sells multiple winners (one winner). For each account with at least
five sales events, the difference in the propensity to sell multiple stocks is
calculated, and the differences are averaged across accounts:
i
冘
DIFF
i
i
N
N
i
ml
mw
i
DIFF p
⫺
,
DIFF p
.
(3)
i
i
i
i
N
⫹ N
N
⫹ N
no. accounts
ml
sl
mw
sw
The account level analysis yields results very similar to the aggregated
result. On average, the propensity to sell multiple stocks is larger when in-
vestors realize losses rather than gains, and the average difference is 1.96%.
C.
Logistic Analysis of the Determinants of Multiple Stock Sales
A logistic regression approach allows simultaneous examination of many de-
terminants of multiple stock sales. The following logistic model is used to

Investor Losses and Gains
2561
examine whether or not realizing losses increases the propensity to sell mul-
tiple stocks:
n
Pr (Multi p 1) p
L(b
⫹ b LOSS ⫹
b x
⫹ ),
(4)
冘
0
1
k
k
kp2
where
is the logistic cumulative distribution function. For each sales
L(7)
event, the dependent variable takes the value of one if multiple stocks are
sold and zero if only one stock is sold. LOSS is an indicator variable that
takes the value of one if the sales are at losses and zero if they are at gains.
The
’s are control variables. As in the previous section, sales events in which
x
k
investors sell both a winner and a loser are dropped from the analysis.
For control variables, a dummy variable for sales events from margin ac-
counts (MARGIN) and a dummy variable for sales events from taxable ac-
counts (TAX) are included because margin trading and tax-loss selling can
contribute to the multiple stock sales. Also included are a dummy for sales
in December (DEC), a natural log of the number of stocks in the portfolio
(Log[NSTOCK]), the value-weighted average of the holding period returns
of stocks in the portfolio (VWHPRET), the average of the squared daily market
returns calculated over days [
⫺60, ⫺1] (MKTVOL), four market return var-
iables (MKTRET), and four portfolio return variables (PFRET) that cover the
sales date and 20 trading days prior to the sales event date (days 0,
⫺1, [⫺5,
⫺2], [⫺20, ⫺6]).
16
Other control variables are the average dollar value of a
stock in the portfolio (DPOSI); a dummy variable equal to one if the account
makes purchases on the same day (PURCHASE); and two dummy variables
that represent the client segment, one for the active traders (TRADER) and
the other for the affluent households (AFFLUENT). The total number of stock
sales from all accounts on the same day (NTSALES) is included as a proxy
for the overall selling activity on that day. Also included are interaction terms
of LOSS with a taxable account dummy and with a December sales dummy
(
,
,
).
LOSS # TAX LOSS # DEC LOSS # TAX # DEC
Table 9 reports maximum likelihood estimates of regression coefficients
and their robust standard errors. The results in table 9 confirm the univariate
results. Investors are more likely to sell multiple stocks when they realize
losses, after controlling for the effect of the number of stocks in the portfolio,
account and household characteristics, the average dollar value of the stocks
in the portfolio, overall selling activity during the day, market volatility, and
the current and past portfolio and market returns. The coefficient for the variable
LOSS is positive and significant at the 1% level across all models. Since in-
teraction terms of the LOSS variable with the DEC and TAX dummies are
included as well, the coefficient of LOSS represents the effect of realizing losses
on the probability of multiple stock sales in non-December months for nontax-
able accounts. The coefficient estimate of
is positive
LOSS # TAX # DEC
16. Grinblatt and Keloharju (2000) find that returns beyond a month (about 20 trading days)
in the past appear to have little impact on the decision to sell a stock.

2562
Journal
of
Business
TABLE 9
Logistic Analysis of the Propensity to Sell Multiple Stocks
(1)
(2)
(3)
(4)
(5)
(6)
(7)
(8)
LOSS
.230
.222
.175
.147
.150
.153
.142
.139
(13.44)**
(13.20)**
(6.57)**
(5.59)**
(5.71)**
(5.85)**
(5.43)**
(5.28)**
DEC
.228
⫺.138
⫺.141
⫺.112
⫺.121
⫺.114
⫺.108
(6.34)**
(
⫺3.69)**
(
⫺3.74)**
(
⫺2.88)**
(
⫺3.18)**
(
⫺2.94)**
(
⫺2.80)**
Log(NSTOCK)
.692
.673
.682
.686
.686
.685
(105.36)**
(89.21)**
(90.12)**
(89.87)**
(89.65)**
(89.42)**
MARGIN
.063
.074
.072
.069
.069
.069
.066
(3.02)**
(3.54)**
(3.42)**
(3.30)**
(3.29)**
(3.28)**
(3.15)**
TAX
⫺.097
⫺.107
⫺.107
⫺.111
⫺.110
⫺.110
⫺.100
(
⫺4.20)**
(
⫺4.31)**
(
⫺4.33)**
(
⫺4.47)**
(
⫺4.43)**
(
⫺4.45)**
(
⫺4.01)**
LOSS # DEC
.015
.014
.012
.016
.012
.006
(.17)
(.16)
(.14)
(.18)
(.14)
(.06)
LOSS # TAX
⫺.010
⫺.005
⫺.004
⫺.004
⫺.005
⫺.001
(
⫺.35)
(
⫺.18)
(
⫺.14)
(
⫺.13)
(
⫺.17)
(
⫺.04)
LOSS # TAX # DEC
.514
.520
.518
.515
.523
.518
(6.38)**
(6.47)**
(6.46)**
(6.41)**
(6.52)**
(6.39)**
ACTIVE
⫺.002
⫺.008
⫺.004
⫺.004
⫺.005
.004
(
⫺.16)
(
⫺.52)
(
⫺.31)
(
⫺.31)
(
⫺.32)
(.26)
AFFLUENT
⫺.065
⫺.056
⫺.050
⫺.050
⫺.050
⫺.082
(
⫺3.15)**
(
⫺2.68)**
(
⫺2.39)*
(
⫺2.40)*
(
⫺2.41)**
(
⫺3.96)**
DPOSI
⫺.649
⫺.467
⫺.475
⫺.480
⫺.477
⫺.148
(
⫺3.79)**
(
⫺2.86)**
(
⫺2.92)**
(
⫺2.94)**
(
⫺2.93)**
(
⫺.89)
NTSALES
.001
.001
.001
.001
.001
.001
(14.67)**
(15.68)**
(19.16)**
(18.50)**
(19.07)**
(18.89)**
PURCHASE
.303
.301
.301
.300
.299
.319
(20.60)**
(20.59)**
(20.61)**
(20.59)**
(20.57)**
(22.28)**
VWHPRET
⫺.140
⫺.142
⫺.145
⫺.138
⫺.116
(
⫺7.70)
(
⫺8.07)**
(
⫺7.92)**
(
⫺7.65)**
(
⫺6.74)**
MKTVOL
50.215
47.333
51.202
56.360
(6.68)**
(6.22)**
(6.81)**
(7.49)**
MKTRET0
⫺6.167
⫺2.241
⫺1.845

Investor
Losses
and
Gains
2563
(
⫺5.45)**
(
⫺1.97)*
(
⫺1.60)
MKTRET1
⫺5.642
⫺6.769
⫺5.725
⫺5.717
(
⫺4.70)**
(
⫺5.57)**
(
⫺4.76)**
(
⫺4.76)**
MKTRET2_5
⫺1.783
⫺1.718
⫺1.526
⫺1.466
(
⫺2.98)**
(
⫺2.76)**
(
⫺2.44)*
(
⫺2.36)*
MKTRET6_20
⫺.207
⫺.318
⫺.295
⫺.277
(
⫺.63)
(
⫺.93)
(
⫺.87)
(
⫺.81)
PFRET0
⫺3.065
⫺2.778
⫺2.993
(
⫺10.24)**
(
⫺9.73)**
(
⫺8.97)**
PFRET1
.043
.043
.050
.055
(2.91)**
(2.42)*
(2.67)**
(2.55)*
PFRET2_5
⫺.218
⫺.068
⫺.125
⫺.066
(
⫺1.10)
(
⫺.46)
(
⫺.76)
(
⫺.42)
PFRET6_20
.091
.100
.078
.102
(1.24)
(1.40)
(1.11)
(1.32)
NSTOCK DUMMIES
No
No
No
No
No
No
No
Yes
Pseudo-
(%)
2
R
.20
5.14
5.76
5.87
5.89
5.86
5.93
7.63
Observations
400,412
400,412
400,412
400,263
400,412
400,263
400,263
400,263
Note.—The table reports maximum likelihood estimates of regression coefficients and their z-statistics from logistic regressions. For each sales event, the dependent variable takes the
value of one if multiple stocks are sold and zero if only a single stock is sold. Robust z-statistics adjusted for clustering on calendar dates are in parentheses. Independent variables: LOSS:
indicator variable equal to one if the sales are at losses and zero if at gains; DEC: dummy equal to one for December sales; NSTOCK: number of stocks in the portfolio; MARGIN: dummy
equal to one for margin accounts; NLOSER: number of losers in the portfolio; NWINNER: number of winners in the portfolio; TAX: dummy equal to one for taxable accounts; ACTIVE:
dummy equal to one for active traders; AFFLUENT: dummy equal to one for affluent households; DPOSI: average dollar value of a stock in the portfolio (in million dollars); NTSALES:
total number of stock sales from all accounts on day zero; PURCHASE: dummy equal to one when the account makes purchases on the same day; VWHPRET: value-weighted average
holding period return of stocks in the portfolio; MKTRET0: market return (CRSP value-weighted index) on day zero; MKTRET1: market return on day
⫺1; MKTRET2_5: market return
over days [
⫺5,⫺2]; MKTRET6_20: market return over days [⫺20,⫺6]; MKTVOL: average (return)
2
of market over days [
⫺60,⫺1]; PFRET0: value-weighted return of stocks in the portfolio
on day zero; PFRET1: value-weighted return of stocks in the portfolio on day
⫺1; PFRET2_5: value-weighted return of stocks in the portfolio over days [⫺5,⫺2]; PFRET6_20: value-
weighted return of stocks in the portfolio over days [
⫺20,⫺6]; NSTOCK DUMMIES is a set of dummy variables for the number of stocks..
* Significant at the 5% level.
** Significant at the 1% level.

2564
Journal of Business
and highly significant, confirming the results in tables 2 and 3 that tax-loss
selling in December increases the probability of multiple stock sales.
The value-weighted holding period return of the portfolio, VWHPRET, is
negatively related to the probability of multiple stock sales. VWHPRET is
closely related to whether the investor realizes losses or gains at the sales
event, therefore likely to take away significance from the LOSS dummy.
However, the LOSS variable remains significantly positive after controlling
for the holding period returns and portfolio returns prior to and on the sales
events. Adverse market movements prior to the sales, especially on the sales
date, increase the probability of multiple stock sales. It also appears that
investors sell multiple stocks in highly volatile markets and on days when
there is a high level of selling activity, as the coefficients for MKTVOL and
NTSALES are positive and significant. Also, the coefficient of the PUR-
CHASE dummy is positive and highly significant. It is possible that sales
with accompanying purchases occur when investors rebalance their portfolios,
and portfolio rebalancing is likely to result in multiple stock sales. In the last
column, I replace Log(NSTOCK) with a set of dummies, one for each number
of stocks up to
, and one for
, to account for
NSTOCK p 25
NSTOCK
1
25
a possible nonlinear effect of Log(NSTOCK) on the probability of multiple
stock sales.
17
Using a set of dummies for the number of stocks increases the
model fit but does not change the results very much.
D.
Modeling Stock Sales as Independent Bernoulli Trials
As an alternative approach, the probability of observing multiple stock sales
is modeled under the assumption that the decision to sell one stock is inde-
pendent of the decision to sell other stocks. This provides a benchmark for
what we should expect about the probability of multiple stock sales if there
is no dependency, that is, if there is no intentional bundling or separating of
sales.
Suppose that whether or not a stock is sold on a given day is modeled as
an independent Bernoulli trial.
18
Then the probability of multiple stock sales
from an investor on a given day is a function of the number of winner and
loser stocks in the portfolio and the propensity of the investor to sell each
winner and loser. If the investor has
winners and
losers in her portfolio
n
n
g
l
and the probability that she sells each winner (loser) is
, then the prob-
p ( p )
g
l
ability of multiple stock sales on a sales event can be written as follows:
Pr (Multi p 1) p Pr (no. stocks sold
≥ 2Fno. stocks sold ≥ 1)
n
n
n
⫺1
n
n
n
⫺1
g
l
g
l
g
l
1
⫺ (1 ⫺ p ) (1 ⫺ p ) ⫺ n p (1 ⫺ p )
(1
⫺ p ) ⫺ n p (1 ⫺ p ) (1 ⫺ p )
g
l
g
g
g
l
l
l
g
l
p
.
(5)
n
n
g
l
1
⫺ (1 ⫺ p ) (1 ⫺ p )
g
l
Figure 4 shows the logit of the probability of multiple sales as a function
17.
for less than 5% of the sample.
NSTOCK
1
25
18. Odean’s (1998) proportion of gains realized and proportion of losses realized methodology
is based on the same assumption.
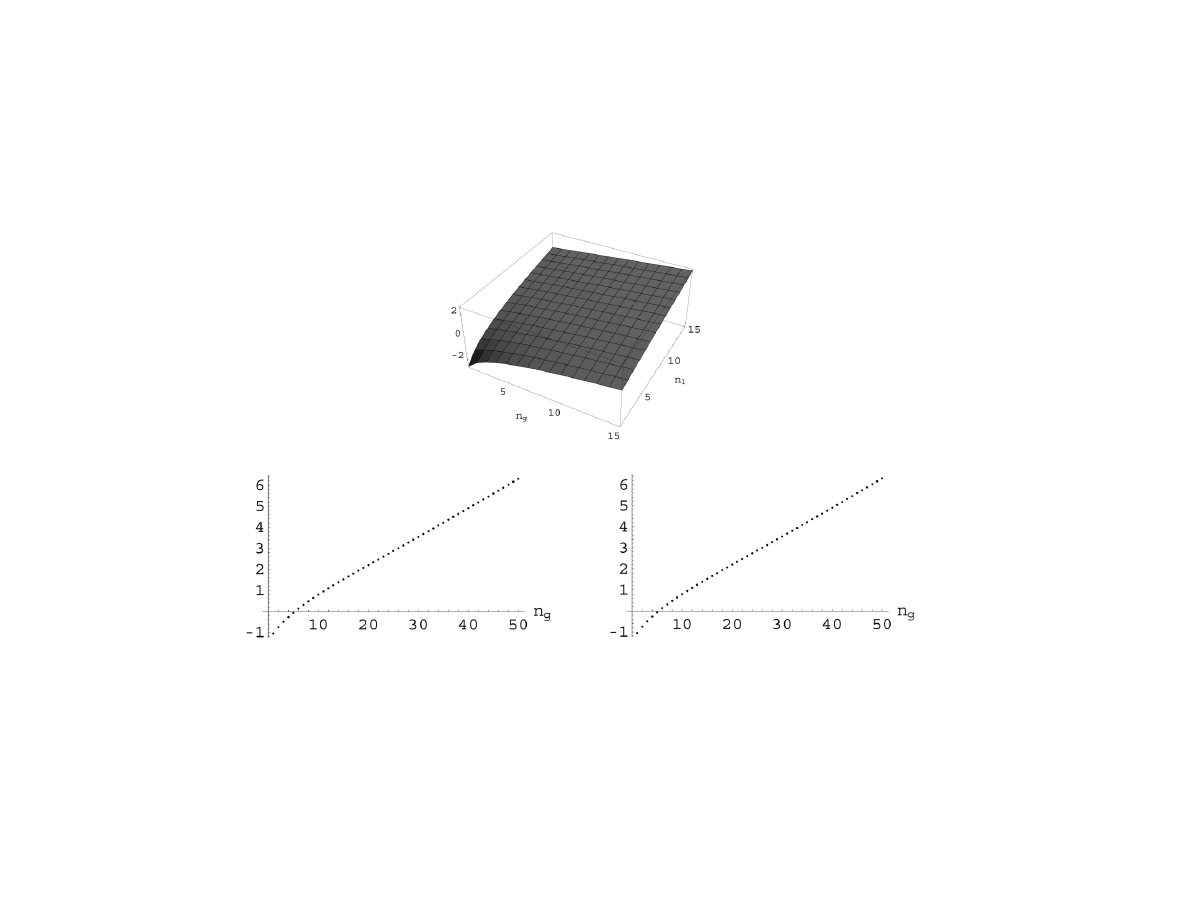
Investor
Losses
and
Gains
2565
Fig. 4.—Logit of the probability of multiple stock sales as a function of the number of winners ( ) and losers ( ) (
,
)
n
n
p p 0.148 p p 0.098
g
l
g
l

2566
Journal of Business
of
and
when
and
.
19
It shows that the logit of the
n
n
p p 0.148
p p 0.098
g
l
g
l
probability of multiple stock sales increases with the number of winners ( )
n
g
and the number of losers ( ) almost linearly except for the lowest values of
n
l
and
. Alternative views of the figure are also presented by fixing
n
n
n (n )
g
l
l
g
at five. The probability of multiple stock sales increases more rapidly with
the number of winners than with the number of losers, since investors are
more likely to sell a winner than a loser (
).
p
1
p
g
l
Suppose we estimate the following logit model:
Pr (Multi p 1) p
L(a
⫹ b n ⫹ b n ⫹ ),
(6)
g
g
l
l
where
L is the logistic cumulative distribution function, equivalent to modeling
the logit of
as a linear function of
and
. The estimated
Pr (Multi p 1)
n
n
g
l
coefficients for the number of winners and the number of losers (
and
)
b
b
g
l
are related to investors’ propensities to sell a winner and a loser, respectively.
If investors are more likely to sell a winner than to sell a loser, as the disposition
effect implies (
; e.g., Odean 1998), and that the decision to sell each
p
1
p
g
l
stock is independent, we expect
. But if we observe
, this indicates
b
1
b
b
!
b
g
l
g
l
that sales decisions of losers are positively correlated or at least that sales
decisions of losers are more positively (less negatively) correlated than sales
decisions of winners.
Table 10 presents the coefficient estimates the following model:
Pr (Multi p 1) p
L(a
⫹ b n ⫹ b n ⫹
b x
⫹ ),
(7)
冘
g
g
l
l
k
k
k
where the
’s are control variables similar to those used in table 9. This
x
k
specification allows for mixed sales of winners and losers, therefore I include
mixed sales in this analysis. Table 10 shows that the estimate of
is always
b
l
greater than the estimate of
across different specifications. Chi-square test
b
g
statistics for the equality of these two coefficients reject the null hypothesis
at the 1% level. If there is no dependency in the sales decisions
H :
b p b
0
g
l
of different stocks,
is greater than
when
. However, a vast amount
b
b
p
1
p
l
g
l
g
of empirical evidence on the disposition effect (see n. 1) shows that a loser
is less likely to be sold than a winner (
). The results in table 10 provide
p
!
p
l
g
further evidence that selling decisions of losers are more positively correlated
with each other than are the selling decisions of winners.
E.
Mixed Sales Events
According to the hedonic editing hypothesis, whether or not investors prefer to
integrate or separate mixed outcomes of gains and losses depends on the relative
magnitudes of the gains and losses. When the net gain is positive (the gain is
larger than the loss), integration is preferred. When the net gain is negative,
segregation is preferred if the gain is relatively very small, and integration is
preferred otherwise. Therefore, the hedonic editing rule for mixed outcomes
19. The values of
and
are based on Odean’s (1998) results.
p
p
g
l

Investor
Losses
and
Gains
2567
TABLE 10
Logistic Analysis of the Propensity to Sell Multiple Stocks: An Alternative Approach
(1)
(2)
(3)
(4)
(5)
(6)
(7)
NLOSER
.043
.043
.039
.036
.036
.036
.035
(31.33)**
(30.85)**
(28.24)**
(27.32)**
(28.02)**
(28.19)**
(27.66)**
NWINNER
.029
.029
.023
.025
.026
.025
.026
(21.66)**
(21.81)**
(17.44)**
(18.33)**
(19.27)**
(19.06)**
(19.52)**
DEC
.162
.087
.085
.111
.097
.106
(5.86)**
(3.53)**
(3.64)**
(5.42)**
(4.51)**
(5.18)**
MARGIN
.094
.064
.064
.064
.064
.063
(5.79)**
(3.95)**
(3.91)**
(3.92)**
(3.91)**
(3.88)**
TAX
⫺.057
.003
.002
.001
.001
.001
(
⫺3.24)**
(
⫺.14)
(
⫺.13)
(
⫺.03)
(
⫺.06)
(
⫺.02)
ACTIVE
.237
.234
.237
.236
.236
(19.67)**
(19.54)**
(20.02)**
(19.81)**
(19.89)**
AFFLUENT
.049
.045
.051
.048
.047
(2.98)**
(2.76)**
(3.08)**
(2.92)**
(2.86)**
DPOSI
⫺1.001
⫺.972
⫺.965
⫺.982
⫺.973
(
⫺7.02)**
(
⫺6.85)**
(
⫺6.85)**
(
⫺6.94)**
(
⫺6.88)**
NTSALES
.001
.001
.001
.001
.001
(9.52)**
(10.95)**
(17.35)**
(16.74)**
(17.46)**
PURCHASE
.447
.444
.449
.449
.446
(34.95)**
(35.28)**
(36.19)**
(36.18)**
(36.06)**
VWHPRET
⫺.021
⫺.034
⫺.029
⫺.023
(
⫺2.01)*
(
⫺3.21)**
(
⫺2.71)**
(
⫺2.24)*

2568
Journal
of
Business
PFRET0
⫺3.863
⫺3.345
(
⫺17.17)**
(
⫺15.96)**
PFRET1
.021
.016
.024
(3.42)**
(2.19)*
(3.41)**
PFRET2_5
⫺.944
⫺.672
⫺.732
(
⫺5.59)**
(
⫺4.03)**
(
⫺4.44)**
PFRET6_20
⫺.135
⫺.039
⫺.061
(
⫺2.02)*
(
⫺.68)
(
⫺1.09)
MKTVOL
14.165
12.325
17.348
(2.35)**
(2.00)*
(2.92)**
MKTRET0
⫺8.096
⫺3.248
(
⫺8.60)**
(
⫺3.43)**
MKTRET1
⫺10.279
⫺11.648
⫺10.234
(
⫺9.54)**
(
⫺10.54)**
(
⫺9.58)**
MKTRET2_5
⫺3.187
⫺2.326
⫺2.055
(
⫺6.48)**
(
⫺4.18)**
(
⫺3.84)**
MKTRET6_20
⫺1.24
⫺1.082
⫺1.047
(
⫺3.77)**
(
⫺3.21)**
(
⫺3.18)**
x
2
(1)
36.06
31.75
46.35
25.33
20.29
23.08
17.02
Pseudo-
2
R
2.79
2.83
3.85
4.02
4.01
3.98
4.11
Observations
425,749
425,749
425,749
425,598
425,749
425,598
425,598
Note.—For each sales event, the dependent variable takes the value of one if multiple stocks are sold and zero if only a single stock is sold. See table 9 for the definitions of independent
variables.
test statistics for testing equality of the coefficient for NWINNER and the coefficient for NLOSER are reported (
). Robust z-statistics adjusted for clustering on calendar
2
x
p p
!
.001
dates are in parentheses.
* Significant at the 5% level.
** Significant at the 1% level.

Investor Losses and Gains
2569
TABLE 11
Percentage of Mixed Sales Events Consistent with the Hedonic
Editing Hypothesis
Cutoff
% Sales Events Consistent with the Hypothesis
Original Sample (%)
Hypothetical Sample (%)
.01
99.47
97.57
.05
96.02
93.87
.1
92.12
89.95
.15
88.50
86.54
Note.—The table examines the composition of mixed sales of winners and losers and reports the percentage
of events that are consistent with the hedonic editing hypothesis. A mixed sales event is consistent with the
hedonic editing hypothesis when the relative magnitudes of realized gains and losses indicate that an aggregated
outcome is preferred to segregated outcomes (F
). For each mixed sales event on which
gain/lossF
≥ cutoff
N
x
winners and
losers are sold,
winners and
losers were randomly selected from the investor’s entire
N
N
N
y
x
y
portfolio to construct a hypothetical mixed sales event. A set of hypothetical mixed sales events, one hypothetical
event for each actual sales event, represents one hypothetical sample. The percentage of sales events that are
consistent with the hedonic editing hypothesis is calculated for each hypothetical sample, and the process is
repeated 1,000 times. p-values (
) are calculated as the percentage of hypothetical samples that have
p p
!
.001
a larger number of consistent events than the original sample.
can be summarized as follows: for
and
,
when
x
1
0
y
!
0 v(x
⫹ y)
!
v(x)
⫹ v(y)
(segregation preferred), and
when
Fx/yF
!
k
v(x
⫹ y)
1
v(x)
⫹ v(y)
Fx/yF
≥ k
(integration preferred).
To test whether investors follow the hedonic editing rule when they realize
gains and losses together, I check whether the combined outcome is preferred
to separate outcomes under the hedonic editing hypothesis for each mixed
sales event.
20
Specifically, I compare the percentage of mixed sales events
consistent with the hypothesis with the corresponding percentage for a sam-
ple of hypothetical mixed sales events. A mixed sales event is consistent
with the hedonic editing hypothesis if the magnitude of the gain and the
loss is such that integration is preferred under the hedonic editing hypothesis
(
).
Fgain/lossF
≥ k
For each mixed sales event on which
winners and
losers are sold, I
N
N
x
y
randomly select
winners and
losers from the investor’s entire portfolio
N
N
x
y
to construct a hypothetical mixed sales event. A set of hypothetical mixed
sales events, one hypothetical event for each actual event, comprise a hy-
pothetical sample. Then the percentage of mixed sales events consistent with
the hypothesis is calculated for each hypothetical sample, for a total of 1,000
such samples. If investors try to follow hedonic editing rules, the percentage
of mixed sales events consistent with the hypothesis should be higher than
what is expected when investors random sell the same number of winners
and losers.
How small should the gain be relative to the loss to make investors prefer
segregation? It depends on the curvature and steepness of the value function.
Since it is not clear what the cutoff value k is, I consider different cutoff
values, ranging from 0.01 to 0.15.
21
Table 11 shows that investors are more
20. I thank an anonymous referee for suggesting such a test.
21. Thaler (1985) used an example with
and
and found that
x p $25
y p
⫺$200(k p 0.125)
subjects prefer segregated outcomes.

2570
Journal of Business
likely to combine sales of winners and losers so that the combined outcome
is more desirable than separate outcomes according to the mental accounting
principles. Regardless of the cutoff value employed, the percentage of sales
events consistent with the hypothesis is greater than what is expected if in-
vestors randomly selected which gains and losses to realize. For instance,
with the cutoff value of 0.1 (i.e., segregation is preferred when the size of
gain is smaller than one-tenth of the size of loss, and integration is preferred
otherwise), 92.12% of mixed sales events are consistent with the hypothesis
for the original sample, while 89.95% of mixed sales are consistent with the
hypothesis for hypothetical samples (
). The result from mixed
p-value
!
0.001
sales events provides additional evidence that mental accounting has a sig-
nificant effect on investors’ selling decisions.
V.
Conclusion
This article examines whether mental accounting of multiple outcomes influ-
ences the way investors sell stocks. I find that investors are more likely to
sell multiple stocks when they realize losses than gains, consistent with the
hedonic editing hypothesis (Thaler 1985) that individuals prefer integrating
losses and segregating gains. Also, the way investors combine sales of
winners and losers shows that investors select which gains and losses to
realize together so that the combined outcome is more desirable than seg-
regated outcomes. These results suggest that mental accounting plays a
significant role in investors’ trading decisions.
Previous studies have examined how mental accounting of multiple out-
comes affects the behavior of market participants in various contexts. Shefrin
and Statman (1993) suggest that the design of financial products may be guided
by the mental accounting principles. They describe how brokers promote
covered calls by framing the cash flow of a covered call into three mental
accounts or “three sources of profit”—the call premium, the dividend, and
the capital gain on the stock. By segregating gains, brokers can make covered
calls more attractive to their clients.
Loughran and Ritter (2002) offer a possible explanation for why issuers
seem willing to leave large amounts of money on the table during initial public
offerings (IPOs). They argue that the loss from underpricing will be aggregated
with a larger gain from the retained shares. Issuers will therefore not be upset
by the large initial underpricing. Based on the idea of Loughran and Ritter
(2002), Ljungqvist and Wilhelm (2005) use the combined value of the loss
from underpricing and the gain from retained shares as a behavioral measure
of the IPO decision-maker’s satisfaction with the underwriter and find that
their behavioral measure has an explanatory power for the choices of under-
writer and fees in subsequent offerings.
If investors are more likely to integrate concurrent events, firms may have
an incentive to strategically time their disclosures to take advantage of investor
preferences. Companies sometimes manage their income statements by ac-

Investor Losses and Gains
2571
counting choices to make poor results look even worse (“take a big bath”).
It has been argued that this method is often utilized in a bad year to artificially
enhance next year’s earnings. Several explanations have been offered for
firms’ incentives to smooth earnings. However, it is somewhat puzzling why
firms smooth earnings and also occasionally take big baths. Mental accounting
of multiple outcomes provides an alternative explanation for the coexistence
of these seemingly opposite behaviors.
22
The mental accounting principles
indicate that stock prices will be, on average, higher if the manager spreads
out good news over time by income smoothing. In contrast, for sufficiently
bad news, it is better to report a big loss and possibly improved profits in a
later period rather than two separate losses. These previous studies and the
new evidence in this article suggest that mental accounting may be an im-
portant factor underlying firm and investor behavior.
References
Ang, Andrew, and Joseph Chen. 2002. Asymmetric correlations of equity portfolios. Journal of
Financial Economics 63:443–94.
Badrinath, S., and Wilber Lewellen. 1991. Evidence on tax-motivated securities trading behavior.
Journal of Finance 46:369–82.
Barber, Brad, and Terrance Odean. 2000. Trading is hazardous to your wealth: The common
stock investment performance of individual investors. Journal of Finance 55:773–806.
———. 2002. Online investors: Do the slow die first? Review of Financial Studies 15:455–87.
———. 2005. All that glitters: The effect of attention and news on the buying behavior of
individual and institutional investors. Working paper, Graduate School of Management and
Haas School of Business, University of California, Berkeley.
Barberis, Nicholas, and Ming Huang. 2001. Mental accounting, loss aversion, and individual
stock returns. Journal of Finance 56:1247–92.
Barberis, Nicholas, Ming Huang, and Jesus Santos. 2001. Prospect theory and asset prices.
Quarterly Journal of Economics 141:1–53.
Benartzi, Shlomo, and Richard Thaler. 1995. Myopic loss aversion and the equity premium
puzzle. Quarterly Journal of Economics 110:73–92.
Dhar, Ravi, and Alok Kumar. 2002. A non-random walk down the main street: Impact of price
trends on trading decisions of individual investors. Working paper, Yale University, New Haven,
CT.
Dhar, Ravi, and Ning Zhu. 2002. Up close and personal: An individual level analysis of the
disposition effect. Working paper 02-20, Yale International Center for Finance, New Haven,
CT.
Ferris, Stephen P., Robert A. Haugen, and Anil K. Makhija. 1988. Predicting contemporary
volume with historic volume at differential price levels: Evidence supporting the disposition
effect. Journal of Finance 43:677–97.
Ferson, Wayne E., and Campbell R. Harvey. 1991. The variation of economic risk premiums.
Journal of Political Economy 99:385–415.
Genesove, David, and Christopher Mayer. 2001. Loss aversion and seller behavior: Evidence
from the housing market. Quarterly Journal of Economics 116:1233–60.
Goetzmann, William N., and Ning Zhu. 2003. Rain or shine: Where is the weather effect? Working
Paper no. 9465, National Bureau of Economic Research, Cambridge, MA.
Grinblatt, Mark, and Bing Han. 2006. Disposition effect and momentum. Journal of Financial
Economics 78, no. 2:311–33.
Grinblatt, Mark, and Matti Keloharju. 2000. The investment behavior and performance of various
22. For rational explanations, see Koch and Wall (2000) and Kirschenheiter and Melumad
(2002).

2572
Journal of Business
investor types: A study of Finland’s unique data set. Journal of Financial Economics 55:
43–67.
———. 2001a. How distance, language and culture influence stock holdings and trades. Journal
of Finance 56:1053–73.
———. 2001b. What makes investors trade? Journal of Finance 56:589–616.
Harris, Lawrence, and Joel Hasbrouck. 1996. Market vs. limit orders: The super DOT evidence
on order submission strategy. Journal of Financial and Quantitative Analysis 31:213–31.
Hirshleifer, David. 2001. Investor psychology and asset pricing. Journal of Finance 64:1533–97.
Hirshleifer, David, James Myers, Linda A. Myers, and Siew Hong Teoh. 2003. Do individual
investors drive post-earnings announcement drift? Working paper, Fisher College of Business,
Ohio State University, and University of Illinois at Urbana-Champaign.
Hirst, D. Eric, Edward J. Joyce, and Michael S. Schadewald. 1994. Mental accounting and
outcome contiguity in consumer borrowing decisions. Organizational Behavior and Human
Decision Processes 58:136–52.
Hong, Dong, and Alok Kumar. 2002. What induces noise trading around public announcement
events? Working paper, Cornell University, Department of Economics, Ithaca, NY.
Kahneman, Daniel, and Jackie Snell. 1990. Predicting utility. In Insights in decision making: A
tribute to Hillel J. Einhorn, ed. R. M. Hogarth. Chicago: University of Chicago Press.
Kahneman, Daniel, and Amos Tversky. 1979. Prospect theory: An analysis of decision under
risk. Econometrica 47:263–91.
Kirschenheiter, Michael, and Nahum D. Melumad. 2002. Can “big bath” and earnings smoothing
coexist as equilibrium financial reporting strategies? Journal of Accounting Research 40:
761–96.
Koch, Timothy W., and Larry D. Wall. 2000. The use of accruals to manage reported earnings:
Theory and evidence. Working Paper 2000-23, Federal Reserve Bank of Atlanta.
Kumar, Alok. 2005. Style switching and stock returns. Working paper, University of Notre Dame,
Mendoza School of Business, South Bend, IN.
Kyle, Albert, and Wei Xiong. 2001. Contagion as a wealth effect. Journal of Finance 56:1401–40.
Lakonishok, Josef, and Seymour Smidt. 1986. Volume for winners and losers: Taxation and other
motives for stock trading. Journal of Finance 41:951–74.
Linnainmaa, Juhani. 2003. Who makes the limit order book? Implications on contrarian strategies
and the disposition effect. Working paper, University of California, Los Angeles.
Linville, Patricia W., and Gregory W. Fischer. 1991. Preferences for separating or combining
events. Journal of Personality and Social Psychology 60:5–23.
Ljungqvist, Alexander, and William J. Wilhelm. 2005. Does prospect theory explain IPO market
behavior? Journal of Finance 60, no. 4:1759–90.
Locke, Peter R., and Steven C. Mann. 2005. Professional trader discipline and trader disposition.
Journal of Financial Economics 76, no. 2:401–44.
Longin, Francois, and Bruno Solnik. 2001. Extreme correlation of international equity markets.
Journal of Finance 56:649–76.
Loughran, Tim, and Jay R. Ritter. 2002. Why don’t issuers get upset about leaving money on
the table in IPOs? Review of Financial Studies 15:413–43.
Moskowitz, Tobias J., and Mark Grinblatt. 1999. Do industries explain momentum? Journal of
Finance 54:1249–90.
Odean, Terrance. 1998. Are investors reluctant to realize their losses? Journal of Finance 53:
1775–98.
———. 1999. Do investors trade too much? American Economic Review 89:1279–98.
Ortega, Bob. 1998. In Sam we trust: The untold story of Sam Walton and how Wal-Mart is
devouring America. New York: Times Business.
Poterba, James M., and Scott J. Weisbenner. 2001. Capital gains tax rules, tax-loss trading, and
turn-of-the-year returns. Journal of Finance 56:353–68.
Ritter, Jay R. 1988. The buying and selling behavior of individual investors at the turn of the
year. Journal of Finance 43:701–17.
Shapira, Zur, and Itzhak Venezia. 2001. Patterns of behavior of professionally managed and
independent investors. Journal of Banking and Finance 25:1573–87.
Shefrin, Hersh, and Meir Statman. 1985. The disposition to sell winners too early and ride losers
too long: Theory and evidence. Journal of Finance 40:777–90.
———. 1993. Behavioral aspects of the design and marketing of financial products. Financial
Management 22:123–34.
Thaler, Richard H. 1985. Mental accounting and consumer choice. Marketing Science 4:199–214.

Investor Losses and Gains
2573
Thaler, Richard H., and Eric J. Johnson. 1990. Gambling with the house money and trying to
break even: The effects of prior outcomes on risky choice. Management Science 36:643–60.
Weber, Martin, and Colin Camerer. 2000. The disposition effect in securities trading: An ex-
perimental analysis. Journal of Economic Behavior and Organization 33:167–84.
Zhu, Ning. 2002. The local bias of individual investors. Working Paper no. 02-30, Yale ICF,
New Haven, CT.

Wyszukiwarka
Podobne podstrony:
więcej podobnych podstron