Applying Population
Ecology: Human Population
and Urbanization
The Ecocity Concept in Curitiba, Brazil
C O R E C A S E S T U D Y
7
City
center
Interdistrict
Express
Feeder
Route
Direct
Workers
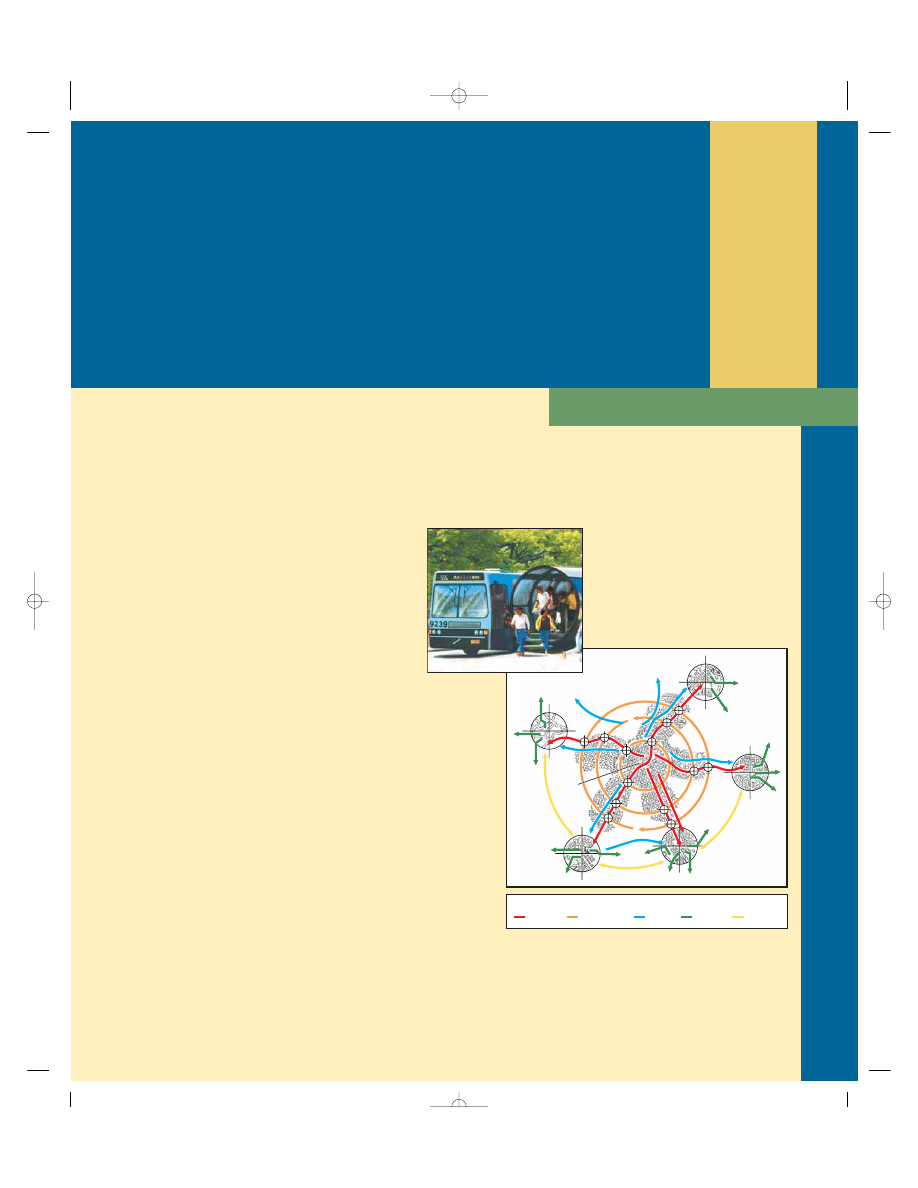
Figure 7-1
Solutions:
bus system in Curitiba, Brazil. This system moves
large numbers of passengers around rapidly because each of the five
major spokes has two express lanes used only by buses. Double- and
triple-length bus sections are hooked together as needed to carry up to
300 passengers. Boarding is speeded up by the use of extra-wide doors
and raised tubes that allow passengers to pay before getting on the bus
(top left).
About 95% of its citizens can read and write, and 83% of
adults have at least a high school education. All school children
study ecology. Polls show that 99% of the city’s inhabitants
would not want to live anywhere else.
This internationally acclaimed model of urban planning
and sustainability is the brainchild of
architect and former college teacher
Jaime Lerner, who has served as the
city’s mayor three times since 1969. It
will be an exciting challenge during
this century to reshape existing cities
and design new ones using the
Curitiba model.
Hardly any of today’s urban areas, where half of the world’s peo-
ple live, are environmentally sustainable, although some are
striving to become more sustainable. During this century, envi-
ronmental and urban designers envision more of the world’s
growing urban population living in more environmentally sustain-
able cities, called ecocities or green cities. This is not
just a futuristic dream. One such ecocity is Curitiba, a
city of 2 million people that is known as the “ecologi-
cal capital” of Brazil.
Planners in this city, with its clean air and tree-
lined streets, decided in 1969 to focus on an inexpen-
sive and efficient mass transit system rather than on
the car. Curitiba now has the world’s best bus system,
in which clean and modern buses transport about
72% of the population every day throughout the city
along express lanes dedicated to buses (Figure 7-1).
Only high-rise apartment buildings are allowed near
major bus routes, and each building must devote its
bottom two floors to stores—a practice that reduces
the need for residents to travel. Bike paths run throughout most
of the city. Cars are banned from 49 blocks in the center of the
downtown area, which has a network of pedestrian walkways
connected to bus stations, parks, and bicycle paths.
The city transformed flood-prone areas along its rivers into a
series of interconnected parks crisscrossed with bicycle paths.
Volunteers have planted more than 1.5 million trees throughout
the city, none of which can be cut down without a permit, and
two trees must be planted for each one cut down.
Curitiba recycles roughly 70% of its paper and 60% of its
metal, glass, and plastic, which is collected from households
three times a week. Recovered materials are sold mostly to the
city’s more than 500 major industries, which must meet strict
pollution standards.
The city uses old buses as roving classrooms to train its poor
in the basic skills needed for jobs. Other retired buses have be-
come health clinics, soup kitchens, and day-care centers, which
are open 11 hours a day and are free for low-income parents.
The city tries to provide water, sewage, and bus service for
most of its growing and unplanned squatter settlements. It has
designed tracts of land for settlements with clean running water
as a way to reduce the spread of infectious disease. The city has
a build-it-yourself system that gives a poor family a plot of land,
building materials, two trees, and an hour’s consultation with
an architect.
83376_08_ch07_p123-148.ctp 8/10/07 12:22 PM Page 123

124
Key Questions and Concepts
7-1
How many people can the earth support?
C O N C E P T 7 - 1
We do not know how long we can continue
increasing the earth’s carrying capacity for humans without seri-
ously degrading the life-support system for us and many other
species.
7-2
What factors influence population size?
C O N C E P T 7 - 2 A
Population size increases because of births and
immigration and decreases through deaths and emigration.
C O N C E P T 7 - 2 B
The average number of children born to
women in a population (total fertility rate) is the key factor that
determines the population size.
7-3
How does a population’s age structure affect
its growth or decline?
C O N C E P T 7 - 3
The numbers of males and females in young,
middle, and older age groups determine how fast populations grow
or decline.
7-4
How can we slow population growth?
C O N C E P T 7 - 4
Experience indicates that the most effective ways
to slow population growth are to invest in family planning, to
reduce poverty, and to elevate the status of women.
7-5
What are the major population and
environmental problems of urban areas?
C O N C E P T 7 - 5
Cities can improve individual lives, but most cities
are unsustainable because of high levels of resource use, waste,
pollution, and poverty.
7-6
How does transportation affect urban
development?
C O N C E P T 7 - 6
A combination of plentiful land, inexpensive fuel,
and an expanding network of highways results in dispersed cities
that depend on motor vehicles for most transportation.
7-7
How can cities become more sustainable
and livable?
C O N C E P T 7 - 7
An ecocity allows people to: choose walking,
biking, or mass transit for most transportation needs; recycle or
reuse most of their wastes; grow much of their food; and protect
biodiversity by preserving surrounding land.
The problems to be faced are vast and complex,
but come down to this:
6.7 billion people are breeding exponentially.
The process of fulfilling their wants and needs
is stripping earth of its biotic capacity to produce life;
a climactic burst of consumption
by a single species is overwhelming
the skies, earth, waters, and fauna.
PAUL HAWKEN
Human Population Growth Continues
But Is Unevenly Distributed
For most of history, the human population grew slowly
(Figure 1-1, left part of curve, p. 5). But for the past
200 years, the human population has experienced
rapid exponential growth reflected in the characteristic
J-curve (Figure 1-1, right part of curve, p. 5).
Three major factors account for this population in-
crease. First, humans developed the ability to expand
into diverse new habitats and different climate zones.
Second, the emergence of early and modern agriculture
7-1
How Many People Can the Earth Support?
C O N C E P T 7 - 1
We do not know how long we can continue increasing the earth’s carrying
capacity for humans without seriously degrading the life-support system for us and many
other species.
Links:
refers to the Core Case Study.
refers to the book’s sustainability theme.
indicates links to key concepts in earlier chapters.
Note: Supplements 3 and 4 can be used with this chapter.
83376_08_ch07_p123-148.ctp 8/10/07 12:22 PM Page 124

continue increasing the earth’s carrying capacity for
our species by sidestepping many of the factors that
sooner or later limit the growth of any population?
No one knows, but mounting evidence indicates
that we are steadily degrading the natural capital
(
Concept 1-1A
, p. 6, and Figure 1-6, p. 12)
that keeps us and other species alive and
supports our economies (
Concept 7-1
).
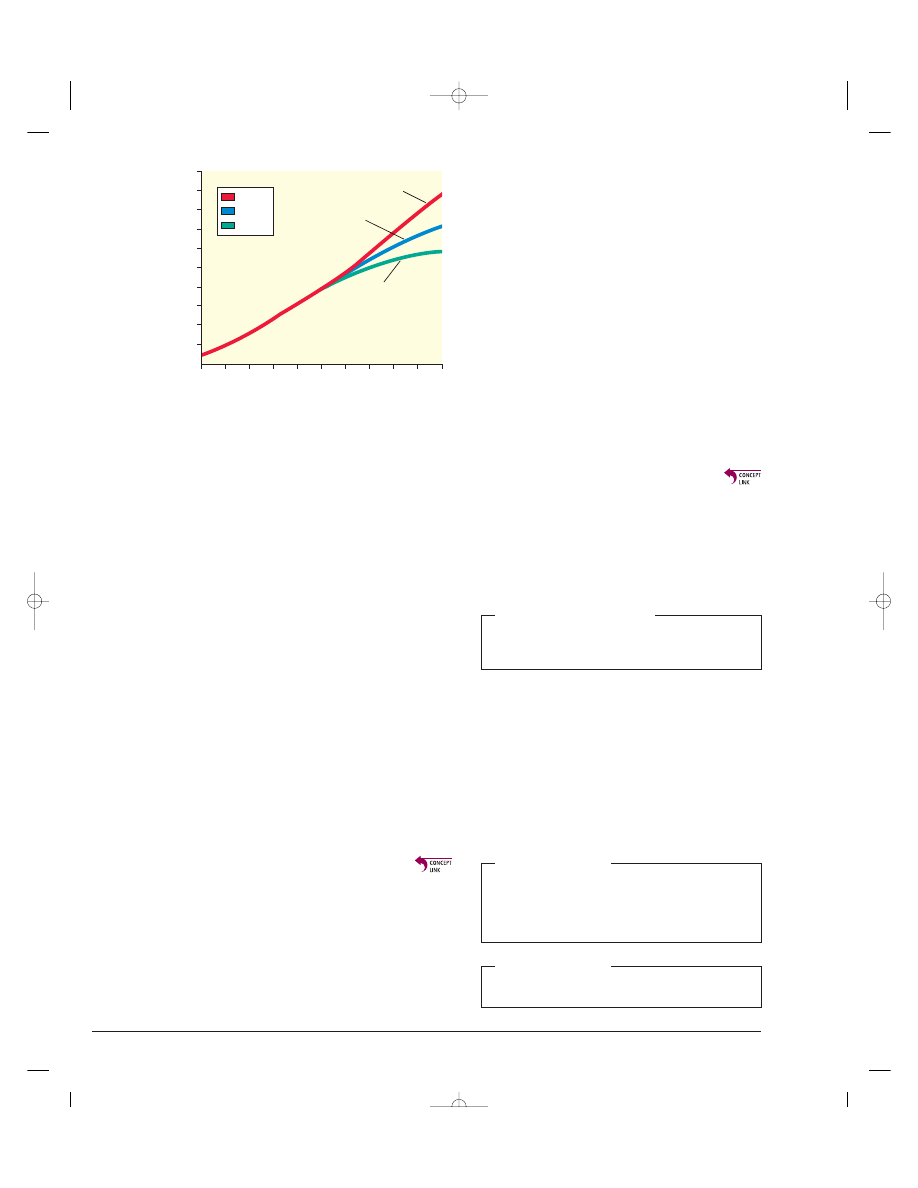
How many of us are likely to be here in 2050? An-
swer: 7.2–10.6 billion people, depending mostly on
projections about the average number of babies
women are likely to have. The medium projection is
9.2 billion people (Figure 7-3, p. 126). About 97% of
this growth is projected to take place in developing
countries, where acute poverty is a way of life for
about 1.4 billion people. Are there too many people on
the earth? Some say yes and some say no, as discussed
in the Case Study that follows.
allowed more people to be fed per unit of land area.
Third, the development of sanitation systems, antibi-
otics, and vaccines helped control infectious disease
agents. As a result, death rates dropped sharply below
birth rates and the population grew rapidly.
About 10,000 years ago when agriculture began,
there were about 5 million humans on the planet; now
there are 6.7 billion of us. It took from the time we ar-
rived until about 1927 to add the first 2 billion people to
the planet; less than 50 years to add the next 2 billion
(by 1974); and just 25 years to add the next 2 billion (by
1999)—an illustration of the awesome power of expo-
nential growth (
Core Case Study
, p. 5). By 2012 we will
be trying to support 7 billion people and perhaps 9.2 bil-
lion by 2050.
The rate of population growth has slowed, but the
world’s population is still growing exponentially at a
rate of 1.23% a year. This meant that 82 million people
were added to the world’s population during 2007—an
average of nearly 225,000 more people each day, or 2.4
more people every time your heart beats.
Geographically this growth is unevenly distributed.
About 1.2 million of these people were added to the
1.2 billion people living in the developed countries
growing at 0.1% a year. About 80.8 million were
added to the 5.6 billion people in developing countries
growing 15 times faster at 1.5% a year. In other
words, most of the world’s population growth takes
place in already heavily populated parts of the world,
which are the least equipped to deal with the pres-
sures of such rapid growth.
We Do Not Know How Long
the Human Population Can
Keep Growing
To survive and provide resources for growing numbers
of people, humans have modified, cultivated, built on,
or degraded a large and increasing portion of the
earth’s natural systems. Our activities have directly af-
fected to some degree about 83% of the earth’s land
surface, excluding Antarctica (Figure 3 on p. S16–S17
in Supplement 4), as our ecological footprints have
spread across the globe (
Concept 1-3
, p. 11,
and Figure 1-8, p. 13).
We have used technology to alter much of the rest
of nature to meet our growing needs and wants in
eight major ways (Figure 7-2).
Examine how resources have been depleted or
degraded around the world at ThomsonNOW.
Scientific studies of populations of other
species tell us that no population can continue
growing indefinitely (
Concept 6-5
, p. 117), which
is one of the four
scientific principles of sustain-
ability
(Figure 1-13, p. 20). How long can we
CONCEPT 7-1
125
N A T U R A L C A P I T A L
D E G R A D A T I O N
Reduction of biodiversity
Increasing use of the earth's net primary productivity
Increasing genetic resistance of pest species and disease-
causing bacteria
Elimination of many natural predators
Deliberate or accidental introduction of potentially
harmful species into communities
Using some renewable resources faster than they can be
replenished
Interfering with the earth's chemical cycling and energy
flow processes
Relying mostly on polluting fossil fuels
Altering Nature to Meet Our Needs
Active Figure 7-2
Major ways humans have altered the rest of nature
to meet our growing population and its resource needs and wants (
Concept 7-1
) See
an animation based on this figure at ThomsonNOW. Questions: Which three of these
items do you believe have been the most harmful? Why? How does your lifestyle con-
tribute directly or indirectly to each of these items?
83376_08_ch07_p123-148.ctp 8/10/07 12:22 PM Page 125
■
✓
■
C A S E S T U D Y
Are There Too Many of Us?
Each week about 1.6 million people are added to the
world’s population. As a result, the number of people
on the earth is projected to increase from 6.7 to 9.2 bil-
lion or more between 2007 and 2050 (Figure 7-3), with
most of this growth occurring in developing countries.
This raises an important question: Can the world provide
an adequate standard of living for a projected 2.5 billion more
people by 2050 without suffering widespread environmental
damage? There is disagreement over the answer to this
question.
According to some analysts, the planet already has
too many people collectively degrading the earth’s natu-
ral capital. To some, the problem is the sheer number of
people in developing countries with 82% of the world’s
population. To others, it is high resource consumption
rates in developed countries—and to an increasing ex-
tent in rapidly developing countries such as China and
India—that magnify the environmental impact of each
person (Figure 1-8, p. 13, and Case Study, p. 13). To
many, both population growth and resource consump-
tion per person are important causes of the environ-
mental problems we face (
Concept 1-5A
, p. 15).
Others point out that technological ad-
vances have allowed humans to avoid the environ-
mental resistance that all populations face (Figure 6-11,
p. 119) and increase the earth’s carrying capacity
for humans. They see no reason for this to end and be-
lieve that the world can support billions more people.
They also see more people as a valuable resource for
solving environmental and other problems and for
stimulating economic growth by increasing the number
of consumers.
As a result, they see no need for controlling the
world’s population growth. Some people also view any
form of population regulation as a violation of their re-
ligious or moral beliefs. Others see it as an intrusion
into their privacy and personal freedom to have as
many children as they want.
Proponents of slowing and eventually stopping
population growth have a different view. They point
out that we now fail to provide the basic necessities for
about one of every five people—a total of about 1.4 bil-
lion (Figure 1-11, p. 16). They ask, how will we be able
to do so for the projected 2.5 billion more people by
2050?
They also warn of two serious consequences if we
do not sharply lower birth rates. First, death rates may
increase because of declining health and environmental
conditions in some areas, as is already happening in
parts of Africa. Second, resource use and environmental
degradation (Figure 1-6, p. 12) may intensify as more
consumers increase their already large ecological foot-
prints in developed and rapidly developing countries
(
Concept 1-3
, p. 11, and Figure 1-8, p. 13). This
could increase environmental stresses such as
infectious disease, biodiversity losses, water shortages,
traffic congestion, pollution of the seas, and climate
change.
This debate over interactions among population
growth, economic growth, politics, and moral beliefs is
one of the most important and controversial issues in
environmental science.
HOW WOULD YOU VOTE?
Should the population of the country where you live be
stabilized as soon as possible? Cast your vote online at
www.thomsonedu.com/biology/miller.
How many people can the earth support indefi-
nitely? Some say about 2 billion. Others say as many as
30 billion.
Some analysts believe this is the wrong question.
Instead, they say, we should ask what the optimum sus-
tainable population of the earth might be, based on the
planet’s cultural carrying capacity. Such an optimum level
would allow most people to live in reasonable comfort
and freedom without impairing the ability of the planet
to sustain future generations. (See the Guest Essay on
this topic by Garrett Hardin at ThomsonNOW™.)
THINKING ABOUT
Population Growth
What do you think is (a) the maximum human population
size and (b) the optimum human population size? How do
your answers reflect your position on whether the world is
overpopulated?
RESEARCH FRONTIER
Determining the optimum sustainable population size for the
earth and for various regions
126
CHAPTER 7
Applying Population Ecology: Human Population and Urbanization
12
11
10
9
8
7
6
5
4
3
2
Population (billions)
High
Medium
Low
Year
1950 1960 1970 1980 1990 2000 2010 2020 2030 2040 2050
High
10.8
Medium
9.2
Low
7.8
Figure 7-3 Global connections: UN world population projections,
assuming that by 2050 women have an average of 2.5 children
(high estimate), 2.0 children (medium), or 1.5 children (low). The
most likely projection is the medium one—9.2 billion by 2050. (Data
from United Nations)
83376_08_ch07_p123-148.ctp 8/10/07 12:22 PM Page 126

CONCEPTS 7-2A AND 7-2B
127
1.3 billion
1.5 billion
1.1 billion
302 million
349 million
1.4 billion
China
India
USA
189 million
229 million
232 million
271 million
144 million
205 million
149 million
190 million
169 million
229 million
142 million
128 million
Brazil
Nigeria
Bangladesh
Pakistan
Russia
128 million
119 million
Japan
Indonesia
2007
2025
Figure 7-4 Global connections: the world’s 10 most populous
countries in 2007, with projections of their population sizes in 2025
(Data from World Bank and Population Reference Bureau)
Populations Can Grow, Decline,
or Remain Fairly Stable
On a global basis, if there are more births than deaths
during a period of time, the earth’s population increases
and when the reverse is true, it decreases. When births
equal deaths, population size stabilizes (
Concept 7-2A
).
In particular countries, cities, or other areas, hu-
man populations grow or decline through the interplay
of three factors: births (fertility), deaths (mortality), and
migration. We can calculate population change of an
area by subtracting the number of people leaving a
population (through death and emigration) from the
number entering it (through birth and immigration)
during a specified period of time (usually one year)
(
Concept 7-2A
).
Population
change
⫽ (Births ⫹ Immigration) ⫺ (Deaths ⫹ Emigration)
When births plus immigration exceed deaths plus emi-
gration, population increases; when the reverse is true,
population declines.
Instead of using the total numbers of births and
deaths per year, population experts (demographers)
use the birth rate, or crude birth rate (the number
of live births per 1,000 people in a population in a
given year), and the death rate, or crude death rate
(the number of deaths per 1,000 people in a population
in a given year).
What five countries had the largest numbers of peo-
ple in 2007? Number 1 is China with 1.3 billion people,
or one of every five people in the world. Number 2 is
India with 1.1 billion people, or one of every six people.
Together China and India have 37% of the world’s pop-
ulation. The United States, with 300 million people in
2007, has the world’s third largest population but only
4.5% of the world’s people.
Can you guess the next two most populous coun-
tries? What three countries are expected to have the
most people in 2025? Look at Figure 7-4 to see if your
answers are correct.
Women Are Having Fewer Babies
But Not Few Enough to Stabilize
the World’s Population
Another measurement used in population studies is
fertility rate, the number of children born to a
woman during her lifetime. Two types of fertility rates
affect a country’s population size and growth rate. The
first type, called the replacement-level fertility rate,
is the average number of children that couples in a
population must bear to replace themselves. It is
slightly higher than two children per couple (2.1 in de-
veloped countries and as high as 2.5 in some develop-
ing countries), mostly because some children die before
reaching their reproductive years.
Does reaching replacement-level fertility bring an
immediate halt to population growth? No, because so
many future parents are alive. If each of today’s couples
had an average of 2.1 children, they would not be con-
tributing to population growth. But if all of today’s girl
children also have 2.1 children, the world’s population
will continue to grow for 50 years or more (assuming
death rates do not rise).
The second type of fertility rate, the total fertility
rate (TFR), is the average number of children born to
women in a population during their reproductive
years. This factor plays a key role in determining popu-
lation size (
Concept 7-2B
). The average fertility rate has
been declining. In 2007, the average global TFR was
2.7 children per woman: 1.6 in developed countries
7-2
What Factors Influence Population Size?
C O N C E P T 7 - 2 A
Population size increases because of births and immigration and
decreases through deaths and emigration.
C O N C E P T 7 - 2 B
The average number of children born to women in a population (total
fertility rate) is the key factor that determines population size.
83376_08_ch07_p123-148.ctp 8/10/07 12:22 PM Page 127
(down from 2.5 in 1950) and 2.9 in developing coun-
tries (down from 6.5 in 1950). Although the decline in
TFR in developing countries is impressive, the TFR re-
mains far above the replacement level of 2.1, not low
enough to stabilize the world’s population in the near
future.
■
C A S E S T U D Y
The U.S. Population Is Growing
Rapidly
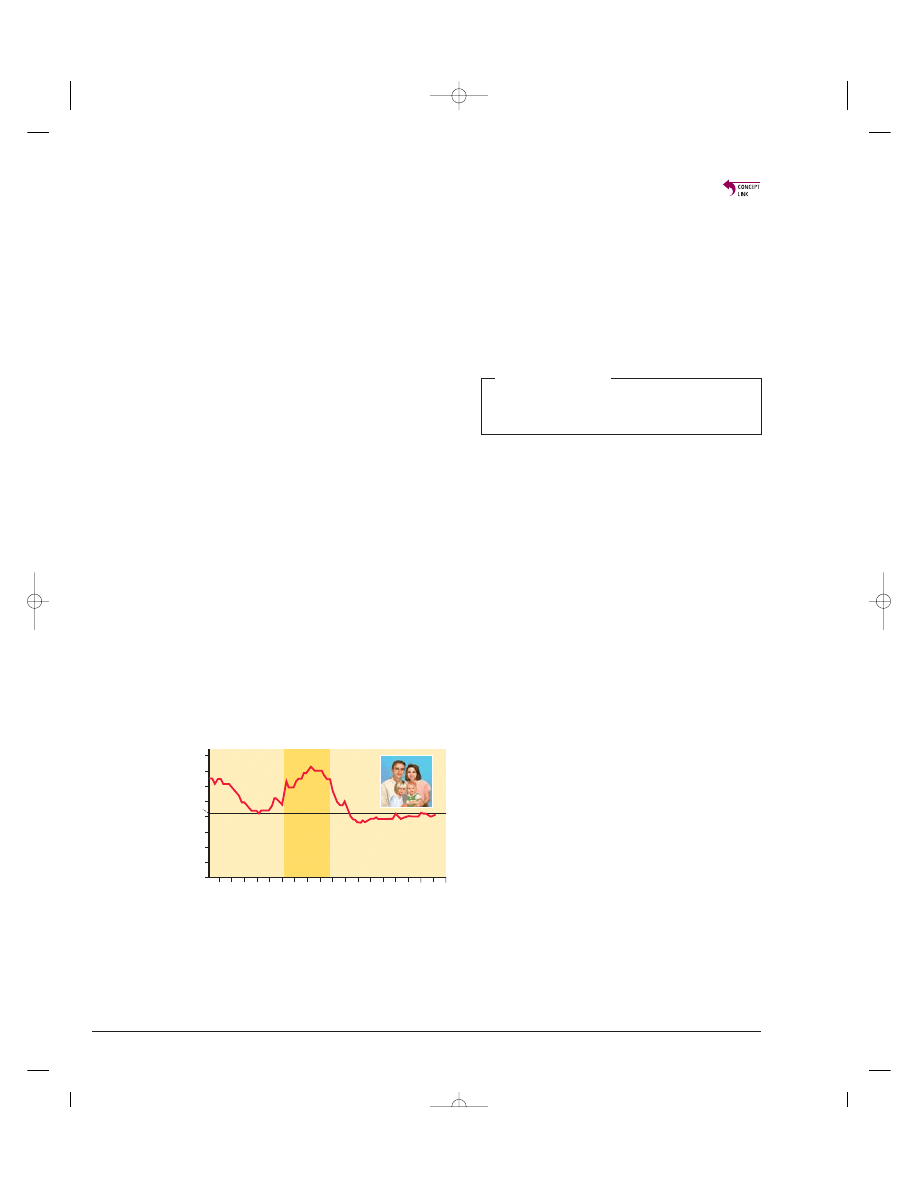
The population of the United States grew from 76 mil-
lion in 1900 to 302 million in 2007, despite oscilla-
tions in the country’s TFR (Figure 7-5) and birth rates.
The period of high birth rates between 1946 and 1964
is known as the baby boom, when 79 million people
were added to the U.S. population. In 1957, the peak
of the baby boom, the TFR reached 3.7 children per
woman. Since then, it has generally declined, remain-
ing at or below replacement level since 1972. In 2007,
the TFR was 2.05 children per woman, compared to
only 1.6 in China.
The drop in the TFR has led to a decline in the rate
of population growth in the United States. But the
country’s population is still growing faster than that of
any other developed country, and that of China, and is
not close to leveling off. About 2.8 million people (one
person every 11 seconds) were added to the U.S. pop-
ulation in 2007. About 60% (1.7 million) of this
growth occurred because births outnumbered deaths
and 40% (1.1 million) came from legal and illegal im-
migration (with someone migrating to the U.S. every
30 seconds).
In addition to the almost fourfold increase in popula-
tion growth since 1900, some amazing changes in
lifestyles took place in the United States during the 20th
century (Figure 7-6), which led to dramatic increases in
per capita resource use and a much larger U.S. ecological
footprint (
Concept 1-3
, p. 11).
According to U.S. Census Bureau, the
U.S. population is likely to increase from 302 million in
2007 to 419 million by 2050 and then to 571 million
by 2100. In contrast, population growth has slowed in
other major developed countries since 1950, most of
which are expected to have declining populations after
2010. Because of a high per capita rate of resource use
and the resulting waste and pollution, each addition to
the U.S. population has an enormous environmental
impact (Figure 1-8, p. 13, and Figure 7 on pp. S20–S21
in Supplement 4).
THINKING ABOUT
Overpopulation
Do you think the United States or the country where you live
is overpopulated? Explain.
Several Factors Affect
Birth Rates and Fertility Rates
Many factors affect a country’s average birth rate and
TFR. One is the importance of children as a part of the labor
force. Proportions of children working tend to be higher
in developing countries.
Another economic factor is the cost of raising and ed-
ucating children. Birth and fertility rates tend to be lower
in developed countries, where raising children is much
more costly because they do not enter the labor force
until they are in their late teens or twenties. In the
United States, it costs about $250,000 to raise a middle-
class child from birth to age 18.
The availability of private and public pension systems
can affect a couple’s decision on how many children to
have. Pensions reduce a couple’s need to have many
children to help support them in old age.
Urbanization plays a role. People living in urban ar-
eas usually have better access to family planning serv-
ices and tend to have fewer children than do those living
in rural areas where children are often needed to help
raise crops and carry daily water and fuelwood supplies.
Another important factor is the educational and em-
ployment opportunities available for women. TFRs tend to
be low when women have access to education and paid
employment outside the home. In developing coun-
tries, a woman with no education typically has two
more children than does a woman with a high school
education. In nearly all societies, better-educated
women tend to marry later and have fewer children.
Another factor is the infant mortality rate—the
number of children per 1,000 live births who die be-
fore one year of age. In areas with low infant mortality
rates, people tend to have fewer children because
fewer children die at an early age.
128
CHAPTER 7
Applying Population Ecology: Human Population and Urbanization
Births per woman
4.0
3.5
3.0
2.5
2.0
1.5
1.0
0.5
0
2.1
1920 1930 1940 1950 1960 1970 1980 1990
Year
Baby boom
(1946–64)
2000 2010
Replacement
level
Figure 7-5 Total fertility rates for the United States between 1917
and 2007. Question: The U.S. fertility rate has declined and re-
mained at or below replacement levels since 1972, so why is the
population of the United States still increasing? (Data from Popula-
tion Reference Bureau and U.S. Census Bureau)
83376_08_ch07_p123-148.ctp 8/10/07 12:22 PM Page 128

Average age at marriage (or, more precisely, the aver-
age age at which a woman has her first child) also plays
a role. Women normally have fewer children when
their average age at marriage is 25 or older.
Birth rates and TFRs are also affected by the avail-
ability of legal abortions. Each year about 190 million
women become pregnant. The United Nations and the
World Bank estimate that 46 million of these women
get abortions—26 million of them legal and 20 million
illegal (and often unsafe). Also, the availability of reliable
birth control methods allows women to control the num-
ber and spacing of the children they have.
Religious beliefs, traditions, and cultural norms also play
a role. In some countries, these factors favor large fami-
lies and strongly oppose abortion and some forms of
birth control.
Several Factors Affect
Death Rates
The rapid growth of the world’s population over the
past 100 years is not primarily the result of a rise in the
crude birth rate. Instead, it has been caused largely by a
decline in crude death rates, especially in developing
countries.
More people started living longer and fewer infants
died because of increased food supplies and distribu-
tion, better nutrition, medical advances such as immu-
nizations and antibiotics, improved sanitation, and
safer water supplies (which curtailed the spread of
many infectious diseases).
Two useful indicators of the overall health of people
in a country or region are life expectancy (the aver-
age number of years a newborn infant can expect to
live) and the infant mortality rate. Between 1955 and
2007, the global life expectancy increased from 48
years to 68 years (77 years in developed countries and
66 years in developing countries) and is projected to
reach 74 by 2050. Between 1900 and 2007, life ex-
pectancy in the United States increased from 47 to 78
years and by 2050 is projected to reach 82 years. In the
world’s poorest countries, however, life expectancy is
49 years or less and may fall further because of more
deaths from AIDS.
Infant mortality is viewed as one of the best single
measures of a society’s quality of life because it reflects
a country’s general level of nutrition and health care. A
high infant mortality rate usually indicates insufficient
food (undernutrition), poor nutrition (malnutrition), and
a high incidence of infectious disease (usually from
contaminated drinking water and weakened disease re-
sistance due to undernutrition and malnutrition).
Between 1965 and 2007, the world’s infant mortal-
ity rate dropped from 20 to 6.0 in developed countries
and from 118 to 49 in developing countries. This is good
news, but annually, more than 4 million infants (most in
developing countries) die of preventable causes during
CONCEPTS 7-2A AND 7-2B
129
Life expectancy
Married women working
outside the home
High school
graduates
Homes with
flush toilets
Homes with
electricity
Living in
suburbs
Hourly manufacturing job
wage (adjusted for inflation)
Homicides per
100,000 people
47 years
77 years
8%
1900
2000
81%
15%
83%
10%
98%
2%
99%
10%
52%
$3
$15
1.2
5.8
Figure 7-6 Some major changes that took place in the United States between 1900 and 2000.
Question: Which two of these changes do you think were the most important? Why? (Data from
U.S. Census Bureau and Department of Commerce)
83376_08_ch07_p123-148.ctp 8/10/07 12:22 PM Page 129

■
✓
their first year of life—an average of 11,000 mostly un-
necessary infant deaths per day. This is equivalent to 55
airline jets, each loaded with 200 infants younger than
age 1, crashing each day with no survivors!
The U.S. infant mortality rate declined from 165 in
1900 to 6.5 in 2007. This sharp decline was a major
factor in the marked increase in U.S. average life ex-
pectancy during this period. Still, some 49 countries
(most in Europe) had lower infant mortality rates than
the United States in 2007. Three factors helped keep
the U.S. infant mortality rate higher than it could be:
inadequate health care for poor women during pregnancy
and for their babies after birth, drug addiction among preg-
nant women, and a high birth rate among teenagers.
Migration Affects
an Area’s Population Size
The third factor in population change is migration:
the movement of people into (immigration) and out of
(emigration) specific geographic areas.
Most people migrating from one area or country to
another seek jobs and economic improvement. But
some are driven by religious persecution, ethnic con-
flicts, political oppression, wars, and environmental
degradations such as water and food shortages and soil
erosion. According to a U.N. study, there were about
25 million environmental refugees in 2005 and the num-
ber could reach 50 million by 2010. In a globally
warmer world, the number could soar to at least 150
million and perhaps to 250 million or more before the
end of this century (See more on this in the Guest Es-
say on this topic by Norman Myers at ThomsonNOW.).
■
C A S E S T U D Y
The United States: A Nation
of Immigrants
Since 1820, the United States has admitted almost
twice as many immigrants and refugees as all other
countries combined. The number of legal immigrants
(including refugees) has varied during different periods
because of changes in immigration laws and rates of
economic growth (Figure 7-7). Currently, legal and il-
legal immigration account for about 40% of the coun-
try’s annual population growth.
Between 1820 and 1960, most legal immigrants to
the United States came from Europe. Since 1960, most
have come from Latin America (53%) and Asia (25%),
followed by Europe (14%). In 2007, Latinos (67% of
them from Mexico) made up 14% of the U.S. popula-
tion, and by 2050, are projected to make up 25% of the
population. According to the Pew Hispanic Center,
53% of the 100 million Americans that were added to
the population between 1967 and 2006 were either
immigrants or their children.
There is controversy over whether to reduce legal
immigration to the United States. Some analysts would
accept new entrants only if they can support them-
selves, arguing that providing legal immigrants with
public services makes the United States a magnet for
the
world’s
poor.
Proponents
of
reducing
legal
immigration argue that it would allow the United
States to stabilize its population sooner and help re-
duce the country’s enormous environmental impact
from its huge ecological footprint (Figure 1-8, p. 13).
Polls show that almost 60% of the U.S. public strongly
supports reducing legal immigration.
Those opposed to reducing current levels of legal
immigration argue that it would diminish the historical
role of the United States as a place of opportunity for
the world’s poor and oppressed and as a source of cul-
tural diversity that has been a hallmark of American
culture since its beginnings. In addition, according to
several studies, including a 2006 study by the Pew His-
panic Center, immigrants and their descendants pay
taxes, take many menial and low-paying jobs that most
other Americans shun, start new businesses, create
jobs, add cultural vitality, and help the United States
succeed in the global economy. Also, according to the
U.S. Census Bureau, after 2020, higher immigration
levels will be needed to supply enough workers as baby
boomers retire.
HOW WOULD YOU VOTE?
Should legal immigration into the United States, or the coun-
try where you live, be reduced? Cast your vote online at
www.thomsonedu.com/biology/miller.
130
CHAPTER 7
Applying Population Ecology: Human Population and Urbanization
1820 1840 1860 1880 1900 1920 1940 1960 1980 2000
0
200
400
600
800
1,000
1,200
1,400
1,600
1,800
2,000
Number of legal immigrants (thousands)
Year
1907
1914
New laws
restrict
immigration
Great
Depression
2010
Figure 7-7 Legal immigration to the United States, 1820–2003
(the last year for which data are available). The large increase in
immigration since 1989 resulted mostly from the Immigration
Reform and Control Act of 1986, which granted legal status to ille-
gal immigrants who could show they had been living in the country
for several years. (Data from U.S. Immigration and Naturalization
Service and the Pew Hispanic Center)
83376_08_ch07_p123-148.ctp 8/10/07 12:22 PM Page 130
CONCEPT 7-3
131
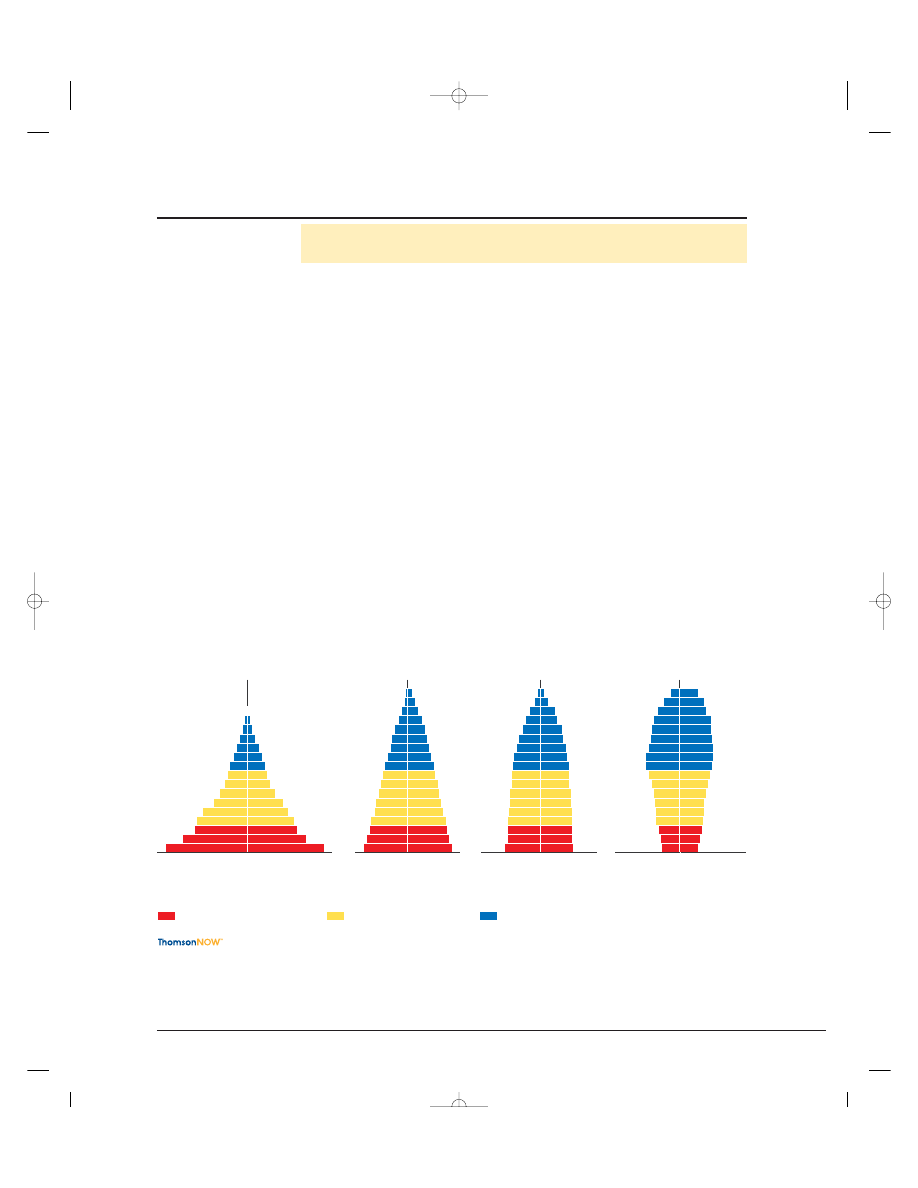
Expanding Rapidly
Guatemala
Nigeria
Saudi Arabia
Expanding Slowly
United States
Australia
China
Stable
Japan
Italy
Greece
Declining
Germany
Bulgaria
Russia
Prereproductive ages 0–14
Reproductive ages 15–44
Postreproductive ages 45–85+
Male
Female
Male
Female
Male
Female
Male
Female
Active Figure 7-8
Generalized population age structure diagrams for countries with rapid
(1.5–3%), slow (0.3–1.4%), zero (0–0.2%), and negative population growth rates (a declining population). A popu-
lation with a large proportion of its people in the prereproductive age group (far left) has a large potential for rapid
population growth. See an animation based on this figure at ThomsonNOW. Question: Which of these figures best
represents the country where you live? (Data from Population Reference Bureau)
Populations Made Up Mostly
of Young People Can Grow Rapidly:
Teenagers Rule
As mentioned earlier, even if the replacement-level fer-
tility rate of 2.1 children per woman were magically
achieved globally tomorrow, the world’s population
would keep growing for at least another 50 years (as-
suming no large increase in the death rate). This results
mostly from the age structure: the distribution of
males and females among age groups in a population—
in this case, the world population (
Concept 7-3
).
Population experts construct a population age-
structure diagram by plotting the percentages or num-
bers of males and females in the total population in
each of three age categories: prereproductive (ages 0–14),
reproductive (ages 15–44), and postreproductive (ages 45
and older). Figure 7-8 presents generalized age-struc-
ture diagrams for countries with rapid, slow, zero, and
negative population growth rates.
Any country with many people younger than age
15 (represented by a wide base in Figure 7-8, far left)
has a powerful built-in momentum to increase its pop-
ulation size unless death rates rise sharply. The number
of births will rise even if women have only one or two
children, because a large number of girls will soon be
moving into their reproductive years.
What is one of the world’s most important popula-
tion statistics? About 28% of the people on the planet were
under 15 years old in 2007. These 1.9 billion young people
are poised to move into their prime reproductive years.
In developing countries, the percentage is even higher:
31% on average (41% in Africa) compared with 17%
in developed countries (20% in North America and
16% in Europe). These differences in population struc-
ture between developed and developing countries are
dramatic, as Figure 7-9 (p. 132) reveals. This figure
shows why almost all future population growth will be
in developing countries.
We Can Use Age-Structure
Information to Make Population
and Economic Projections
Changes in the distribution of a country’s age groups
have long-lasting economic and social impacts. Between
1946 and 1964, the United States had a baby boom that
7-3
How Does a Population’s Age Structure Affect
Its Growth or Decline?
C O N C E P T 7 - 3
The numbers of males and females in young, middle, and older age groups
determine how fast populations grow or decline.
83376_08_ch07_p123-148.ctp 8/10/07 12:22 PM Page 131

added 79 million to its population. Over time, this group
looks like a bulge moving up through the country’s age
structure, as shown in Figure 7-10.
Baby boomers now make up almost half of all adult
Americans. As a result, they dominate the population’s
demand for goods and services and play increasingly
important roles in deciding who gets elected and what
laws are passed. Baby boomers who created the youth
market in their teens and twenties are now creating
the 50-something market and will soon move on to
create a 60-something market. After 2011, when the
first baby boomers will turn 65, the number of Ameri-
cans older than age 65 will grow sharply through 2029
in what has been called the graying of America. In 2007,
about 12% of Americans are 65 or older but that num-
ber is projected to increase to about 25% by 2043.
132
CHAPTER 7
Applying Population Ecology: Human Population and Urbanization
10
20
30
50
70
80+
0
1955
Age
Females
Males
10
20
30
40
50
60
70
80+
0
1985
Age
Females
Males
10
20
30
40
50
60
70
80+
0
2015
Age
Females
Males
10
20
30
40
50
60
70
80+
0
2035
Age
Females
Males
20
16
12
8
4
8
4
12
16
20
Millions
20
16
12
8
4
8
4
12
16
20
Millions
24
24
20
16
12
8
4
8
4
12
16
20
Millions
24
24
20
16
12
8
4
8
4
12
16
20
Millions
24
24
60
40
60
Active Figure 7-10
Tracking the baby-boom generation in the United States. U.S. population by
age and sex, 1955, 1985, 2015, and 2035 (projected). See an animation based on this figure at ThomsonNOW.
(Data from U.S. Census Bureau)
85+
80–85
75–79
70–74
65–69
60–64
55–59
45–49
50–54
35–39
30–34
25–29
20–24
15–19
10–14
5–9
0–4
40–44
Male
Female
0
100
200
300
100
200
300
Developed Countries
Population (millions)
Age
85+
80–85
75–79
70–74
65–69
60–64
55–59
45–49
50–54
35–39
30–34
25–29
20–24
15–19
10–14
5–9
0–4
40–44
Age
Male
Female
Developing Countries
Population (millions)
0
100
200
300
100 200 300
Figure 7-9 Global connections: population structure by age and sex in developing countries and developed coun-
tries, 2006. Question: If all girls under 15 were somehow limited to having only one child during their lifetimes,
how do you think these structures would change over time? (Data from United Nations Population Division and
Population Reference Bureau)
83376_08_ch07_p123-148.ctp 8/10/07 12:22 PM Page 132

According to some analysts, the retirement of baby
boomers is likely to create a shortage of workers in the
United States unless immigrant workers or various
forms of automation replace some of them. Retired baby
boomers are likely to use their political clout to force the
smaller number of people in the baby-bust generation
that followed them to pay higher income, health-care,
and social security taxes. However, the rapidly increas-
ing number of immigrants and their descendants may
dilute their political power.
Examine how the baby boom affects the
U.S. age structure over several decades at ThomsonNOW.
Populations Made Up Mostly
of Older People Can Decline
Rapidly
As the age structure of the world’s population changes
and the percentage of people age 60 or older increases,
more countries will begin experiencing population de-
clines. If population decline is gradual, its harmful ef-
fects usually can be managed.
However, rapid population decline can lead to se-
vere economic and social problems. A country that ex-
periences a fairly rapid “baby bust” or a “birth dearth”
when its TFR falls below 1.5 children per couple for a
prolonged period sees a sharp rise in the proportion of
older people. This puts severe strains on government
budgets because these individuals consume an increas-
ingly larger share of medical care, social security funds,
and other costly public services, which are funded by a
decreasing number of working taxpayers. Such coun-
tries can also face labor shortages unless they rely more
heavily on automation or massive immigration of for-
eign workers.
Figure 7-11 lists some of the problems associated
with rapid population decline. Countries faced with a
rapidly declining population include Japan, Russia,
Germany, Bulgaria, Hungary, Poland, Ukraine, Croatia,
Romania, and Latvia.
Populations Can Decline
from a Rising Death Rate:
The AIDS Tragedy
A large number of deaths from AIDS can disrupt a
country’s social and economic structure by removing
significant numbers of young adults from its age struc-
ture. Between 2000 and 2050, AIDS is projected to
cause the premature deaths of 278 million people in 53
countries—38 of them in Africa. Unlike hunger and
malnutrition, which kill mostly infants and children,
AIDS kills many young adults.
CONCEPT 7-3
133
Can threaten economic growth
Labor shortages
Less government revenues with fewer workers
Less entrepreneurship and new business formation
Less likelihood for new technology development
Increasing public deficits to fund higher pension and
healthcare costs
Pensions may be cut and retirement age increased
Some Problems with
Rapid Population Decline
Figure 7-11 Some problems with rapid population decline. Question: Which three of
these problems do you think are the most important? Why?
This change in the young-adult age structure of a
country has a number of harmful effects. One is a sharp
drop in average life expectancy. In 8 African countries,
where 16–39% of the adult population is infected with
HIV, life expectancy could drop to 34–40 years.
Another effect is a loss of a country’s most produc-
tive young adult workers and trained personnel such as
scientists, farmers, engineers, teachers, and govern-
ment, business, and health-care workers. This causes a
sharp drop in the number of productive adults avail-
able to support the young and the elderly and to grow
food and provide essential services.
Analysts call for the international community—es-
pecially developed countries—to create and fund a
massive program to help countries ravaged by AIDS in
Africa and elsewhere. This program would have two
major goals. First, reduce the spread of HIV through a
combination of improved education and health care.
Second, provide financial assistance for education and
health care as well as volunteer teachers and health-
care and social workers to help compensate for the
missing young-adult generation.
THINKING ABOUT
AIDS
Should government and private interests in developed coun-
tries fund a massive program to help AIDS-ravaged countries
prevent HIV infections and rebuild their work forces? Why or
why not?
83376_08_ch07_p123-148.ctp 8/10/07 12:22 PM Page 133
134
CHAPTER 7
Applying Population Ecology: Human Population and Urbanization
0
10
20
30
40
50
60
70
80
Low
Increasing
Very high
Decreasing
Low
Zero
Negative
Growth rate over time
Birth rate and death rate
(number per 1,000 per year)
Relative population size
Low
High
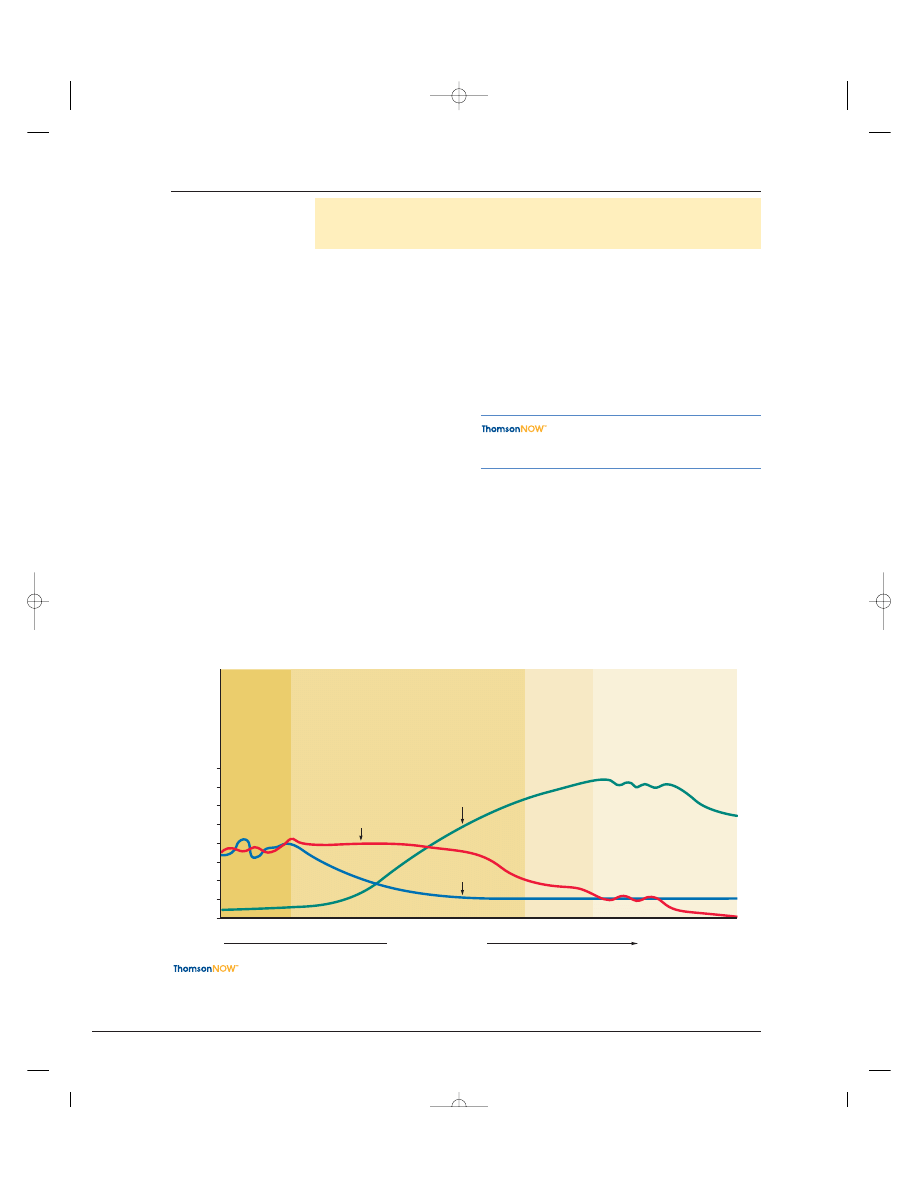
Stage 1
Preindustrial
Stage 2
Transitional
Stage 3
Industrial
Stage 4
Postindustrial
Population grows rapidly because birth
rates are high and death rates drop because
of improved food production and health
Population
growth slows
as both birth
and death
rates drop
because of
improved food
production,
health, and
education
Population growth levels
off and then declines as
birth rates equal and then
fall below death rates
Birth rate
Total population
Death rate
Population
grows very
slowly because
of a high
birth rate
(to compensate
for high infant
mortality) and a
high death rate
Active Figure 7-12
Four stages of the demographic transition, which the population of a country
can experience when it becomes industrialized. There is uncertainty over whether this model will apply to some of
today’s developing countries. See an animation based on this figure at ThomsonNOW. Question: At what stage is
the country where you live?
As Countries Develop, Their
Populations Tend to Grow Slower
Demographers examining birth and death rates of
western European countries that became industrialized
during the 19th century developed a hypothesis of
population change known as the demographic tran-
sition: As countries become industrialized, first their
death rates and then their birth rates decline. Accord-
ing to the hypothesis, this transition takes place in four
distinct stages (Figure 7-12).
Some analysts believe that most of the world’s de-
veloping countries will make a demographic transition
over the next few decades mostly because modern
technology can bring economic development and fam-
ily planning to such countries. Others fear that the
still-rapid population growth in some developing coun-
tries might outstrip economic growth and overwhelm
some local life-support systems. As a consequence,
some of these countries could become caught in a de-
mographic trap at stage 2. This is now happening as
death rates rise in a number of developing countries,
especially in Africa. Indeed, countries in Africa being
ravaged by the HIV/AIDS epidemic are falling back to
stage 1.
Other factors that could hinder the demographic
transition in some developing countries are a lack of
scientists and engineers (with 94% of them in the in-
dustrialized world), shortages of skilled workers, lack of
financial capital, large debts to developed countries,
and a drop in economic assistance from developed
countries since 1985.
Explore the effects of economic develop-
ment on birth and death rates and population growth at
ThomsonNOW.
Planning for Babies Works
Family planning provides educational and clinical
services that help couples choose how many children to
have and when to have them. Such programs vary from
culture to culture, but most provide information on
birth spacing, birth control, and health care for pregnant
women and infants.
7-4
How Can We Slow Population Growth?
C O N C E P T 7 - 4
Experience indicates that the most effective ways to slow population
growth are to invest in family planning, to reduce poverty, and to elevate the status of
women.
83376_08_ch07_p123-148.ctp 8/10/07 12:22 PM Page 134

Family planning has been a major factor in reduc-
ing the number of births throughout most of the world,
mostly because of increased knowledge and availability
of contraceptives. In 2007, 58% of married women
ages 15–49 in developed countries and 53% in devel-
oping countries used modern contraception. Family
planning has also reduced the number of legal and ille-
gal abortions performed each year and decreased
deaths of mothers and fetuses during pregnancy.
Studies show that family planning is responsible for
at least 55% of the drop in TFRs in developing coun-
tries, from 6.0 in 1960 to 2.9 in 2007. Between 1971
and 2007, for example, Thailand used family planning
to cut its annual population growth rate from 3.2% to
0.8% and its TFR from 6.4 to 1.7 children per family.
Despite such successes, two problems remain. First,
according to the United Nations Population Fund, 42%
of all pregnancies in developing countries are un-
planned, and 26% end with abortion. Second, an esti-
mated 201 million couples in developing countries
want to limit the number and determine the spacing of
their children, but they lack access to family planning
services. According to a recent study by the United
Nations Population Fund and the Alan Guttmacher In-
stitute, meeting women’s current unmet needs for fam-
ily planning and contraception could each year prevent
52 million unwanted pregnancies, 22 million induced
abortions, 1.4 million infant deaths, and 142,000 preg-
nancy-related deaths.
Some analysts call for expanding family planning
programs to include teenagers and sexually active un-
married women, who are excluded from many existing
programs. Another suggestion is to develop programs
that educate men about the importance of having fewer
children and taking more responsibility for raising
them. Proponents also call for greatly increased research
on developing more effective and more acceptable birth
control methods for men.
In 1994, the United Nations held its third Confer-
ence on Population and Development in Cairo, Egypt.
One of the conference’s goals was to encourage action
to stabilize the world’s population at 7.8 billion by 2050
instead of the projected 9.2 billion.
The experiences of Japan, Thailand, South Korea,
Taiwan, Iran, and China show that a country can
achieve or come close to replacement-level fertility
within a decade or two. Such experiences also suggest
that the best ways to slow and stabilize population
growth are through investing in family planning, reducing
poverty, and elevating the social and economic status of
women (
Concept 7-4
).
Empowering Women
Can Slow Population Growth
Women tend to have fewer children if they are edu-
cated, hold a paying job outside the home, and live
in societies where their human rights are not sup-
pressed. Although women make up roughly half of the
world’s population, in most societies they don’t have
the same rights and educational and economic oppor-
tunities as men.
Women do almost all of the world’s domestic work
and child care for little or no pay and provide more un-
paid health care than all of the world’s organized health
services combined. Women also do 60–80% of the
work associated with growing food, gathering wood for
use as fuel, and hauling water in rural areas of Africa,
Latin America, and Asia. As one Brazilian woman put
it, “For poor women the only holiday is when you are
asleep.”
Globally, women account for two-thirds of all hours
worked but receive only 10% of the world’s income,
and they own less than 2% of the world’s land. Women
also make up 70% of the world’s poor and 64% of the
world’s 800 million illiterate adults.
Because sons are more valued than daughters in
many societies, girls are often kept at home to work in-
stead of being sent to school. Globally, some 900 mil-
lion girls—three times the entire U.S. population—do
not attend elementary school. Teaching women to read
has a major impact on fertility rates and population
growth. Poor women who cannot read often have five
to seven children, compared to two or fewer in soci-
eties where almost all women can read.
According to Thorya Obaid, executive director of
the United Nations Population Fund, “Many women in
the developing world are trapped in poverty by illiter-
acy, poor health, and unwanted high fertility. All of
these contribute to environmental degradation and
tighten the grip of poverty.”
An increasing number of women in developing
countries are taking charge of their lives and reproduc-
tive behavior. As it expands, such bottom-up change
by individual women will play an important role in
stabilizing population and reducing environmental
degradation.
■
C A S E S T U D Y
Slowing Population Growth
in China: The One-Child Policy
China has made impressive efforts to feed its people,
bring its population growth under control, and encour-
age economic growth. Between 1972 and 2007, the
country cut its crude birth rate in half and trimmed its
TFR from 5.7 to 1.6 children per woman, compared to
2.05 in the United States. Despite such drops China is
the world’s most populous country (photo in Figure 1-1,
p. 5). If current trends continue, China’s population is
expected to peak around 2040 and then begin a slow
decline.
Since 1980, China has moved 350 million people
(an amount greater than the entire U.S. population)
from extreme poverty to middle-class consumers and is
likely to double that number by 2010. China also has a
CONCEPT 7-4
135
83376_08_ch07_p123-148.ctp 8/10/07 12:22 PM Page 135

literacy rate of 91% and has boosted life expectancy to
72 years. By 2020, some economists project that China
could become the world’s leading economic power.
In the 1960s, government officials concluded that
the only alternative to strict population control was
mass starvation. To achieve a sharp drop in fertility,
China established the most extensive, intrusive, and
strict family planning and population control program
in the world. It discourages premarital sex and urges
people to delay marriage and limit their families to one
child each. Married couples who pledge to have no
more than one child receive more food, larger pen-
sions, better housing, free health care, salary bonuses,
free school tuition, and preferential employment op-
portunities for their child. Couples who break their
pledge lose such benefits.
The government also provides married couples with
free sterilization, contraceptives, and abortion. How-
ever, reports of forced abortions and other coercive ac-
tions have brought condemnation from the United
States and other national governments.
In China, there is a strong preference for male chil-
dren, because unlike sons, daughters are likely to
marry and leave their parents. A folk saying goes,
“Rear a son, and protect yourself in old age.” Some
pregnant Chinese women use ultrasound to determine
the gender of their fetus, and some get an abortion if it
is female. The result: a rapidly growing gender imbalance
or “bride shortage” in China’s population, with a pro-
jected 30–40 million surplus of men expected by 2020.
Because of this skewed sex ratio, teen-age girls in some
parts of rural China are being kidnapped and sold as
brides for single men in other parts of the country.
With fewer children, the average age of China’s
population is increasing rapidly. By 2020, 31% of
China’s population will be over 60 years old compared
to 8% in 2007. This graying of the Chinese population
could lead to a declining work force, higher wages for
younger workers, lack of funds for supporting continu-
ing economic development, and fewer children and
grandchildren to care for the growing number of eld-
erly people. These and other factors may slow economic
growth and lead to some relaxation of China’s one-
child population control policy. Some middle-class cou-
ples now have more than one child and pay the fines.
China also faces serious resource and environmen-
tal problems. It has 20% of the world’s population, but
only 7% of the world’s freshwater and cropland, 4% of
its forests, and 2% of its oil. In 2005, China’s deputy
minister of the environment summarized the country’s
environmental problems: “Our raw materials are
scarce, we don’t have enough land, and our population
is constantly growing. Half of the water in our seven
largest rivers is completely useless. One-third of the ur-
ban population is breathing polluted air.”
China’s economy is growing at one of the world’s
highest rates as the country undergoes rapid industrial-
ization. More middle class Chinese (Case Study, p. 13)
will consume more resources per person, increasing
China’s ecological footprint (Figure 1-8, p. 13) within
its own borders and in other parts of the world that
provide it with resources. This will put a strain on the
earth’s natural capital unless China steers a course to-
ward more sustainable economic development.
■
C A S E S T U D Y
Slowing Population Growth
in India
For more than five decades, India has tried to control
its population growth with only modest success. The
world’s first national family planning program began in
India in 1952, when its population was nearly 400 mil-
lion. In 2007, after 55 years of population control ef-
forts, India had 1.1 billion people.
In 1952, India added 5 million people to its popula-
tion. In 2007, it added 18.3 million—more than any
other country. By 2015, India is projected to be the
world’s most populous country, with its population pro-
jected to peak at 1.6 billion around 2065.
India faces a number of serious poverty, malnutri-
tion, and environmental problems that could worsen as
its population continues to grow rapidly. India has a
thriving and rapidly growing middle class of more than
300 million people—roughly equal to the entire U.S.
population—many of them highly skilled software de-
velopers and entrepreneurs. By global standards, how-
ever, one of every four people in India is poor. Nearly
half of the country’s labor force is unemployed or can
find only occasional work. Although India currently is
self-sufficient in food grain production, about 40% of
its population and more than half of its children suffer
from malnutrition, mostly because of poverty. In 2007,
an estimated 2.5 million people in India were infected
with HIV, the third largest number after Nigeria and
South Africa.
The Indian government has provided information
about the advantages of small families for years and
has also made family planning available throughout
the country. Even so, Indian women have an average
of 2.9 children. Most poor couples still believe they
need many children to work and care for them in old
age. As in China, the strong cultural preference for
male children means some couples keep having chil-
dren until they produce one or more boys. The result:
Even though 90% of Indian couples know of at least
one modern birth control method, only 48% actually
use one.
Like China, India also faces critical resource and en-
vironmental problems. With 17% of the world’s peo-
ple, India has just 2.3% of the world’s land resources
and 2% of the forests. About half the country’s crop-
land is degraded as a result of soil erosion and over-
grazing. In addition, more than two-thirds of its water
136
CHAPTER 7
Applying Population Ecology: Human Population and Urbanization
83376_08_ch07_p123-148.ctp 8/10/07 12:22 PM Page 136

CONCEPT 7-5
137
Half of the World’s People Live
in Urban Areas
The world’s first cities emerged about 6,000 years ago.
Since then the world has become increasingly urban-
ized, with 80% of Americans living in urban areas and
50% of the world’s people living in cities. Urban areas
grow in two ways—by natural increase (more births
than deaths) and by immigration, mostly from rural ar-
eas. Rural people are pulled to urban areas in search of
jobs, food, housing, entertainment, and freedom from
religious, racial, and political conflicts. Some are also
pushed from rural to urban areas by factors such as
poverty, lack of land for growing food, declining agri-
cultural jobs, famine, and war.
Five major trends are important for understanding
the problems and challenges of urban growth. First, the
proportion of the global population living in urban areas is
increasing. Between 1850 and 2007, the percentage of
people living in urban areas increased from 2% to al-
most 50% and could reach 60% by 2030. Almost all of
this growth will occur in already overcrowded and
stressed cities in developing countries.
Second, the number and sizes of urban areas is mush-
rooming. Each week 1 million people are added to the
world’s urban areas. Between 2006 and 2015, the
number of urban areas with a million or more people is
projected to increase from 400 to 564. Also, there are
18 megacities or megalopolises (up from 8 in 1985), each
with 10 million or more people—15 of them in devel-
oping countries (Figure 7-13, p. 138). Such megacities
will soon be eclipsed by hypercities with more than 20
million people. So far, Tokyo, Japan, with 26.5 million
people, is the only city in this category. But according
to U.N. projections, by 2015 Mumbai (formerly Bom-
bay) in India, Lagos in Nigeria, Dakar in Bangladesh,
and São Paulo in Brazil will become hypercities.
A third trend is the rapid increase in urban popula-
tions in developing countries. Between 2007 and 2030, the
percentage of people living in urban areas in develop-
ing countries is expected to increase from 43% to 56%.
In South America, about 80% of the people already
live in cities, mostly along the coasts.
Fourth, urban growth is much slower in developed coun-
tries than in developing countries. Still, developed coun-
tries, now with 75% urbanization, are projected to
reach 84% urbanization by 2030.
Fifth, poverty is becoming increasingly urbanized as more
poor people migrate from rural to urban areas, mostly in devel-
oping countries. The United Nations estimates that at least
1 billion people live in crowded and unsanitary slums
and shantytowns in or on the outskirts of most cities in
developing countries; within 30 years this number may
double. At the same time, some cities in developing
countries have undergone phenomenal economic
growth. Examples include Singapore (with the highest
standard of living in Asia), Hong Kong in China, Taipei
in Taiwan, Kuala Lumpur in Malaysia, and Bangalore,
India.
THINKING ABOUT
Urban Trends
If you could reverse one of the five urban trends
discussed here, which one would it be? Why? Which of these
trends has Curitiba, Brazil (
Core Case Study
), reversed?
7-5
What Are the Major Population and Environmental
Problems of Urban Areas?
C O N C E P T 7 - 5
Cities can improve individual lives, but most cities are unsustainable
because of high levels of resource use, waste, pollution, and poverty.
is seriously polluted, sanitation services often are inad-
equate, and many of its major cities suffer from serious
air pollution (see photo 2, p. vi, and photo 13, p. xii).
India is undergoing rapid economic growth, which is
expected to accelerate. As members of its huge and
growing middle class increase their resource use per
person, India’s ecological footprint (Figure 1-8, p. 13)
will expand and increase the pressure on the country’s
and the earth’s natural capital.
On the other hand, economic growth may help
slow population growth by accelerating India’s demo-
graphic transition. By 2050, India—the largest democ-
racy the world has ever seen—could become the
world’s leading economic power.
THINKING ABOUT
China, India, the United States, and Overpopulation
Based on population size and resource use per person (Fig-
ure 1-8, p. 13) is the United States more overpopulated than
China? Explain. Answer the same question for the U.S. vs.
India.
83376_08_ch07_p123-148.ctp 8/10/07 12:22 PM Page 137

■
C A S E S T U D Y
Urbanization
in the United States
Between 1800 and 2007, the percentage of the U.S.
population living in urban areas increased from 5% to
79%. This population shift has occurred in four phases.
First, people migrated from rural areas to large central
cities. Currently, 75% of Americans live in cities with
at least 50,000 people, and nearly half live in urban
areas with 1 million or more residents (Figure 7-14).
Second, many people migrated from large central cities
to suburbs and smaller cities. Currently, about 51% of
Americans live in the suburbs, 30% in central cities, and
19% in rural areas and exurbs, developments beyond
suburbs but still within commuting distance of cities.
Third, many people migrated from the North and East to
the South and West. Since 1980, about 80% of the U.S.
population increase has occurred in the South and
West. Between 2007 and 2043, demographers project
that the fastest growing U.S. states will continue to be
Nevada, Arizona, and Florida. According to a 2006
study by the Center for Environment and Population,
the southern and western United States lead the coun-
try in population size and growth and in per capita en-
ergy and water use. As a result, they are hotspots
where biodiversity is being threatened.
Fourth, since the 1970s, and especially since 1990,
some people have fled both cities and suburbs and migrated
to rural areas and to vast sprawling exurbs that have
no centers and are further from central cities than are
suburbs.
Since 1920, many of the worst urban environmental
problems in the United States have been reduced signif-
icantly. Most people have better working and housing
conditions, and air and water quality have improved.
Better sanitation, public water supplies, and medical
care have slashed death rates and incidences of sickness
from malnutrition and infectious diseases (Figure 7-6).
Concentrating most of the population in urban areas
also has helped protect the country’s biodiversity by re-
ducing the destruction and degradation of wildlife habi-
tat, but urban sprawl can reduce this benefit.
However, a number of U.S. cities—especially older
ones—have deteriorating services and aging infrastructures
(streets, schools, bridges, housing, and sewers). Many
face budget crunches and decreasing public services as
businesses and people move to the suburbs or exurbs
and city revenues from property taxes decline. Also,
poverty is rising in the centers of many older cities,
where unemployment rates are typically 50% or higher.
Urban Sprawl Gobbles Up
the Countryside
In the United States and some other countries, urban
sprawl—the growth of low-density development on
the edges of cities and towns gobbling up the surround-
ing countryside (Figure 7-15)—is a major problem.
138
CHAPTER 7
Applying Population Ecology: Human Population and Urbanization
Los Angeles
13.3 million
19.0 million
New York
16.8 million
17.9 million
Sao Paulo
18.3 million
21.2 million
Buenos Aires
12.1 million
13.2 million
Cairo
10.5 million
11.5 million
Karachi
10.4 million
16.2 million
Dhaka
13.2 million
22.8 million
Beijing
10.8 million
11.7 million
Tokyo
26.5 million
27.2 million
Shanghai
12.8 million
13.6 million
Jakarta
11.4 million
17.3 million
Manila
10.1 million
11.5 million
Calcutta
13.3 million
16.7 million
Mumbai
(Bombay)
16.5 million
22.6 million
Delhi
13.0 million
20.9 million
Mexico City
18.3 million
20.4 million
Osaka
11.0 million
11.0 million
Key
2004
(estimated)
2015
(projected)
Lagos
12.2 million
24.4 million
Figure 7-13 Global outlook: major urban areas throughout the world revealed in satellite images of the earth at
night showing city lights. Currently, almost 50% of the world’s people living in urban areas occupy about 2% of
the earth’s land area. Note that most of the urban areas are found along the coasts of continents, explaining why
most of Africa and much of the interior of South America, Asia, and Australia are dark at night. This figure also
shows the populations of the world’s 18 megacities (each with 10 million or more people) in 2004 (the latest year
for which U.N. data is available) and their projected populations in 2015. All but three are located in developing
countries. Question: In order, what were the world’s five most populous cities in 2004 and the five most populous
ones projected for 2015? (Data from National Geophysics Data Center, National Oceanic and Atmospheric Admin-
istration, and United Nations)
83376_08_ch07_p123-148.ctp 8/10/07 12:22 PM Page 138
CONCEPT 7-5
139
Seattle
Portland
Boise
San Francisco
Fresno
Las Vegas
Phoenix
Dallas
Houston
Austin
Laredo
McAllen
Naples
Orlando
Atlanta
Kansas
City
Salt Lake
City
Provo
Denver
Minneapolis
Chicago
Cincinnati
St. Louis
Tulsa
Memphis
Nashville
Charlotte
Myrtle Beach
Wilmington
Raleigh
Washington,
D.C.
New York
Boston
Tucson
San Diego
Los
Angeles
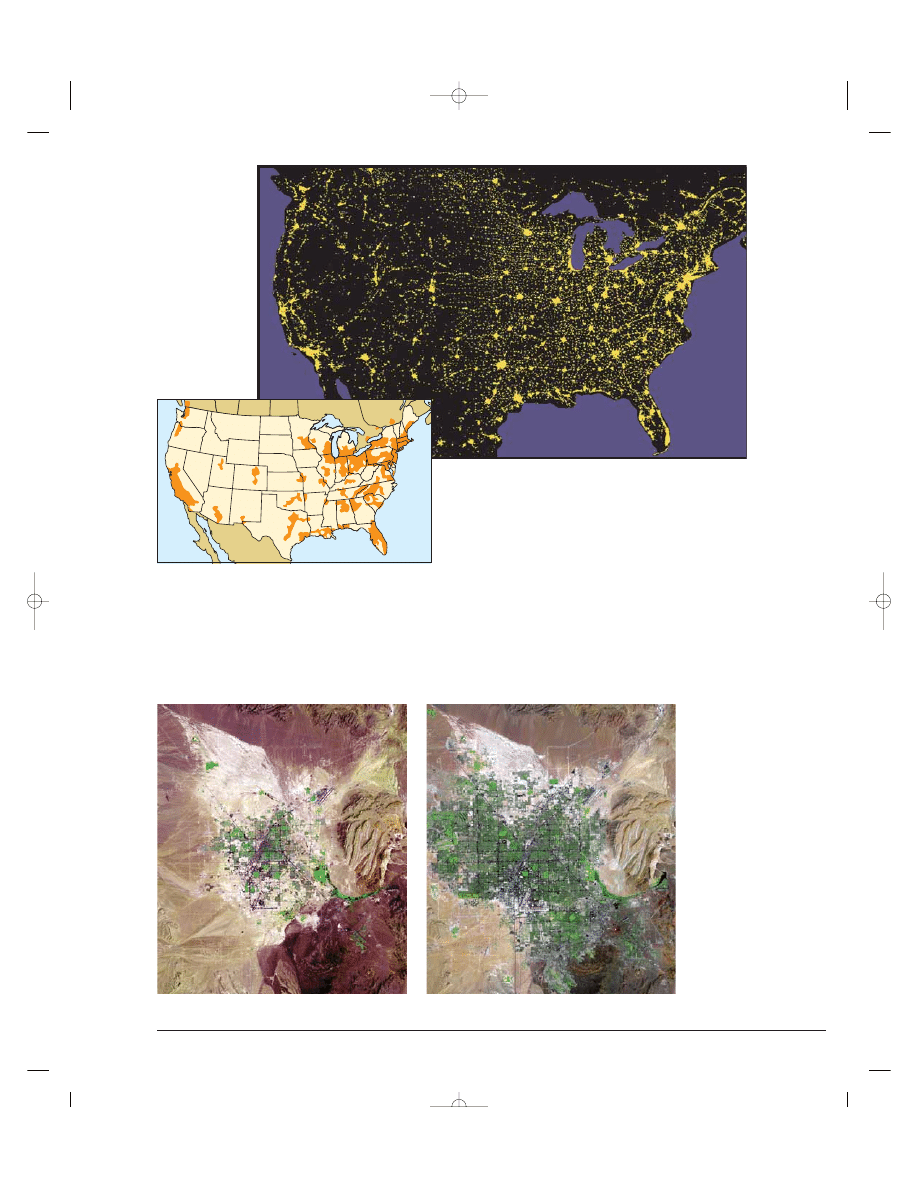
Figure 7-14 Major urban areas in the United States revealed in satellite images of the earth at night
showing city lights (top). About 8 of 10 Americans live in urban areas that occupy about 1.7% of the
land area of the lower 48 states. Areas with names in white are the fastest-growing metropolitan areas.
Nearly half (48%) of all Americans live in cities of 1 million or more people, which are projected to merge
into huge urban areas shown as shaded areas in the bottom map. Question: Why are most of the
largest urban areas located near water? (Data from National Geophysical Data Center/National Oceanic
and Atmospheric Administration, U.S. Census Bureau)
Images courtesy of the U.S. Geological Survey
Images courtesy of the U.S. Geological Survey
1973
2000
Figure 7-15 Urban sprawl in
and around Las Vegas, Nevada,
between 1973 and 2000—a
process that has continued.
Between 1970 and 2006, the
population of water-short
Clark County, which includes
Las Vegas, more than quadru-
pled from 463,000 to around
2 million. And the growth
is expected to continue.
Question: What might be a
limiting factor on population
growth in the Las Vegas area?
83376_08_ch07_p123-148.ctp 8/10/07 12:22 PM Page 139
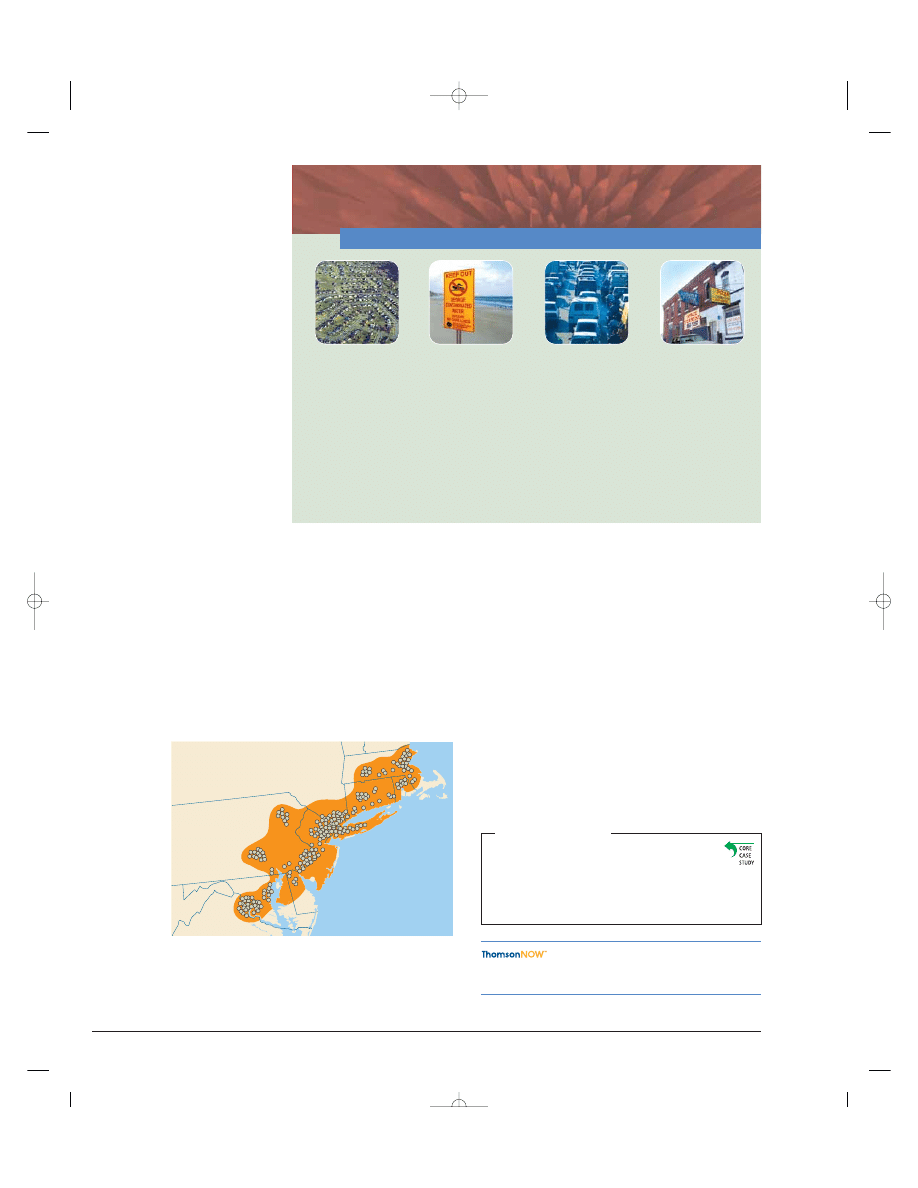
It results in a far-flung hodgepodge of housing de-
velopments, shopping malls, parking lots, and office
complexes that are loosely connected by multilane
highways and freeways.
Urban sprawl is the product of increased prosperity,
ample and affordable land, automobiles, cheap gaso-
line, and poor urban planning. Figure 7-16 shows some
of the undesirable consequences of urban sprawl. Be-
cause of nonexistent or inadequate mass transportation
in most such areas, sprawl forces people to drive every-
where. Sprawl has decreased energy efficiency, in-
creased traffic congestion, and destroyed prime crop-
land, forests, and wetlands. It has also led to the eco-
nomic death of many central cities as people and busi-
nesses move out of these areas.
On the other hand, many people prefer living in
suburbs and exurbs. Compared to central cities, these
areas provide lower density living and access to larger
lot sizes and single-family homes. Often they also have
newer public schools and lower crime rates.
As they grow and sprawl outward, separate urban
areas sometimes merge to form a megalopolis. For
example, the remaining open spaces between the U.S.
cities of Boston, Massachusetts, and Washington, D.C.
are rapidly urbanizing and coalescing. The result is an
almost 800-kilometer-long (500-mile-long) urban area
that contains about 35 million people and is sometimes
called Bowash (Figure 7-17 and Figure 7-14).
THINKING ABOUT
Where You Live
If you had a choice, would you prefer to live in a
rural area, an exurb, a suburb, a small town, a
medium-size city (200,000 or more), a large city (1 million
or more), an ecocity such as Curitiba, Brazil (
Core Case
Study
), or a megalopolis (10 million or more)? Explain.
Examine how the San Francisco Bay area in the
U.S. state of California grew in population between 1900 and
1990 at ThomsonNOW.
140
CHAPTER 7
Applying Population Ecology: Human Population and Urbanization
Providence
Boston
Springfield
Hartford
New York
Newark
Allentown
Philadelphia
Harrisburg
Baltimore
Washington
Bowash (Boston to Washington)
Figure 7-17 U.S. megalopolis: Bowash, consists of urban sprawl
and coalescence between Boston, Massachusetts, and Washington,
D.C. Question: What are two ways in which this development
might be harming ecosystems along the Atlantic Coast?
N A T U R A L C A P I T A L
D E G R A D A T I O N
Urban Sprawl
Loss of cropland
Loss of forests and
grasslands
Loss of wetlands
Loss and
fragmentation of
wildlife habitats
Land and
Biodiversity
Increased use of surface
water and groundwater
Increased runoff and
flooding
Increased surface water
and groundwater
pollution
Decreased natural
sewage treatment
Water
Increased energy use
and waste
Increased air pollution
Increased greenhouse
gas emissions
Enhanced global
warming
Energy, Air,
and Climate
Higher taxes
Decline of
downtown business
districts
Increased
unemployment in
central city
Loss of tax base in
central city
Economic Effects
Figure 7-16 Some un-
desirable impacts of
urban sprawl, or car-
dependent development.
Question: Which five of
these effects do you
think are the most
harmful? Why?
83376_08_ch07_p123-148.ctp 8/10/07 12:22 PM Page 140
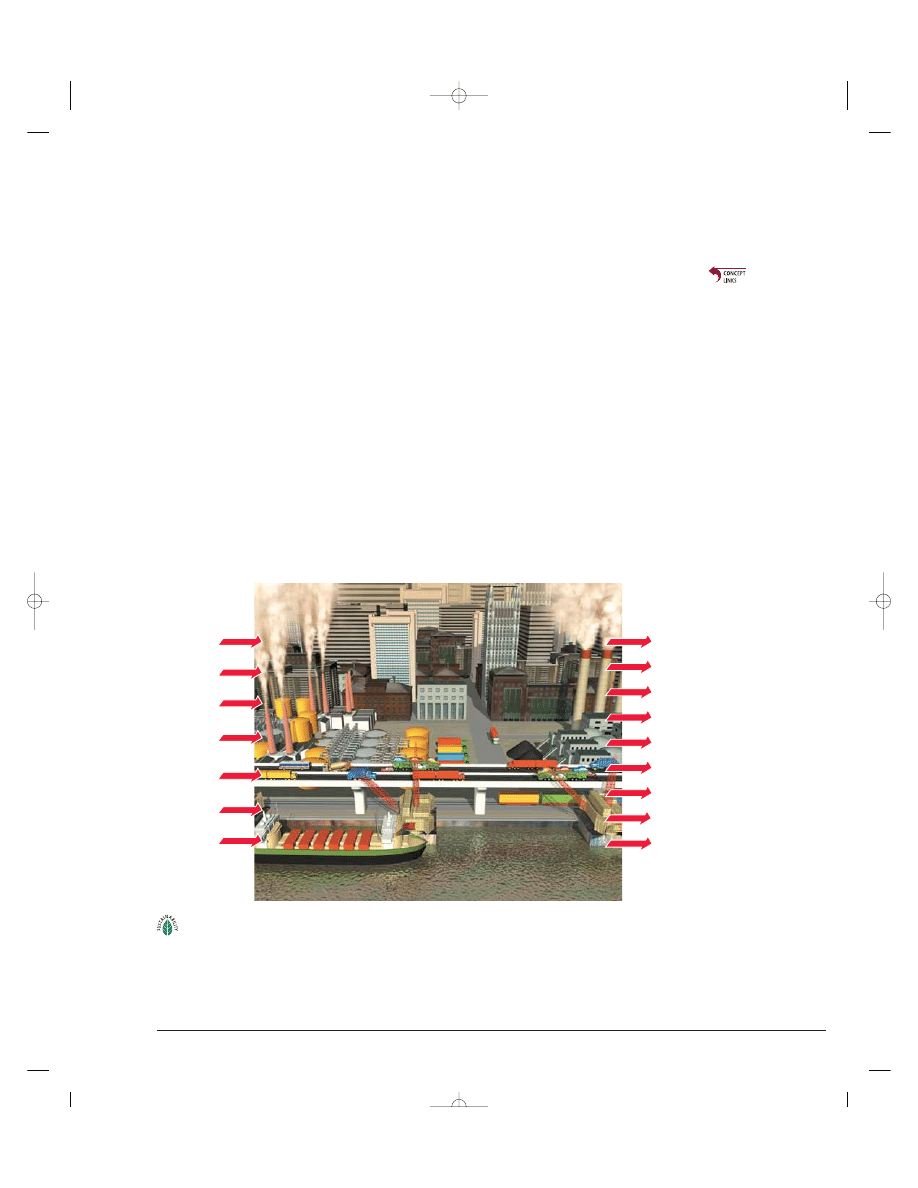
Urbanization Has Advantages
Urbanization has many benefits. From an economic
standpoint, cities are centers of economic development,
innovation, education, technological advances, and
jobs. They serve as centers of industry, commerce, and
transportation.
Urban residents in many parts of the world live
longer than do rural residents and have lower infant
mortality rates and fertility rates. Most urban dwellers
also have better access to medical care, family plan-
ning, education, and social services than do their rural
counterparts.
Urban areas also have some environmental advan-
tages. Recycling is more economically feasible because
concentrations of recyclable materials and funding for
recycling programs tend to be higher in urban areas.
Concentrating people in cities also helps preserve bio-
diversity by reducing the stress on wildlife habitats.
Urbanization Has Disadvantages
Unsustainable Systems. Although urban populations
occupy only about 2% of the earth’s land area, they con-
sume 75% of its resources. Because of this high resource
input and high waste output (Figure 7-18), most of the
world’s cities are not self-sustaining systems (
Concept 7-5
).
Urbanization can help preserve biodiversity in some
areas. On the other hand, large areas of land must be
disturbed and degraded to provide urban dwellers with
food, water, energy, minerals, and other resources. This
decreases and degrades the earth’s overall biodiversity
(
Concept 3-4A
, p. 48).
Thus, urban areas have huge ecological
footprints (
Concept 1-3
, p. 11) that extend far beyond
their boundaries. If you live in a city, you can calculate
its ecological footprint by going to the website
www.redefiningprogress.org/. Also, see the Guest
Essay on this topic by Michael Cain at ThomsonNOW.
Lack of Vegetation. In urban areas, most trees,
shrubs, or other plants are destroyed to make way for
buildings, roads, and parking lots. So most cities do not
benefit from vegetation that might otherwise absorb air
pollutants, give off oxygen, help cool the air through
transpiration, provide shade and wildlife habitats, re-
duce soil erosion, and muffle noise. As one observer
remarked, “Most cities are places where they cut down
most of the trees and then name the streets after them.”
Water Problems. As cities grow and water demands
increase, expensive reservoirs and canals must be built
CONCEPT 7-5
141
Inputs
Energy
Outputs
Food
Water
Raw
materials
Manufactured
goods
Money
Information
Solid wastes
Waste heat
Air pollutants
Water pollutants
Greenhouse gases
Manufactured goods
Noise
Wealth
Ideas
Figure 7-18 Urban areas rarely are sustainable systems (
Concept 7-5
). The typical city depends on large
nonurban areas for huge inputs of matter and energy resources and for large outputs of waste matter
and heat. According to an analysis by Mathis Wackernagel and William Rees, an area 58 times as large
as that of London, England, is needed to supply its residents with resources. They estimate that meeting the
needs of all the world’s people at the same rate of resource use as that of London would take at least three
more planet earths. Question: How would you apply the four scientific
principles of sustainability
(see back
cover) to lessen some of these impacts?
83376_08_ch07_p123-148.ctp 8/10/07 12:22 PM Page 141

difficult for casual observers to enjoy the night sky.
Light pollution also affects some plant and animal
species. For example, endangered sea turtles lay their
eggs on beaches at night and require darkness. In addi-
tion, each year millions of migrating birds, lured off
course by the lights of high-rise buildings, often fatally
collide with the buildings.
Life Is a Desperate Struggle
for the Urban Poor
in Developing Countries
Poverty is a way of life for many urban dwellers in
developing countries. About 1 billion people live in
such cities under crowded and unsanitary conditions,
and according to a 2006 UN study, that number could
reach 1.4 billion by 2020 (Figure 7-20). Some live in
slums—tenements and rooming houses where 3–10
people live in a single room. Others live in squatter
settlements and shantytowns on the outskirts of these
cities, some perched precariously on steep hillsides
subject to landslides. They build shacks from cor-
rugated metal, plastic sheets, scrap wood, and other
scavenged building materials or live in rusted shipping
containers and junked cars. Still others live or sleep on
the streets. When it rains, the usually unpaved alleys
become clogged with dead rats, garbage, and sewage.
In some shantytowns, 40% of the children are born
HIV-positive and murder is a leading cause of death for
children.
Poor people living in shantytowns and squatter set-
tlements usually lack clean water supplies, sewers,
electricity, and roads, and are subject to severe air and
water pollution and hazardous wastes from nearby fac-
tories. Many of these settlements are in locations espe-
cially prone to landslides, flooding, and earthquakes.
Most cities cannot afford to provide squatter settle-
ments and shantytowns with basic services, and their
officials fear that improving services will attract even
and deeper wells must be drilled. This can deprive rural
and wild areas of surface water and deplete ground-
water faster than it is replenished.
Flooding also tends to be greater in some cities, be-
cause they are built on floodplains or along low-lying
coastal areas subject to natural flooding. Covering land
with buildings, asphalt, and concrete causes precipita-
tion to run off quickly and overload storm drains. In ad-
dition, urban development often destroys or degrades
wetlands that act as natural sponges to help absorb ex-
cess water. Many of the world’s largest cities face an-
other threat because they are located in coastal areas
(Figure 7-13) that could be partially flooded sometime
in this century as sea levels rise due to projected global
warming.
Pollution and Health Problems. Because of their
high population densities and high resource consump-
tion, cities produce most of the world’s air pollution,
water pollution, and solid and hazardous wastes. Pollu-
tant levels are generally higher because pollution is
produced in a smaller area and cannot be dispersed
and diluted as readily as pollution produced in rural
areas. In addition, high population densities in urban
areas can increase the spread of infectious diseases, es-
pecially if adequate drinking water and sewage systems
are not available. Noise pollution (Figure 7-19) is an-
other problem.
Climate and Artificial Light. Cities generally are
warmer, rainier, foggier, and cloudier than suburbs and
nearby rural areas. The enormous amounts of heat gen-
erated by cars, factories, furnaces, lights, air condition-
ers, and heat-absorbing dark roofs and streets in cities
create an urban heat island that is surrounded by cooler
suburban and rural areas. As cities grow and merge
(Figure 7-17), their heat islands merge, which can re-
duce the natural dilution and cleansing of polluted air.
Also, the artificial light created by cities hinders as-
tronomers from conducting their research and makes it
142
CHAPTER 7
Applying Population Ecology: Human Population and Urbanization
Noise Levels (in dbA)
Permanent damage
begins after 8-hour
exposure
0
10
20
30
40
50
60
70
80
90
100
110
120
130
140
150
Normal
breathing
Whisper
Quiet
rural area
Quiet
room
Rainfall
Normal
conversation
Vacuum
cleaner
Average
factory
Lawn
mower
Chain
saw
Rock music
Thunderclap
(nearby)
Boom
cars
Earphones
at loud level
Air raid
siren
Military
rifle
85
Figure 7-19 Noise levels (in decibel-A sound pressure units) of some common sounds. You are being exposed
to a sound level high enough to cause permanent hearing damage if you need to raise your voice to be heard
above the racket, if a noise causes your ears to ring, or if nearby speech seems muffled. Prolonged exposure to
lower noise levels and occasional loud sounds may not damage your hearing but can greatly increase internal
stress. Question: How many times per day are your ears subjected to noise levels of 85 or more dbA?
83376_08_ch07_p123-148.ctp 8/10/07 12:22 PM Page 142
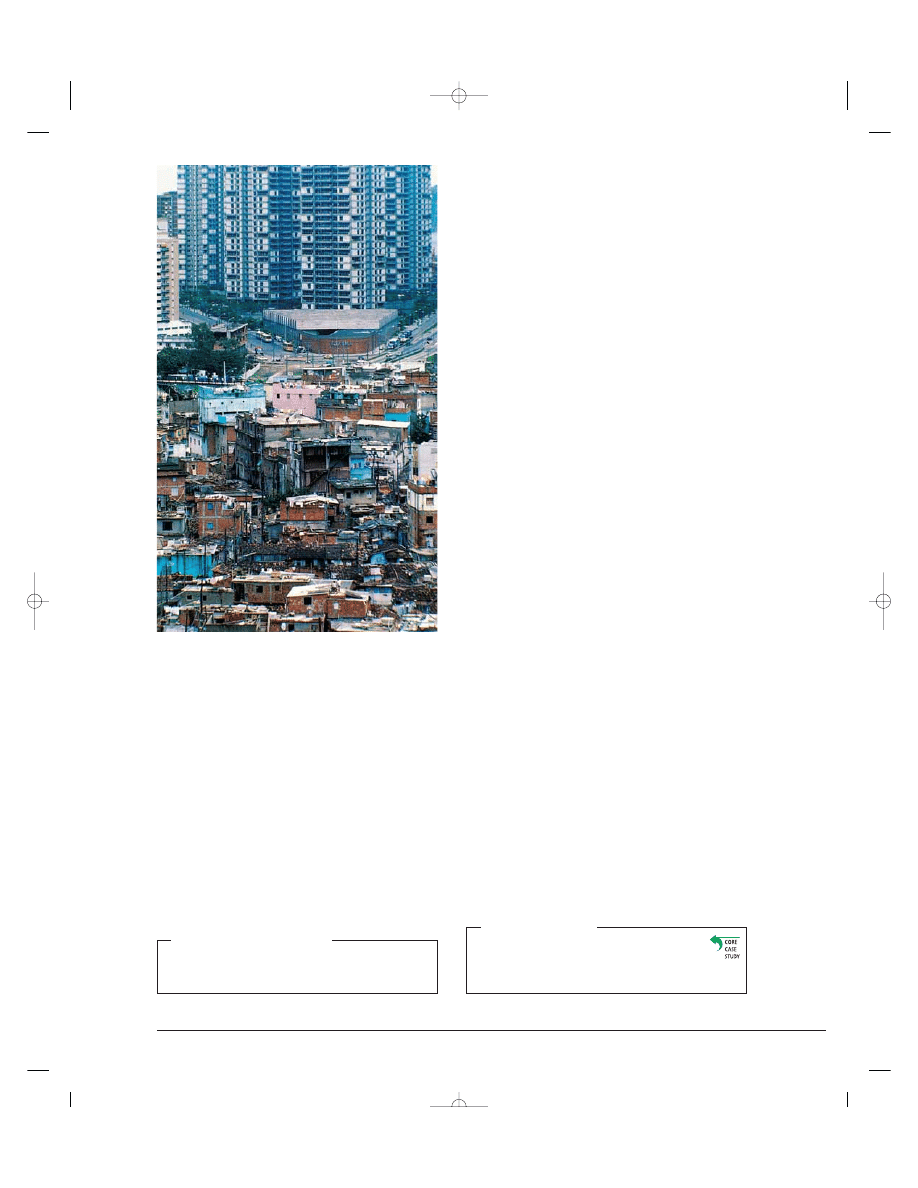
■
✓
Despite joblessness, squalor, overcrowding, and en-
vironmental and health hazards, most poor urban resi-
dents are better off than their rural counterparts.
Thanks to the greater availability of family planning
programs, they tend to have fewer children and better
access to schools. Many squatter settlements provide
people with a sense of community and a vital safety
net of neighbors, friends, and relatives.
■
C A S E S T U D Y
Mexico City
Mexico City—the world’s second most populous city—
is an urban area in crisis. About 19 million people live
there and each year at least 400,000 new residents
arrive.
Mexico City suffers from severe air pollution, close
to 50% unemployment, deafening noise, overcrowd-
ing, traffic congestion, inadequate public transporta-
tion, and a soaring crime rate. More than one-third of
its residents live in slums called barrios or in squatter
settlements that lack running water and electricity.
At least 3 million people have no sewer facilities. As
a consequence, huge amounts of human waste are de-
posited in gutters, vacant lots, and open sewers every
day, attracting armies of rats and swarms of flies. When
the winds pick up dried excrement, a fecal snow blan-
kets parts of the city. This bacteria-laden fallout leads to
widespread salmonella and hepatitis infections, espe-
cially among children.
Mexico City has one of the world’s worst air pollu-
tion problems because of a combination of too many
cars, polluting factories, a sunny climate and thus more
smog (see photo 13 on p. xii), and topographical bad
luck. The city sits in a bowl-shaped valley surrounded
on three sides by mountains—conditions that trap air
pollutants at ground level. Breathing its air is said to be
roughly equivalent to smoking three packs of cigarettes
per day.
The city’s air and water pollution cause an es-
timated 100,000 premature deaths per year. Writer
Carlos Fuentes has nicknamed it “Makesicko City.”
Some progress has been made. The percentage of
days each year in which air pollution standards are
violated has fallen from 50% to 20%. The city govern-
ment has banned cars in its central zone, required cat-
alytic converters on all cars made after 1991, phased
out use of leaded gasoline, and replaced old buses,
taxis, and delivery vehicles with cleaner ones. The city
also bought land for use as green space and planted
more than 25 million trees to help absorb pollutants.
THINKING ABOUT
Mexico City and Curitiba
What are two sustainability strategies used in
Curitiba, Brazil (
Core Case Study
), that might be
helpful in Mexico City?
more of the rural poor. Many city governments regu-
larly bulldoze squatter shacks and send police to drive
illegal settlers out. The people usually move back in or
develop another shantytown somewhere else.
Governments can slow the migration from rural to
urban areas by improving conditions in the country-
side. They can provide social services, such as basic ed-
ucation and health care, and encourage investment in
small towns throughout their countries. In addition,
they can designate land for squatter settlements and
supply them with clean water. However, implementing
such policies in many of the poorest nations is hin-
dered by extensive government corruption.
HOW WOULD YOU VOTE?
Should squatters around cities of developing countries be
given title to land they live on? Cast your vote online at
www.thomsonedu.com/biology/miller.
CONCEPT 7-5
143
Figure 7-20 Global outlook: extreme poverty forces hundreds of
millions of people to live in slums and shantytowns such as this one
in Rio de Janeiro, Brazil, where adequate water supplies, sewage dis-
posal, and other services do not exist.
United Nations
83376_08_ch07_p123-148.ctp 8/10/07 12:22 PM Page 143

144
CHAPTER 7
Applying Population Ecology: Human Population and Urbanization
Cities Can Grow Outward
or Upward
If a city cannot spread outward, it must grow verti-
cally—upward and downward (below ground)—so
that it occupies a small land area with a high popula-
tion density. Most people living in compact cities like
Hong Kong, China, and Tokyo, Japan, walk, ride bicy-
cles, or use energy-efficient mass transit.
On the other hand, a combination of plentiful land,
cheap gasoline, and a network of highways have pro-
duced dispersed cities that depend on the automobile for
most travel (
Concept 7-6
). Such car-centered cities are
found in the United States, Canada, Australia, and
other countries where ample land often is available for
outward expansion. The resulting urban sprawl can
have a number of undesirable effects (Figure 7-16).
The United States is a prime example of a car-cen-
tered nation. With 4.6% of the world’s people, the
United States has almost one-third of the world’s 900
million passenger cars and commercial vehicles. More
than half of all American passenger vehicles are gas-
guzzling sport utility vehicles, pickup trucks, and vans.
Mostly because of urban sprawl and convenience,
passenger vehicles are used for 98% of all urban trans-
portation and 91% of travel to work in the United
States. About 75% of Americans drive to work alone,
5% use public transit, and 0.4% bicycle to work. Each
year, Americans drive about the same distance driven
by all other drivers in the world. According to the
American Public Transit Association, if Americans in-
creased their use of mass transit from the current rate
of 5% to 10%, it would reduce U.S. dependence on oil
(at least half of it imported) by 40%.
THINKING ABOUT
Mass Transit
Why is there less emphasis on mass transit in the United
States than in many European and Asian countries?
Motor Vehicles Have Advantages
and Disadvantages
Motor vehicles provide mobility and offer a convenient
and comfortable way to get from one place to another.
They also are symbols of power, sex appeal, social status,
and success for many people. In addition, much of the
world’s economy is built on producing motor vehicles
and supplying fuel, roads, services, and repairs for them.
Despite their important benefits, motor vehicles
have many harmful effects on people and the environ-
ment. Globally, automobile accidents kill approxi-
mately 1.2 million people a year—an average of 3,300
deaths per day—and injure another 15 million people.
They also kill about 50 million wild animals and family
pets every year.
In the United States, motor vehicle accidents kill
more than 40,000 people per year and injure another 5
million, at least 300,000 of them severely. Car accidents
have killed more Americans than have all wars in the coun-
try’s history.
Motor vehicles are the world’s largest source of out-
door air pollution, which causes 30,000–60,000 prema-
ture deaths per year in the United States, according to
the Environmental Protection Agency. They are also
the fastest-growing source of climate-changing carbon
dioxide emissions.
Motor vehicles have helped create urban sprawl.
At least a third of urban land worldwide and half in
the United States is devoted to roads, parking lots,
gasoline stations, and other automobile-related uses.
This prompted urban expert Lewis Mumford to suggest
that the U.S. national flower should be the concrete
cloverleaf.
Another problem is congestion. If current trends
continue, U.S. motorists will spend an average of two
years of their lives in traffic jams, as streets and free-
ways in effect become parking lots. Commuter dis-
tances increase as cities sprawl out. Traffic congestion
in some cities in developing countries is much worse.
Building more roads may not be the answer. Many an-
alysts agree with economist Robert Samuelson that
“cars expand to fill available concrete.”
It Is Difficult to Reduce
Automobile Use
Some environmental scientists and economists suggest
that one way to reduce the harmful effects of automo-
bile use is to make drivers pay directly for most envi-
ronmental and health costs of their automobile use—a
user-pays approach.
7-6
How Does Transportation Affect
Urban Development?
C O N C E P T 7 - 6
A combination of plentiful land, inexpensive fuel, and an expanding
network of highways results in dispersed cities that depend on motor vehicles for most
transportation.
83376_08_ch07_p123-148.ctp 8/10/07 12:22 PM Page 144
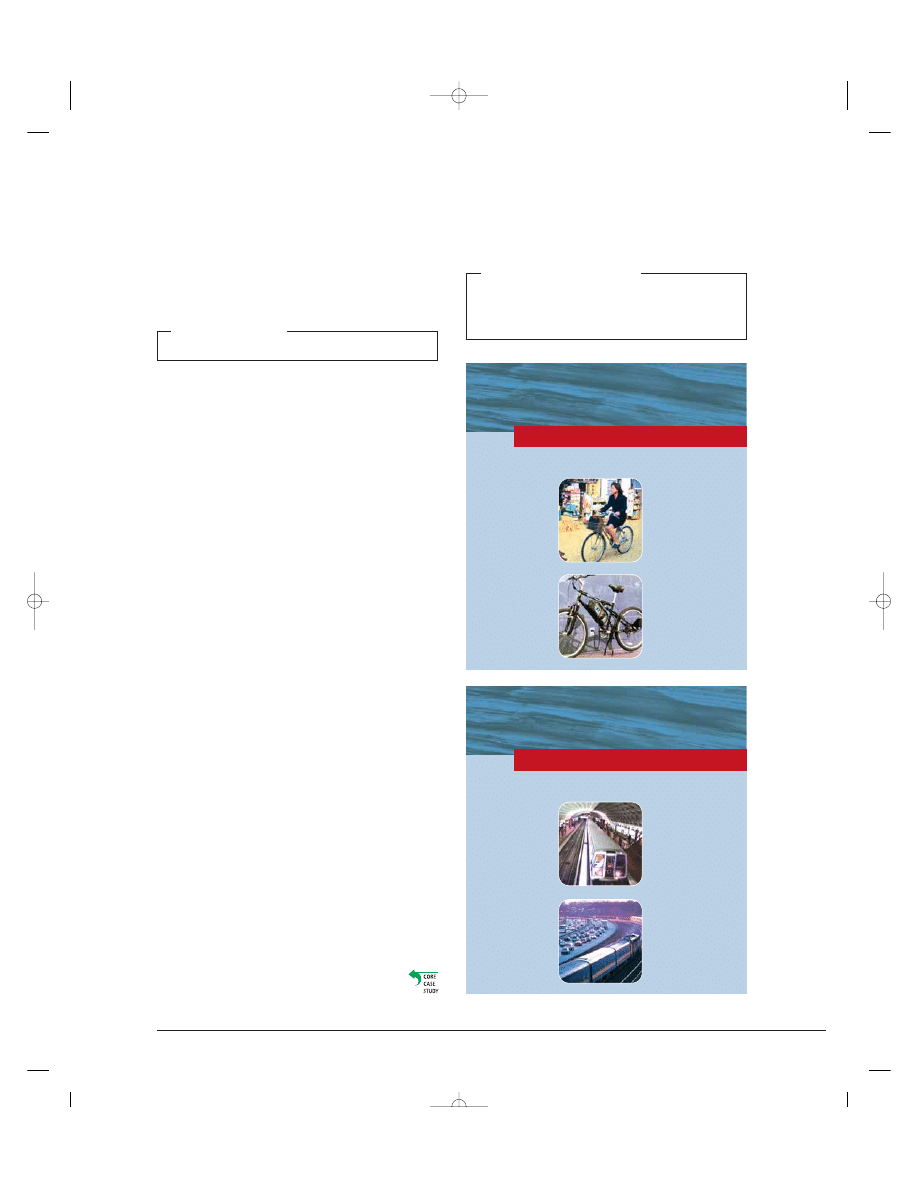
■
✓
CONCEPT 7-6
145
Little protection in an
accident
Do not protect riders
from bad weather
Impractical for long
trips
Can be tiring (except
for electric bicycles)
Lack of secure bike
parking
Affordable
Produce no
pollution
Quiet
Require little
parking space
Easy to maneuver
in traffic
Take few resources
to make
A d v a n t a g e s
D i s a d v a n t a g e s
T R A D E - O F F S
Bicycles
Expensive to build
and maintain
Cost-effective only
along a densely
populated corridor
Commits riders to
transportation
schedules
Can cause noise and
vibration for nearby
residents
A d v a n t a g e s
D i s a d v a n t a g e s
T R A D E - O F F S
Mass Transit Rail
Uses less energy
and produces less
air pollution than
cars
Requires less land
than roads and
parking areas for
cars
Causes fewer
injuries and
deaths than cars
Reduces car
congestion in
cities
Figure 7-21
Advantages
and disadvan-
tages of bicy-
cles. Question:
Which single
advantage and
which single
disadvantage
do you think
are the most
important?
Why?
Figure 7-22
Advantages
and disadvan-
tages of mass
transit rail
systems in
urban areas.
Question:
Which single
advantage and
which single
disadvantage
do you think
are the most
important?
Why?
One way to phase in such full-cost pricing would be
to charge a tax on gasoline to cover the estimated
harmful costs of driving. According to a study by the
International Center for Technology Assessment, such
a tax would amount to about $2.90 per liter ($11 per
gallon) of gasoline in the United States. This would
spur the use of more energy-efficient motor vehicles
and mass transit, decrease dependence on imported oil
and thus increase economic and military security, and
reduce pollution and environmental degradation.
RESEARCH FRONTIER
Determining the harmful costs of motor vehicles
Proponents of this approach urge governments to
use gasoline tax revenues to help finance mass transit
systems, bike paths, and sidewalks as alternatives to
cars. They suggest reducing taxes on income, wages,
and wealth to offset the increased taxes on gasoline.
Such a tax shift would make higher gasoline taxes more
politically acceptable.
Most analysts doubt that heavily taxing gasoline
would be feasible in the United States, for four reasons.
First, it faces strong political opposition from two
groups: the public, which is largely unaware of the
huge hidden costs they are already paying; and power-
ful transportation-related industries such as oil and tire
companies, road builders, car makers, and many real
estate developers. However, taxpayers might accept
sharp increases in gasoline taxes if a tax shift were em-
ployed, as mentioned above.
Second, fast, efficient, reliable, and affordable mass
transit options and bike paths are not widely available
in most of the United States. Third, the dispersed na-
ture of most U.S. urban areas makes people dependent
on cars. And fourth, most people who can afford cars
are virtually addicted to them.
Another way to reduce automobile use and urban
congestion is to raise parking fees and charge tolls on
roads, tunnels, and bridges—especially during peak
traffic times. In Germany, Austria, Italy, Switzerland,
and the Netherlands, more than 300 cities have car-
sharing networks. Members reserve a car in advance or
call the network and are directed to the closest car.
They are billed monthly for the time they use a car and
the distance they travel. In Berlin, Germany, car shar-
ing has cut car ownership by 75% and car commuting
by nearly 90%.
There Are Alternatives to Using a Car
Some good news is that mayors and urban planners in
many parts of the world are beginning to rethink the
role of the car in urban transportation systems
and are providing a mix of other options, as
they have in Curitiba, Brazil (
Core Case Study
).
There are several alternatives to motor vehicles,
each with its own advantages and disadvantages. They
include bicycles (Figure 7-21), mass transit rail systems in
urban areas (Figure 7-22), bus systems in urban areas (Fig-
ure 7-23, p. 146), and rapid rail systems between urban ar-
eas (Figure 7-24, p. 146).
HOW WOULD YOU VOTE?
Should half the U.S. gasoline tax be used to develop mass
transit, bike lanes, and other alternatives to the car? Cast
your vote online at www.thomsonedu.com/biology
/miller.
83376_08_ch07_p123-148.ctp 8/10/07 12:23 PM Page 145

146
CHAPTER 7
Applying Population Ecology: Human Population and Urbanization
We Can Build More Environmentally
Sustainable Cities
Most environmental scientists and urban planners ar-
gue for making new and existing urban areas more
self-reliant, sustainable, and enjoyable places to live
through good ecological design. (See the Guest Essay
on this topic by David Orr at ThomsonNOW.)
Smart growth is one way to encourage more en-
vironmentally sustainable development that requires
less dependence on cars, controls and directs sprawl,
and reduces wasteful resource use. It recognizes that
urban growth will occur. At the same time, it uses zon-
ing laws and other tools to channel growth into areas
where it can cause less harm. Smart growth can dis-
courage sprawl, reduce traffic, protect ecologically sen-
sitive and important lands and waterways, and develop
neighborhoods that are more enjoyable places to live.
Figure 7-25 lists popular smart growth tools used to
prevent, slow, and control urban growth and sprawl.
A more environmentally sustainable city, called an
ecocity or green city (
Concept 7-7
), emphasizes the follow-
ing goals built around the four
scientific princi-
ples of sustainability
(see back cover):
•
Build and redesign cities for people not cars
•
Use solar and other locally available, renewable en-
ergy resources and design buildings to be heated
and cooled as much as possible by nature
•
Use energy and matter resources efficiently
•
Prevent pollution and reduce waste
•
Recycle, reuse, and compost at least 60% of all mu-
nicipal solid waste
•
Protect and encourage biodiversity by preserving
surrounding land and protecting and restoring nat-
ural systems and wetlands
An ecocity is a people-oriented city, not a car-
oriented city. Its residents are able to walk, bike, or use
low-polluting mass transit for most of their travel. Its
buildings, vehicles, and appliances meet high energy-
efficiency standards. Trees and plants adapted to the lo-
cal climate and soils are planted throughout to provide
shade and beauty, supply wildlife habitats, and reduce
7-7
How Can Cities Become More Sustainable
and Livable?
C O N C E P T 7 - 7
An ecocity allows people to: choose walking, biking, or mass transit for
most transportation needs; recycle or reuse most of their wastes; grow much of their food;
and protect biodiversity by preserving surrounding land.
Can lose money because
they need low fares to
attract riders
Can get caught in traffic
and add to pollution
Commits riders to
transportation schedules
Noisy
Can be rerouted as needed
Cost less to develop and
maintain than heavy-rail
system
Can greatly reduce car use
and air pollution
A d v a n t a g e s
D i s a d v a n t a g e s
T R A D E - O F F S
Buses
Expensive to run
and maintain
Must operate along
heavily used routes
to be profitable
Causes noise and
vibration for nearby
residents
Can reduce travel
by car or plane
Ideal for trips of
200–1,000
kilometers
(120–620 miles)
Much more energy
efficient per rider
than a car or plane
A d v a n t a g e s
D i s a d v a n t a g e s
T R A D E - O F F S
Rapid Rail
Figure 7-23 Advantages and disadvantages of bus systems in urban areas. Question:
Which single advantage and which single disadvantage do you think are the most im-
portant? Why?
Figure 7-24 Advantages and disadvantages of rapid-rail systems
between urban areas. Question: Which single advantage and
which single disadvantage do you think are the most important?
Why?
83376_08_ch07_p123-148.ctp 8/10/07 12:23 PM Page 146

CONCEPT 7-6
147
Limits and Regulations
Limit building permits
Urban growth
boundaries
Greenbelts around cities
Public review of new
development
Zoning
Encourage mixed use of
housing and small
businesses
Concentrate
development along mass
transportation routes
Promote high-density
cluster housing
developments
Planning
Ecological land-use
planning
Environmental impact
analysis
Integrated regional
planning
State and national
planning
Protection
Preserve existing open space
Buy new open space
Buy development rights that
prohibit certain types of
development on land parcels
Taxes
Tax land, not buildings
Tax land on value of actual use
(such as forest and agriculture)
instead of on highest value as
developed land
Tax Breaks
For owners agreeing not to allow
certain types of development
(conservation easements)
For cleaning up and developing
abandoned urban sites
(brownfields)
Revitalization and New Growth
Revitalize existing towns and cities
Build well-planned new towns and
villages within cities
S O L U T I O N S
Smart Growth Tools
Figure 7-25 Smart growth or new urbanism tools used to prevent,
slow, and control urban growth and sprawl. Questions: Which five of
these tools do you think are the most important ways to prevent or
control urban sprawl? Why? Which, if any, of these tools are being used
in your community?
pollution, noise, and soil erosion. Small organic gar-
dens and a variety of plants adapted to local climate
conditions often replace monoculture grass lawns.
Parks are easily available to everyone.
In an ecocity, abandoned lots, industrial sites, and
polluted creeks and rivers are cleaned up and restored.
Nearby forests, grasslands, wetlands, and farms are pre-
served. Much of an ecocity’s food comes from nearby
organic farms, solar greenhouses, community gardens,
and small gardens on rooftops, in yards, and in win-
dow boxes. People designing and living in ecocities
take seriously the advice that U.S. urban planner Lewis
Mumford gave more than three decades ago: “Forget
the damned motor car and build cities for lovers and
friends.”
The ecocity is not a futuristic dream. Examples of
cities that have attempted to become more environ-
mentally sustainable and livable include Curitiba, Brazil
(
Core Case Study
); Waitakere City, New Zealand;
Stockholm, Sweden; Helsinki, Finland; Leich-
ester, England; Neerlands, the Netherlands; and in the
United States, Portland, Oregon; Davis, California;
Olympia, Washington; and Chattanooga, Tennessee
(Case Study, p. 18).
RESEARCH FRONTIER
Evaluating and improving the design and expansion of
ecocities
R E V I S I T I N G
Curitiba, Population Growth, and Sustainability
This chapter explored issues related to human population growth
and its distribution. As elsewhere in this text, we focused on
sustainability in discussing the issues. For example, we know that,
each week, 1 million people are added to urban areas, just in
developing countries. For the human population to live more sus-
tainably, cities will have to accommodate this sort of growth with-
out seriously depleting or degrading the natural capital available
to them locally and throughout the world.
Curitiba, Brazil (
Core Case Study
), is one city in a develop-
ing country that has made great strides toward becoming envi-
ronmentally sustainable. Its 2 million people have opportunities
for living well or improving their lives, and its ecological footprint
is considerably smaller than that of most cities its size. Curitiba’s
story gives us hope for managing human population growth in
many of the world’s urban areas more sustainably in the short
run. However, rapid population growth has hindered such efforts.
The most difficult challenge is to convert the little- or no-hope
cities in the world’s poorest countries to cities full of hope.
For the long run, some experts say, we ought to ask what is
the optimal level of human population that the planet can sup-
port sustainably? That is, at what level could the maximum num-
ber of people live comfortably and freely without jeopardizing the
earth’s ability to provide the same comforts and freedoms for fu-
ture generations?
In the first six chapters of this book, you have learned how
ecosystems and species have sustained themselves throughout
history by use of four
scientific principles of sustainability
—
relying on solar energy, biodiversity, population control, and nutri-
ent recycling (see back cover). In this chapter, you may have
gained a feel for the need for humans to apply these sustainability
principles to their lifestyles and economies.
In the next two chapters, you will learn how various principles
of ecology and the four scientific principles of sustainability can
be applied to help preserve the earth’s biodiversity.
Our numbers expand but Earth’s natural systems do not.
LESTER R. BROWN
83376_08_ch07_p123-148.ctp 8/10/07 12:23 PM Page 147

148
CHAPTER 7
Applying Population Ecology: Human Population and Urbanization
R E V I E W Q U E S T I O N S
1. Explain why the city of Curitiba, Brazil is regarded as a
model for urban planning and sustainability.
2. Describe the three major factors that have caused the hu-
man population to grow exponentially.
3. Explain how the interplay between births, deaths, and
migration affect changes in population. Describe how two
types of fertility rates affect a country’s population size
and growth rate.
4. Describe population and immigration trends in the United
States since 1900.
5. Explain the role that age structure plays in determining
the population of each country.
6. How does the population structure differ in developing
and developed countries? How can these age structure
diagrams be used to make future population and eco-
nomic projections?
7. With reference to the demographic transition, discuss the
most effective ways to slow population growth.
8. Compare and contrast the success of the policies utilized
by China and India in slowing their population growth.
9. What are five major trends in urban growth? Explain the
role that motor vehicles have played in urbanization.
10. Describe how smart growth and ecocities can help prevent
and control urban growth and sprawl.
C R I T I C A L T H I N K I N G
1. List three ways in which you could apply
Concepts 7-1
and
7-7
to make your lifestyle, and that of any children and
grandchildren you might have, more environmentally
sustainable.
2. Curitiba, Brazil (
Core Case Study
), has made signif-
icant progress in becoming a more environmen-
tally sustainable and desirable place to live. What steps, if
any, has the urban area in or near where you live taken
toward becoming more environmentally sustainable? List
five ways to make it more environmentally sustainable.
3. Identify a major local, national, or global environmental
problem, and describe the role of population growth in
this problem.
4. Why is it rational for a poor couple in a developing coun-
try such as India to have four or five children? What
changes might induce such a couple to consider their be-
havior irrational?
5. Do you believe that the population is too high in (a) the
world (Case Study, p. 126), (b) your own country, and
(c) the area where you live? Explain.
6. Should everyone have the right to have as many children
as they want? Explain.
7. Some people believe the most important goal is to sharply
reduce the rate of population growth in developing coun-
tries, where 97% of the world’s population growth is ex-
pected to take place. Others argue that the most serious
environmental problems stem from high levels of re-
source consumption per person in developed countries,
which use 88% of the world’s resources and have much
larger ecological footprints per person (Figure 1-8, p. 13).
What is your view on this issue? Explain.
8. Do you believe the United States or the country where
you live should develop a comprehensive and integrated
mass transit system over the next 20 years, including
building an efficient rapid-rail network for travel within
and between its major cities? How would you pay for
such a system?
9. Congratulations! You are in charge of the world. List the
three most important features of your (a) population pol-
icy and (b) urban policy.
10. List two questions that you would like to have answered
as a result of reading this chapter.
L E A R N I N G O N L I N E
Log on to the Student Companion Site for this book at
www
.thomsonedu.com/biology/miller
and choose Chapter 7 for many
study aids and ideas for further reading and research. These in-
clude flash cards, practice quizzing, Web links, information on
Green Careers, and InfoTrac
®
College Edition articles.
For access to animations and additional quizzing, register and
log on to
at www.thomsonedu.com/thomsonnow
using the access code card in the front of your book. You can
also explore the
Active Graphing
exercises that your instructor
may assign.
83376_08_ch07_p123-148.ctp 8/10/07 12:23 PM Page 148
Wyszukiwarka
Podobne podstrony:
Environmental Science 12e Chapter 01
Environmental Science 12e Chapter 14
Environmental Science 12e Chapter 09
Environmental Science 12e Chapter 04
Environmental Science 12e Chapter 06
Environmental Science 12e Chapter 12
Environmental Science 12e Chapter 16
Environmental Science 12e Chapter 02
Dictionary Chapter 07
Intro to ABAP Chapter 07
Environmental sciences
Environmental science study
Dictionary Chapter 07
English Skills with Readings 5e Chapter 07
Exploring Economics 4e Chapter 07
więcej podobnych podstron