
EIB SECTOR PAPERS
THE EUROPEAN AUDIOVISUAL INDUSTRY:
AN OVERVIEW
PJ/Industry & Services
Olivier Debande
OP2/IGI1-Infra
Guy Chetrit
September 2001

The European Audiovisual Industry: an Overview
O. Debande & G. Chetrit – 07/09/01 – Final version
CONTENTS
THE EUROPEAN AUDIOVISUAL INDUSTRY
2.1. Definition of the sector ................................................................................................................. 10
2.2. The audiovisual market ............................................................................................................... 15
2.3. Consumption of audiovisual products ........................................................................................ 19
ECONOMIC CHARACTERISTICS OF AUDIOVISUAL PRODUCTS
MARKET STRUCTURE OF THE AUDIOVISUAL INDUSTRY
4.1.1. Production .......................................................................................................................... 34
4.1.2. Film
4.1.3. Exhibitions.......................................................................................................................... 46
4.1.4. The Video/DVD industry .................................................................................................... 53
4.1.5. The film life cycle................................................................................................................ 56
4.2.1. Production .......................................................................................................................... 60
4.2.2. Regulation........................................................................................................................... 66
4.2.3. Diffusion
FINANCING OF THE AUDIOVISUAL INDUSTRY
APPENDIX 1: SELECTED TABLES AND FIGURES
APPENDIX 2: PUBLIC AID MECHANISMS IN THE EUROPEAN UNION
APPENDIX 3: AUDIOVISUAL GLOSSARY
APPENDIX 4: SOURCES OF INFORMATION

The European Audiovisual Industry: an Overview
O. Debande & G. Chetrit – 07/09/01 – Final version
3
EXECUTIVE SUMMARY
A REVIEW OF THE AUDIOVISUAL INDUSTRY
The production and distribution cycles…
The audiovisual industry, for the purpose of this study, covers the film, broadcasting
(television and radio), video and multimedia markets. These industries are broadly divided
into various stages of activity, representing the production and commercialisation life cycle:
§ Development stage at which the producer acquires the right on an original
screenplay, searches artistic and financial partners and estimates the budget for the
film or TV production;
§ Production stage covering the pre-production during which the producer will gather
all the human (production crew, casting), technical (shooting schedules, selections of
locations) and financial resources (budget) necessary for the film or TV production,
the shooting of the film and the post-production of the film covering the editing of the
film, the introduction of the soundtrack, special effects…;
§ Distribution stage at which the film is promoted and sold to exhibitors by the
distribution company, or the TV programme is packaged and transmitted to the
viewers by various delivery technologies;
§ Exhibition and broadcasting stage at which the film or TV programmes are shown of
cinema screens and TV screens.
Those various activities are interrelated. Indeed, the distribution of films or TV programmes
is carried out at different stages. In the case of film’s production, the producers license the
distribution rights to one territory for a specified period time to a local or to international
distributors who in this case acquire the rights for some countries. Then, the distributors sub-
license directly the exhibition rights to exhibitors for diffusion in cinema and to video
distributors. In addition, as for TV programmes, the producers pre-sell the broadcasting
rights to TV channels.
In the case of films, the release on the various market segment or windows (i.e., cinema,
video/DVD, pay-TV, free TV…) representing the distribution life cycle of a film has to respect
a well-defined timing to ensure that the film generates a satisfactory return on each of them.
In general, all film’s revenues are collected during the first five years of the film’s distribution
life cycle, the main part being collected within the first 18 months. This notion of distribution
life cycle is less relevant for TV programmes which are essentially produced to be broadcast
on TV.
…unique economic features
The AV industry has various economic features on the supply and demand sides:
•
Demand-side: Since the AV product is an experience good, consumers face an
informational problem when having to decide on their level of consumption leading
to:
§ Demand uncertainty about the willingness of consumers to spend on new AV
products. This gives rise to mitigating strategies developed by suppliers in order
to increase access to information (like the use of superstars, prize and awards,
advertising and promotional campaign, certification mechanism);
§ Consumption pattern dependent on tastes and income constraints and affected by
social behaviours and interactions.

The European Audiovisual Industry: an Overview
O. Debande & G. Chetrit – 07/09/01 – Final version
4
•
Supply-side:
§ Production costs function exhibiting high fixed and/or sunk costs and low
marginal costs giving an advantage to a large domestic market able to benefit
from economies of scale;
§ Creative skills are a crucial input showing the importance of an effective
management of the production process requiring the recourse to experienced
managerial team;
§ Prevalence of market failures (spillovers, cultural externalities) and protection of
intellectual property rights, justifying some form of public regulations either of
the market structure or of the conduct of the different players;
§ Importance of digital technological developments for various segments of the
industry and stages of the product life cycle, associated with a convergence of
services, delivery technologies and end-use equipment concerned with
telecommunications, audiovisual and information technology.
…market size
In 1999, the size of the world AV market (covering EU, US and Japan) was estimated at
around EUR 190 billion, corresponding to an average annual growth rate of 10% since 1995.
The contribution of the TV sector (i.e. free TV financed by TV advertising and licence fees and
pay-TV financed by subscription) to the AV market reached 78% in 1999, pushed by the
development of pay-TV and the advertising market. The AV market has been characterized by
a trend to corporate consolidation through merger and acquisition increasing the level of
concentration and giving rise to an oligopolistic market with a competitive fringe.
The European AV market accounted for 31% of the world AV market in 1999, as in 1995.
Compared to the US, the European market is characterized by the high share of licence fees,
still accounting for a share equivalent to pay-TV. In 1999, the five major AV European
markets were: the UK (30% of the AV European market), Germany (20%), France (18%),
Italy (10%) and Spain 6%). By 2005, the European AV market is expected to double its size
compared to 1995, i.e. around EUR 88,8 billion compared to EUR 41,0 billion in 1995. This
evolution reflects the increased consumption of AV products by European households.
Although the penetration of TV equipment in households has been high for many years, the
development of the market has been sustained by the emergence of new AV support, and
delivery systems like DVD, PCs and mobile phone. This review of the European AV market
does not include the situation in the Accession Countries. However, Czech Republic,
Hungary and Poland remain important markets, attracting subcontracted works from
European and American producers in their studios thanks to their skills and low labour-costs
and developing operations or partnership with European distributors.
…market structure and the American studio system
Although the economic characteristics of the AV products are prevailing in the European and
US markets, the American AV industry is more competitive, especially in its ability to export
content production. Indeed, the EU faces an important trade deficit with the US for AV
programme, estimated to EUR 5.9 billion in 1998, an increase in 56% in money terms,
between 1993 and 1998. It reflects the high penetration rate of American AV products in the
EU. The market share of American films, defined in terms of admissions, in the EU was
around 73.7% in 2000. For the TV market, despite the success of national TV fictions, the
share of American programmes was estimated to 70% of the volume of imported fiction.
In addition to the adverse effect of the fragmentation of the European AV market on the
competitiveness of European AV products, this American dominance rests on the size of the
domestic market and their market organisation, i.e. the so-called studio system. Indeed, the

The European Audiovisual Industry: an Overview
O. Debande & G. Chetrit – 07/09/01 – Final version
5
major American studios have focused their activities on films’ distribution, relying on an
efficient worldwide network and dominant brands (MGM, 20
th
Century Fox, Walt Disney),
which also act as powerful barriers to entry, and sub-contracted part of the production
activities to independent producers. The pivotal role of the studios implies that the
production of a film is considered as a purely commercial project, integrating the distribution
strategy right from the conception and development stage of the film. This evolution of the
American market has led to a specialisation in action-oriented films including sensation and
special effects, since these films are well-suited for a mass-market distribution, typified by the
size and uniformity of the domestic market leading to a distinct supply-side advantage. In
addition, these American studios manage the rights of the most important and profitable film
library, which strengthen their market power.
…features of the European AV industry
In addition to a lack of integration between the various stages of the production life cycle in a
fragmented European AV market, the review of the European AV industry has allowed to
identify specific factors affecting each stage:
•
Development stage:
§ lack of investment by producers in this stage in comparison to the US market
and acceptable standards for “prototype” industries due to under-capitalisation
of producers and shortage of external funds;
§ high rate of continuation of projects, leading to too many unviable films going to
the production stage.
•
Production stage:
§ sufficient film production in the EU, with risk of over-supply of film (higher than
in the US in 1999), ensuring diversity in the supply of films with respect to
cultural and linguistic tastes of the consumers;
§ increased supply in European TV fiction denoting the greater interest of viewers
for national TV programmes;
§ fragmentation of the national European market, not compensated by the
development of coproduction schemes even if they increase their share in the
number of films produced;
§ lack of adequate financing, partially compensated by the existing public support
which could to some extent reinforce the market segmentation;
§ prevalence of small independent films and TV producers.
•
Distribution stage:
§ strong market position of national distributors on their own markets and
absence of EU wide studios, while US majors have distribution subsidiaries in
most of the European countries allowing them to maximise the release policy of
the films across markets,
§ low rate of distribution of films outside the national market as well as
circulation of national TV production to other European non-national channels;
§ upstream adverse effect of the lack of European integration of the distribution
stage on production, since few distributors commit themselves to pre-sell
European non-national films until they have demonstrated their commercial
potential on their national market;
§ ability of US distributors to amortise their promotion costs on their domestic
market and hence to invest sufficiently in the promotion and marketing of the
film (P&A costs), while European distributors have to adapt their strategy to
each national context;

The European Audiovisual Industry: an Overview
O. Debande & G. Chetrit – 07/09/01 – Final version
6
§ selling of the rights on successful European TV reality/game shows to US
channels.
•
Exhibition and broadcasting stage:
§ strong investment, partially initiated by US exhibitors, led to a modernisation of
the existing “fleet” of cinemas, namely with the building of multi and
megaplexes;
§ consequent saturation of most European cinema markets, with the exception of
Italy and Spain, and high degree of indebtedness of exhibitors, reducing their
flexibility to adapt to new/future exhibition technologies;
§ increase in the transmission rights on major sport events and to a lower extent
on films;
§ high potential for the technological development of new AV services (video-on-
demand, interactive services);
§ entry of new specialised TV channels benefiting from the development of digital
cable and satellite transmission, generating additional demand for AV works.
…the financing
The financing of the production of films and TV programmes rests on various sources of
funding: pre-sales of rights to TV channels and video/DVD distributors, minimum guarantee
payments from domestic or international cinema distributors, cash investment from the
production companies and public support from national and/or European authorities. TV
channels play an important role in the financing of European AV works. Indeed, European
TV channels have become a major contributor in film financing and have sustained the
production slates of independent producers in terms of TV series. However, the involvement
of TV channels and/or distributors in the financing of AV works generates a major drawback
for the producer, i.e. the loss of control on the rights associated with the film or TV
programmes. Indeed, especially in the case of production companies which are under-
capitalised, the producer is constrained to pre-sell all the distribution rights associated to his
film and therefore cannot grow and diversity its activities.
The nature of the film financing business is similar to project finance since the repayment
does not come from the production company ability to generate cash-flow but from its ability
to bring the film upon completion within a given budget and to generate necessary revenues
to repay the debt. The European film finance market is characterized by a relatively narrow
lending capacity reflecting its expert nature and the deterrence effect of past mistakes. At the
difference of the US market, European banks are mainly discounting contracts from TV pre-
sales and minimum guarantee and are not providing true gap financing
financing US film production. The securitisation of a future slate of completed films
(portfolio approach) is playing an increasing role in film financing. Another major difference
between the European and US markets is the importance given to public support in European
film and TV programmes financing.
…a general conclusion
The audiovisual sector is important for the balanced development of the EU, given the
associated industrial and cultural challenges and the weight of the new technologies. It is
characterized by a variety of actors, from small firms to large groups, and also suffers from
“fragmentation” problems. This explains some of the weaknesses observed in the EU, in
particular with respect to the US, resulting in high penetration rates of US films and TV
1
Gap financing means the financing of a film for which the pre-sales of rights on the film do not cover the budget (in general, funds are still
needed but there is also unsold territory rights).

The European Audiovisual Industry: an Overview
O. Debande & G. Chetrit – 07/09/01 – Final version
7
programmes, and in an important trade deficit. Three points are worth stressing in this
general conclusion.
The first is the importance of the distribution segment to ensure the long-term competitiveness
and viability of this industry. The distribution of films to exhibitors corresponding to the last
stage of the cinema chain is a crucial link to secure the wide access to the market. There can
be only few profitable distribution networks, and the up-front capital investment required to
establish them is sizeable. By having acquired the control on this segment, the American
major studios have created some barriers to entry, leading to a situation where European
films are essentially distributed on their domestic market. In addition, the European market
is characterized by a lack of investment of national distributors in the promotion and
advertising of the film. The support of distribution networks at the national and European
level, in order to favour the emergence of a structure similar to the American studio, is an
important element of an industrial policy for the AV sector.
In parallel, the current level of films and TV production, realized essentially by SMEs,
ensures the preservation of cultural and linguistic diversity across the EU. There is a need to
preserve this European advantage, generating positive external effects that go beyond the AV
industry. In addition, the development of new digital technologies offering new outlets for
distribution of films will promote the preservation of the cultural and linguistic diversity. The
recent development in the online film distribution system pushed by initiatives from the major
US studios stresses the need for accelerating the European action in this field. The support of
film and TV production preserving cultural diversity at the European level, integrated into a
proper “pre-production” development for the screening of AV products is a complementary
European policy to achieve a balance between industrial and cultural objectives.
Finally, the expansion of the TV industry has been considered as “complementary” to the
growth of the cinema industry by inducing a demand for films and creating a new interest
among viewers for cinema production. As a consequence, TV channels have become a major
contributor in film financing and sustained the production slates of independent producers.
The European TV market is also characterized by the competition between public and private
broadcasters, which contribute to ensure plurality in the information broadcast as well as
cultural diversity. The balanced support of public and private TV channels, to preserve the
level of competition in the market, will contribute to spur the consumer's interest in a
diversified “content" and to channel funding for AV works.

The European Audiovisual Industry: an Overview
O. Debande & G. Chetrit – 07/09/01 – Final version
8
1.
INTRODUCTION
The audiovisual (AV) sector has an important economic and social role. On the economic side, this
sector has been growing rapidly, reaching a total market value estimated to EUR 61,5 billion in 2000
in the EU. It is a highly labour intensive sector, providing jobs to high-skilled people and hence being
less exposed to competition from low labour cost markets. On the social side, the role of media is
crucial by making information available to citizens and shaping their belief systems and forming their
cultural identity. In this context, the broadcasting industry has an important role given the time spend
by Europeans each day watching television or listening radio. In parallel, cinema attendance in
Europe has risen sharply during the 1980s and the emergence of new communication channel like
Internet has sustained the expansion of the AV sector, at a time where leisure time and income are
increasing.
This sector has attracted a lot of attention and support from national and European public authorities.
The various national and European policies have been mainly oriented to defending the European
cultural heritage and preserving a sufficient diversity and pluralism in the supply of AV works. In
parallel, these policies have tried to achieve industrial objectives by strengthening the competitiveness
of the AV industry.
However, despite the public support, the European AV sector is still characterised by the increasing
presence of American AV works, as demonstrated by the size of the total European AV deficit
evaluated to EUR 5.9 billion in 1998. This situation reflects: (i) the economic characteristics of AV
products (non-rivalry attributes of public goods on the consumption side and high fixed costs and low
marginal cost on the production side) implying that the viewing by one consumer does not preclude
the enjoyment by other viewers; (ii) the size of the US market (in terms of cinema, TV and video
penetration rate as well income per capita) providing opportunity for cost amortisation in the domestic
market; (iii) the organisation of the so-called US studios enabling them to benefit from important
economies of scale in films’ distribution and to create barriers to entry; and (iv) the wide-spread use of
English limiting the “cultural discount” effect due to differences of styles, cultural references and
preferences,… As a consequence, the rate of penetration of US AV works is particularly high.
This situation could be affected by the important technological evolutions following the digital
revolution. First, by allowing the entry of new competitors, especially in the broadcasting industry,
but at the same time accelerating the convergence and globalisation of the AV industry, the market
structure has evolved towards an oligopolistic structure confronted with a competitive fringe. Second,
the technology changes in the sector are affecting production (film digitalisation, video game
animation, music DVD…) and distribution (DVD again, internet, satellite and broadband
narrowcasting, video-on-demand…). This evolution could benefit to European producers offering
increased flexibility and diversity in the exploitation of their works. At the same time, it raises new
challenges to the regulatory framework of the sector, especially in the filed of intellectual property
rights protection.
The financing of the AV sector could be assimilated to a form of project financing since the repayment
does not come from the production companies ability to generate cash flow but from its ability to
bring the film upon completion within a given budget, and exhibiting at the same time the risks of
R&D projects. Indeed, each AV work is a unique product, characterized by important demand and
cost uncertainty. As an illustration, an industry rule of thumb is that from a portfolio of ten films, six
to seven will lose money on their cinema release, two to three will break-even and one performing
very well. As a consequence, the lending capacity of the AV market is relatively narrow, especially in
the EU. Only a few banks are active on the market due to its expert's nature and deterrence from past
mistakes. In addition, European banks are mainly discounting contracts from TV pre-sales and
distribution sales and not providing gap financing (unless they are financing US production), i.e. the
financing of a film for which the pre-sales of rights on the film do not cover the budget. The ability of
the European AV industry to improve its competitiveness and to take full benefit from the current
technological evolution of the sector needs additional financial investments as well as the development
of appropriate financial instruments.

The European Audiovisual Industry: an Overview
O. Debande & G. Chetrit – 07/09/01 – Final version
9
2.
THE EUROPEAN AUDIOVISUAL INDUSTRY
The audiovisual industry, for the purpose of this study, covers the film, broadcasting (television and
radio), video and multimedia markets. These industries are broadly divided into various stages of
activity, representing the production and commercialisation life cycle:
§ Development stage at which the producer acquires the right on an original screenplay,
searches artistic and financial partners and estimates the budget for the film or TV
production;
§ Production stage covering the pre-production during which the producer will gather all the
human (production crew, casting), technical (shooting schedules, selections of locations) and
financial resources (budget) necessary for the film or TV production, the shooting of the film
and the post-production of the film covering the editing of the film, the introduction of the
soundtrack, special effects…;
§ Distribution stage at which the film is promoted and sold to exhibitors by the distribution
company, or the TV programme is packaged and transmitted to the viewers by various
delivery technologies;
§ Exhibition and broadcasting stage at which the film or TV programmes are shown of cinema
screens and TV screens.
Those various activities are interrelated. Indeed, the distribution of films or TV programmes is
carried out at different stages. In the case of film’s production, the producers license the distribution
rights to one territory for a specified period time to a local or to international distributors who in this
case acquire the rights for some countries. Then, the distributors sub-license directly the exhibition
rights to exhibitors for diffusion in cinema and to video distributors. In addition, as for TV
programmes, the producers pre-sell the broadcasting rights to TV channels.
In the case of films, the release on the various market segment or windows (i.e., cinema, video/DVD,
pay-TV, free TV…) representing the distribution life cycle of a film has to respect a well-defined
timing to ensure that the film generates a satisfactory return on each of them. In general, all film’s
revenues are collected during the first five years of the film’s distribution life cycle, the main part
being collected within the first 18 months. This notion of distribution life cycle is less relevant for TV
programmes which are essentially produced to be broadcast on TV.
In 1999, the size of the world AV market (covering EU, US and Japan) was estimated at around EUR
190 billion, corresponding to an average annual growth rate of 10% since 1995. The contribution of
the TV sector (i.e. free TV financed by TV advertising and licence fees and pay-TV financed by
subscription) to the AV market reached 78% in 1999, pushed by the development of pay-TV and the
advertising market. The AV market has been characterized by a trend to corporate consolidation
through merger and acquisition increasing the level of concentration and giving rise to an
oligopolistic market with a competitive fringe.
The European AV market accounted for 31% of the world AV market in 1999, as in 1995. Compared
to the US, the European market is characterized by the high share of licence fees, still accounting for
a share equivalent to pay-TV. In 1999, the five major AV European markets were: the UK (30% of the
AV European market), Germany (20%), France (18%), Italy (10%) and Spain 6%). By 2005, the
European AV market is expected to double its size compared to 1995, i.e. around EUR 88,8 billion
compared to EUR 41,0 billion in 1995. This evolution reflects the increased consumption of AV
products by European households. Although the penetration of TV equipment in households has been
high for many years, the development of the market has been sustained by the emergence of new AV
support, and delivery systems like DVD, PCs and mobile phone.
The American AV industry is more competitive than the EU one, especially in its ability to export
content production. Indeed, the EU faces an important trade deficit with the US for AV programme,
estimated to EUR 5.9 billion in 1998, an increase in 56% in money terms, between 1993 and 1998. It
reflects the high penetration rate of American AV products in the EU. The market share of American
films, defined in terms of admissions, in the EU was around 73.7% in 2000. For the TV market,

The European Audiovisual Industry: an Overview
O. Debande & G. Chetrit – 07/09/01 – Final version
10
despite the success of national TV fictions, the share of American programmes was estimated to 70%
of the volume of imported fiction
.
2.1.
Definition of the sector
The notion of the audiovisual (AV) sector covers the film, broadcasting (television and radio), video
and multimedia industries. This definition
has to be distinguished from the “creative (or content)
industries” defined as industries in which the product or service contains a substantial amount of
artistic or creative endeavour. Following the definition of the UK Creative Industries Task Force, the
latter covers “those activities which have their origin in individual creativity, skill and talent and
which have a potential for wealth and job creation through the generation and exploitation of
intellectual property”. The notion of creative industries includes, in addition to the audio-visual
sector, architecture, art and antique market, design, software, music, the visual arts (painting,
sculpture), the performing arts (theatre, opera, concerts, dance), and book and magazine publishing.
Another approach is to talk about media sector with a distinction between print media (newspapers,
magazines, freesheets, books) and electronic media (TV programmes, radio programmes, feature
films, video programmes and music).
The structure of the AV industry appears to be multidimensional and complex. Different players such
as content providers, right-holders, content distributors, operate in the value chain from the production
of content such as films, TV programmes or music to its delivery via cinema, TV channels or Internet
portals. For the scope of this study, the AV sector essentially cover film, broadcasting (radio and
television) and to some extent the video/DVD market
. Before reviewing the market, a description of
the film and broadcasting industry
is provided on the basis of identifying the various production
stages, based on the “value chain” approach.
This approach
has been developed by Porter aiming to propose an instrument of competition-oriented
business analysis that serves the development of strategies. A company’s value chain comprises its
value activities together with the profit margin. Describing the business activities as a simple
sequence of investment, production, sales and billing or collections, this approach allows for instance
to integrate the concept of product cycles and market life cycles (see Zerdick et al. (2000) for an
application to the audiovisual sector).
Film industry
The production of films follows a specific time line, involving successive "creative" decision stages
with corresponding “economic” sunk costs. Figure 1 describes the film industry structure: the
sequence of the production and distribution of a film, the flow of revenue and the time of the film-
making process for a “standard” film. The development phase includes the initial idea of the product
(in this case the writing of the script, based on either an original screenplay or some external literary
source), the search for partners (technical, artistic and financial), the budget estimate and the finance
plan. The development phase is crucial. It aims to make an evaluation, suitable for a “go - no go”
decision, of:
(i) the feasibility of the production;
(ii) the commercial potential of the product; and
(iii) the cost and likely return on investment.
2
The notion of “entertainment industry” is also often used in the US and covers films and TV programmes, music, broadcasting, cable
television, games, sports, performing arts, theme parks and toys. This approach does not reflect the real cultural and educational dimension
of those activities.
3
At some places in the study, reference will be made to other sub-sectors like music, multimedia and video games; however, without
providing a full analysis.
4
The video/DVD industry being only a distribution medium is not reviewed in this section.
5
This concept is close to an approach in terms of production chains, allowing to identify four main components applicable to each sub-
sector: (1) content creation, i.e. the creation of original new script, image… and intellectual property that is intended for audiovisual
production, distribution and consumption, (2) manufacturing inputs, i.e. the translation of content into material forms (such a programme or
film) requiring inputs which needs to be manufactured and are co-dependent upon content creators; (3) reproduction, i.e. the reproduction or
distribution of the one-off to many via various means (tapes, disk…) and (4), exchange, i.e. the wholesale and retail consumption of
audiovisual products. This “production chain” approach is more-input oriented than the full “value chain”

The European Audiovisual Industry: an Overview
O. Debande & G. Chetrit – 07/09/01 – Final version
11
By determining whether the project will progress to the production stage, the development phase is a
pre-requisite for even commencing the value chain. As emphasised later in the study, one major
difference between the US and European film industries is the importance attached to the
development phase in the US, allowing for a rigorous filtering ex ante of the alternative project
proposals according to market prospects, leading to a higher abandonment rate of unprofitable projects
and hence reducing the risk of failure.
Figure 1: The Film Industry Value Chain
Pre-
production
Production
Post-
production
Rights
Library/asset
Management
Packaging
Marketing
Distribution
Exhibition
Development
Producer
Producer
Producer/
Director
Producer/
Film laboratories
Owner of rights
Distributor
Cinemas/Broad-
casting station
•Formulating idea
•Acquiring rights
•Preparing the
outline
•Seeking financing
•Seeking creative
talents
•Preparing budget
•Preparing
production schedule
•Finalising filming
schedule
•Finalising
production budget
•Obtaining
insurance
•Completion
•Establishing
locations
•Booking
facilities and
stages
•Direction
•Production
•Filming
•Controlling
•Editing the film
•Soundtrack
•Effects
•Title
•Prints
•Sale of rights
•Stock management
•Advertising/
promotion
•Sale and distribution
•Synchronisation/
copies
•Bundling
•Cinema screening
•TV screening
•Video/DVD
release
etc.
Revenue return
Revenue return
9 months
3 months
3 à 9 months
5 years and more
3 months
Source: Adapted from Zerdick et al. (2000)
Once the screenplay has been finalised and the producer has obtained the literary rights, the producer
will negotiate and secure the financing for the project and recruit the key "creative" inputs – the
director and principal actors. Only when these aspects have been fulfilled will the project progress to
the next, “pre-production” phase, characterized by the hiring of additional creative staff, the
finalisation of the production budget as well as the production schedule and the selection of the film
location and the booking of the required production facilities (studio…).
After the production of the film, i.e. the shooting of film resulting in the creation of the filmed
material, the exposed film then enters post-production processing in which the director, a specialist
editor, and perhaps others “cut” the film and assemble it in successive drafts that move towards a
completed negative. A composer writes and records a musical score that is added to the sound track.
The final version then passes into the hands of the distribution company, which prepares a plan for
promoting marketing and exhibiting it. Distributors face complicated issues dealing with many
exhibitors network and promoting the film to the public. Deals must be structured with many
exhibitors, sometimes by contracts made before film’s completion. The scale of effort required for
efficiently promoting and exhibiting a new film limits the number of films that can be profitably
launched at any one time. This makes the launch of a film an extremely time-sensitive process
because the initial cash-flow generated will depend on the short-run competition from other freshly
released films and on the amount invested in Print and Advertising (P&A).
The description of the film industry value chain allows to identify the basic cost components of a film
(or film negative costs). A distinction has to be done between the “above-the-line” costs and the
“below-the-line” costs
. The former category is the costs of a film’s creative elements including cast
6
Vogel (2001)

The European Audiovisual Industry: an Overview
O. Debande & G. Chetrit – 07/09/01 – Final version
12
and literary property acquisition. The latter covers all costs, charges and expenses incurred in the
production of a film, other than the “above-the-line” costs, including items like crews and vehicles,
transportation, shelter, and props. For instance, for each film, wardrobes and props must be made or
otherwise acquired, locations must be rented, and scene production and travel schedules must be
planned. The “above-the line” costs concern more the development and pre-production/production
phases, while the other costs cover the production and post-production activities. A relationship has
been identified between the size of the budget and the cost components: the lower the budget, the
higher will be the share of the budget spent on “below-the-line” costs and vice versa. The share of
both types of costs could be affected in the future by the development of digital technology, in
particular with respect to the relative share of post-production costs. Both categories of costs could be
summarised as follows:
“Above-the-line” costs
“Below-the-line” costs
§ Actors
§ Directors
§ Producers
§ Writers (story, scenario)
§ Music rights
§ Productions costs
-
Labour (production staff)
-
Technical costs (camera, etc.)
-
Set construction
-
Wardrobe
-
Locations and travel expenses
-
Miscellaneous
§ Post-production costs
-
Film editing
-
Sound track
-
Laboratory effects
-
…
§ Other direct costs
-
Administration
-
Insurances
-
Publicity
Practically all the revenues generated by a film are received within the first five years of film’s life.
The majority of such revenues are received within 18 months of a film’s distribution cycle. Indeed,
after exhibition in its home country, the film passes over the next several years into other channels:
exhibition abroad, same on video-cassette/DVD, showing on pay-TV
, then free TV… The “profit
release windows”
representing the life cycle of a film, could be described as, on the basis of its
revenue potential along the different market segments, according to territoriality (by country and
linguistic zone) and time (duration of distribution rights) agreements:
Cinema
screening
Video/DVD
sales/
rental
Pay-TV
Free-to-air
TV
Terrestr. vs.
Cable
Syndication
Re-licensing
Archive
Exploitation
The sequence of this distribution life cycle differs from one country to another (see Appendix 1, Table
B) and is estimated to ensure a satisfactory return on each window. Films are normally first
distributed in the market that will generate the highest marginal revenue in the shortest period of time.
They will subsequently cascade by order of marginal-revenue contribution to markets that return
successfully lower revenues per unit of time. Film utilisation across the profit windows is becoming
progressively more important as a source of (re)financing increasingly expensive film productions,
which today can hardly be financed from the receipts generated by cinema screening (i.e. “gross box
7
In the pay-TV market, a distinction could be made between the first-window (usually six months), i.e. the first period of premium films
availability on pay-TV, and then the second-window (usually also a six months period). After the second-window, the film becomes
available for free television. Pay-TV operators’ subscribers often consider the second-window as “second quality” and the pay-TV operator
may be forced to reduce it subscription price to differentiate itself accordingly.
8
The chronology of windows for economic exploitation of films in the various Member States of the EU is based on agreements between the
relevant economic actors, supplemented by legislation in Germany, France and Portugal.

The European Audiovisual Industry: an Overview
O. Debande & G. Chetrit – 07/09/01 – Final version
13
office takings”) alone. In addition, the relationship between the various segments still stresses the
importance of the box office success which will (de)increase the attractiveness of films, a film success
along the various profit windows is normally proportional to its performance in terms of admission.
More specifically, windowing strategies must account for many factors, among them:
i. Differences in per-viewer prices earned in different channels of distribution (cinema,
video/DVD, TV);
ii. Potential competition between each window in terms of viewers attraction inducing the
elimination of viewers from an alternative window;
iii. Definition of the appropriate time lag to avoid “cannibalisation” between windows;
iv. Vulnerability of each window to piracy, especially for the video and DVD segment;
v. Decline of viewing interest after the initial release of the film;
vi. Technological development allowing the introduction of new “support” modifying the
chronological sequence and the marginal revenue contribution of each window
Most costs are incurred early in the cycle, when great uncertainty surrounds the revenue that the film
will generate. Some costs remain discretionary when production finishes – such as outlays for
multiple prints of the film and for sales and promotion. The contracts that carry the whole economic
investment along are drawn under great uncertainty. Little is known about the film’s potential appeal
until it is actually shown in cinemas to the paying public.
The above brief description outlines the scope for vertical integration along the value chain (and the
related horizontal integration within each segment). The question of vertical integration is especially
relevant to the distribution and exhibition segments
since the attractiveness of integrating the
production segment is impaired by the creativity risk, i.e. the loss of creative freedom for the
producers: is it more profitable to integrate both activities in one organisation or to have recourse to
one-shot exhibition contracts for individual films between parties who interact repeatedly. The level
of vertical (dis)integration has evolved in a cyclical way over the last decades. Distributors are faced
with strategic issues in terms of promotion and the associated time and geographic span of exhibition.
As explained in section 3 below, the distributor of film (and of other creative goods) is faced with the
problem of conveying to potential viewers credible information on the type and character of the film
and the quality level they may expect of it. Promotion strategies are the channel to convey this type of
information by advertising in other media channels (TV, newspaper… with national or regional
coverage). Promotion needs to take into consideration the competition with the release of other films
and the geographical density of exhibitors.
The representation of the film industry value chain also encapsulates the revenue returns that flow
back to the different segments. The precise rewards obtained by each participant in the value chain are
affected by the profit windows for film rights (based on the principle of the gradual absorption of the
exclusivity yields through degressive pricing for the end-consumer) and by the distribution of the
ownership on the film rights. Long-term performance/revenue imbalances at the level of the
individual categories of participants within the value chain (such as exist for European independent
film producers) can prove to be the essential factor causing individual or branch-specific value chains
to fail to. The analysis of the production financing model is done in section 5.1 below.
Broadcasting industry
The broadcasting industry involves a wide variety of activities, which are vertically and horizontally
inter-related. Figure 2 represents the value chain for the broadcasting industry. The first segment
concerning the development and production of contents is similar to the film industry. The production
of programmes requires several inputs, such as creative skilled labour, financial resources, the
availability of studio (technical production facilities) and financial resources. A distinction has to be
made between the production of two different kinds of programme: flow and stock programmes.
9
For instance, the introduction of home video led to the profit window of TV financed by advertising being pushed down to a lower spot
because the home video profit window yields more revenues. The introduction of DVDs is expected again to modify the balance between
each window.
10
In incentive terms, the cost of pre-contract negotiation and post-contract haggling and monitoring in arm-length relationship is replaced by
problems of incentive structures and governance within the integrated firm.

The European Audiovisual Industry: an Overview
O. Debande & G. Chetrit – 07/09/01 – Final version
14
Figure 2: Value chain for the broadcasting industry
Source: Adapted from Zerdick and al. (2000)
“Flow programmes” - corresponding to light and music entertainment, sports, news/information, talk-
shows - are produced for immediate consumption and are programmed on a recurrent basis over
relatively long periods of time. The sunk cost of such productions is relatively low given the
economies of scale which can be achieved, but the variable cost of buying broadcasting rights could be
high. The production cost of broadcasting “flow programmes” is also affected by the evolution of
broadcast acquisition rights. For instance, the recent speculative evolution of sports rights
demonstrates the burden it could represent on the full operating costs of a broadcaster. In addition,
this type of programme generates immediate revenues for the broadcaster but cannot generally be re-
broadcast (i.e. they are produced for a single transmission) and are not part of the library of
programmes of the broadcaster, i.e. rarely generating any additional revenues coming from the sale of
the rights to a third party
.
The “stock programmes” – corresponding to TV fiction, documentaries/magazine, animation series –
requires higher up-front investment and the production process, especially for TV fiction and
animation series, is close to the one observed for a film even if the budgetary cost will be lower. The
rights over these productions are included in the library of the broadcaster and constitute an asset
which could be exploited on a long-term basis, allowing for multiple release windows. But with the
exception of animation series, the exploitation of the library of TV fictions is inhibited by the domestic
or local character of the “content”.
A final issue to consider is that the production could be done in-house or contracted-out. Most “flow
programmes” are realized in-house, while “stock programmes” can be out-sourced and co-produced
with other broadcasters of the same cultural or linguistic area. Creative talent is also a crucial asset in
both types of programme: in the former case, they can be the object of the programme (e.g., in sports
or shows) or in the latter case, can be hired and controlled (screenwriters and actors). The programme
production is characterized by the scarcity of creative talent which could lead to the emergence of
quasi rents, paid as contractual compensations or transmission rights
. As discussed above for “flow
programmes”, this component of the cost is influenced by the intensity of competition and by the
potential revenues from a successful programme.
The next steps in the value chain of the broadcasting industry, i.e. programme acquisition and
packaging, can be done in strict coordination with producers or through the market. The programming
cost covers both the cost of internal production and the purchase of transmission rights. Marketing
research is required to evaluate the potential audience of a programme. The “public good”
characteristic of programming, i.e. important fixed costs associated with the production with
negligible marginal cost of adding additional viewers, creates incentives to deliver the same
11
However, a copyright could be attached to the “concept” of entertainment programme and this right sold to another broadcaster.
12
As stressed by Motta and Polo (1997), the quasi rent of creative talents has a direct consequence on the programming cost, by linking
programme prices and size of audience.
Production
Post-
production
Programming
Packaging
Transmission
and delivery
Sales
Content creation
Producer
Producer
Producer
Broadcasters
Broadcasters
•Formulating idea
•Acquiring rights
•Preparing the
outline
•Seeking financing
•Seeking creative
talents
•Preparing budget
•Preparing
production schedule
•Finalising
production budget
•Establishing
locations
•Booking
facilities and
stages
•Scriptwriting
•Direction
•Production
•Filming
•Controlling
•Acquisition
of programme
•Selection of the
type of programme
•Marketing research
•Technological
choice for signal
transmission
•Decoding
technologies
•Network
ownership
•TV screening
•Video-on-
demand
•Interactive services
etc.
Telecom
operators
Broadcasters
Telecom operators
•Selection of
channels
•Bundling

The European Audiovisual Industry: an Overview
O. Debande & G. Chetrit – 07/09/01 – Final version
15
programme schedule to more viewers and affects the market structure. The emergence of networks
that centralize the packaging activities and then supply local transmitters is observed. The strategy of
programming depends on the type of channels. Multi-channel operators offering bundles of channel
for subscription have to take into account the influence on the rival’s programming decision but also
the risk of cannibalisation among their own programmes broadcast at the same time. In the case of
cable market operators, they tend to supply general-theme programmes, assembling various single-
theme channels in a package offered for subscription, providing viewers with a high number of
potential combinations.
Transmission of the programmes scheduled is essentially done by telecommunication operators.
While until the 1970s the signals were broadcast only over-the-air by terrestrial transmitters for
reception by individual homes, creating important barriers to entry due to the size of the initial
investment and the scarcity of available frequencies, there is now a set of alternative transmission
technologies, e.g. satellite transmission of radio signal or cable as an alternative to radio spectrum
technologies. The digital signal, allowing the compression of information and the merger of sound,
image and text, is affecting the transmission segment. Whereas cable TV networks are able to deliver
around 30 to 40 channels using analogue transmission technology, digital cable networks will allow to
transmit hundreds of TV channels but also new interactive services (video on demand…). Satellite
transmission technology will offer the same capacities, requiring on the definition of an appropriate
standard for set-top box decoder. Specific regulatory measures can be required to avoid “market
foreclosure” strategy by broadcaster having property rights over a decoding technology, i.e. the use of
monopoly power in one segment of the industry in order to distort competition in a downstream
segment. Cable operators, acting at a local level, are in addition to the ability of delivering a package
of TV channels able to control the access to customers, making them attractive for the expansion of
pay-TV services.
To conclude this section describing the audiovisual industry, Table 1 describes the different
audiovisual products and classifies them in terms of distribution support and according to their ability
of entering into the library of a production company (i.e. distinction between stock and flow
programmes).
Table 1: The Audiovisual products
Cinema Video/DVD
Pay-TV
Free TV
Others
Library
(Stock)
One shot
(Flow)
Feature films
X X X X
X
Yes -
Short films
(X) (X) X X X Yes -
TV fiction
(X) X X
X
Yes -
TV series
(X) X X
X
Yes -
Mini series, soap
operas,…
X
X
X
Yes
-
Animation
X X X X
X
Yes -
Documentary
(X) X X
X
Yes -
Sport events
(X) X X
X - Yes
Shows
(X) X X
X - Yes
News
X
X
X
-
Yes
Source: Arendt and Steil (2001), (): can be distributed on this support.
As described in Figure 1 in the segment on rights library/assets management, a key asset for the
producer is the ownership on the rights of a film/programmes library. The ownership of x% of the
rights provides the producers a x% of the revenues generated by the diffusion of the films or TV
programmes. As a consequence, the producer has an incentive to retain rights on its products as much
as possible.
2.2. The
audiovisual
market
The AV sector is dynamic, dominated by American companies. In 1999, the size of the world AV
market (covering EU, US and Japan) was estimated at around EUR 190 billion, as shown in Table 2.

The European Audiovisual Industry: an Overview
O. Debande & G. Chetrit – 07/09/01 – Final version
16
Between 1995 and 1999, this sector recorded a growth rate of 10% (p.a.), especially due to the strong
expansion of Pay-TV (16.8%), cinema (10.2%) and TV advertising (9.1%). The growth of the Pay-
TV sector mainly came from the expansion of digital TV via satellite and of cable TV. The
contribution of the TV sector (i.e. free TV financed by consumers through TV advertising and
taxpayers through licence fees and pay-TV financed by viewers through the subscription to a single or
a bouquet of channels and pay-par-view) to the AV market reached 78% in 1999, licence fees only
amounting for 9% (i.e., reflecting the increased discrepancy between the Pay-TV and licence fees
shares) reflecting the tight budget constraints faced by most countries especially within the EU. The
market forecasts for 2000 were relatively optimistic, with a growth of 20% of the AV world market,
sustained by the growth of the TV
and video/DVD market.
Table 2: Estimated size of the audiovisual market, 1995 – 2000 (Eur, Million)
European Union
US
World
1
1995
1999
2000*
1995
1999
2000*
1995
1999
2000*
TV advertising
15,945 23,160
23,385
28,920
47,317 59,794 59,134
83,658
101,679
Licence fees
10,820 13,250
13,503 236 396
470 15,561
19,053
20,729
Pay-TV
6,207 12,474
13,811
17,643
30,083 36,684 24,931
46,328
55,895
Video
(sales and rentals)
5,049 6,132
6,336
12,006
18,537
23,096
22,088
28,479
34,969
Cinema
(Box-office receipts)
3,003 4,257
4,434
4,200
6,873 8,326 8,487
12,533
14,630
Total
41,024 59,274
61,469
63,005
103,206
128,370
130,200
190,051
227,902
*: Estimated values. 1. World : European Union + US +Japan.
Source: IDATE (2001)
The European AV market accounted for 31% of the world AV market in 1999, as in 1995. Compared
to the other geographical region, the European market is characterized by the high share of licence
fees, still accounting for a share equivalent to pay-TV, reflecting the importance of public TV-
channels. This estimation of European AV market share is corroborated by data on media companies.
Based on the turnover of the top 100 worldwide companies
, the market share of American companies
is estimated at 45%, while European companies and for Japanese ones accounted for respectively 32%
and 15% of the market.
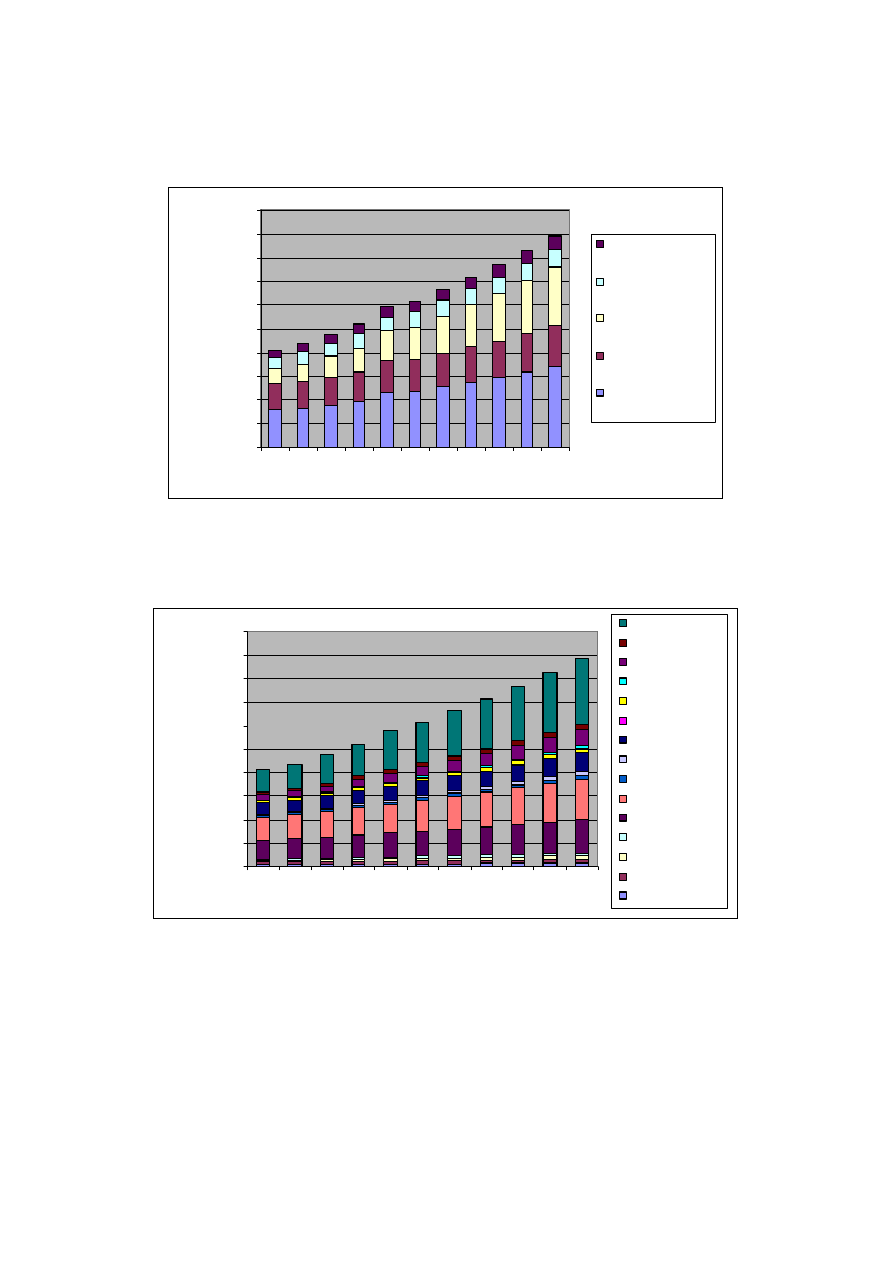
The size and evolution of the European AV market
between 1995 and 2005 is described in Figure 3.
The European AV industry was dominated by the television share, accounting for around 82% of the
industry’s revenue in 1999, this share being stable since 1995. Advertising expenditure continued to
grow at a relatively rapid pace. Licence fees still contributed largely to the financing of the sector,
even if the constraints faced by public authorities have limited it growth rate (lower than the evolution
of the total turnover of the AV sector between 1995 and 1999). Free television still accounted for
slightly less than three-quarter of the total contribution of TV. However, the pay-TV sector has
significantly increased its share, from 15% to 24% of the total revenue between 1995 and 1999.
Revenue from cinemas and the video market is quite small in comparison, accounting for around 18%
and income from video sales exceeded box-office revenues (accounting for respectively 11% and 7%
in 1999). The share of cinema revenues is stabilised around 7% since 1995, even if cinema admission
has shown strong sign of recovery. The video market has experienced a slow growth since 1995, even
facing a downward turn in 1999 due to the lack of attractive titles either for sale or rental. The market
is expected to recover during the next years once DVD drives will become more widely introduced in
13
Since part of the growth is expected from TV advertising, the observed growth could be lower.
14
European Audiovisual Observatory (2000). Based on the top-50, IDATE (2001) evaluates the share of the US companies to 52% in 1999,
the European and Japanese ones accounting for respectively 25.6% and 11.4%.
15
The estimation of the precise size of the European AV market suffers from the lack of adequate statistics. The data used in Figure 3 came
from IDATE (2001). Considering the estimated value of the European AV market on the basis of data from the European Audiovisual
Observatory, a different picture is obtained in 1998, the AV market was estimated at EUR 59,21 billion in 1998 (64,61 including
entertainment software) compared to EUR 52, 06 billion for IDATE estimation.
In the US, a proper methodology has been implemented to assess the contribution of the copyright-based industries (Siwek (2000)). These
industries include all types of computer software (including business and entertainment software); motion picture, television programmes and
video cassettes, video CDs and DVDs; music; records, CDs and audiocassettes; and textbook, trade books, reference and professional
publications and journals. Contribution of the US copyright industries to the US economy was around USD 457.2 billion, with a growth rate
twice the growth rate of the remainder of the US economy. Employment is around 4.3 millions workers. Finally, foreign sales and exports
are around USD 80 billion.
The European Audiovisual Industry: an Overview
O. Debande & G. Chetrit – 07/09/01 – Final version
17
the EU, knowing in addition that DVD households spend more on video products than VHS
households (see section 4.1.4.1.).
Figure 3: Estimated size of the EU AV markets, 1995-2005
0
10,000
20,000
30,000
40,000
50,000
60,000
70,000
80,000
90,000
100,000
199
5
199
6
199
7
199
8
199
9
200
0
200
1
200
2
200
3
200
4
200
5
E
U
R
, m
illio
n
Cinema (Box-office
receipt s)
Video (sales and
rentals)
Pay-T V
Licence fees
T V advertising
Source: IDATE (2001)
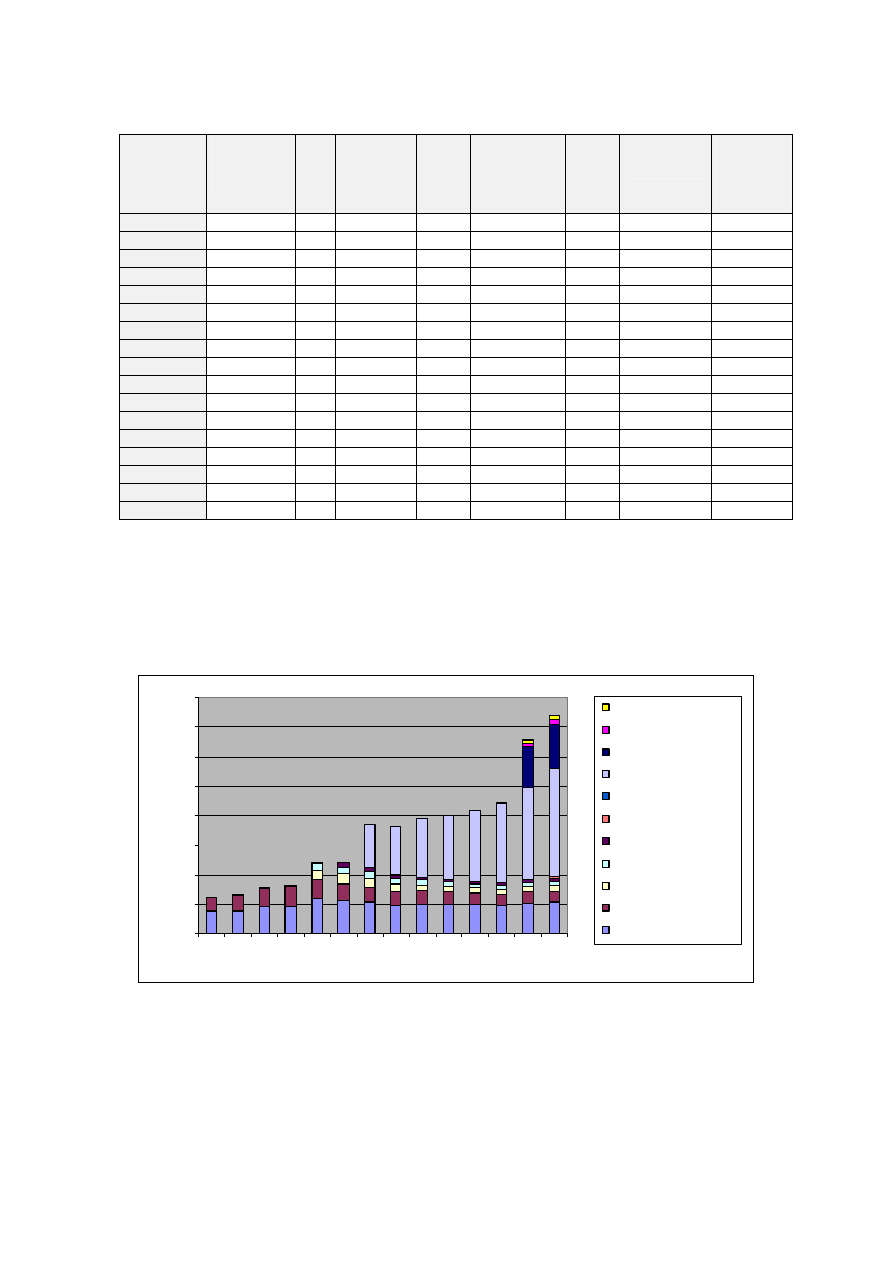
In 1999, the five major AV European markets were: the UK (30% of the AV European market),
Germany (20%), France (18%), Italy (10%) and Spain (6%) as described in Figure 4.
Figure 4: breakdown of the EU AV market by country, 1995-2005
0
10,000
20,000
30,000
40,000
50,000
60,000
70,000
80,000
90,000
100,000
1995
1996
1997
1998
1999
2000
2001
2002
2003
2004
2005
E
U
R
, m
ill
io
n
United Kingdom
Sweden
Spain
Portugal
T he Netherlands
Luxembourg
Italy
Ireland
Greece
Germany
France
Finland
Denmark
Belgium
Austria
Source: Author’s calculation based on IDATE (2001)
Considering the situation in the UK, France and Germany, TV advertising is the major component of
audiovisual revenues in each country, but pay-TV in France and licence fees in Germany are the next
biggest source of financing. In the UK, the contribution of pay-TV and licence fees is the same. The
video sector’s contribution is twice the cinema’s one in the UK, while in Germany, the relative share
of both sectors is relatively similar. In Spain and Italy, the advertising revenues accounted for more
than 50% of total income.
The emergence of new TV channels has been an important outlet for content programmes, while the
development of new diffusion mechanism like Internet, new support like DVD and new services like
pay-per-view and video-on-demand is expected to generate additional demand. In 2005, the European
AV market will double its size compared to 1995, i.e. around EUR 88,8 billion compared to EUR 41,0

The European Audiovisual Industry: an Overview
O. Debande & G. Chetrit – 07/09/01 – Final version
18
Figure 5: Average film distribution of total film
revenues
Other
5%
Pay-Tv
10%
Free-TV
12%
Inter. home
video
14%
Dom. home
video
23%
Inter.
rentals
18%
Dom.
rentals
18%
Source: Film Studio Data in Moodys (2000)
billion in 1995. Free television will continue to dominate for the foreseeable future, with around 58%
of the market in 2005 (compared to 65% in 1995), and will maintain its prime position as a cultural
medium. The relative share of video and cinema revenues remains stable in 2005, reaching
respectively 8% and 6% of the total revenues. The analysis of the various AV European markets show
that the ranking between countries remains the same, with the UK increasing its leadership on the
European market (32% of total revenue)
Important internal modification in the various
sectors of the AV industry as well as greater
inter-connection between the different markets
have been observed. The cinema industry has
been confronted by major changes in its sources
of revenues. Figure 5 summarises the average
breakdown of total film revenues on a worldwide
basis. As an illustration, the domestic box-office
derived from exhibitions in cinema occupies a
steadily diminishing place in the business cycle
and a smaller share of the revenue structure of
the film industry., i.e. only around 15-20% of the
film’s lifetime revenues. Though exploitation in
the cinema (the so-called “show-case”) provides
the criteria for setting the price at which the film
will put on the other markets (i.e. in the various
profit windows), only a very small proportion of
the revenue for a film comes from box-office
takings. The lion’s share of the revenue comes from the sale of broadcasting rights to television
channels (free and pay-TV) and videos, accounting for around 60%. A number of companies generate
extra income through side-lines such as video games and accessories relating to the film
The television sector has been expanding over the last years and increasingly contributing to the
financing of the film industry. Indeed, at the beginning of 2000, over 531 channels with potential
national coverage were broadcast in the EU via terrestrial, satellite or cable means, representing an
increase of around 21% p.a. since 1995. The expansion of the TV sector has been characterized by the
emergence of thematic channels and digital platform. As a result of the increase in television-viewing
and the rapid growth in the number of TV channels (especially thematic ones) requiring films to attract
and keep their audiences, the importance of the feature film for the AV industry will continue to grow.
In parallel, the volume of investment, particularly by television channels, is rising.
Recent developments in digital technology affect the AV industry, namely requiring that a higher
proportion as well as an absolutely greater amount of resources are allocated towards “content”, i.e.
the production and distribution of films, television programmes and multimedia products. The focus is
shifting away from the expansion of communications infrastructure to content.
The media sector has been characterized by a move to more industrial concentration through
horizontal and vertical alliances, mergers and takeovers: the takeover of CBS by Viacom in 1999, the
merger of Time Warner media group and AOL in January 2000 (combined with the merger of Warner
Music Group and EMI Group), the merger of CLT-UFA and Pearson in 2000, the merger of Vivendi-
Canal + and Universal in 2000. Based on IDATE (2001) data, the top five companies accounted in
1999 for 35.5% of total revenues, the top 20 for 72%. As a complementary estimation of market
concentration, the estimated C
4
in the audiovisual market, broken down for the European, US and
Japan market, is equal respectively to: 0.50 in the US, 0.29 in the EU and 0.57 in the Japan. This trend
to a globalised oligopoly structure is accompanied by new alliances within national markets. It
reflects the convergence between the media, telecommunication and information technology sectors.
Indeed, the transmission of media content is no longer the exclusive domain of the conventional
16
This concentration ratio is based on IDATE (2001) data. This measure of market concentration gives a rough estimation and is subject to
two main criticisms: the measure does not take into account directly the number of firms in the industry and is based on one point on the
concentration curves (Hay and Morris (1991)).

The European Audiovisual Industry: an Overview
O. Debande & G. Chetrit – 07/09/01 – Final version
19
broadcasting networks, but classical telecommunications networks too are increasingly important in
the dissemination of content. The reverse applies for the delivery of communication services through
broadcasting networks.
Around the concentration/integration process, the media sector is also characterized by the existence
of small independent producers and distributors. In the music industry, independents account for
around 25% of the production and distribution market in the UK and between 5 and 10% in the other
European countries. For the film industry,
Finally, a striking feature of the AV industry is the important EU-US trade deficit for audiovisual
programme estimated around EUR 5.9 billion in 1998, an increase of 56% in money terms, between
1993 and 1998. The main reasons are: (i) the economic characteristics of AV products (non-rivalry
attributes of public goods on the consumption side and high fixed costs and low marginal cost on the
production side) implies that the viewing by one consumer does not preclude the enjoyment by other
viewers; (ii) the size of the US market (in terms of cinema, TV and video penetration rate as well
income per capita) provides opportunity for cost amortisation in the domestic market; (iii) the
industrial organisation based on the central role of the American studios having established barriers to
entry, especially in the distribution segment and (iv) the wide-spread use of English limits the “cultural
discount” effect
related to the discounted value of an imported AV products due to differences of
styles, cultural references and preferences,…
In terms of employment, the cinema and television sectors are generating around 1 million in Europe,
while in the music industry employment is estimated around 600,000 people. In a more recent study
employment in recreational, cultural and sporting activities (i.e., a broader definition than AV
industries) was estimated at 2.8 million of people, the rate of growth employment being around 3.8%
p.a. between 1995 and 1999. Including the second cultural sector – publishing, printing and
reproduction of recorded media, the level of employment in this sector reached 4,8 million, 3.1% of
EU employment. The introduction of digital technology in the sector is expected, especially in the
multimedia and software industries, to generate approximately 9.6 million new jobs in the next
decade.
2.3.
Consumption of audiovisual products
The market for AV products has been expanding thanks to the increased level of equipment of
households. Although the level of TV household equipment has been high for many years, the
development of the market has been sustained by the emergence of new support like DVD, and
delivery systems like PC or mobile phone. As described in Table 3, there are still disparities across
the EU, especially for the introduction of new supports
: Nordic countries have a high level of
penetration of computer and mobile phone equipment while most of the Southern countries are
lagging.
The emergence of new supports will sustain the demand for AV products, and hence the need for the
production of content. The growth in demand is also affected by other factors (see section 3.2) as the
increased leisure time subject to income constraints, fashion effects…
European households have spent
around EUR 74 billion in AV equipment in 1999 including
videogame cartridge, entertainment software, PCs and PC peripheral, an increase of 13% compared to
1998. The growth in the AV equipment has been supplied by the purchase of PC equipment by
households.
17
Vogel (2001)
18
MKW GmbH (2001)
19
The growth of these new supports has accelerated during 2000.
20
The figure only provides a rough estimation of the household expenditure given the lack of accurate data, consistent across the years, and
the emergence of new supports introducing some breaking in the series.
The European Audiovisual Industry: an Overview
O. Debande & G. Chetrit – 07/09/01 – Final version
20
Table 3: Household equipment in a nutshell
1999
TV
households
(1,000)
%
VCR
households
(1,000)
%
DVD
households
(1,000)
%
PCs per 100
inhabitants
Mobile
phones per
100
inhabitants
Austria
3,212 99 2,574 79
17.3 0.5
26
52
Belgium
4,092 96 3,004 71
54.6 1.3
31
31
Denmark
2,401 99 2,045 84
28.1 1.2
41
50
Finland
2,214 94 1,723 73
13.1 0.6
36
67
France
22,627 95
18,903 80
260.0 1.1
22
36
Germany
37,802 95
31,495 79
239.5 0.6
30
29
Greece
3,663 93
1
2,142 53
15.4 0.4
6
31
Ireland
1,154 93 876 70
7.7 0.6
32
37
Italy
19,319 95
12,706 63
76.5 0.4
19
53
Luxembourg
162 99
1
109 65
1.5 0.9
40
49
Netherlands
6,787 100 4,847 72
68.9 1.0
36
44
Portugal
3,017 91 1,724 52
12.5 0.4
9
47
Spain
12,308 99 8,821 71
125.0 1.0
12
31
Sweden
3,936 93 3,290 78
30.9 0.7
45
58
UK
23,961 97
21,306 86
277.4 1.1
30
40
EU
146,655 96
115,565 76 1,228.4 0.8
25
39
US
100,800 97
85,800 85
n.a. n.a.
52
32
Source: Screen Digest/IVF (2000), MPAA (2001) for the US
1. Data for 1998
Considering a more restricted notion of AV equipment, i.e. excluding PCs (and related equipment)
expenditure, the market grew at the end of the nineties after a period of stagnation, as described in
Figure 6.
Figure 6: Estimated household expenditure in audiovisual equipment in the EU
between 1986-1999 (EUR million)
0
10,000
20,000
30,000
40,000
50,000
60,000
70,000
80,000
19
86
19
87
19
88
19
89
19
90
19
91
19
92
19
93
19
94
19
95
19
96
19
97
19
98
19
99
Videogame cartridge
Entertainment software
PC peripheral
PCs
LaserDisc players
DVD drives
Videogames players
Video blank tapes
Camcorders
VCR
T V Set
Source: Author calculation based on European Audiovisual data
This increase resulted from:
•
the development of the market for television sets. Although the level of equipment is close
to saturation (net of the natural renewal of obsolete equipment), the resurgence of the market
was related to the success of the 16/9 sets. The number of households with 16/9 TV sets in
1999 in the EU was estimated around 5.7 million, representing about 4% of TV households,
the UK and the Nordic markets being the most active.
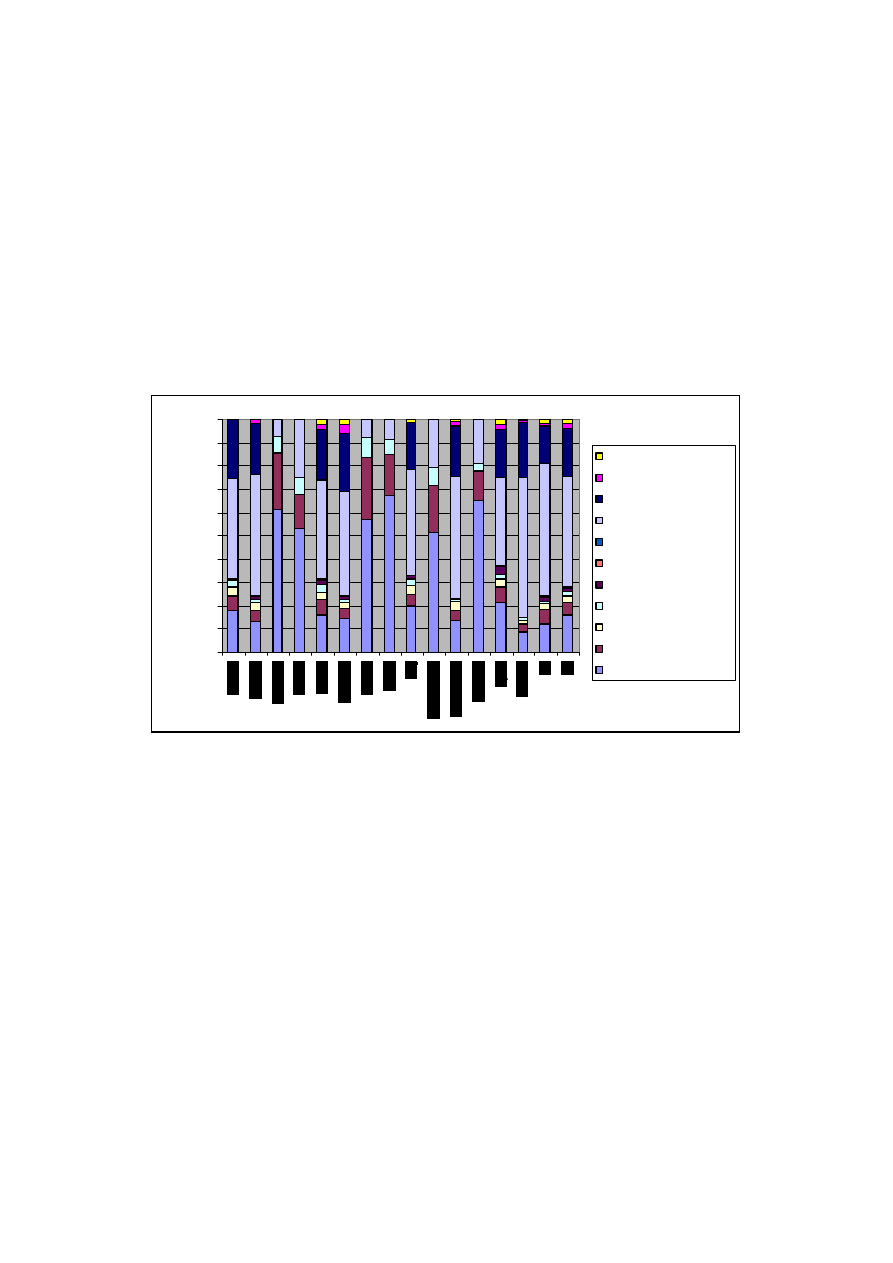
The European Audiovisual Industry: an Overview
O. Debande & G. Chetrit – 07/09/01 – Final version
21
•
the launch of the DVD, negatively affecting the market for laserdisc players, for VCRs and
blank cassettes. Some uncertainty about the standard format as well as the price for DVDs
with the recording feature have constrained the current expansion of this new support but
since 1998 the DVD market was booming in EU (see section 4.1.4.1.).
As described in Figure 6, PCs and multimedia equipments are increasing their share in the total
expenditure of households, in parallel with the development of Internet and the new software targeting
the specific sub-group of the population, like children.
Although Figure 7 gives an incomplete view of household expenditure on the various AV equipments
(given the lack of data), the analysis of the five major markets in the EU, i.e. France, Germany, Italy,
Spain and the UK confirms the importance of (related-)computers expenditure in the household
budget.
Figure 7: Estimated breakdown of household expenditure for audiovisual equipment in the EU,
1998
0%
10%
20%
30%
40%
50%
60%
70%
80%
90%
100%
Videogame cartridge
Entertainment software
PC peripheral
PCs
LaserDisc players
DVD drives
Videogames players
Video blank tapes
Camcorders
VCR
T V Set
Source: Author calculation based on European Audiovisual data
The high level of equipment of European households and the associated amount disbursed to buy such
products could potentially reflect the emergence of a “culture d’appartement”. However, as described
later on, since mid of the nineties, admission to cinema significantly increased in the EU, indicating
the potential complementarity between the expansion of in-house consumption and the renewal of
cinema theatres. The development of new support has not crowded-out the traditional consumption of
content, but on the contrary has generated a new demand for content production.

The European Audiovisual Industry: an Overview
O. Debande & G. Chetrit – 07/09/01 – Final version
22
3.
ECONOMIC CHARACTERISTICS OF AUDIOVISUAL PRODUCTS
The AV industry has various economic features on the supply and demand sides:
•
Demand-side: Since the AV product is an experience good, consumers face an informational
problem when having to decide on their level of consumption leading to:
§ Demand uncertainty about the willingness of consumers to spend on new AV products.
This gives rise to mitigating strategies developed by suppliers in order to increase access
to information (like the use of superstars, prize and awards, advertising and promotional
campaign, certification mechanism);
§ Consumption pattern dependent on tastes and income constraints and affected by social
behaviours and interactions.
•
Supply-side:
§ Production costs function exhibiting high fixed and/or sunk costs and low marginal costs
giving an advantage to a large domestic market able to benefit from economies of scale;
§ Creative skills are a crucial input showing the importance of an effective management of
the production process requiring the recourse to experienced managerial team;
§ Prevalence of market failures (spillovers, cultural externalities) and protection of
intellectual property rights, justifying some form of public regulations either of the
market structure or of the conduct of the different players;
§ Importance of digital technological developments for various segments of the industry
and stages of the product life cycle, associated with a convergence of services, delivery
technologies and end-use equipment concerned with telecommunications, audiovisual
and information technology.
Although these economic characteristics are prevailing in the European and American markets, the
American AV industry appears to be more competitive, especially in its ability to export content
production. In addition to the adverse effect of the fragmentation of the European AV market on the
competitiveness of European AV products, this American dominance rests on the size of the domestic
market and their market organisation, i.e. the so-called studio system. Indeed, the major American
studios have focused their activities on films’ distribution, relying on an efficient worldwide network
and dominant brands (MGM, 20
th
Century Fox, Walt Disney), which also act as powerful barriers to
entry, and sub-contracted part of the production activities to independent producers. The pivotal role
of the studios implies that the production of a film is considered as a purely commercial project,
integrating the distribution strategy right from the conception and development stage of the film. This
evolution of the American market has led to a specialisation in action-oriented films including
sensation and special effects, since these films are well-suited for a mass-market distribution, typified
by the size and uniformity of the domestic market leading to a distinct supply-side advantage. In
addition, these American studios manage the rights of the most important and profitable film library,
which strengthen their market power.
AV goods are considered as experience goods – goods whose characteristics are perceived by the
consumers only after purchase - with a subjective reaction of the buyer. For this type of good, the
main issue is information, i.e. how consumers will learn about the quality and what are the incentives
for firms to provide adequate information to consumers. The interaction of this feature with other
economic characteristics of the AV sector has a direct consequence on the organisation of the AV
sector, both on the supply- and demand-side. On the supply side, the organisation of the production of
AV goods is affected by the existence of sunk costs, the importance of quality, the impact of
technological development, the existence of market failures. On the demand side, consumers in
making a decision about their level of consumption of AV goods are faced with uncertainty about the
quality of the goods, the constraints in terms of leisure time and disposable income available. These
issues are reviewed in the following sections.

The European Audiovisual Industry: an Overview
O. Debande & G. Chetrit – 07/09/01 – Final version
23
3.1. Supply-side
factors
3.1.1. Cost structure, quality and market structure
3.1.1.1. The prevalence of fixed and sunk costs
The cost structure of the AV sector exhibits specific features: the importance of fixed and sunk costs.
A fixed production cost of a good or service is one that must be incurred no matter how many units of
outputs are produced. When output expands, the fixed costs are spread over more units, and as a
consequence, the average cost of production declines. In the case of a sunk cost, an additional feature
is observed, i.e. those costs cannot be recovered if production ceases. Fixed costs are frequently sunk
and vice-versa – but they may diverge. Applied to the AV sector: when content is produced,
something unique is created resulting from the one-off combination of human or artistic and material
resources involved. As this one-off production process is independent of the number of copies sold, it
gives rise to fixed costs or “first-copy costs”. Since production costs correspond essentially to wages
paid to actors and other creative staffs or to the creation of specific sets which could not be recovered
after production and since the content produced can rarely be reused in a different form if it does not
attract the “interest” of the customers, these costs are sunk.
This cost structure
is prevalent in every AV sub-sector (through it may differ in importance
depending on the sector). For instance, any author who spends a year sitting at a desk producing a
literary work entails sunk costs for the customer, irrespective of whether he produces a book or a
screenplay. Equally, the cost of producing a film negative is independent of the number of people
who will ultimately view it; and the same relationship applies to the cost of recording a music album.
Important additional fixed costs are incurred to ensure the marketing and the promotion of the product
to attract the attention of the desired target group, since those costs are also independent of the
quantity finally sold (with a qualification for the difference between the US and European markets,
where for the latter, the marketing and promotion costs will be more dependent on the geographical
coverage, and hence on the quantity distributed, since the marketing campaign has to be adapted to the
national cultural and linguistic specificities). Given the increased supply of products and the diversity
of potential leisure activities, the share of costs related to marketing and promotion has increased in
parallel with the escalating information-overload faced by consumers. Depending on the support used,
the marginal costs will be low. The AV good becomes a mass product after its production when it is
reproduced and distributed. As a consequence, production is characterized by important fixed (sunk)
costs and low (or near zero) marginal cost.
The cost structure, especially in the film industry, is also characterized by the existence of economics
of agglomeration. This feature is particularly striking in the case of the US (and might also explained
one cost advantage of the US) where the entertainment industry service firms are concentrated in
California, even if film-making might increasingly take place in other locations. There is a
geographical clustering of specialised labour force.
3.1.1.2. Creative skills
The production function of AV products or services rests on the specific input of creative skills.
Creative workers have some particular features. First, due to their preferences or inclination, creative
workers tend to produce more creative product or content than if they valued only the financial
revenues they receive, and on average
earn less than their general ability, skill, education,… would
normally command or warrant. This is because they tend to have a specific concern or passion for the
quality of the products, without any direct relationship with the final consumers’ preference for the
goods, given rise to the notion of “art for art’s sake”
. This characteristic implies that the creative
worker wants to preserve sufficient independence and control over his works, making it more difficult
to frame them into a standard production organisation. As a consequence, the terms of employment of
21
Fixed costs have important consequences for economic organisation. Indeed, firms have difficulties to define a ticket price that could be
charged covering its average unit cost (fixed plus variable). Price discrimination has been developed in order to extract a greater part of the
consumer’s surplus: higher admission charges for events on weekends than weekdays, lower charges per admission for season tickets than
for singles.
22
There is also a “ winner takes all” aspect where the best talent earns very large returns by extracting rent.
23
See Caves (2000).

The European Audiovisual Industry: an Overview
O. Debande & G. Chetrit – 07/09/01 – Final version
24
the creative inputs must be negotiated at the same time, and with a people unwilling and perhaps
unable to pre-commit their creative choices. Second, creative products need different, frequently
complementary skill sets. This sort of multiplicative production function requires a tight control on
the chain of production to ensure a smooth transition between each stage and the respect of the pre-
agreed steps of production. Third, creative inputs are vertically differentiated, i.e. there is a ranking of
the different talents (actors…).
This specific labour market has various consequences:
•
Shortage of skilled workers;
•
High dispersion of wages across creative workers;
•
Potential rent-extraction behaviours.
3.1.1.3. Quality and variety
Since AV goods are “experience goods”, the content producers have an interest to invest in advertising
in order to ensure an adequate dissemination of information about the characteristics of the good
Recourse to advertising and promotion campaigns is one mechanism to address this issue as well as
reputation and certification in the case of repeated purchases of a good or service. These aspects are
further discussed in section 3.2.2.
The cost incurred for the production of an AV good has to take into consideration the “quality”
as
well as the “variety” dimension, the latter reflecting the choice of programme broadcast or the type of
films produced (science-fiction, thriller…). Hence, producers have to make a decision on both
dimensions
, assuming that the distribution of tastes is concentrated on certain programmes (even if
the real distribution is unknown). The quality of the programme will directly affect the production
costs and the revenues. In broadcasting, the willingness to pay of advertisers depends on their
perception of the level of audience of the programme
. The relationship between programme quality
and revenues is even more direct in the case of pay-TV, since the demand for subscriptions will be
stimulated by an attractive programme schedule. On the cost side, the attractiveness of the product is
affected by the reputation of the actors/singers, of the director, etc as well as by technical
considerations. As a consequence, the fixed and/or sunk costs are significantly determined by the
quality of the programme. On the other hand, the variable production costs of delivering the content
are low and not directly related to the content of the programme, i.e. the cost of delivering a poor
programme is the same as that of delivering an attractive one. However, the advertising and
promotion costs which could have an element of "variable" or "discretionary" cost, might also be
affected by the “quality” of the production - there will be the tendency to spend more on a “quality”
mega production, even though it may end up a mega flop.
3.1.1.4. Market structure
The importance of content quality in the broadcasting and in the cinema industry points to the concept
of endogenous sunk cost
, which could explain the trends to concentration observed and the
leadership of the US in the cinema. The basic mechanism would be competition among firms
increasing the quality of the goods with a consequent increase of fixed costs, in turn encouraging
market consolidation.
Even in the absence of entry barriers, broadcasting market might thus be characterized by a market
structure where not many TV-operators can co-exist even if demand increases and/or the evolution of
24
See Tirole (1989)
25
Quality is obviously a difficult concept to measure or to define. Economists when talking about quality often make a distinction between
horizontally and vertically differentiated products. Vertically differentiated goods are those for which consumers are unanimous in agreeing
that more of a given objective characteristic provides more utility. This concept can hardly be used to describe audiovisual or cultural works:
a large painting does not contain more quality than a small one. The notion of horizontally differentiated good is more appealing: a film by a
producer X is preferred to a film by producer Y by some consumers, a film by Y is preferred to a film by X for other consumers, even if they
are film of the same genre. Quality is also often seen as related to the cultural content of the product. We use the notion of “quality” in the
commercial sense of the public's willingness to pay, independently of the cultural content.
26
Caves (2000) talks about the “infinite variety” property since creative products can differ from one another in many ways.
27
Advertisers are interested in the absolute level of audience but also by the viewers’ composition. For instance, producers of music will
assign a great value to the viewers of music events.
28
Motta and Polo (1997) and Sutton (1992) for the original use of this notion

The European Audiovisual Industry: an Overview
O. Debande & G. Chetrit – 07/09/01 – Final version
25
technology drastically reduces the operating costs. Such eventualities may lead existing operators to
increase the quality of their packages, instead of favouring the emergence of new operators and a
decrease in concentration. This evolution could be mitigated by:
(i) the development of technologies which would allow the existence of more thematic-channels
increasing the horizontal differentiation, increasing the number of sustainable firms in the
market;
(ii) the notion of endogenous sunk costs applies to a different extent to the various segments of
the broadcasting industry and new technological development might weaken the relevance of the
endogenous sunk cost argument.
As a consequence, the emerging market structure and the level of competition will be affected by the
extent of variety and quality competition. If preferences among consumers are more dispersed across
“varieties”, the degree of concentration will decrease and allow for the entry of new operators acting in
a specific niche. A dual market structure could arise, characterized by the existence of a limited
number of general broadcasting channel which are able to afford huge fixed costs to offer the most
successful programmes, and many other operators obtaining negligible market shares in thematic
channels.
The same argument could be used for the cinema industry: the essential point is that quality, defined in
a commercial sense as the willingness to pay of consumers
. The larger the base home market, the
larger is the investment in the quality (in the sense of large fixed costs incurred in order to attract more
viewers) that is expected to maximize the producer's profits. The quality that is provided to the home
market is by and large a “public good” with regard to exhibition abroad, allowing some cross-
subsidiation across markets. A small home (cultural minority or linguistic) market risks confining a
country's films to a limited, if any share of the international market. Indeed, the cultural specificity of
creative products implies that a typical creative good attracts more demand per capita in its targeted
market than elsewhere, and less audience in markets with little cultural and linguistic affinity. As a
consequence in the case of cinema, the locally produced share of films exhibited in a country increases
with its competitive advantage in the world market, the US having the greatest competitive
advantage
Another important argument is that the Hollywood studios dominate the exhibition of large budgets
films by virtue of their distribution systems. A complete restructuring of the studio’s system has
occurred during the 50s-60s, due to:
•
the Paramount antitrust case
leading to the partial divestiture of the studios exhibition
activities following complaints of independent exhibitors about contracting practices of studio
distributors;
•
the emergence of the television as a major new audiovisual technology generating a re-
organisation of the film production system by transferring the realisation of studio’s lower-
quality films to TV producers.
As a consequence, their major competitive advantage is their activities in films’ distribution, in
addition to the management of the overall value of their film libraries
for which they are selling
ancillary rights to various media. The ownership of their distribution networks, i.e. sales offices in
various US cities able to arrange exhibition contracts with large number of exhibitors, to manage local
sales promotion, and to distribute the physical prints for exhibition, provides efficient barriers to entry
from potential competitors given the large annual fixed cost incurred for operation. With the
29
This notion has to be qualified since resting essentially on a short-run evaluation made by consumers (Ginsburg and Weyers (1999)).
Additional short-term indicators could be added as reviews by professional critics and recognition via awards. A time-trend has also to be
introduced to reduce for instance the impact of marketing campaign on the film’s success. The quality has to be considered as a long-term
process.
30
Some authors like Siroën (2000) have raised the issue of US creative goods being “subsidised” abroad by the large domestic market
allowing to implement price discrimination policy, based on the principle of only charging abroad for the marginal cost of the production.
31
United States vs. Paramount Pictures, 334 US 131 (1948).
32
The estimated film library in 2000 for the Hollywood studios is (Vogel (2001)): Walt Disney 600 titles; Columbia/Tristar (Sony Pictures
Entertainment) 2,400 titles; Metro Goldwyn Mayer 4,400 titles; Paramount Pictures (Viacom) 1,000 titles; 20
th
Century Fox (News Corp.)
2,000 titles; Warner Bros (AOL Time Warner) 4,500 titles; Universal Studios 4,000 titles. The estimated market value of individual titles
within the film library depends largely on their previous box-office success and how long ago it was released.

The European Audiovisual Industry: an Overview
O. Debande & G. Chetrit – 07/09/01 – Final version
26
distribution system in place, a studio can promote and distribute a certain number of films each year at
no additional cost except for the prints and advertising of each individual film. The efficiency of this
scale-related entry barrier, providing a mass-market distribution advantage, is demonstrated by the
high and stable concentration of box-office revenues in films distributed by the major studios. New
competitors do not enter because a newcomer could not expect to earn positive profits from North
American distribution, once its distribution capacity is added to that of existing studios
. In addition,
the major studios have developed European subsidiaries to benefit from the same commercial strength
for the distribution of films. In parallel, the studios have implemented a more flexible organisation,
having recourse more often to independent producers in order to maximise the creative freedom and
trying to ensure a constant flow of major pictures. This continuous volume of films allows them to
diversify risks across many films, so that the rewards from a few highly profitable ones will easily
outweigh the losses from other. Given their advantage in mass-market distribution of films appealing
to young and unsophisticated audience, the studios have been inclined to look for action-oriented films
with special effects. This type of films, setting the notion of blockbusters oriented towards sensations
and special effects, have been associated with high spending in promotion and advertising. This
strategy has been quite successful since the underlying concept of these films is not really constrained
by the language, allowing to develop worldwide marketing campaign. To some extent, they have been
to cross-collateralise risk across territories by having an international structure and across windows by
optimising the rights management of their film library. This advantage has allowed the studios to
support higher P&A costs and hence, strengthening their distribution comparative advantage.
The same reasoning applies for the “promoter” firms found in the record industry, book publishing,
toys and games. Their prices exceed marginal costs of their outputs, and they earn on average more
than enough profit to keep them in the business, even while would-be competitors cannot expect to
find sufficient room to prosper if they enter and mimic the incumbents.
This different market opportunity in the US and in the EU explains the American leadership and
implies that the creation of highly competitive European film companies should require the
development of a pan European-based market at the distribution level. Indeed, enlarging the size of
the market will allow for the entry of more firms and make it possible to spread high fixed-cost across
a larger output. This, however, has to be compared with the potential loss in terms of cultural
diversity which could be mitigated by preserving enough independent national producers.
3.1.2. Market
failures
The rationale for a public support to the AV industry is based on the identification of various market
failures associated to the functioning of this market. The argument may be developed as follows:
•
Preference for diversity and quality of choices: The choice of consumers about whether or not
to consume an AV good is based on their preferences and the availability of information about
the characteristics of the goods (see also sub-section 3.2.2.). Consumers’ utility increases with
diversity
among the AV goods: he is able to select a good which better matches his
preferences. Since films are sold at the same price due to legal obligation, blockbusters films
could crowd-out small independent films addressed to a narrow audience, reducing the
diversity in the supply of films; this situation not only reflecting the consumer's choice, but
also the distributors’ strategy of being interested in high sales/margins and hence being led to
reduce the available diversity (leading to an issue in terms of “forced” limited or reducing
choice for consumers). As a consequence, a sub-optimal level of production and/or
distribution could be observed in the film industry
35
. The same problem could arrive in the
broadcasting industry either due to spectrum capacity (see below “technological bottlenecks”)
or the stronger competitiveness of low quality TV-series. A related issue about consumers’
choice is their ability to acquire knowledge of the AV goods and service available. The level
of education will affect the quality of choice.
33
This situation could explained the choice made by Dreamworks, a new entrant, to arrange for distribution of its films through Universal
rather than to build its own distribution network.
34
Tirole (1989)
35
Siroën (2000)

The European Audiovisual Industry: an Overview
O. Debande & G. Chetrit – 07/09/01 – Final version
27
•
Public goods and positive/negative externalities: Public goods are those that can be enjoyed
by more than one person without reducing the amount available to any other person. In AV,
the cost structure implies that AV products have near public goods characteristics (see below
section 3.1.1.1.). However the applicability of this notion applies to a different extent to each
sub-sector, e.g. when a film is distributed in cinema, the entry price is a mechanism allowing
to exclude some of them. In addition, the content of any films, TV-series,… affects individual
behaviours (creating a special “imaginary world”), requiring also to devise specific schemes
(like ratings system) to limit for instance the consumption (as “merit goods”
) of some
categories of films (violence…).
•
Cultural diversity: This notion extends the concept of market failures and is closely related to
the idea of public services used in broadcasting policy, aiming to ensure the diffusion of
programmes respecting pluralism. Advertised-supported TV has assumed to have a bias
towards programming that is targeted at mass audiences and away from programming targeted
at minority audiences. The same reasoning could apply in the definition of the programming
by type of themes. The argument might also justify to sustain the production of films targeted
to a narrow audience (like experimental work or films for cultural minority). As a
consequence, this sector is confronted with a twofold approach: an industrial and cultural
policy. A clarification of each policy is important and the achievement of each goal requires
the recourse to a specific policy instrument.
•
Technological bottlenecks: The scarcity of available spectrum (limiting the number of
available channels) has been one argument often used to justify a state intervention in the
broadcasting industry. However, technological progress has overcome this limitation and
allowed the proliferation of channels (either pay or free TV) and a better matching with
consumer preferences. The need for intervention has been shifted to other technological
issues like standardisation of the set-top decoding box, standardisation in the use of the digital
support…
It appears that the first two market failures are related to information deficiencies incurred by
consumers when having to make a choice about their level of consumption (see below in the sub-
section about demand side factors).
3.1.3. Technological
evolution
, intellectual property rights and (de)regulation
The evolution of the audiovisual sector is closely related to technological changes
affecting the
production, distribution, and reproduction of audiovisual product. In the film industry, the
technological evolution has essentially affected the production and distribution sides, the exhibition
being only recently affected by new digital technologies. In production, important modifications in
the film-making process have been introduced by special effects since the 1970s, with the help of
advanced computer-aided designs and electronic editing and composition devices. Technological
developments have enabled distributors to launch international marketing campaigns with higher
speed and efficiency. Finally, in the exhibition side, the implementation of digital cinema (or e-
Cinema) is expected to affect significantly the diffusion of film
. This latter evolution reflects the
advance in programme distribution and storage capacities (in parallel with the evolution of TV, home
video… increasing access to film entertainment), enabling end-users to control the time and place of
viewing.
36
A merit good is based on the argument that consumers are not able to make a choice in their best interest and it requires that these choices
are made by public authorities who presumably are expected to have superior knowledge of AV benefits (Musgrave (1959)).
37
The notion of innovation in the AV sector differs from innovation in other industries. First, the nature of innovation in creative activities is
blurred by the fact that any creative product that does not just replicate can be defined as an innovation. The ability to distinguish significant
innovation from everyday creativity varies from one industry to another, in function of the effectiveness of the filter process (i.e. critical
ranking). Second, the perception of innovation is also affected by changes in the taste of individuals, making more difficult to identify the
respective impact of a shift in demand from a technological change.
38
See Farchy (1999).
39
Recently, Red Herring (March 5, 2001), stresses the potential opportunities and challenges of digital cinema: definition of the appropriate
technological standards (mastering, delivery and transport, compression, security/encryption, audio, theatre systems, projection, colour
imagery, electronic packaging), the size of the investment for exhibitors, the diversification of activities within cinema theatres (concerts and
interactive events…). See also Screen Digest (1999a).

The European Audiovisual Industry: an Overview
O. Debande & G. Chetrit – 07/09/01 – Final version
28
As the rate of change in content distribution technology begins to outpace the rate of change in
production technology, filmed-entertainment products and services are becoming more personalised
and adaptable. Digitalisation is also affecting the selection of the appropriate support for film
diffusion. While the cinema has not been confronted with important changes in the medium used (the
four-perforation 35 mm film with 16 frames to the foot is a technological standard that W. Dickson
unveiled in October 1889 remaining a truly global standard since 1895), the use of digital technology
is expected to affect significantly the type of medium used, leading to the disappearance of the
standard 35 mm film support.
The implementation of new technology has strongly reshaped the AV market structure. During the
1960s, the standardisation of TV technology has allowed a broader dissemination of TV among the
population (namely through a cost reduction of the purchase of a TV set) affecting negatively cinema
attendance. At this stage, technological trends are leading to convergence of services, delivery
technologies and end-users’ equipment concerned with the audiovisual, telecommunication and
information technology sectors, i.e. the transmission of content is no longer the exclusive domain of
the broadcasting network (cable, satellite and terrestrial networks) but classical telecommunications
network too are becoming increasingly important in the dissemination of content. It essentially results
from the combination of various factors:
(i) the result of the digitalisation allowing all form of content to be handled over the same
networks in the same manner,
(ii) the reduction in the price of household equipment in parallel with the development of new
encoding/decoding technology allowing for interactive uses, and
(iii) the decrease in the costs of transmission bandwidth and telecommunication access fee (in
part due to the liberalisation of the telecommunication sector).
Recent technological evolutions (digitalisation, Internet) are introducing additional uncertainties about
the future structure of the industry, and require the development of new business models (increasingly
fragmented audience and individualisation of the transactions by quantity and duration leading to a
more usage-related form of revenues).
The enforcement of a strong intellectual property rights system is an essential condition for the
application of AV products in digital environment
. . Copyright goods and services cover a wide
variety of products and services containing protected subject matter such as print products, films,
phonograms, electronic product, CD and DVD/video rental, theatre and concert performance, literature
and music, etc. The set of right-holders concerned comprise authors, performers, phonogram
producers, film producers and broadcasters.. Many creative works protected by copyright need mass
distribution at a cost which is not affordable for the creators; this latter being obliged to sell the rights
to their works to a third party able to market the works in return for payment. These payments called
royalties are computed on the basis of the actual use of the work. Similar to patents in the science,
copyright is the means by which creators obtain a “fair” economic rewards and legal protection of that
asset which is essential to the business for a limited period of time. Copyrights by protecting original
artistic and literary works in various media aim to stimulate creativity and investment. It is also
recognized that copyright protection includes moral rights: the right to claim authorship of a work and
the right to oppose changes to it that could harm the creator’s reputation.
Regulation of copyright is done at the national, European and international level (the Berne
Convention and World Intellectual Property Organisation (WIPO) Copyright Treaties: “WIPO
Copyright Treaty” and “WIPO Performances and Phonograms Treaty”
40
The development of digitalisation to the TV sector as well as the emergence of Internet as a broadcast outlet, and the associated demand
for new services, like pay-per-view and video on demand, are affecting the business of managing broadcast rights, previously structured as a
database managed by territory and window sales. The new way of selling films to the consumer due to the emergence of new diffusion
channel reshaping partially the notion of windows release and the territories requires appropriate management tools. Indeed, pay-per-view
or on-demand films are licensed on a revenue-sharing model, based on a three-way split between content owner, service provider and
platform operator. Platform providers must track the number of showing and control the licensable period while content owners are juggling
an increasing number of windows and formats throughout multiple territories. To control the contractual obligations and the available
programme inventory, broadcasters and right holders have developed new software.
41
The WIPO is an international organisation dedicated to promoting the use and protection of the “human spirit” through the enforcement of
an adequate intellectual property environment. It is one of the 16 specialised agencies of the United Nation system of organisations and

The European Audiovisual Industry: an Overview
O. Debande & G. Chetrit – 07/09/01 – Final version
29
The development of new technologies reinforces the risk of piracy and needs new standards of
protection as illustrated by the dissemination of music on Internet
and the global nature of Internet
require harmonising regulations internationally. The following key conditions need to be achieved:
(i)
new standards of protection to take into account digital downloading and digital copying;
(ii)
liability rules for on-line service providers in relation to copyright infringement; and
(iii) protection against the circumvention of technological copyright protection methods and
rights management.
This last point is related to the development of proper technological measures for tracking music,
which need to be operational with various software and platforms. Although the music industry is at
the forefront of the discussion on copyright, the same discussion applies to all audiovisual sectors.
The EU has adopted recently a new Directive on the “harmonisation of certain aspects of copyright
and related rights in the information society”
, completing the existing legal framework
. The
objective is to harmonize legal protection by adapting copyright and related right to the new digital
environment and to develop adequate system allowing for electronic rights management and
protection.
These evolutions affect the market structure and the scope of regulatory policies. Indeed, as already
mentioned, numerous horizontal (among telecommunications, audiovisual, and Internet firms) and
vertical (between content provider and telecommunications, audiovisual, and Internet firms) mergers
and alliances have been observed over the last years. This trend affects the regulatory approach for the
following reasons
•
Modification in the notion of relevant market due the convergence between the various sectors
as well as the greater connections within each segments of the AV sector;
•
Potential for entry in each segment of the markets: while technological evolutions could
reduce the cost of entry and facilitate the access to distribution channels (with still the
constraint on the broadband for access into the home – the local loop), the extent of vertical
integration as well as the control on the rights associated to content production would affect
the degree of contestability of the market;
•
Vertical mergers, exclusive vertical agreements and abuse of dominant position: vertical
foreclosure due to exclusive arrangement between a content provider and a
broadcaster/distributor could be efficient when the broadcaster/distributor needs to bear sunk
costs from promotion and advertising campaigns. However, vertical foreclosure could act as
anti-competitive measures when the downstream technology exhibits economies of scope and
restricting access to a key input or technology can restrict entry in the range of products
produced with the downstream technology.
As described in the previous sub-sections on market failures, regulation has been a pervasive feature in
the broadcasting and to a lesser extent in the cinema industry. The development of the AV has been
characterized the emergence of different regulatory structures, from regulation of structure to
regulation of conduct, from horizontal versus vertical regulation…
administers 21 international treaties dealing with different aspects of intellectual property protection (see
www.wipo.int
). The Treaties
mentioned have been adopted by the Diplomatic Conference on Certain Copyright and Neighbouring Rights Questions, on 20 December
1996, which was convened under the auspices of the WIPO in Geneva.
42
See the recent statement of a US federal judge establishing that MP3.com has infringed copyrights owned by Universal Music
(6/09/2000).
43
Directive 2001/29/EC of the European Parliament and of the Council of the 22 May 2001 on the harmonisation of certain aspects of
copyright and related rights in the information society, OJ L 167/10, 22.6.2001.
44
Council Directive 92/100/EEC of 19 November 1992 on rental right and lending rights related to copyright in the field of intellectual
property, OJ L 346, 27.11.1992; Council Directive 93/83/EEC of 27 September 1993 on the coordination of certain rules concerning
copyright and rights related to copyright applicable to satellite broadcasting and cable retransmission, OJ L 248, 6.10.1993; Council
Directive 93/98/EEC of 29 October 1993 harmonising the term of protection of copyright and certain related field OJ L 290, 24.11.1993;
Directive 96/9/EC of the European Parliament and the Council of 11 March 1996 on the legal protection of databases, OJ L 77, 27.3.1996.
45
OECD (1999)

The European Audiovisual Industry: an Overview
O. Debande & G. Chetrit – 07/09/01 – Final version
30
3.2. Demand-side
factors
3.2.1. Demand
uncertainty
As stated above, AV goods (or creative goods) are experience goods, i.e. the buyer cannot accurately
assess the qualities of the individual good before committing to consume it. As a consequence, the
AV sector is characterized by great uncertainty about how consumers will value a newly produced
creative product (such as film, sound…). The revenue a new product might generate could far exceed
its cost of production, alternatively, only few consumers might place any positive value on it. Since
production costs are sunk, the risk associated with a creative product is high and the implementation of
risk-sharing arrangement will be important for the organisation of production. In such a situation,
when the product is costly to produce, producers have an incentive to acquire information on whether
the buyers’ valuations will be high or low, before the production costs are borne. However, existing
analysis is not able to identify the main factors or patterns allowing to explain consumers’ behaviours:
a creative product’s success can seldom be explained even ex post by the satisfaction of some pre-
existing need.
This situation is described by the “nobody knows” property
and its application to the cinema
industry: producers and executives know a great deal about what has succeeded commercially in the
past and constantly seek to extrapolate that knowledge to new projects. But their ability to predict at
an early stage the commercial success of a new film is limited. This feature is characteristic of a
“prototype” industry. In addition, there is no direct relationship between the production cost of a
creative product and the price charged to the consumers due to public subsidies or the amortisation
rule on the different profit windows in film (see below) and TV markets. As a consequence, the ticket
price for a film will be very similar for a production cost of EUR 100 million or EUR 10 million, i.e.
the price does not reflect the associated production costs of the film. Similarly, in the music industry,
the price is mostly independent of the artistic production costs.
Various strategies have been tried to mitigate this uncertainty of demand. Since the consumer lacks
information about the quality of the good, the producer will try to signal this by having recourse to
markers. For instance, in the US cinema industry, it has led to a significant increase in the average
cost of production of feature films, the recurrent participation of successful stars, the increase in
special effects’ use and expensive sets.
Indeed, the use of stars has been considered as a potential mechanism to attenuate the demand risk,
given the concentration of consumption on a limited number of products. The superstars’ model
assumes that artists differ in quality in the eyes of fans (supposing that those quality differences could
be quantified) and that lower-quality performers are poor substitutes for stars. Individuals when
deciding to attend AV events incur the price of the ticket plus the time diverted from other leisure
activities: the higher the artist’ quality, the more utility fans get, given their time and money costs.
The superstar has the opportunity, for instance in the case of music, either to price tickets the same as
average artists increasing the attendance of the concert or to charge a much higher price and still
attract as large a crowd as an average artist, with however a still rather limited ability for price
differentiation for “recorded” material. As a consequence, the revenue of a superstar will increase
more than proportionally to its quality advantage. The advantage of a superstar is affected by various
factors: (i) the number of close competitors; (ii) the quality gap between the superstar and the
competitors and (iii) the fans’ tastes. In cinema, a star generates idiosyncratic viewing pleasures,
which enable consumers to conceptualise the film product as a film type, allowing for differentiation
among films. The public good dimension of the product delivered to the market reinforces the
superstar effect. For a concert, the artist will incur the same level of effort
for an audience of a
thousand-seat hall to a hundred-thousand-seat stadium: production costs do not increase proportionally
to the size of the market. Substantial economies of scale could be achieved through the joint
consumption of the product by a great number of fans and this feature favours market concentration.
46
Based on a quotation from screenwriter William Goldman (1983) “With all due respect, nobody knows anything”. See Caves (2000).
47
Rosen (1981)
48
In practice, in some sector, the superstar effect is limited when the star’s cost of performing increases with the audience size or the number
of performances and with the time dimension.

The European Audiovisual Industry: an Overview
O. Debande & G. Chetrit – 07/09/01 – Final version
31
As a consequence, in an environment of demand uncertainty, different variables could affect a film’s
success: (i) the participation of stars (actors, producers…); (ii) critical review and appreciation; (iii)
production budget which could be partially correlated to star participation; (iv) sequels; and (v) the
type of films, especially for the effect on the other profit windows opportunity (video/DVD,
merchandising…). Recent studies have tried to identify the (non-)existence of relationship between
film stars and successful films in the case of Hollywood
. Those studies have provided weak
evidence about the impact of stars on films’ success. As stressed by De Vany and Walls (1999, pp.
286), “By making strategic choices in booking screens, budgeting, and hiring producers, directors and
actors with marquee value, a studio can position a film to improve its chance of success. But, after a
film opens, the audience decides its fate. The exchange of information among a large number of
individuals interacting personally unleashes a dynamic that is complex and unpredictable. Even a
carefully managed and expensive marketing programme cannot direct the information cascade; it is a
complex stochastic process that can go anywhere”. The absence of a clear link between stars and
return on investment for film seems to demonstrate that the industry is run not by knowledgeable
insiders who take costly actions to signal to outsiders but by uninformed insiders who guess and often
fail in projecting the success of a film.
The emergence of stars could be the simple reflect of collective consumers’ behaviour (“bandwagon
effect”) and not directly related to talent (see section 3.2.2. below): if buyers one after another choose
record album from those in the store, each buyer’s likelihood of selecting a given record is
proportional to the fraction of previous consumers who picked it. Various studies have tried to
disentangle the bandwagon effect from the talent one. For instance, for the music industry, the
responsiveness of record sales to talent is not as great as predicted by the superstar model but it
implies that small differences of talent (among the most talented) should produce large differences in
success
. The role of critics might reinforce the signalling effect of superstars as well as the relative
price independence of albums or cinema ticket to superstar versus ordinary artist. The effectiveness of
this mechanism is also affected by the technology that determines the speed of diffusion of AV goods
through the consuming public. For instance, the radio has greatly accelerated the diffusion of new
songs and cut the estimated lifespan of a popular song from eighteen months to three
.
Finally, other sources of information can be drawn upon pre-purchase in order, for instance, to raise
the chance of spending the evening watching a good rather than a bad film. Different mechanisms
exist in order to elicit (partial and subjective) information before buying the AV goods, given the
leisure time and income constraints faced by individuals:
1. Social behaviours and interactions: Different behaviours could be observed related to the
search of information to decide on the level and amount of consumption. Herd behaviour
arising from people’s ignorance or/and the cost of informing themselves is based on the
inference of the quality of the good by looking at the consumption choice of other individuals.
Exchange of information could also be achieved through conversation about AV goods. This
simple mechanism seems to be a very powerful transmitter of information: the information is
delivered free of charge and partially abstracted of details, intensifying the superstar effect.
2. Sellers supply information through advertising and promotion campaign. The advertised
information helps to align AV goods with the tastes of prospective consumers. The
information is limited to the good’s general style and content and its key creative participants.
49
(e.g. Albert (1998), De Vany and Walls (1999), Ravid
49
(1999). For instance, Ravid (1999) examines the role of stars in films considering
two alternative options: rent-capture hypothesis where stars essentially capture most of their value added adjusting their fees to films’
success and signalling hypothesis where the participation of stars (and perhaps big budgets) is used as a device to signal the quality of the
films. Although univariate analysis support the industry view that stars increase revenues, multiple regressions indicate that big-budget films
may signal high revenues (but not high return on investment, i.e. big budgets do not contribute to profitability), regardless of the source of
spending. Other important explanatory variables which positively affect film’s success, in terms of revenue and returns, are attention
received from reviewers, ratings (G (General audience, all ages admitted) + PG (Parental Guidance Suggested. Some material may not be
suitable for children))) and sequels. The importance of stars in the Hollywood system might reflect the organisational structure where studio
executives’ careers may depend on the success of a film and having a star (in a world of “everybody is after a given star”) may be a safe bet
for an executive who is concerned about job security.
)
50
Hamlen (1991)
51
Caves (2000)
52
see Banerjee (1992) and Bikhchandi, Hirshleifer and Welch (1992)

The European Audiovisual Industry: an Overview
O. Debande & G. Chetrit – 07/09/01 – Final version
32
This last aspect shows the interest of the start system foretelling, the most creative product.
The increased supply of AV goods has induced an increase in advertising expenditure in order
to attract the interests of the consumers.
3. The consumption of AV goods relies to some extent on a certification mechanism, i.e. critics
and awards. Assuming the neutrality and objectivity of the critics, the reliance on critics
‘assessments could help to solve the consumes’ information problem by providing a
description of the good or by internalising prospective consumers’ tastes and attempting to
prejudge the AV good’s appeal. However, this process could be biased since critics’ tastes
may not reliably align to the consumer’s, critic’s independence may be compromised
(corruption, bribes…) and the consumer many not have the time, knowledge or money to
access the critics’ assessments. Certification also comes from prizes and awards: they signal
quality to consumers and thereby bring pecuniary gain to producers. For instance, in the
cinema industry, the Academy Awards are a good illustration of the impact such a certification
mechanism could have on film attendance
(as well as on performer’s expected appeal in
future films). The importance of this certification process has increased during the last years,
giving rise to the creation of new prizes and awards events, with a risk of diluting the
information attached to this certification mechanism.
In some sense, there is a symmetrical ignorance of the consumer and the producer. Since the creation
of an AV product like cinema films or popular music albums proceeds from inception to finished
product in a series of stages, characterized by the fact that costs are sunk when the product moves to
the next stage, the recourse to “option contracts
” in this sector is pervasive. It gives to the person in
charge of the next stage the ability of adapting the product if the market has released “fresh” news.
3.2.2. Consumption
patterns
Consumption of AV goods (and creative goods in general) depends on tastes and people invest in
developing and refining their tastes for AV products. Indeed, the consumption behaviour is affected
by experience and training (called “rational addiction” effect
). The consumption pattern is based on
the fact that people consume an AV product, expecting it will raise their capacity to enjoy consuming
that good in the future. The final decision is constrained by time availability and revenues/income.
This cumulative process could be illustrated in the case of music
. Each month, an individual gets
utility from the amount of music consumed (“appreciated”). The amount of music appreciated
increases with the hours devoted to it and with the human capital conductive to music appreciation
(knowledge and experience). In other words, the stock of music appreciation capital increases the
productivity of the time spent on appreciating music; this stock depending on the investment made in
general education and on our family background (or the inherited cultural capital
). The consumption
decision is affected by the cost of music appreciation (concert tickets, compact discs price…), the
income and the price of substitute goods. The productivity of the time spent on music appreciation
will reduce the composite cost of consuming music. The notion of addictive goods to describe the AV
goods is corroborated by the type of audience attending events
or buying products. In addition, the
social context in which the consumption decision is taken affects the type of goods bought and the
response to novel opportunities, especially in the way of acquiring information on the quality of the
product (see section 3.2.1.).
53
Prag and Casavant (1994) identify that small-budget films that have not received heavy sales promotion and films early in their exhibition
cycle in awards night, gain the greater benefit from receiving awards.
54
The notion of “option contracts” is related to the sequence of activities of the film-making process and rests on the following mechanism of
allocating the decision rights. Indeed, for the realisation of a film, the writer prepares the film’s screenplay; the producer mobilises the actors
and other inputs to make the film, the studio edits it and integrate the soundtrack music, the distributor plans the film’s advertising and
distribution… In order words, at each stage, one party makes a decision about investing more resources into the project, while the previous
contributors’ investments are wholly sunk. Decision rights are allocated to the party about to contribute in terms of resources. The notion of
“option contract” means that when party B, in a position to decide the next moves, negotiates a contract with predecessor A that specifies
how A will be remunerated if B decides to go ahead with the project. B acquires from A the opportunity to a specified time interval to
analyse the project and decide how to proceed with the project. Once B exercises his option to purchase these rights and sink its own input
into the project, decision rights are passed to C, who takes an option to consider the next step.
55
Becker and Stigler (1977), Mc Cain (1981)
56
Caves (2000)
57
Bourdieu and Darbel (1969)
58
Bonnell (1996) for the cinema

The European Audiovisual Industry: an Overview
O. Debande & G. Chetrit – 07/09/01 – Final version
33
4.
MARKET STRUCTURE OF THE AUDIOVISUAL INDUSTRY
In addition to a lack of integration between the various stages of the production life cycle in a
fragmented European AV market, the review of the European AV industry has allowed to identify
specific factors affecting each stage:
•
Development stage:
§ lack of investment by producers in this stage in comparison to the US market and
acceptable standards for “prototype” industries due to under-capitalisation of
producers and shortage of external funds;
§ high rate of continuation of projects, leading to too many unviable films going to the
production stage.
•
Production stage:
§ sufficient film production in the EU, with risk of over-supply of film (higher than in the
US in 1999), ensuring diversity in the supply of films with respect to cultural and
linguistic tastes of the consumers;
§ increased supply in European TV fiction denoting the greater interest of viewers for
national TV programmes;
§ fragmentation of the national European market, not compensated by the development of
coproduction schemes increasing their share in the number of films produced;
§ lack of adequate financing, partially compensated by the existing public support which
could to some extent reinforce the market segmentation;
§ prevalence of small independent films and TV producers.
•
Distribution stage:
§ strong market position of national distributors on their own markets and absence of EU
wide studios, while US majors have distribution subsidiaries in most of the European
countries allowing them to maximize the release policy of the films across markets,
§ low rate of distribution of films outside the national market as well as circulation of
national TV production to other European non-national channels;
§ upstream adverse effect of the lack of European integration of the distribution stage on
production, since few distributors commit themselves to pre-sell European non-national
films until they have demonstrated their commercial potential on their national market;
§ ability of US distributors to amortise their promotion costs on their domestic market
and hence to invest sufficiently in the promotion and marketing of the film (P&A costs),
while European distributors have to adapt their strategy to each national context;
§ selling of the rights on successful European TV reality/game shows to US channels.
•
Exhibition and broadcasting stage:
§ strong investment, partially initiated by US exhibitors, led to a modernisation of the
existing “fleet” of cinemas, namely with the building of multi and megaplexes;
§ consequent saturation of most European cinema markets, with the exception of Italy and
Spain, and high degree of indebtedness of exhibitors, reducing their flexibility to adapt to
new/future exhibition technologies;
§ increase in the transmission rights on major sport events and to a lower extent on films;
§ high potential for the technological development of new AV services (video-on-demand,
interactive services);
§ entry of new specialized TV channels benefiting from the development of digital cable
and satellite transmission, generating additional demand for AV works.

The European Audiovisual Industry: an Overview
O. Debande & G. Chetrit – 07/09/01 – Final version
34
4.1. The
Film
industry
The film industry, as other AV sectors, is a “prototype” industry and a film could be considered as a
one-off purchase
. In addition to this “prototype” characteristic, films have other features identified
in the literature:
(a) Films enter and exit the market on a continuing basis;
(b) Films compete against a changing cast of competitors;
(c) Films have a short period of time to capture the audience’s imagination, earning in general
their maximum box-office revenues in the first week of release while the point of widest
release for most films is the second week;
(d) Few films have “legs” gaining positive word-of-mouth and enjoying long runs;
(e) Weekly box-offices revenues are concentrated on only three or four top ranking films;
(f) Most films lose money, i.e. on a sample of ten films, seven lose money, two break even and
one generates a very high return making the average film box-office depending almost entirely
on a few extreme revenue outcomes whose probability of occurrence is low. The situation is
slightly different in the EU and in the US, where in the former due to public subsidies, the
percentage of films which break even is higher, but the return is quite similar on average.
The following sections review the evolution of the European film industry following the structure of
production, distribution and exhibition stages.
4.1.1. Production
Film production
in the EU has significantly increased since 1994 as described in Figure 8, reaching a
production of 650 films in 1999 (compared to 628 in the US). Between 1986 and 1999, the number of
films produced in the EU has increased at 2.2% per year in average (compared to 1.3% in the US).
France is still the largest film producing territory in Europe, accounting for 23% of all production in
the EU in 1999. The production remains stable over the last years. Italy, the second European market
in absolute size in terms of number of film produced, accounts for 17% of the total production in 1999.
Production has increased over the last two years, reflecting the entry of new producers in the market
(Screen Digest (2000)). Miramax established a production base in Rome while shutting down the
London operation base. The Dutch group Endemol acquired a controlling stake in film producer
Palomar. The third largest markets are the Spanish and the British ones, accounting for respectively
13% and 12% of the total production in 1999. The evolution in those two countries results from
different factors. In Spain, much of this growth comes from public initiatives, aiming at diverting
broadcaster investment into the film industry, and the emergence of several major film rights buying
operations. The recovery of the UK market is mainly due to the influx of outside finance into the film
production sector, i.e. US investment. Finally, in Germany, accounting for 11% of the production
market, the upward trends in film production reflects the entry of new operators coming from the post-
production sector. For instance, Munich-based post-production facility Cinemedia moved into film
production, promptly securing a distribution deal with Buena Vista.
First estimation
for the production level in 2000 seems to indicate a slight decrease of 0.8% in films
production in the EU (while a growth in film production is observed in the US after the major drop
observed in 1998). The reduction has been more important in the UK (22%), Italy (5%) and in
Germany (11%), while a stabilisation was observed in France (-0.3%) and a strong growth in Spain
(26%).
59
To illustrate this feature, Durie and al. (2000) have recourse to the following illustration: “When people buy a product that is new to them,
they may first engage in the process of sample testing. In the case of tooth paste or soft drinks, the consumer may buy several different
brands before settling on a favourite. By contrast, an audience cannot really compare a new film with another existing product and will not
be able to sample it fully, except by paying to see it.”
60
The number of films produced corresponds to the sum of the full-length films with 100% of national origin producers and the international
coproductions with national origin producers as majority producers.
61
European Audiovisual Observatory (2001).
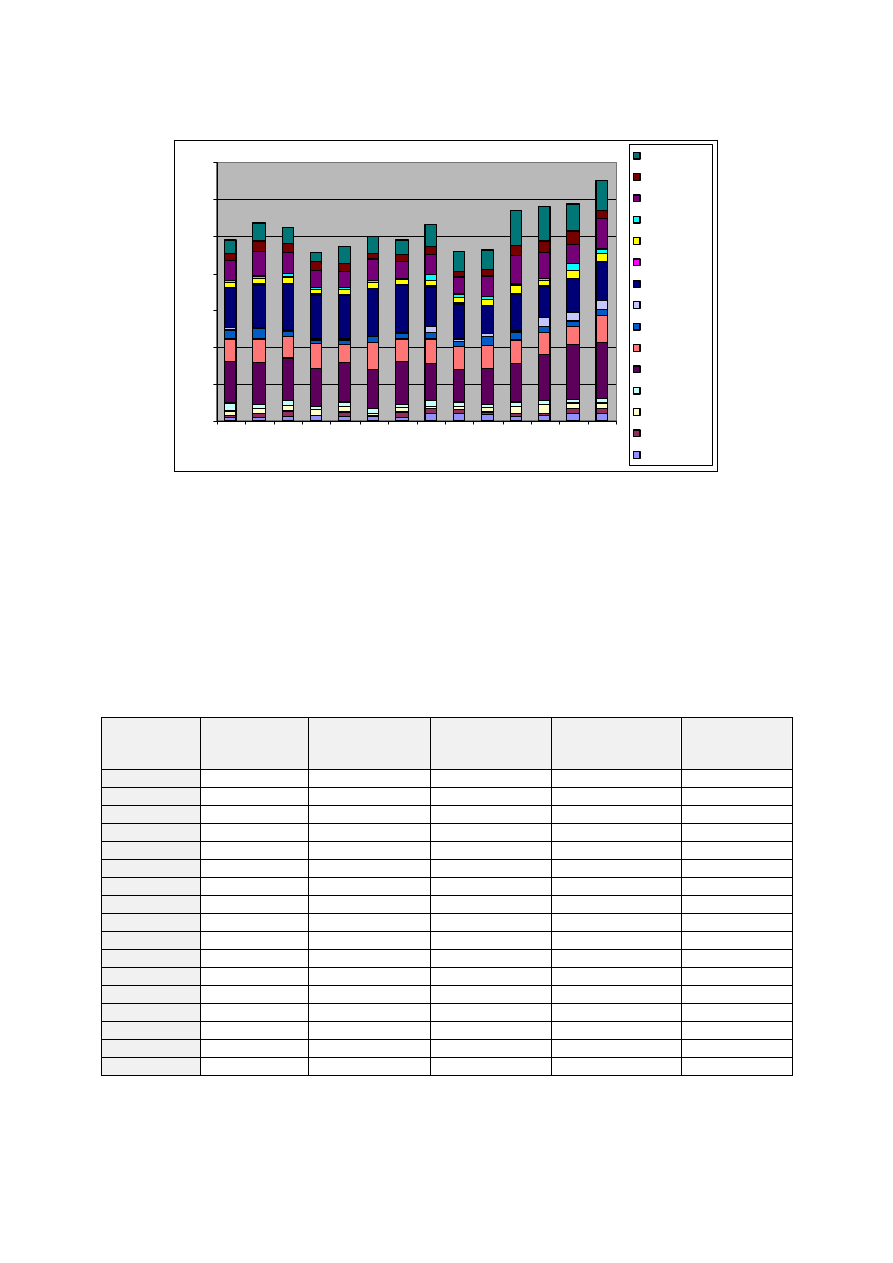
The European Audiovisual Industry: an Overview
O. Debande & G. Chetrit – 07/09/01 – Final version
35
Figure 8: Evolution of the film production in the EU between 1986-1999
0
100
200
300
400
500
600
700
19
86
19
87
19
88
19
89
19
90
19
91
19
92
19
93
19
94
19
95
19
96
19
97
19
98
19
99
UK
Sweden
Spain
Portugal
Netherlands
Luxembourg
Italy
Ireland
Greece
Germany
France
Finland
Denmark
Belgium
Austria
Source: European Audiovisual Observatory (2000) and Screen Digest (2000b)
Although the level of production is quite similar in the US and in the EU, the number of cinema
admissions in the US is nearly twice as high as in the EU (in 1999, 1,465 million in the US compared
to 811,5 in the EU – see below) with a national market share enjoyed by national films in the US
higher than 90% and a market share in the EU of American films higher than at least 60%. The high
volume of production in the EU is linked to the willingness of Member States to develop and preserve
the cultural diversity of programmes. However, the existing market context makes it difficult to make
return on the production of European films.
In order to have a different overview of the film production landscape in the EU, Table 4 provides a
picture of the production capacities across the EU.
Table 4: Films produced and production capacity in the EU (average 96-99)
Number of
feature films
produced
Feature films per
million
inhabitant
Investment in
film production
(M EUR)
Investment per
number of feature
films (EUR)
Ratio
investment on
population
Austria
18 2.2 14.1 805,312
1.75
Belgium
10 1.0 23.3 2,387,515
2.29
Denmark
20 3.7 34.7 1,778,330
6.56
Finland
10 1.9 12.2 1,249,708
2.37
France
132 2.2
659.9 5,008,503
11.25
Germany
62 0.8
278.2 4,468,901
3.39
Greece
17 1.6 3.9 238,187
0.28
Ireland
19 5.1 86.9 4,574,664
23.61
Italy
97 1.7
172.2 1,784,774
3.00
Luxembourg
0 0.0 2.1
n.a.
5.03
Netherlands
20 1.3 27.6 1,379,792
1.76
Portugal
10 1.0 3.3 345,878
0.33
Spain
70 1.8
135.0 1,921,805
3.43
Sweden
29 3.3 35.6 1,217,840
4.03
UK
86 1.4
676.7 7,914,575
11.46
EU
597 1.6
2152.1 3,604,774
5.75
US
669 2.5
8000.7
11,963,665
29.74
Source : Author calculation based on European Audiovisual Observatory (2000) and Screen Digest (2000b) data (especially for Ireland)
The number of feature films produced per million inhabitants appears not to be dependent on
geographical or demographic considerations. Countries with restricted areas do not demonstrate on
the whole a low production in terms of number of films produced, although economies of scale would

The European Audiovisual Industry: an Overview
O. Debande & G. Chetrit – 07/09/01 – Final version
36
be very difficult to achieve in small countries. Among the five big countries, only France is
performing well on the basis of this criterion, but behind the Nordic countries having the highest level
of production.
The situation is quite different when considering investment in production of feature films. Although
the Nordic countries still perform well (as Luxembourg and Ireland, which could be related to the
fiscal advantages provided in those countries), France and the UK (as well as Germany) have large
production both in terms of volume and in terms of intensity, i.e. around EUR 650-700 million and
EUR 11 million per million inhabitants. While the small countries may produce as many works as the
large countries in relation to their population, the average budgets invested are lower. The smaller
countries break down into two quite distinct groups:
•
The first group is Denmark, Sweden, Luxembourg and Ireland: they have a production
capacity higher than EUR 4 million per million inhabitants which is greater than the capacity
of Germany, Spain and Italy;
•
The second group is the Belgium, Finland, Greece, Netherlands and Portugal having a
production capacity lower than EUR 2.5 million per million inhabitants.
The smallest countries in terms of population do not have a low capacity in common, but simply a low
volume of production, which is directly and naturally explained by the size of their internal market.
The production capacity is affected by the geographical and linguistic isolation of its market.
The small size countries are however faced with a significant problem, i.e. the combination of high
and non-recoverable fixed costs (the so-called “sunk costs”) and a naturally limited primary market.
This joint characteristic implies that the admissible market size to benefit from economies of scale is
difficult to attain, limiting the scope for the development of a national industry in small countries.
Producers in those countries are faced with the following alternatives
:
•
“to produce for the national market, to remain under-capitalized, including in relative terms, in
comparison with the industries in the five countries with a high volume of production, to rely
only on national subsidies on a cultural basis and be especially vulnerable on their own
market”,
•
“to try and search for sources of writing off their costs on foreign markets in order to reach a
level of outlets that is compatible with the fixed costs for this activity, and strengthen capital
structures”.
The European market is constrained by the objective of ensuring a sufficient level of diversity, which
justifies the support to production in small countries. In addition to the positive externalities of
ensuring diversity in content production, the support of production in countries with a low volume of
production is beneficial for the European cinema industry by:
•
developing a preference for cultural diversity by watch national films, that are different to the
international US standard, generating spillover effects on other non-national European
productions;
•
promoting economic and creative competition which could positively stimulate the
performance of European producers.
Those positive cross-border external effects of diversity need to be assessed at the European level. As
stressed in a recent study
, the implementation of a co-ordinated European policy would avoid the
emergence of strategic ‘national’ behaviours (inflation of subsidies, fiscal dumping, etc.) and hence
reduce the overall cost of sustaining the European cinema industry.
This failure is reflected by the over-abundance of small production companies in Europe, not all of
which are constantly producing (see Table 5 below). With variations depending on the country
considered, there are more production companies than films produced each year. The picture is quite
contrasted when looking at the situation in the UK, Germany and France
. The UK has the highest
62
BIPE (1998)
63
BIPE (1998)
64
Screen Digest (1999c)

The European Audiovisual Industry: an Overview
O. Debande & G. Chetrit – 07/09/01 – Final version
37
number of projects managed by the same producers (with an average of 3.32 projects per producer)
and is also recording the highest proportion of highly and moderately active producers. Although
Germany has around the same number of producers, the average projects per producer is around 2.31
projects and only three companies have more than 10 projects on their books. France is at the bottom
in terms of number of projects per producers, reflecting the low degree of concentration of the
production side.
Table 5: Estimated number of production companies in the EU (1997)
Number of film production
companies
Number of films produced
Estimated number of films
produced per company
Austria
15 15
1,00
Belgium
100 7
0,07
Denmark
65 24
0,37
Finland
34 9
0,26
France
725 125
0,17
Germany
57
1
61
1,07
Greece
16 16
1,00
Ireland
n.a. 4
n.a.
Italy
140
1
87
0,62
Luxembourg
12 0
0,00
Netherlands
30 13
0,43
Portugal
18 8
0,44
Spain
79 69
0,87
Sweden
65 32
0,49
UK
n.a. 94
n.a.
Source: European Audiovisual Observatory (2000) and MEDIA Salles (1999)
1. Germany: Data for 1998; Italy: Data for 1996
At the same time, film production is clustering in some specific areas in the different countries
•
France: concentration of 91% of production companies in or around Paris ;
•
UK: concentration of 86% of production companies in or around London.
This concentration process, allowing to achieve economies of agglomeration, is less prevalent in
federal countries, like Germany where production facilities are spilt between Berlin (28%), Munich
(40%) and to a lower extent Hamburg (20%).
The European production landscape is quite different from the US situation. In Europe, producers are
not organised in any commercial structure which could properly be called a “studio” in the American
approach. Small independent producers
make the majority of European productions in a highly
fragmented industry where 80% of companies produce no more than one film a year.
In parallel to the fragmentation of the independent production sector, a number of the larger
production companies are starting to look towards the US market, with pre-sales and distribution
agreements with the “majors”
. One thing that has helped is the increasing tendency to produce a
mixture of films in the local language and Hollywood-style, English-language films which lend
themselves to international distribution. This strategy has helped European producers such as French
majors Studio Canal Plus and Gaumont and the Spanish company Sogepaq, to boost their international
sales. Those companies, as well as Kirch, Mediaset and CLT-Ufa are trying to acquire media rights on
a Europe-wide basis, the first step in establishing cross-border operations, followed by setting up or
65
Screen Digest (1999c)
66
In Europe, an independent producer is defined as a producer who is independent of broadcasters, whereas in the United States it is
independence from the major film-production groups that matters. In Europe, the broadcasting industry is structured very differently from
one country to another and some national production industries are less captive than other of major public or private broadcasters. The
definition of the notion of “independent producer” has followed the implementation “Television without frontiers” Directive, requiring to
have a “common” approach of the “independent producer “ category in order to be able to monitor the respect of the legislation that 10% of
broadcasting time or 10% of the programming budget must be allocated to independent producers.
67
The so-called “majors” could be identified as the members of the Motion Picture Association: Buena Vista (Walt Disney, owning also
Miramax, an “independent studio”), Columbia (Sony Pictures Entertainment), Metro Goldwyn Mayer, Paramount Pictures (Viacom), 20
th
Century Fox (News Corp.), Warner Bros (AOL Time Warner, owning also New Line Cinema, an “independent studio”), Universal Studios
(Vivendi Universal). Dreamworks SKG could be added to this list.

The European Audiovisual Industry: an Overview
O. Debande & G. Chetrit – 07/09/01 – Final version
38
acquiring distribution and production subsidiaries. The same pattern of the slow emergence of pan-
European groups is also in progress for facilities companies. Facilities provision is a relative uncertain
business, depending as it does largely on film production levels, and the setting-up of subsidiaries in
other countries does not appear as the most efficient strategy. However, some move towards vertical
integration between producers and facilities/post-producers is appearing in some countries, such as
Germany (Das Werk acquiring a controlling stake in Wim Wenders Road Movies).
The situation in the European production market is also related to the lack of investment in the
development stage by the European audiovisual industry
, compared with the standards sets by other
prototype industries (e.g., compared to R&D investment by firms), and especially in comparison with
usual practice in the American cinema industry, which has been able to impose its level of quality on
the market. The divergent evolution in box office returns generated by European films and American
film, especially during the 70s and 80s where the returns decreased in Europe while remaining stable
in the US, associated with the scheduling strategy of distributors favouring American products, has
revealed a problem of suitability for the market of European products. The development stage is often
considered a “marginal” segment. A recent French study
showed that in France only 2% of the film
budget was allocated to the development stage, i.e. to the R&D stage (to compare with 10% observed
in other industries and in the US cinema industry). This situation resulted from the under-
capitalisation of the independent production companies and the lack of available external sources of
funds. As a consequence, the abandonment rate of the projects developed is lower in France and in
Europe, since when the producers committed funds for the development, those funds are sunk and
represented a substantial proportion of the producer resources. The producers have then a strong
incentive to continue the production, hoping (often vainly) to recover the investment if the film is a
success. This feature has an adverse effect on the access to the market and hence on the expected
profitability of the film.
Domination of the American product
The strength of the American studio rests on their ability to amortise the production cost on a large and
dynamic market characterized by linguistic and cultural homogeneity. This opportunity gives to the
American industry a substantial comparative advantage as their exports over the fragmented European
film industry
The increase in the penetration of the American products in the cinema sector has worsened the trade
imbalance between the US and the EU. Looking at the situation in the five major European countries,
the following picture emerges in terms of imbalance with the US for consumer level cinema in 1999
(Figure 9).
American films earned nearly EUR 9.4 billion in the US and Western Europe, the home market
accounting for 68%. Among the five European countries, UK films earn more revenue in the US
market than in their home market, but imports are also very high. Germany has the highest US
balance of payments deficit in Europe. For France, Spain and to a lower extent Italy, the home market
is the major outlet.
68
BIPE (1998)
69
Rapport Gassot (2000)
70
The domination of the American industry could be assessed on the basis of following indicators:
•
The share of box office returns generated by films of American origin in all Member States, with the exception of France and
Italy, was above 60%.
•
The share of US films in the total of films distributed, with the exception of France and Italy, was greater than 50%.
•
The market share of the American “majors” in the area of distribution was often greater than 50%.
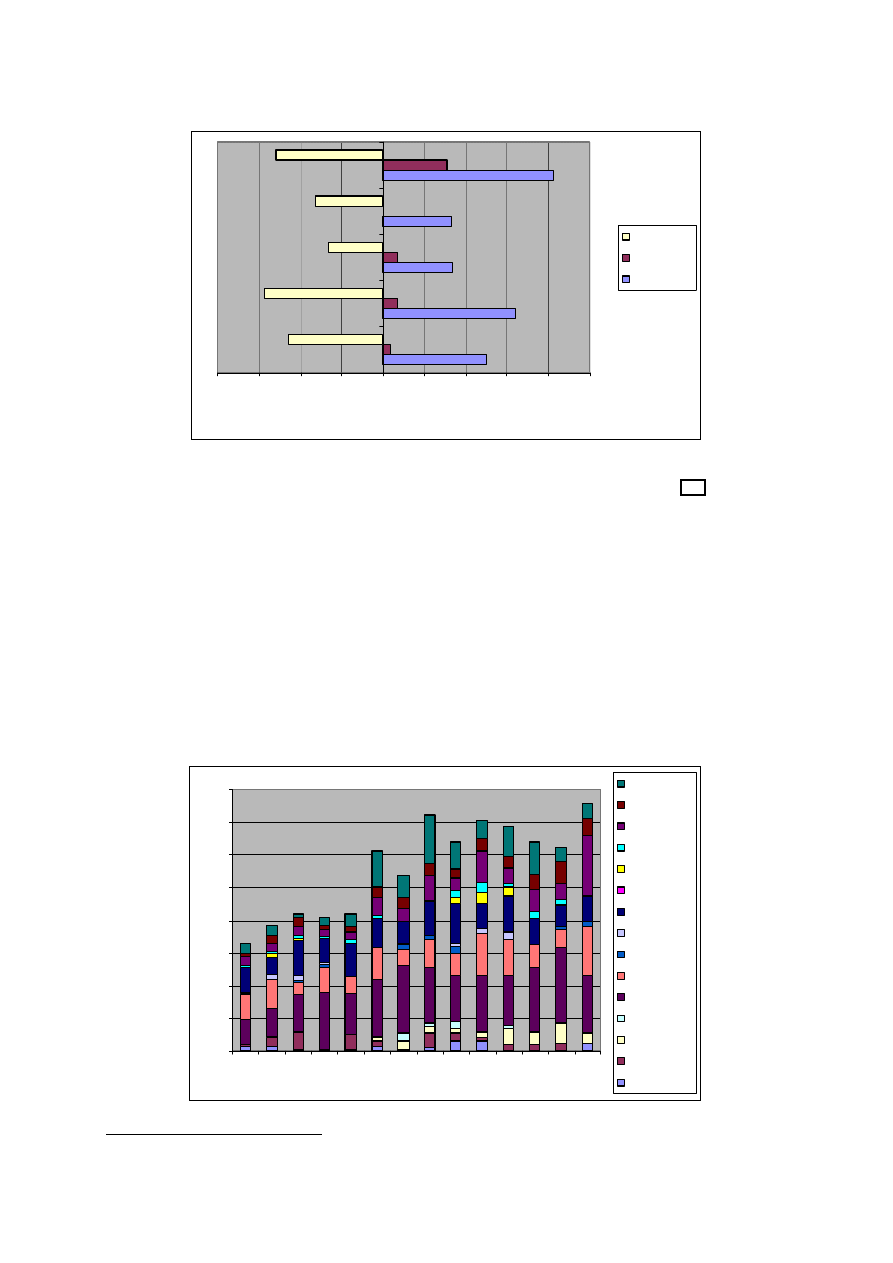
The European Audiovisual Industry: an Overview
O. Debande & G. Chetrit – 07/09/01 – Final version
39
Figure 9: Major EU balance of payments with the US for consumer level cinema in 1999
-800
-600
-400
-200
0
200
400
600
800
1000
France
Germany
Italy
Spain
UK
EUR m
Balance
US exports
US imports
Source: Screen Digest (2000d)
Over the last ten years exports by US majors to non-American television channels have been the main
source of revenues. Based on estimations from the European Audiovisual Observatory
, the US films
and TV programmes sales by the Motion Picture Association of America (MPAA) and American Film
Marketing Association (AFMA) members accounted for USD 3.1 billion in 1998. The growth has
been sustained since 1994, as illustrated by the increase of 16% p.a. of the sales to TV channels by
AFMA members in Europe. In addition, the US majors have been very successful in using the
video/DVD market to generate revenues. Finally, the US majors have also developed a new strategy
of exporting thematic digital package channels via cable and satellite transmission support in Europe.
A good illustration is the launch of Disney Channel in France, CanalSatellite, the French package
offering seven US-based channels, and Canal Satellite Digital, the Spanish package with four
American channels.
As shown in Figure 10, the number of coproductions has increased in the EU since 1986, reaching 151
majority coproductions in 1999 (a growth of 7% p.a.).
Figure 10: Evolution of the majority coproduction in the EU
0
20
40
60
80
100
120
140
160
19
86
19
87
19
88
19
89
19
90
19
91
19
92
19
93
19
94
19
95
19
96
19
97
19
98
19
99
UK
Sweden
Spain
Portugal
Netherlands
Luxembourg
Italy
Ireland
Greece
Germany
France
Finland
Denmark
Belgium
Austria
Source: European Audiovisual Observatory (1986, 2000)
71
Audiovisual European Observatory (2000)

The European Audiovisual Industry: an Overview
O. Debande & G. Chetrit – 07/09/01 – Final version
40
In terms of share of total number of feature films produced in the EU, the majority coproductions
accounted for 23% in 1999, reflecting a stabilisation of its share, the maximum being reached in 1995
where the majority coproductions represented 30% of the total production.
Four countries make a substantial contribution to the number of coproductions: France, Germany,
Spain and Italy. While France and Italy have a long tradition of coproductions, especially with
countries having a linguistic or geographical proximity, the German and Spanish industries have
increased their proportion of coproductions, reflecting the dynamism of those two markets. The
recourse to coproductions is in general associated with high budget costs film. However, at the same
time, the development of coproductions has not really led to a reduction of the share of American
films. The US majors have not engaged in a lot of international coproductions because of the their
managerial complexity. They usually prefer to involve international directors and actors in their own
productions.
4.1.2. Film
Distribution
As described in Section 2.1., in the film industry value, the distribution and exhibition are two distinct
operations. The distribution segment has to be considered as an international market with different
“exhibition or profit release windows”, i.e. cinema, video/DVD, PPV, pay-TV and free TV. Since
1980, a trend of vertical integration has been observed in both the EU and the US, with the larger US
distributors gradually increasing their market share but with a strong national bias in the EU. The
growth of concentration could raise competition issues, requiring the definition of the “relevant
market”, i.e. to consider the different windows as separate products market and to define the
geographical market
When releasing a film in order to maximize the probability of success, the distributors have to define a
strategy on the basis of the following parameters
: the cost of the marketing and promotion campaign,
the time of release in cinema theatres, the number of prints released, the number and location of
cinema theatres (subject to availabilities of screens and the existing relationship with exhibitors), the
sequence of release across the various profit windows. The policy in terms of release windows is
affected by technological development, e.g. the introduction of pay-per-view or video on demand,
affecting the potential time of exploitation and the revenue associated with each segment.
The distribution sector of feature films in Europe is less structured than the American one. In 1999,
there were some 478 distributors
in all the EU, a slight decrease since 1997. The decrease in the
number of distributors reflects the market reorganisation in various European countries (see below).
France accounted for 33% of the total number of distributors, while the other major countries have a
share around 12% each.
As shown in Table 6, the average rental revenue of distributor has increased by 8% p.a. in the EU,
reflecting the recovery of the European film industry. Comparing the situation in the EU and in the
US in terms of average releases per distributor, it appears that the market is less concentrated in the
US. However, this statement does not reflect the high level of concentration of the US market in the
hands of the majors.
The situation is quite contrasted within the EU. On the other hand, the average rentals per first-run
release shows the strong financial viability of the distribution sector in the US. In addition, the
European countries, like Germany and the UK where American distributors have a strong market
share, are the most performing ones.
72
The EC has specified that in terms of competition law, the relevant market is each “exhibition window” on a national basis.
73
See Durie and al. (2000)
74
Screen Digest (2000b), not including Luxembourg and the Netherlands

The European Audiovisual Industry: an Overview
O. Debande & G. Chetrit – 07/09/01 – Final version
41
Table 6: Distribution rental revenue
Distributor rental revenue
(EUR m)
Average rentals per first-
run release
(EUR, x1000)
Average releases
per distributor
1996 1998 1999
%
p.a.
1998
1998
Austria
29.5 25.9 30.0 0.5
116.5
14
Belgium
48.0 47.9 46.3 -1.2
130.5
15
Denmark
26.3 29.3 32.4 7.2
188.5
8
Finland
13.5 14.8 18.2 10.4
111.5
7
France
302.4 322.9 343.0
4.3
830.5
3
Germany
293.2 322.2 363.8
7.5
1220.2
6
Greece
15.4 19.7 24.1 16.2
137.6
1
n.a.
Ireland
15.6 17.0 17.6 4.1
113.3
20
Italy
178.5 191.8 191.5
2.4
554.7
14
Luxembourg
1.8 2.9 3.3
23.2
16.2
218
Netherlands
37.8 42.0 43.1 4.5
199.6
n.a.
Portugal
17.2 21.1 26.1 14.9
122.8
14
Spain
172.0 176.9 226.2
9.6
384.9
10
Sweden
42.8 43.4 48.0 3.9
253.3
10
UK
216.1 305.2 317.1 19.7
880.8
7
EU
1410.0 1583.1 1746.5
8.2
293.4
13
US
1955.3 2526.1 2479.4
11.9
5059.9
2
Source: Screen Digest (2000b), European Audiovisual Observatory (2000)
1. Data for 1997
Distribution remains highly concentrated in the US, with the ten main companies
holding an
aggregate 97% share of the market defined in terms of box office revenues
. The major US
distributors (UIP, Walt Disney Group, Columbia Tristar, 20
th
Century Fox and Time Warner Group)
have generated box office revenues of USD 6.4 billion in 2000, a reduction of 4% compared to 1999
(USD 6.6 billion)
. The US distributors have followed different strategies to enter into the European
market
•
Creation of a joint-subsidiary active in most of European countries: UIP created in 1981 and
jointly owned by Paramount (now part of Viacom), Universal Studios (now Vivendi-
Universal) and MGM. Since 1995, UIP is only owned by Paramount and Universal. The new
strategy of Vivendi-Universal has not yet been defined, either to stay in UIP or to rest on the
Seagram and StudioCanal distribution networks;
•
Creation of subsidiaries in most European countries corresponding to the approach followed
by Buena Vista, Columbia Tristar, 20
th
Century Fox and Time Warner Group;
•
Joint-venture between European companies and US studios, e.g. UFD (50% UGC
Distribution, 50% 20
th
Century Fox), Gaumont Buena Vista International (50% Gaumont, 33%
Buena Vista International France) in the French market;
•
Long-term agreement between national distributors and US studios like Entertainment Film
Distributors Ltd in the UK, Sandrew Metronome in Finland, Nordiskfilm, Egmont and
Sandrew-Metronome International in Sweden…
Within each national market of the EU, other types of organisational structure have been implemented
in the distribution: independent distributors (R.C.V. Entertainment B.V. in the Netherlands, Manga
Films SL in Spain…), distributors integrated within TV channels (StudioCanal in France, Channel4 in
the UK through FilmFour Ltd…), distributors vertically integrated into a cinema group (Pathé
Distribution in France, Cecchi Gori Distribuzione in Italy…), producers active in the distribution
(Senator Film Verleih GmbH in Germany, Aurum Producciones SA in Spain…) and exhibitors active
75
Walt Disney Group (Buena Vista and Miramax), Paramount, Time Warner Group (Warner Bros and New Line), Columbia Tristar, 20
th
Century Fox, Dreamworks, UIP, MGM
76
Screen Digest (1999b)
77
European Audiovisual Observatory (2001).
78
Lange (2001)

The European Audiovisual Industry: an Overview
O. Debande & G. Chetrit – 07/09/01 – Final version
42
in the distribution (Lusomundo Audiovisuals SA in Portugal or Laurenfilm SA in Spain). Although
the distribution sector is relatively concentrated, there is a lack of integrated pan-European companies.
The market share enjoyed by American distributors in the EU varies between 80% in the UK (based
on 1995 data – Media Salles (1999)) and 26.8% in France. Nordic countries, Germany, the
Netherlands and Belgium are also confronted with a strong domination of American distributors,
achieving a market share in average around 74%. Italy is in-between the French situation and the
situation of the other European countries.
Since the US “Majors” have a greater degree of control over distribution, they are able to organise the
release of their films throughout Europe in a short period of time, improving the efficiency of the
promotion and marketing policy by involving actively the cast/director. On the contrary, European
films are first released on their national markets and, in case of success, other European non-national
distributors could commit to distribute the film in another European country. The strategy generates a
“timing constraint”, i.e. the release of the film over several months, making it difficult for European
cast/director to take an active part in the promotion. In addition, since distributors play an active role
in the financing of a film (see section 5.1.), the lack of commitment of European non-national
distributors, preferring to release US films, reduces the possibility of launching important productions
with a high commercial potential.
As a consequence, distributors remain dependent on American films. National films that are not
considered as commercial, and as well European non-national films are faced with the problem of
gaining access to cinemas. The major national distributors have a “pre-emptive” strategy in order to
share national films with strong potential. This situation affects the viability of small independent
distributors. As shown in Table 7, each national market in Europe appears to be relatively
concentrated in terms of distribution.
Table 7: Concentration in distribution in 1998
Country
Companies
Films released
Gross Box
Office
Austria
Constantin/Filmladen/ Buena Vista/Polyfilm/UIP
60.4%
Belgium
Columbia Tristar/UIP/Buena Vista International/Warner
Bros/ Kinepolis Film Distribution
34.8% 83.3%
Denmark
Nordisk Columbia Fox Constantin/UIP/Buena Vista
International/Sandrew Metronome Warner/Scanbox
19.4% 81.4%
Finland
Columbia Tristar Egmont/Sandrew Metronome
Warner/Buena Vista International/UIP/Kamras Film
73.8% 93.2%
France
UGC-Fox Dist./Gaumont Buena Vista Int./UIP/Bac
Films/Warner Bros
21.3% 72.9%
Germany
20
th
Century Fox/Buena Vista/UIP/Warner
Bros/Columbia Tristar
33.3% 74.6%
Greece
Prooptiki/Waneroadshow/Spentzos/UIP/Odeon Elke
n.a.
n.a.
Italy
20
th
Century Fox/Cecchi Gori Distribuzione/UIP/Medusa
Film/Warner Bros Italia
43.8% 55.4%
Luxembourg
Utopia SA/CDAC/Kursaal
100%
100%
Netherlands
Columbia Tristar Fox/UIP/Buena Vista
International/Warner Bros/RCV
58.6% 91.7%
Portugal
Lusomondo Audiovisuais/Atalanta Filmes/Filmes
Castelo Lopes/Columbia Tristar
n.a. n.a.
Spain
Hispano Fox Film/UIP/Buena Vista
International/Columbia Trista/Warner Española
19.8% 69.7%
Sweden
AB Fox Film/Buena Vista Int. Sweden AB/UIP/AB
Svensk Filmindustri/Columbia Tristar Films Sweden AB
10.2% 75.5%
UK
20
th
Century Fox/Buena Vista/UIP/Columbia/Warner
Bross
n.a. 77.5%
Source : MEDIA Salles (1999)

The European Audiovisual Industry: an Overview
O. Debande & G. Chetrit – 07/09/01 – Final version
43
However, new alliances are emerging addressing the major objective of building a European
distribution network
. For instance, pay-TV operation Canal Plus
(through its subsidiary
StudioCanal) is extending its theatrical distribution structures by acquiring Bac Films in France and
Tobis in Germany. Working still in partnership in Belgium and in the UK (with Pathé), they are
building the nucleus of a pan-European network. Kinowelt is also developing a new structure with its
Canadian partner Alliance Atlantis, but more in the direction of Eastern Europe. This trend to the
emergence of few pan-European networks is going with a tendency to more vertical integration to
either the production side (to guarantee product) or to the exhibition side (to build a platform for their
product).
The domination of the American films in Europe is striking when considering the evolution of the
market share
of the national, European non-national and American films in the EU. Table 8 gives an
overview in the various member states. In 1998, the market share of American films was above 60%
within the EU. The share of national films decreased in most of the European countries, with the
exception of France, Spain and the UK, while the market share of national film stabilised in Italy
during the nineties. In most countries, the year 1992 (and 1993) marks the low point in the
performance of European films in cinemas.
Table 8: Market share of films in the EU (1986, 1992, 1998)
Market share of national
films
Market share of
European non-national
films
Market share of
American films
1986 1992 1998 1986 1992 1998 1986 1992 1998
Belgium
0.8
5
0.5
21.6 11.4 27.4 59.2 69.3 70.9
Denmark
21.4 15.3 14.4 11.5 3.5
10.6
64.8
77.7 74.1
Finland
1
22.7 10.9 5.6 n.a.
n.a.
19.7 n.a. 63 73.1
France
43.7
35
38 10.3 4.1 7.2 43.3 58.2 67.1
Germany
22.1
9.5 8.1 11.8 5.4 6.3 62.5 82.8 85.4
Greece
n.a.
2 n.a.
n.a. n.a. n.a. n.a. 92 n.a.
Ireland
n.a.
2 n.a.
n.a. n.a. n.a. n.a. 91.5 n.a.
Italy
31.6
24.4 24.7
14.6 14.2 10.9 51.3 59.4 63.8
Luxembourg
n.a. 0
0.5
n.a.
21
17.7
n.a.
78
80.7
Netherlands
14.2 13 6.1 5.6
n.a.
4.3
78.6
78.8
88.7
Portugal
n.a. 2
6.9
n.a.
n.a.
20.7
n.a.
68.4
68.5
Spain
12.4 9.3 12 n.a
13.1
8.7 65
77.1
78.5
Sweden
17.6 17 16 n.a
7.6
n.a.
n.a
73.6
n.a.
UK
n.a.
6.8 14.1 n.a. 1.5 1.7 n.a. 90.6 83.9
Source: European Audiovisual Observatory (1996, 2000)
1. Finland: data for 1986, 1992, 1997; 2. Ireland: data for 1986 and1991
First estimation
of the market share of films (in terms of admissions) in function of their origin in the
EU for 2000 confirms the dominant position of American films achieving a market share equal to
73.7%. French films achieve a market share equal to 7.8%, for respectively a market share of 6.7% for
UK films, 2.4% for German films and 1.9% for Italian films. The market of European films is around
22.5%, a net decrease compared to 1999 (29.2%). In other words, national films have performed less
well on their national market, and the circulation of European films outside of their national markets
has been lower (26% of estimated admissions of European films outside of their national markets in
2000 compared to 40% in 1999).
Figure 11 describes the evolution of the respective market share of films in the five major European
countries. The German and UK markets are dominated by US films, while Italy and France have
preserved a more balanced sharing between national and American films. The UK market is
characterized by the recovery of national production, gaining substantial market share since 1993.
79
Screen Digest (2000b)
80
Future development of this strategy is subject to the final outcome of the merger between Vivendi and Seagram Company Ltd, owner of
Universal Studio Inc.
81
Depending on the countries the market share is based on the market share of gross box-office (BE, DK, SP, FI, UK, IT, US), on the
market share of distributor's turnover (UK (1988-1992)) and on the market share of admissions (FR, IRL, LUX, NL, PT, SW).
82
European Audiovisual Observatory (2001)
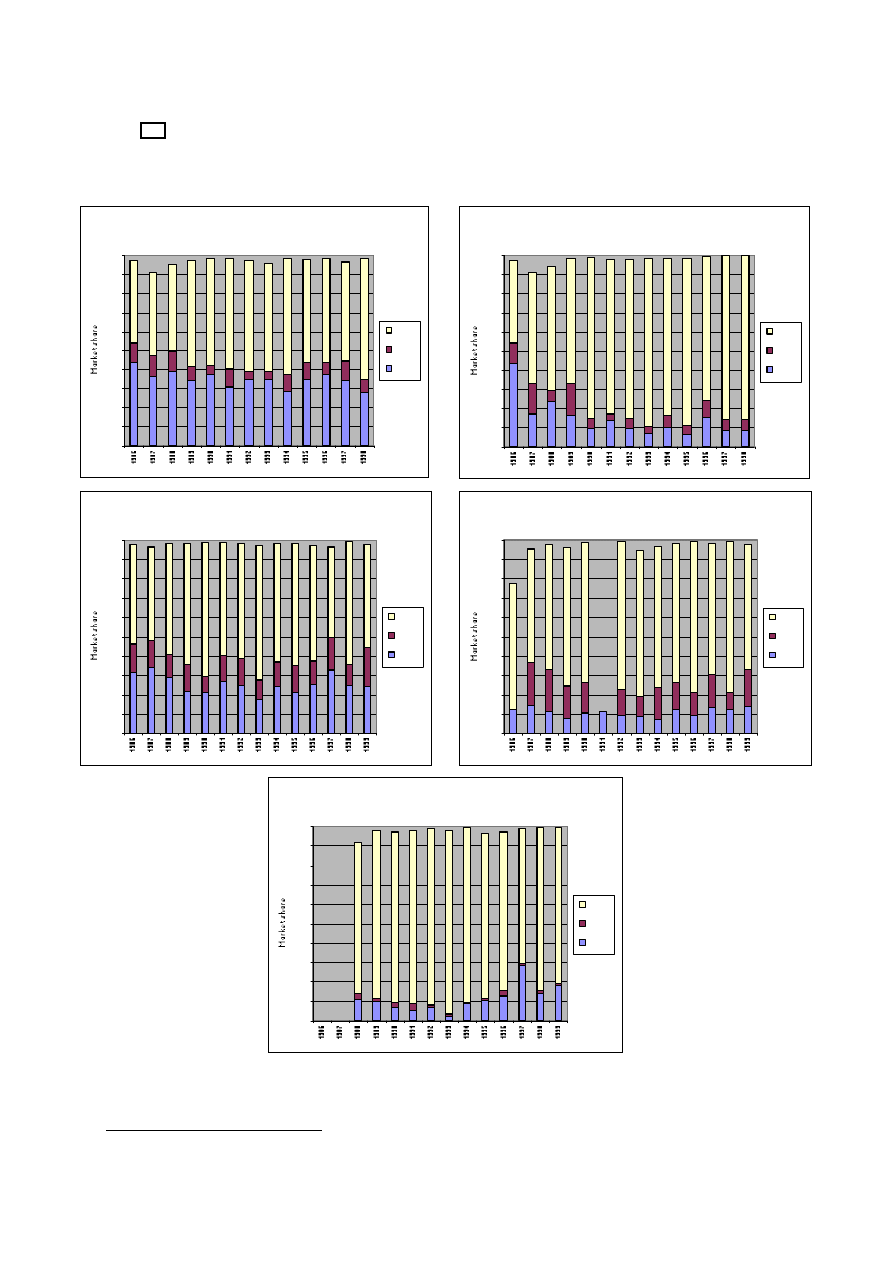
The European Audiovisual Industry: an Overview
O. Debande & G. Chetrit – 07/09/01 – Final version
44
Considering the market share of non-national European films, it appears that European films travel
little
within the EU, with the exception of the small multi-lingual countries (Luxembourg and
Belgium) and to some extent the Nordic market.
Figure 11: Market share of feature-films by origin in the five major European countries
France 1986-1998
0
10
20
30
40
50
60
70
80
90
100
US
NNE
Na t.
Ge rmany 1986-1998
0
10
20
30
40
50
60
70
80
90
100
US
NNE
Na t.
Italy 1986-1999
0
10
20
30
40
50
60
70
80
90
100
US
NNE
Na t.
Spain 1986-1999
0
10
20
30
40
50
60
70
80
90
100
US
NNE
Na t.
UK 1986-1999
0
10
20
30
40
50
60
70
80
90
100
US
NNE
Na t.
Source: European Audiovisual Observatory (2000)
83
See also Appendix describing the first time films released in cinemas by origin, in the five major European markets.

The European Audiovisual Industry: an Overview
O. Debande & G. Chetrit – 07/09/01 – Final version
45
As already mentioned, the domination of the US product rests on the strength and size of its domestic
market given the cost structure of the film industry, i.e. the existence of competitive benefits
associated with the language and the ability to write off films on the national market that will be
exported, and by structural weaknesses in the European film industry, especially at the distribution
level. In addition, the US film industry is structured around the existence of integrated groups
developing a world-wide distribution strategy (Warner, Paramount, Fox, etc.), having created barriers
to entry in this segment of the market. Finally, the US companies invest a significant proportion of the
film’s total cost in promotion and marketing. Indeed, promotion is becoming a key factor for success:
if attendance results are not good in the first few days after release, operators will not hesitate to
remove a film from the schedule at the end of the first week given the large number of films available
every week. As a consequence, films must be able of reaching very quickly a substantial market
share. Considering only member companies of the MPAA
, the average marketing costs of a new
feature film (Print & Advertising costs) are around USD 27.31 M in 2000, for an average negative
costs
of USD 54.8 M., both types of costs having increased at around 9% per year since 1980 (see
Appendix 1, Table C). In other words, promotion and marketing costs accounted for around 50% of
the negative costs, or 33% of the total production costs. In Europe, promotion and advertising account
for 6 to 10% of the total costs
.
The comparison within the EU between the supply structure (assessed in terms of number of film
being distributed in at least one Member State) and the demand structure (in terms of market shares by
origin of the films) as described in Table 9 shows the contrast between European and US films: while
US films only account for around 38% to 46% of the supply, they obtain between 66% and 76% of the
total admissions. On the contrary, films produced in the EU account for 45 to 53% of the supply but
only achieve a market share of 22 to 33%.
Table 9: Demand and supply of films in the EU by origin of production
1996
1997
1998
1999
Breakdown of films released in the EU by origin of production
Films EU-15
46% 46% 51% 51%
Others European
2% 2% 2% 3%
US films
45% 45% 40% 38%
Others
7% 7% 6% 8%
Breakdown of admissions in the EU by origin of production
Films EU-15
26% 32% 22% 29%
Others European
0% 0% 0% 0%
US films
72% 66% 77% 69%
Others
2% 2% 1% 2%
Source: Lange (2001)
Finally, it is interesting to compare the relationship between the production and distribution of films.
On average between 1996 and 1999, the percentage of films distributed in the EU compared to the
films produced in the EU the same year is around 75%, which could mean that around one film in four
is not commercially distributed in cinema
. Among the number of films produced in the US, around
one film in two is shown in European cinemas.
84
MPAA (2001)
85
The negative costs correspond to all of the various costs, charges, and expenses incurred in the acquisition and production of a film. These
include such items as facilities (sound stage, film lab, editing room, etc) and raw material (set construction, raw film stock, etc). Typically
segregated as above-the-line production-period costs (i.e., production costs related to acquiring the story rights and screen play and signing
the producer, director, and major members of the cast) and post-production-period costs.
86
See for instance, the “Rapport Goudineau (2000)”.
87
European Audiovisual Observatory (2001)
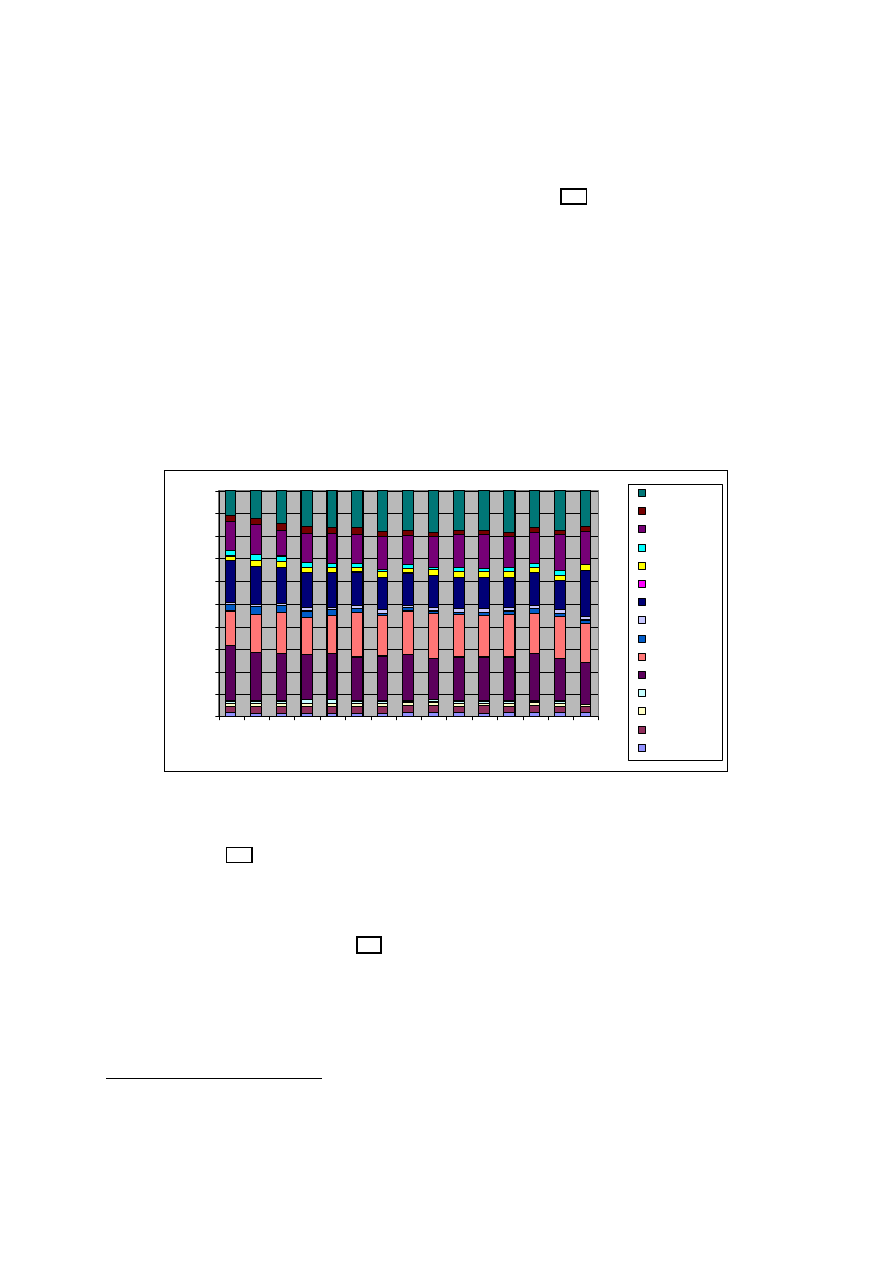
The European Audiovisual Industry: an Overview
O. Debande & G. Chetrit – 07/09/01 – Final version
46
4.1.3. Exhibitions
Admissions and multiplex cinemas
In the EU, the recent evolution of cinema attendance has been stimulated by the modernisation
programme in cinemas and by the creation of multi and megaplexes
. As described in Figure 12,
attendance in Europe has experienced a recovery since 1993, after reaching its lowest point in 1992
with 583 million admissions. Audience has been growing rapidly in UK, Spain, Germany (as well as
in Luxembourg and in Ireland). France remains the most important market but the gap has been
decreasing with respect to Germany, UK and Spain.
The European market is still only slightly above half the size of the American market (see Appendix 1,
Figure B) even through the European population is 38% larger than the US one. Average annual
cinema-going in the EU is 2.2 admission per person versus 5.4 in the US (see Appendix 1, Figure C),
although this difference cannot be explained only for structural reasons (even if the fast development
of new support for audiovisual product in the US market has sustained the demand for new content,
especially new films, showing a complementary rather than substitution effect between cinema
attendance and new digital support).
Figure 12: Evolution of cinema attendance in the EU – 1986-2000
0%
10%
20%
30%
40%
50%
60%
70%
80%
90%
100%
1
9
8
6
1
9
8
7
1
9
8
8
1
9
8
9
1
9
9
0
1
9
9
1
1
9
9
2
1
9
9
3
1
9
9
4
1
9
9
5
1
9
9
6
1
9
9
7
1
9
9
8
1
9
9
9
2
0
0
0
UK
Sweden
Spain
Portugal
Netherlands
Luxembourg
Italy
Ireland
Greece
Germany
France
Finland
Denmark
Belgium
Austria
Source: European Audiovisual Observatory (1996, 2000, 2001)
Over the period 1986-2000, total admission increased by 1.5% in the EU from 641.4 million to 844
million (compared a growth of 2.4% in the US over the same period, noting that total admissions
decreased since 1998 reaching 1,421 billion admissions in 2000), and by 1.6% in the five major
European markets
.
As described in Figure 13, attendances in the five major European countries increased over the last
years, showing signs of recovery in France and Italy and sustained growth in the other markets.
Admission in the five major European countries is expected to increase by 2.3% p.a. between 2000
and 2010, compared to 1.5% in the US
.
Market concentration defined as the cumulative market share of the Top 20 films has decreased in
2000 compared to 1998, i.e. the year of Titanic, considered as an exceptional year: 46.9% in the UK
compared to 50%, 42.6% in France compared to 51.7%, 40.3% in Italy compared to 50.9%, 36.4% in
Germany compared to 48.5%, 33% in Spain compared to 43.3%, and 36.4% in the US compared to
42.7%.
88
Multiplex cinemas are usually defined as cinema theatres with 8 or more screens, megaplex cinemas corresponding to infrastructure with
16 or more screens (Media Salles 2000).
89
At the world level, France is the fourth cinema market in terms of admission, Germany the sixth one, UK the seventh one, Spain the ninth
one and Italy the tenth one.
90
Baskerville Communications Corporation (2000).

The European Audiovisual Industry: an Overview
O. Debande & G. Chetrit – 07/09/01 – Final version
47
Figure 13: Evolution of cinema attendance in the five major European countries – 1986-2000
0
20
40
60
80
100
120
140
160
180
19
86
19
87
19
88
19
89
19
90
19
91
19
92
19
93
19
94
19
95
19
96
19
97
19
98
19
99
20
00
France
Germany
Italy
Spain
UK
Source: European Audiovisual Observatory (1996, 2000, 2001)
In 1999 in the EU, there were 10,184 cinema sites and 24,239 screens, amounting for an average of
2,4 screens per cinema in total (compared to 3.7 screens per cinema in the US). An overall picture of
the infrastructure available in the member states is provided in Table 10. The number of screens per
inhabitant in 1999 was around 6,5 in average in the EU compared to 13,6 in the US (see Appendix).
The recovery of the cinema sector was probably triggered by the modernisation of cinemas and the
spread of multiplex/megaplex cinemas
. Between 1994 and 2000, the number of multiplex cinemas
created mainly in the outlying areas of towns and cities has increased by 22% p.a., from 150 sites to
505 sites in the EU
. At the same time, the number of cinema sites has decreased by 1.2% p.a.
between 1995 and 1998.
Table 10: Cinema and multiplex in the EU – sites, screens and admissions
Number
of
cinema
sites
(1999)
Number
of
screens
(1999)
Screens
per
cinema
Screens
per
100,000
inhabitants
Number of
multiplex
sites (1/1/00)
Number of
multiplex
screens
(1/1/00)
Share of
admission in
multiplex(%)
Austria
234
503
2.1
6.2
15
145
n.a.
Belgium
135
492
3.6
4.8
16
214
73.3
Denmark
164
331
2.0
6.2
2
26
16.6
Finland
237
362
1.5
7.0
3
34
30.1
France
2,163 4,971
2.3
8.4
93
1072
35.7
Germany
1,768 4,651
2.6
5.7
87
841
34.4
Greece
322
380
1.2
3.6
4
47
n.a.
Ireland
72
280
3.9
7.5
9
99
n.a.
Italy
2,259 4,057
1.8
7.0
12
125
n.a.
Luxembourg
8
21
2.6
4.9
1
10
80.9
Netherlands
183
461
2.5
2.9
4
33
10.0
Portugal
258
427
1.7
4.3
7
78
n.a.
Spain
815
3,354
4.1
8.5
104
1068
32.3
Sweden
815
1,123
1.4 12.7 15 145
39.6
UK
751
2,826
3.8 4.8 133
1420
n.a.
EU
10,523
1
24,239
2.2
1
6.5
505 4,967
n.a.
US
7,551 37,185
4.9
13.6
1,478 n.a.
n.a.
1. Data for 1998
Source: European Audiovisual Observatory (2000), MEDIA Salles (2000), MPAA(2001).
91
See Delon F., Marchand J.-R. and Thibout J. (2000) for an analysis of the French market
92
Eurostat (2000) and MEDIA Salles (2000)

The European Audiovisual Industry: an Overview
O. Debande & G. Chetrit – 07/09/01 – Final version
48
The market share of multiplex cinemas is increasing over the years and since multiplex cinemas
mainly show American films, this could affect independent cinemas that schedule European films.
This market is dominated by American and Australian exhibitors (see Table 11) which have
concentrated their effort on expanding European market.
Table 11: 15 world-leading exhibitors by latest annual turnover (in EUR m)
Country
Year to
1995
1996
1997
1998
1999 % p.a.
AMC Entertainment
US Mar
430,42 518,21 663,12 759,08 960,35 22.2
Regal Cinemas
US Dec
236,24 307,93 426,79 630,64 972,54 42.4
Loews Cineplex
US Feb
262,23 282,73 330,68 369,28 798,10 32.1
Cinemark
US Dec
228,59 269,34 383,58 509,33 668,68 30.8
United Artists Theaters
US Dec
495,41 532,39 602,27 589,60 591,78 4.5
Carmike
US Dec
279,05 336,29 404,75 429,94 456,73 13.1
General Cinemas
US Oct
349,68 392,40 363,04
362,01
1.2
Hoyts
Aus Jun
205,55 253,96 279,19 16.5
Gaumont
Fr Dec
114,98 196,64 187,32 214,77 23.2
Village Roadshow
Aus Jun
99,90
181,94
82.1
Odeon
UK Dec
161,45
Greater Union
Aus Jun
118,16 127,55
154,74
14.4
Ufa Theater
Ger
120,50 138,44 146,29 10.2
CinemaxX
Ger Jun
48,04 69,66 82,95 111,60 32.4
Pathe
Fr
52,75
75,61 100,53 112,39
28.7
Source: Screen Digest (2000e)
This market will be confronted with a wave of consolidation/restructuring which has already started,
e.g. the merger of Germany’s largest two exhibitors Ufa Theater and CinemaxX.
The major exhibitors have been engaged in significant investment to build new multiplex cinemas and
megaplexes in order to gain some competitive advantages. As a consequence, these companies have
incurred a high level of debt and the result of this strategy has been a big loss for the sector as a whole.
This feature is reflected in the evolution of admissions and revenues per screen both in the US and in
the EU. Part of the funds channeled in the multiplex cinemas was coming from American companies
anticipating audience demand. In addition, American majors were using the block booking approach
enabling them to sell a package of film including blockbuster and cheaper films of lower quality.
In addition, the cost associated with the introduction of digital cinema (or e-cinema) technology
generates new uncertainties. While digital cinema is expected to be beneficial to the sector both in
terms of cost savings and new business opportunities, most exhibitors are not in a financial situation
making them able to support the required investment for its implementation.
The major exhibitors have tried to consolidate their position in the market which could lead to a
reduction of the number of theatres (if not the number of screens) reflecting the
restructuring/rationalisation process in progress.
Table 12 describes the concentration in the European exhibition market. The level of concentration is
quite significant while the existence of a few pan-European exhibition networks is the slowly
emerging. Comparing this table with the one for the distribution market, it appears that the level of
vertical integration in the distribution and exhibition market segment depends on the country
considered. It reflects the choice of a specific business model by the different players.
93
Block booking was one contracting practice used by studio distributors as well as blind selling where in order to cut the lead time needed
to arrange exhibitions, exhibitors were pressed to commit to exhibiting a film before it was completed and available for viewing. Those
practices were ruled out after the Paramount directive. See Caves (2000), Hansen (2000) and Kenney and Klein (1983, 2000)

The European Audiovisual Industry: an Overview
O. Debande & G. Chetrit – 07/09/01 – Final version
49
Table 12: Concentration in cinema exhibition in 1999
Country
Companies
Screens
Admissions
Gross Box Office
Austria
Constantin/Citycinema/UCI n.a.
n.a.
n.a.
Belgium
Kinepolis Group/UGC Belgique/Groupe
Carpentier
35.6% 65.0%
n.a.
Denmark
Nordisk/Scala-Dagmar/Biografkompagniet 34.4%
53.1% 49.3%
Finland
Finnkino OY/Sandrew-Metronome/Savon Kinot
OY
33.4% 66.2%
67.8%
France
UGC/Gaumont/Pathé 22.9%
42.4%
n.a.
Germany
1
Ufa/H.-J. Flebbe Filmtheater
GmbH/Filmtheaterbetriebe Kieft
20.7% n.a.
n.a.
Ireland
Ward Anderson/UCI/Ster Century
57.9%
n.a.
n.a.
Italy
1
De Pedys/Cinema 5 Gestione/Cecchi Gori
10.6%
n.a.
n.a.
Luxembourg
Utopia SA/CDAC/Caramba
100%
100%
100%
Netherlands
Pathé/Jogchem’s/Wolff 44%
62.7%
64.2%
Portugal
Warner Lusomundo/Lusomondo Audiovisuais
S.A./Medeia
18.7% n.a.
n.a.
Spain
Unión Cine Ciudad/Acec/Yelmo Cineplex
19.7%
n.a.
n.a.
Sweden
AB Svensk Filmindustri/Sandrew Film AB/HB
Svenska Bio Lidingö-Boras Biogr.
29.1% 76.1%
79.1%
UK
Civen ( ex Odeon Cinemas)/UCI/UGC (ex Virgin
Cinemas)
38.7% n.a.
n.a.
Source: MEDIA Salles (1999, 2000)
1. Data for 1998.
Even if the trend is more evident in the US and in the UK, the average number of admissions per
screen has fallen between 1990 and 1999 as described in Figure 14. It reflects the launch of screen
building programme on a massive scale, implying that the incentive to build new multiplex cinemas
will start to decrease.
Figure 14: Evolution of admissions per screen in the EU and in the US
0
10 000
20 000
30 000
40 000
50 000
60 000
70 000
80 000
19
86
19
87
19
88
19
89
19
90
19
91
19
92
19
93
19
94
19
95
19
96
19
97
19
98
19
99
A
d
m
issi
o
n
s p
e
r
sc
re
e
n
France
Germany
Italy
Spain
UK
EU
US
Source: European Audiovisual Observatory (1996, 2000)
Various exhibitors are still planning to build new multiplex cinemas. In France, around 73 multiplex
cinemas have been approved by local authorities
, reflecting the entry of new players (Village
Roadshow and AMC Cinemas) and the development plan of Pathé, Gaumont and UGC as well as Bac
Films. At the same time, to sustain the demand for multiplex cinemas admissions, exhibitors are
trying to develop new marketing strategies, e.g. UGC introducing a monthly subscription cards
allowing holders to visit UGC cinemas as often as they like for a fixed monthly price. In Germany,
94
Screen Digest (2000d)

The European Audiovisual Industry: an Overview
O. Debande & G. Chetrit – 07/09/01 – Final version
50
the number of creation of multiplex cinemas was sustained between 1997 and 1999, generating
additional capacity for 10 to 15 millions of admissions but yet only a fraction of this additional market
has been realized. In addition, some form of crowding-out appears between old and new multiplex
cinemas. Although the construction of new multiplex cinemas is planned by Spean Bridge and
Cinemark. In Italy, the market has been moving at a slow pace. Compared with the rest of Europe,
the pace of multiplex cinemas development has been limited due to restrictive planning laws at the
local level, especially in cities like Rome. The trend is now changing: at least 500 to 600 multiplex
cinemas screen are currently planned by operators like Warner Village, UCI, Kinepolis and local
players (Medusa, de Maurentiis in partnership with Loews, VIS in partnership with Pathé, Mediaport
in partnership with Kieft & Kieft). To sustain the recovery of admissions in Italy, major distributors
UIP and Warner Bros are trying to push a reform aiming to modernize the market avoiding the
seasonal summer shutdown. The opening of the summer box office should favour the release and
marketing of major titles during this currently ‘closed’ period. In Spain, the market has been growing
rapidly, sustained by the increase in the number of screens – a growth of 13% p.a. between 1995 and
1999. The record admission increase (8.5% p.a. between 1995 and 1999) has been achieved partially
thanks to the creation of megaplexes cinemas by AMC and Kinepolis in Madrid and Barcelona.
Further sites are planned in other Spanish regions. The local operator Yelmo is working in partnership
with Cineplex Odeon to modernize and expand its network of screens. Finally, in the UK, a large
increase in the number of screens has been observed (around 9% p.a. between 1995 and 1999),
matching the strong recovery of the market in terms of admissions (around 5% p.a. between 1995 and
1999). Although as described in Figure, the UK has still the highest per-screen admissions in Europe
by a good margin, a strong decrease has been observed during the last two years amounting for a
decrease of more than 10,000 admissions per screen in five years. The UK exhibition landscape has
been affected by two major events: Virgin group, ending its five-year involvement in cinemas by
selling its 34 multiplex cinemas to UGC and the selling of Odeon Cinema – the largest UK chain with
464 screens in 75 cinemas – to the private investment venture Cinven, allowing Cinven to control
around 25% of the UK market. Expansion plans have been developed by UGC and Cinemark for the
UK market while the Australian Roadshow has decided to quit the UK market (but will still implement
its Warner Village joint venture with Warner Bros International Theatres).
As stressed by Screen Digest (2000d), “while the aggressiveness and over-exuberance of some global
cinema chains has left some markets overbuilt and somewhat ‘fragile’ (in terms of recouping
investment), it is clear that the supply of good quality ‘blockbuster’ product – on which all filmed
entertainment markets, not only cinema is utterly dependent – has not matched the breathtaking pace
of the multiplex building boom”. Despite the planning of additional multiplex cinemas in various
European countries, this segment of the market has reached saturation and over-capacity (including the
investment planned over the next years) is now an evidence in various European countries (Germany,
the UK, France, Belgium and Spain) resulting also from competition in some towns where several
multiplex cinemas were competing for a public, which although growing is nonetheless limited.
Gross box-office and ticket price
In parallel to the increase in admissions (essentially until 1998
), box office revenues were increasing
since 1993, amounting for EUR 4,152 billion in 1999
96
as shown in Table 13. In the US, the 1999
result has been pushed by the increased ticket price, while admissions has decreased compared to
1998. In 2000, gross box office revenues in the US have continued to grow to reach USD 7.7 billion,
an increase of around 4%.
Considering the evolution of the gross box office per head and per screen in the EU between 1995 and
1999, both indicators have increased by respectively 8.2% p.a. and 3.7% p.a., compared to 13.8% and
6.8% in the US. The dynamism of the cinema market has been particularly sustained in Germany, the
UK and Spain, while France and Italy recording a less strong growth. In France, Germany and Italy,
gross box office receipts decreased in 1999 compared to 1998, reflecting the effect of the Titanic
95
The performance recorded for 1998 were affected by the “Titanic” effect in the EU and by “Le Dîner des Cons”, “Les couloirs du temps –
Les Visiteurs 2” and “Taxi” for the French market.
96
MEDIA Salles (2000).
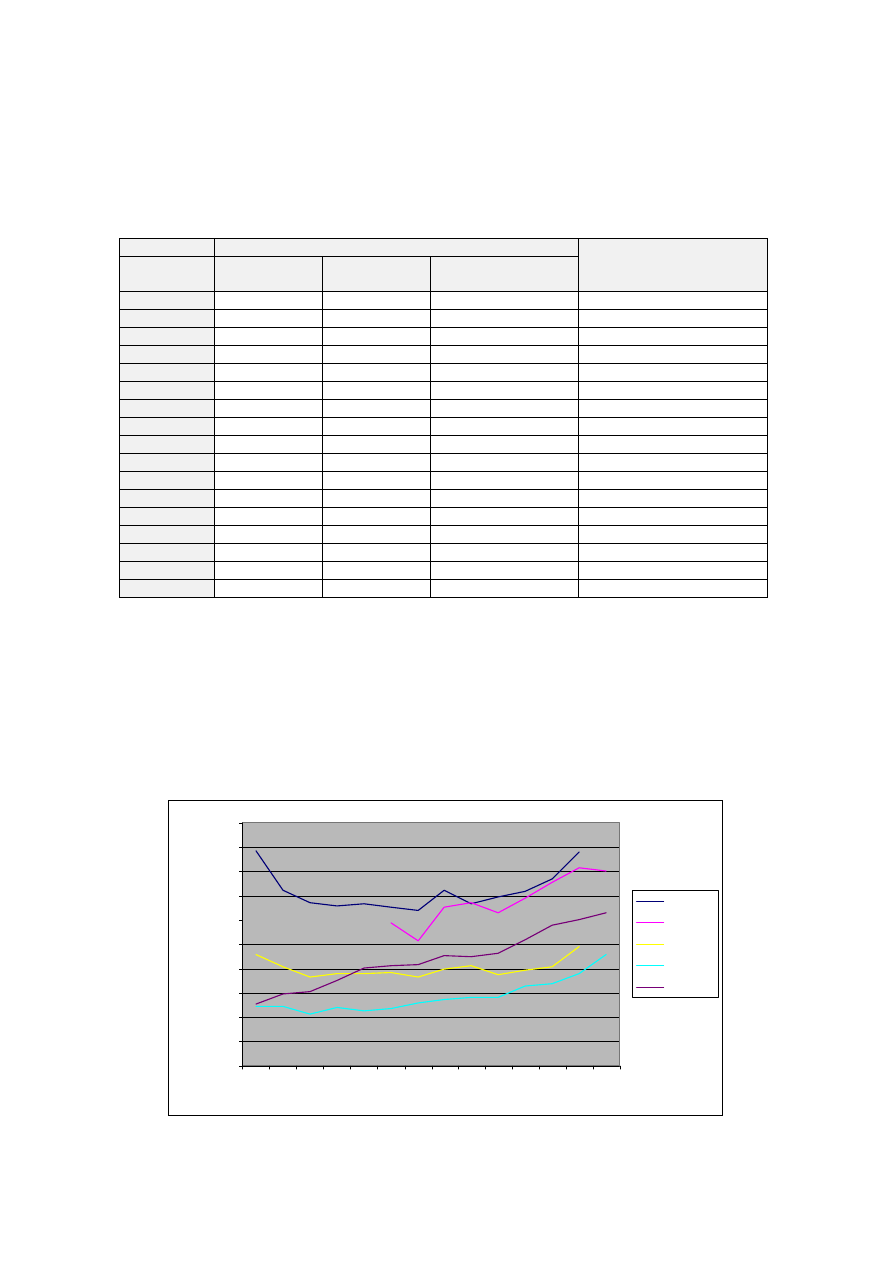
The European Audiovisual Industry: an Overview
O. Debande & G. Chetrit – 07/09/01 – Final version
51
boom. In Germany, this situation partially resulted from the decrease in the average ticket price (the
rise of the ‘one Euro ticket price’ cinemas coming with the reluctance of the multiplex cinemas to raise
their prices in the face of such a competition). In France and in Italy, the poor result came from a
decrease in admission in 1999, partially compensated in Italy by the strong increase in the average
ticket price.
Table 13: Gross box office and average ticket price in 1999
Gross box office
Total
(EUR, x1,000)
Per head
(EUR)
Per screen (EUR,
x1000)
Average ticket price (EUR)
Austria
87,280 10.8
173.5
5.8
Belgium
113,861 11.1
213.4
5.2
Denmark
71,942 13.5
217.3
6.6
Finland
45,407 8.8
125.4
6.4
France
834,831 14.2
167.9
5.4
Germany
808,120 9.8
173.7
5.4
Greece
1
61,410 5.8
192.5
4.9
Ireland
59,551 16.0
212.7
4.9
Italy
516,811 9.0
127.4
5.2
Luxembourg
7,336 17.1
349.3
5.6
Netherlands
104,681 6.6
201.7
5.6
Portugal
2
32,824 3.3
101.6
2.6
Spain
495,859 12.6
147.8
3.8
Sweden
123,147 13.9
109.7
7.7
UK
883,595 14.9
312.7
6.3
EU
4,152,421 11.1
171.3
5.4
US
7,391,000 27.1
198.8
5.0
Source: MEDIA Salles (2000)
1. Data for 1998 ; 2. Data for 1996
When dividing the gross box office receipts by the population, it appears that EU citizens spend on
average EUR 11.1 per year while the average American spends more than twice the amount (i.e., EUR
27 per year). Important disparities exist among member states while inhabitants from Luxembourg,
the UK, Ireland the Nordic countries, France are spending more than the European average, the gap
between Portugal and Luxembourg in terms of cinema expenditure per head being substantial.
Figure 15 describes the evolution of real gross box-office in the major European markets.
Figure 15: Evolution of gross box-office for the main European markets
0
100
200
300
400
500
600
700
800
900
1000
19
86
19
87
19
88
19
89
19
90
19
91
19
92
19
93
19
94
19
95
19
96
19
97
19
98
19
99
(E
U
R
M
il
li
o
n -
C
o
n
st
a
nt
p
ri
c
e
s,
19
95
)
France
Germany
Italy
Spain
UK
Source: European Audiovisual Observatory (1996, 200), Eurostat (2000)
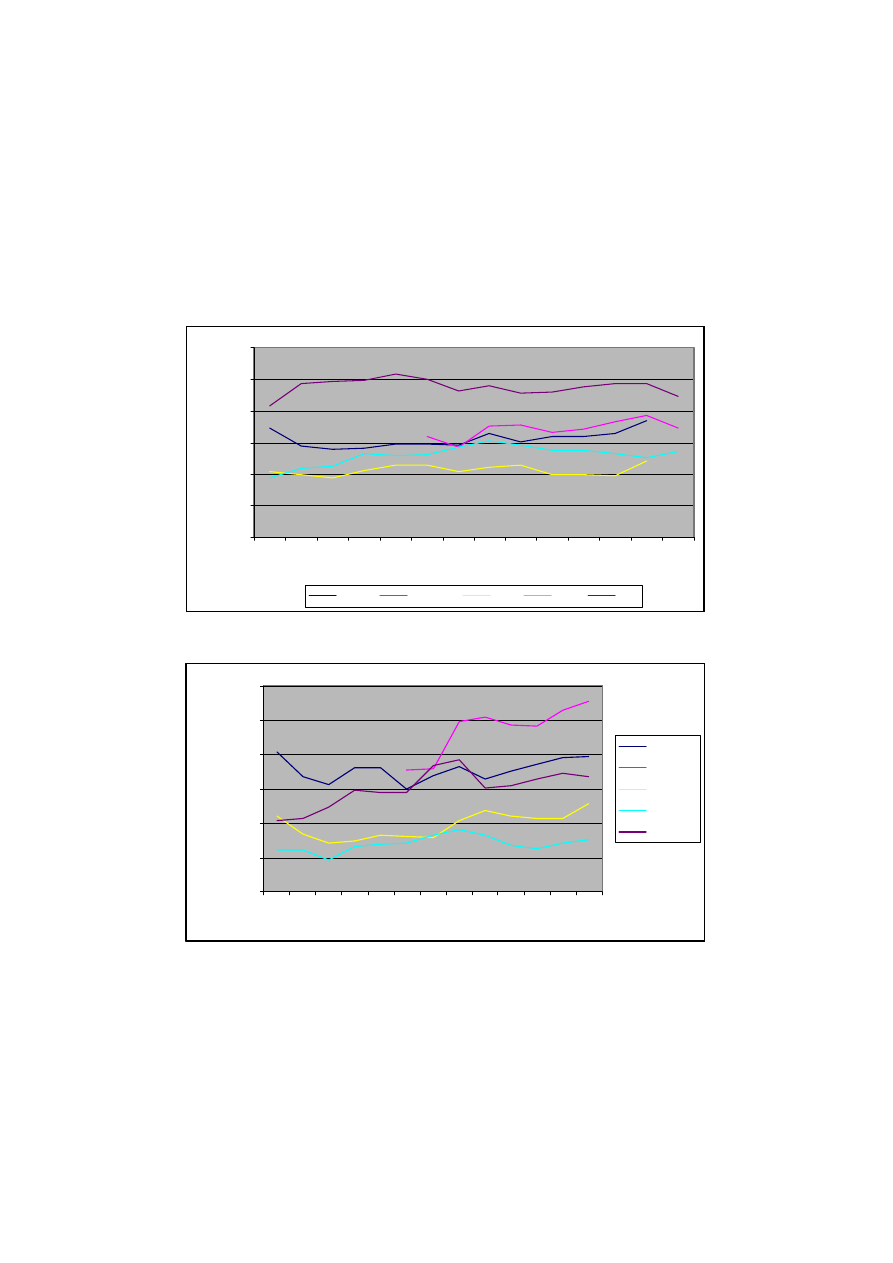
The European Audiovisual Industry: an Overview
O. Debande & G. Chetrit – 07/09/01 – Final version
52
Over the last years, the increase in box-office revenues have been quite substantial in all countries,
France recording an important recovery.
To complete the analysis of the box-office evolution, Figures 16 and 17 describe the trend in terms of
box-office per screen and of box-office per film produced. The decline of the revenue generated by
screen in Germany and in the UK reflects the important increase in multiplex cinemas having led to a
substantial increase in the number of screens. The UK is the country recording the best performance
while Italy is showing positive sign of recovery since the late nineties. Considering the evolution of
the revenue generated by film released, there is a positive trend of increased revenue generated by film
released (without any distinction about the origin of the film released).
Figure 16: Evolution of revenues per screen
0
50
100
150
200
250
300
19
86
19
87
19
88
19
89
19
90
19
91
19
92
19
93
19
94
19
95
19
96
19
97
19
98
19
99
E
U
R
O
C
o
ns
ta
nt
p
ri
ce
s,
x 1,
000
France
Germany
It aly
Spain
UK
Figure 17: Evolution of revenues per film produced
0
500
1,000
1,500
2,000
2,500
3,000
19
86
19
87
19
88
19
89
19
90
19
91
19
92
19
93
19
94
19
95
19
96
19
97
19
98
E
U
R
O
c
o
n
st
a
nt
pr
ic
e
s,
x
1,
00
0
France
Germany
Italy
Spain
UK
Source: European Audiovisual Observatory (1996, 2000)
Germany appears to perform quite well. In France, even if they release a high number of films per
year, they are able to maintain the revenue per film. As already discussed, this evolution could hide
very different structural patterns, e.g. box-office revenues are affected by an upward trend in either
admission or ticket price. The expansion of video and pay television has also played an important part
in the recovery. Although initially regarded as being in competition with cinemas, the growth of these
markets, based partly on the attraction of successful films in cinemas, has contributed to the film-
going culture and public interest in the cinema, stimulating demand for high quality feature films.
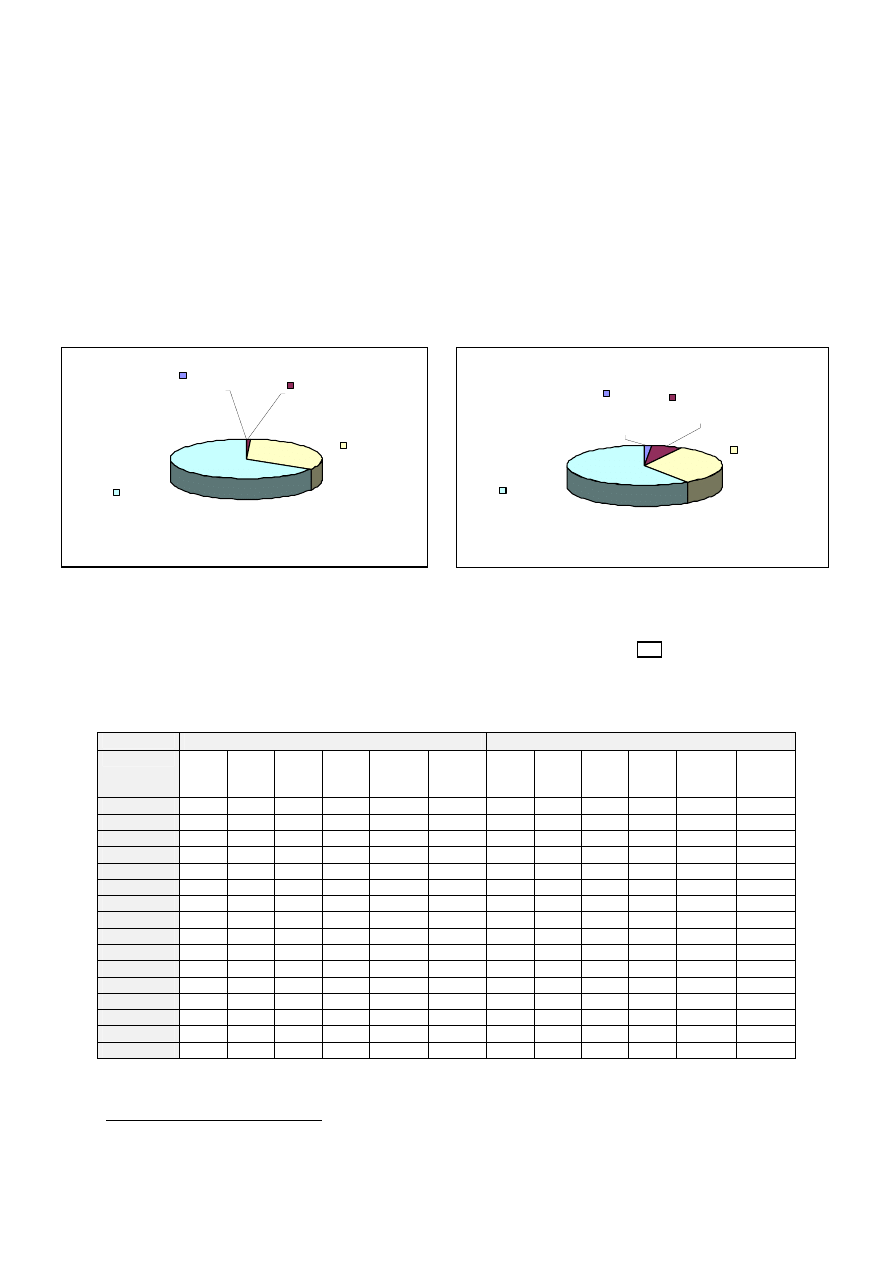
The European Audiovisual Industry: an Overview
O. Debande & G. Chetrit – 07/09/01 – Final version
53
4.1.4. The Video/DVD industry
Although the size of the European video software market, i.e. the video and DVD markets (sales and
rentals), has been relatively stable in 1998 and 1999 (i.e. a turnover estimated at EUR 6,02 billion in
1998 and EUR 6,08 billion in 1998), this market is facing important reorientation of the activities from
video to DVD. Indeed, as described in Figure 18, while DVD accounted for less than 1% of turnover
in 1998, this share increased to around 8% in 1999, reflecting the take-up of DVD hardware and the
sustained activity in the DVD markets as illustrated by the number of titles released on DVD which
has increased by 277% between 1998 and 1999 on average at the European level (from 162 average
DVD titles released in 1998 to 610 in 1999).
Figure 18: Turnover of the video software in the EU*
Turnover of video software in 1998
Turnover of video software in 1999
Video sales
66.31%
DVD
rentals
0.01%
DVD sales
0.79%
Video
rentals
32.88%
Video sales
59.34%
Video
rentals
32.88%
DVD sales
6.30%
DVD
rentals
1.48%
Source: Screen Digest/IVF (2000)
*: Luxembourg not included
The major part of the revenues generated by this market is still coming from the video segment. This
market segment is characterized by a stabilisation of the share of video rentals, the growth of the DVD
segment coming from a reduction in the turnover generated by the sales of video
.
This evolution of the video market is clearly depicted in Table 14.
Table 14: Pre-recorded video retail turnover (in EUR million)
Video sales
Video rentals
1993 1998 1999 Per
capita
(1999)
∆
(93/99)
∆
(98/99)
1993 1998 1999 Per
capita
(1999)
∆
(93-99)
∆
(98-99)
Austria
27 57 53 6.6
11.9%
-7.0% 22 31 25 3.1 2.2%
-19.4%
Belgium
76
106 93 9.1 3.4%
-12.3% 40 64 67 6.6 9.0% 4.7%
Denmark
53
102 84
15.8 8.0%
-17.6% 65 74 70
13.2 1.2%
-5.4%
Finland
18 45 46 8.9
16.9% 2.2% 20 24 24 4.7 3.1% 0.0%
France
784
1,076
1,030 17.5 4.7% -4.3% 149 189 187 3.2 3.9% -1.1%
Germany
429 494 447 5.4 0.7% -9.5% 382 366 378 4.6 -0.2% 3.3%
Greece
2 7 6
0.6
20.1%
-14.3%
11
12
12
1.1
1.5%
0.0%
Ireland
23 37 33 8.7 6.3%
-11.5% 54 77 75
20.0 5.6%
-2.6%
Italy
45 266 226 3.9 30.9%
-15.0% 98 111 142 2.5 6.4% 27.9%
Netherlands
84
116 98 6.2 2.6%
-15.5% 90 99
103 6.5 2.3% 4.0%
Portugal
24 33 32 3.2 4.9%
-3.0% 26 12 12 1.2
-12.1% 0.0%
Spain
118 178 163 4.1 5.5% -8.4% 105 132 159 4.0 7.2% 20.5%
Sweden
44 84 71 8.0 8.3%
-15.5% 59 78 77 8.7 4.5%
-1.3%
UK
824
1,390
1,228 20.7 6.9%
-11.7% 504 710 669 11.3 4.8% -5.8%
EU-14
2,551 3,991 3,610
9.6
6.0% -9.6% 1,625 1,979 2,000
5.3
3.5%
1.1%
US
4,016 7,746 7,250 26.6 10.3% -6.4% 8,493 8,838 9,384 34.4
1.7%
6.2%
Source: Screen Digest/IVF (2000) and European Audiovisual Observatory (1996)
97
The performance of the market in 1998 has been positively affected by the release of few titles like “Titanic” and other success story like
“The Full Monty” in the UK.

The European Audiovisual Industry: an Overview
O. Debande & G. Chetrit – 07/09/01 – Final version
54
While on average between 1993 and 1999, the growth of the turnover was more important for the sales
of video rather than for the rentals, the recent evolution showed a rapid decrease of the sales market.
Although this trend mimicked the evolution observed in the US market, this latter is characterized by
the dominant position of the rentals market (as in Japan). In addition, the discrepancy between the
European and the US is important both in volume and in terms of amount spent by consumers for
video, i.e. only the UK on the video sales market and to a lower extent the Ireland on the video rentals
market are close to the US’ spend.
Within the European market, around 75% of the turnover on the video sales market and 63% on the
video rentals market is generated by three countries: the UK, France and Germany. The European
citizens spend close to twice the amount on buying videocassettes (EUR 9.6) than on renting it (EUR
5.3). The discrepancies among the various member states is important on both markets: on the sales
market, the UK spend EUR 20.7 per head compared to EUR 0.6 in Greece and on the rentals market,
the Ireland spend EUR 20.0 per head against EUR 1.1 in Greece. In general, the lowest amount of
spending per head is recorded in the Southern countries of the EU.
Expressed in terms of number of video transactions, around 270 million videocassettes were sold in
the EU in 1999, the UK market being the most dynamic one. However considering the video sales per
households equipped with VCR, the gap between the UK and US market is important. In the EU, the
average purchase was 2.3 cassettes per VCR household in 1999. As already explained for the
evolution of the turnover realised on each market; on average the sales of videocassettes has grown
more quickly. Price differences explained the fact that despite a lower number of transactions in the
sales market, the turnover is higher in this market (see Table 18). However, the performance on the
sales market has been affected by the fall in average price, a persistent trend since the beginning of the
1990s. Compared to 1998, the average price has been reduced by 4% in the EU for the sale of
videocassette. Considering the video market by genre
, films accounted for over 50% of the sales in
1999, fluctuating in function of the titles released (especially also in proportion of children’s film
released like Disney productions). It reflects the strong relationship between the cinema and video
market (as well as the DVD market but with the qualification that most of the titles available on DVD
support are films).
Comparing the US and European transaction on the rentals market (see Table 15), it appears that
videocassette rental was nearly seven times as popular in US VCR households in 1999: 39.3 times per
year compared to 5.7 in the EU.
Table 15: Number of video transactions (in million)
Video sales
Video rentals
1993 1998 1999 Per
eq. h.
1
(1999)
∆
(93/99)
∆
(98/99)
1993 1998 1999 Per
eq. h.
1
(1999)
∆
(93-99)
∆
(98-99)
Austria
1.6 4.4 4.0 1.6
16.5% -9.1% 24.0 11.3 9.2 3.6
-14.8% -18.6%
Belgium
4.6 7.9 7.1 2.4 7.5% -10.1% 15.6 23.5
23.4 7.8 7.0% -0.4%
Denmark
4.3 6.2 6.5 3.2 7.1%
4.8% 13.0 22.1 20.7 10.1 8.1%
-6.3%
Finland
1.8 3.8 3.9 2.3
13.8%
2.6% 6.0 9.0 9.0 5.2 7.0%
0.0%
France
31.0
58.5
58.8 3.1
11.3%
0.5% 50.0 57.0
57.0 3.0 2.2%
0.0%
Germany
28.5
43.0
39.8 1.3 5.7% -7.4%
170.0
127.0
129.8 4.1 -4.4%
2.2%
Greece
0.1 0.5 0.5 0.2
30.8%
0.0% 8.1 10.2 9.7 4.5 3.0% -4.9%
Ireland
1.5 3.0 2.8 3.1 11.0%
-6.7% 20.3 28.9 28.0 32.0 5.5%
-3.1%
Italy
20.9
23.5
20.2 1.6
-0.6% -14.0% 53.3 45.0
50.0 3.9 -1.1% 11.1%
Netherlands
6.8 9.5 9.0 1.9 4.8% -5.3% 33.0 35.0
36.0 7.4 1.5%
2.9%
Portugal
1.0 2.5 2.5 1.5
16.5%
0.0% 16.4 7.2 6.0 3.5
-15.4% -16.7%
Spain
8.0
16.0
14.5 1.6
10.4% -9.4% 47.6 73.3
82.5 9.4 9.6% 12.6%
Sweden
3.1 6.3 6.4 1.9
12.8%
1.6% 25.7 20.6
18.0 5.5 -5.8% -12.6%
UK
60.0
99.9
92.0 4.3 7.4% -7.9%
214.0
204.4
188.5 8.8 -2.1% -7.8%
EU-14
173.2
285.0
268.0 2.3 7.5% -6.0%
697.0
674.5
667.8 5.7 -0.7% -1.0%
US
462.5 700.9 n.a.
6.8
8.7%
4473.0 3440.7
n.a. 39.3
-5.1%
Source: Screen Digest/IVF (2000) and European Audiovisual Observatory (1996)
1.. Per equipped household.
98
Screen Digest (2000c).

The European Audiovisual Industry: an Overview
O. Debande & G. Chetrit – 07/09/01 – Final version
55
This situation is observed even if the average rental price for a videocassette in the EU was around
20% lower than in the US. Part of the reason has to be found in the higher density of stores renting
video in the US than in the EU and in different consumer habits.
The DVD market is characterized by an exponential growth as described in the Tables 16 and 17.
Compared to 1998, the revenues generated by the sales of DVD to European DVD households
increased eightfold, while the rental’s revenues grew dramatically (from EUR 0.6 M in 1998 to EUR
90 M in 1999), illustrating the potential for growth of this new format.
Table 16: DVD turnover (in EUR million)
DVD sales
DVD rentals
1998 1999 Per
capita
(1999)
∆
(98/99)
1998 1999
Per
capita
(1999)
∆
(98-99)
Austria
0.4 2.9
0.36
7.3
0.002 0.4 0.05 200.0
Belgium
1.8 17.9
1.75
9.9 0.01
3.9
0.38 390.0
Denmark
2 4.9
0.92
2.5 0.03 0.8 0.15 26.7
Finland
0.5 3.5
0.68
7.0
0.004 0.3 0.06 75.0
France
15.5 128.1
2.17
8.3
0.05
7.4
0.13 148.0
Germany
11.4
59.8
0.73
5.2 0.04 27.7 0.34 692.5
Greece
0.4 1.9
0.18
4.8
0.002 0.2 0.02 100.0
Ireland
0.1 1.8
0.48
18.0 0.01 0.7 0.19 70.0
Italy
3.5 21.7
0.38
6.2 0.01
6.5
0.11 650.0
Netherlands
1.7 14.5
0.92
8.5 0.02
2.8
0.18 140.0
Portugal
0.4 1.5
0.15
3.8
0.002 0.1 0.01 50.0
Spain
3.9 16.8
0.43
4.3 0.05
1.1
0.03 22.0
Sweden
0.9 5.3
0.60
5.9 0.01 1.1 0.12 110.0
UK
5.2 102.5
1.73
19.7
0.35
37
0.62 105.7
EU-14
47.7 383.1
1.02
8.0
0.59
90
0.24 152.5
Source: Screen Digest/IVF (2000)
As for the video market, France, the UK and Germany account for the major part of the European
DVD market, i.e. around 76% of the sales of DVD and 80% of the value of DVD rentals. The
discrepancy in terms of revenues per inhabitant within the EU is quite important: the higher spend on
DVD sales is recorded in France (EUR 2.17) and the lowest spend in Portugal (EUR 0.15) and Greece
(EUR 0.18). The highest spend on renting DVD per capita is observed in the UK (EUR 0.62) while
Greeks ((EUR 0.02), Spaniards (EUR 0.03) and Portuguese (EUR 0.01) spend a very low amount per
capita on DVD rentals.
Table 17: Number of DVD transactions (in million)
DVD sales
DVD rentals
1998
1999
Per eq. h.
1
(1999)
∆
(98/99)
1998
1999
Per eq. h.
1
(1999)
∆
(98-99)
Austria
14 121 7.0
8.6 1 152 8.8
152.0
Belgium
67 689 12.6 10.3 4
1200 22.0
300.0
Denmark
60 183 6.5
3.1 9 231 8.2 25.7
Finland
20 150 11.4
7.5 1 126 9.6
126.0
France
550 4200 11.7
7.6 15 2262
6.3 150.8
Germany
450 2600 10.9
5.8 13 9500 39.7 730.8
Greece
14 77 5.0 5.5 1
165 10.7
165.0
Ireland
5 77
10.0 15.4 2
257 33.3
128.5
Italy
150 1000 13.1
6.7
5 2304 29.4 460.8
Netherlands
60 500 7.3
8.3 6 970 14.1
161.7
Portugal
16 63 5.0 3.9 1 67 5.4
67.0
Spain
162 700 5.6
4.3 27 578 4.6 21.4
Sweden
35 216 7.0
6.2 3 252 8.2 84.0
UK
195 4000 14.4
20.5 102
10440 37.6 102.4
EU-14
1798 14576 11.0
8.1 190 28504
21.5 150.0
Source: Screen Digest/IVF (2000)
1.. Per equipped household.
In 1999, the European DVD households bought 14,6 million DVD discs and rented 28,5 million discs.
The increase in the volume of transactions has been very strong between 1998 and 1999. It is

The European Audiovisual Industry: an Overview
O. Debande & G. Chetrit – 07/09/01 – Final version
56
interesting to note that the amount spent per DVD households on buying DVD (11.0) is significantly
higher than the amount spend by VCR households on buying video cassettes (2.3).
It reflects different consumption habits from DVD households, especially when taking into
consideration the price difference between DVD disc and video cassettes. Indeed, as described in
Table 18, the average European price for a DVD disc (EUR 25) is twice the price for a video cassette
(EUR 12.5) in 1999. The range of DVD disc price dispersion across the Member States is quite large
and there is no correlation between the price level and the number of DVD sales transactions which
could indicate that the level of consumption of DVD is quite insensitive to the price level (resulting
also from the fact that DVD households are probably high-income people with a “stated or loving”
interest for films, music or games).
Table 18: Comparative average price of Video and DVD (in EURO)
1999
Video
DVD
Sales Rentals Sales Rentals
Austria
13.08 2.76
23.93 2.76
Belgium
13.14 2.85
26.03 3.22
Denmark
13.07 3.36
26.76 3.36
Finland
11.77 2.71
23.55 2.71
France
17.53 3.28
30.49 3.28
Germany
11.24 2.91
23.01 2.91
Greece
13.46 1.23
24.57 1.23
Ireland
11.79 2.67
23.45 2.67
Italy
11.19 2.84
21.69 2.84
Netherlands
10.89 2.86
29.04 2.86
Portugal
12.68 2.00
23.94 2.00
Spain
11.27 1.92
24.01 1.92
Sweden
11.15 4.29
24.51 4.29
UK
13.34 3.55
25.64 3.55
Source: Screen Digest/IVF (2000)
The growth recorded between 1998 and 1999 is expected to continue over the next years. In the short
term, the development of the DVD-R, the launch of the PlayStation 2 (a game console including
DVD) and the potential effect of increased competition on retail prices will sustain the expansion of
the market. In the medium term, existing forecasts of the development of the DVD market confirm
the strong growth of this market on the horizon of 2010. The European Audiovisual Observatory
reported forecasts for the growth of the European DVD revenues for a large sample of Member States
estimated around 27.7% p.a. between 2000 and 2010. The forecasts for the development of installed
base of DVD players are even greater, estimated around 40% p.a. over the same period of time. In a
recent study, Screen Digest
evaluated that the number of DVD players is expected to rise in
cumulative terms from around 1,5 million installed base in 1999 to 32,9 million in 2003 considering
only the DVD video player (and to 61,2 million in 2003 if the DVD-enabled console households are
included), i.e. a growth of 116% p.a. (or 153% p.a.). The penetration rate of DVD will increase from
0.8% in 1999 to 21% in 2003 (and to 28% including the DVD-enabled console). Concerning the
increase in the turnover of the DVD market, Screen Digest estimated a growth rate of DVD sales
around 81% over the period 1999-2003 and of DVD rentals around 170%, leading to a total market
value of EUR 5,2 billion in 2003 (compared to a market value for video around EUR 2,8 billion).
4.1.5. The film life cycle
Since the production of films requires important investment, the film has to be used along the various
profit windows in order to take full commercial advantage of all forms of distribution. As already
described in section 2.1., there is a sequence of release of the film across distribution methods which
may, at various times, compete with or complement each other, and hence need to rest on the
implementation of a strict sequential order. A recent study
stresses the relationship between the
99
European Audiovisual Observatory (2000)
100
Screen Digest (2000f)
101
Morgan Stanley Dean Witter (2000)

The European Audiovisual Industry: an Overview
O. Debande & G. Chetrit – 07/09/01 – Final version
57
success of a film in terms of box office and its ability to generate important revenues in the following
profit windows or in other words along the different step of the revenue chain. Considering the
worldwide performance of the top 15 films in the US in 1999 with the worldwide performance in the
video market, a positive correlation was identified. The contribution of the revenues generated from
the video market is crucial to allow a film to break even.
The life cycle of the various distribution media is a fundamental component of the commercial
strategy of right-holders and is affected by the emergence of new support/format as well as by the
globalisation of the release strategy of important media groups or US studios. Although the
optimisation of the life cycle of a film has always been taken into consideration in the management of
the rights associated with a film and included in contracts between producers and other right-holders,
only recently regulation has been implemented to organise the release along the various profit
windows ((see Appendix 1, Table B for the description of the windows release).
In general, the contractual relationship between producers and right-holders for films or other
audiovisual works is managed on a territorial basis in Europe, sometimes encompassing larger
language areas, as rights are never sold at European level. This organisation based on a territorial
division represents the accepted structure of the audiovisual market in Europe and the world. The
preservation of the system of complete contractual freedom for copyright holders to set time periods
for the release of film in any medium on a territory-based management appears to be crucial to ensure
the profitability of the film industry
. Indeed, the mandatory periods regulating the time at which a
film may move from one media to another is considered as denying the distributors’ ability to promote
and distribute each film on its individual merits. In addition, the cultural diversity
, consumption
habits but also economic and technological considerations such as the volume of domestic production
and the availability of various distribution supports in each Member State stresses the need for
flexibility to ensure that each individual market needs are addressed.
The development of new technologies leading to the emergence of new support (e.g. VHS versus
DVD) and the provision of new audiovisual services is affecting the management of the potential
revenues generated by the different release windows. In addition, the European situation, where
discrimination is possible on the basis of territories or language areas (especially in the case where for
instance, digital decoders are managed by territory rather than on a single market basis), is different
from the American market.
In addition, advances in digital technology and platforms offering packages strengthen the trend
towards the recourse to output deals, i.e. long-term exclusive arrangements on film rights covering
periods from 8 to 10 years, reinforcing the position of dominant media groups (see section 5.1.1.
describing the strategy of Mediaset for instance or of the major private German broadcasters). This
strategy has adverse consequences: (i) reduction in the potential European circulation of less profitable
films since such contracts prohibit any other showings in the same territory (except if limits on the
length of exclusive deals are implemented); (ii) increase in the rights for the acquisition of film or
other AV production affecting the viability of local exhibitors and broadcasters.
Those technological developments associated with the globalisation of the AV market have important
consequences for the strategy of the distributors: the definition of the “period” of exclusivity
associated with each format or new service into the existing release windows; the timing and sequence
of release in the domestic and foreign markets, especially when the risk of piracy associated with the
development of new format like DVD is an important issue. In terms of “rent sharing”, the increased
competition for new contents and methods of distribution is expecting to transfer the most important
share of the new revenues to the right-holders. Indeed, the new media (e.g. Internet allowing on-line
consumption of music, images…) or format (DVD) and the means of consumption offered by digital
transmission (Pay-per-view TV, video-on-demand) make the management of the revenue of the film
102
EC (1997). This aspect is also covered in the directive “Television without frontiers”, which abolishes the minimum periods which must
elapse before films for the cinema are released on television (article 7). However, the only remaining constraint still in place on the basis of
the Directive is the obligation for the Member States to ensure that agreements between broadcasters and right-holders on the timing of
broadcasts are respected.
103
Cultural differences such as cinema-going habits, holidays, film festivals, climatic differences, etc require a different release sequence
throughout the EU.

The European Audiovisual Industry: an Overview
O. Debande & G. Chetrit – 07/09/01 – Final version
58
industry more difficult; the freedom to exercise rights is an essential weapon for conquering new
markets (assuming that the regulation to protect copyright is sufficiently efficient). An increased
flexibility in managing rights will allow producers to make the best use of their catalogues and provide
new productions in response to the ever-increasing demand for films and programmes, making crucial
the development for instance of digitalisation policy of existing library of films. This trend reinforces
the need for contractual freedom for right-holders.
The final impact of the emergence of new format or services on the life cycle of a film is still unclear.
Some authors
have argued that the multiplicity of new technological systems to show a film and the
resulting competition between them will reduce the film life cycle. The emergence of a new service
like “Pay-per-view television (PPV)”, offered by digital platforms and certain cable companies offers
interesting insights. This new service is coming after the video slot in the film life cycle and before
pay television and hence, can compete with video and DVD. In the first phases of its development,
operators providing PPV have a limited access to the existing stock films due to the difficulty for
acquiring film rights and the expected low revenue generated by this medium. Once PPV is
sufficiently developed, the opportunity of having recent films will be higher but will depend on their
bargaining power with respect to video and DVD operators since PPV should occupy the same time
slot as video rentals. In the case of older films, PPV could be an alternative method of exploiting the
secondary market but still in competition with other medium, i.e. either in the same time slot as
video/DVD sales or in a “second period” of pay television - after 12 months - or even after airing on
unencrypted television, after all periods of exclusivity are over. As a consequence, this increase in the
number of media time slots could become an additional source of revenue for right-holders.
4.2. The
Broadcasting
industry
The development of the broadcasting industry in Europe has been dominated by the creation of public
channels, i.e. state-owned or state controlled entity
. As this early stage of the broadcasting industry,
TV channels (as well as radio channels) were considered as a “vehicle” to provide people with culture
and information (and sometimes to disseminate political ideas). This situation reflected the existing
barriers to entry: (i) sunk costs to build the network of terrestrial transmitters too high compared to the
expected market share; (ii) limited penetration rate of TV among households; (iii) insufficient amount
of advertising expenditure and (iv) the lack of encrypting technologies allowing to screen the access of
consumers to TV signals. The increased penetration rate of TV at home (in terms of equipment and
viewing time) as well as the liberalisation of the industry and the availability of more frequencies
(release of the spectrum constraint) have allowed for the entry of new private competitors
through advertising or other commercial sources (see section 5.2). Among the European public
broadcatsers, an important diversity is still prevailing in terms of legal statute, of organisation
(integration vs fragmentation, home production vs externalisation), of funding (pure fee or mix of
advertising and fee), of accounts systems, of financial management strategies, of programming
strategies and of market positions
Table 19 describes the growth in the number of public and private national TV channels in the various
member states. In five years, the total number of channels has increased from 205 to 531, i.e. a growth
of 21% p.a. This evolution essentially reflects the entry of a lot of new private operators, but at the
same time the number of public channels has also increased, reflecting the creation of second or third
channels in order to answer the strong competition from private broadcasters. To have a complete
picture of the supply of TV programmes, the number of regional or local channels has to be added. In
2000, around 1,200 channels of this type have been identified in Europe
The recent technological development offered by digitalisation is expected to favour the entry of new
thematic or package of channels (within which thematic channels are broadcast). Around 23 digital
packages were distributed in the EU in the beginning of 2000, either by satellite or cable, with at least
104
e.g. Bonnel (1996)
105
For a description of the broadcasting in Europe, see “Radio and Television systems in Europe 1999/2000, 2000/2001 editions” (European
Audiovisual Observatory). Information is also available from “Television 2000 – European Key Facts” (IP/CLT-UFA, 2000).
106
As an illustration, the first public channel in France was launched in 1948 and the first private one in 1984; in Germany it was 1953 and
1985; in Italy 1957 and 1980; in Spain 1956 and 1989 and finally, in the UK, 1936 and 1955 (Motta and Polo (1998)).
107
European Audiovisual Observatory (2000)

The European Audiovisual Industry: an Overview
O. Debande & G. Chetrit – 07/09/01 – Final version
59
one package in each Member State. To complete the description of the broadcasting landscape, it is
important to stress that many of the existing TV channels are broadcast over more than one type of
transmission infrastructure and received in more than one country, allowing some cross-border
broadcast of TV programmes. While thematic channels have been focused at the beginning on the
most popular genres, i.e. films, sports, programmes for children, music, the market is now
characterized by the entry of channels dedicated to niche markets such as training and education,
home-shopping, religion… The identified trend of creation of local channels has been also supported
by the new transmission opportunities allowing to supply programmes linked to a local audience.
Table 19: Number of national TV channels* in the EU
1995**
2000
95/2000
Public Private Total
Public
Private
Total
Public
Private Total
Austria
2 0 2 3
2 5
8%
25%
20%
Belgium
4 0 4 6
12
18
8%
67%
35%
Denmark
2 3 5 3
4 7
8%
6% 7%
Finland
2 2 4 2
5 7
0%
20%
12%
France
5 22 27 4
79 83
-4%
29%
25%
Germany
10 19 29 14
54 68 7%
23%
19%
Greece
3 6 9 5
13
18
11%
17%
15%
Ireland
4 0 4 3
3 6
-6%
32%
8%
Italy
3 9
12 15
54
69
38%
43%
42%
Luxembourg
0 1 1 0
1 1 -
0% 0%
Netherlands
3 10 13 4
20 24 6%
15%
13%
Portugal
2 2 4 3
8
11
8%
32%
22%
Spain
4 10 14 8
70 78
15%
48%
41%
Sweden
3 9
12 9
14
23
25%
9%
14%
UK
3 62 65 11
102
113
30%
10%
12%
EU
50 155 205 90
441 531 12%
23% 21%
Source: European Audiovisual Observatory (1996, 2000)
*: national channels (terrestrial, cable and/or satellite); not including digital bouquet, local or regional channels and windows, or
channels for foreign markets.
**: 1995 included regional channels broadcast by satellite
The broadcasting industry remains relatively concentrated in Europe and is subjected to various types
of regulation: horizontal restrictions and common ownership, broadcasting license rights, advertising
time and programme content. As it appears from Table 19, the existing market structure is similar to a
sort of mixed oligopoly where there is competition between private and public operators. A mixed
oligopoly is a particular form of market showing conditions of imperfect or distorted competition
(limited number of active operators due to technological constraints and endogenous sunk costs, and
restricted threat of potential entry).
In terms of concentration, Figures 21 and 22 provide a first insight into the situation across the five
major European markets. Looking at a typical concentration ratio
, the European broadcasting
remained quite concentrated even if a reduction in the concentration ratio is observed between 1992
and 1999 (see Table 20). A weak correlation is observed between the rate of concentration (C
4
indicator) and the market size of the broadcasting industry, measured in terms of number of
households with a TV. The level of correlation is quite stable between 1992 and 1999. Considering
the level of concentration expressed in terms of the cumulative audience share of the first two groups,
the concentration could even more pronounced as Italy and to a lower extent in Germany. Those two
countries have dominant private public TV groups, i.e. RAI and Mediaset in Italy and ARD, ZDF,
Kirch Group and CLT-UFA/Group RTL in Germany. During the 1990s, the level of concentration has
decreased or at least has remained stable although this period has been characterized by a the creation
of a lot of new channels. The level of concentration of the European broadcasting market could be
underestimated since few groups have substantial market shares in more than one country.
108
According to Motta and Polo (1997), market shares to assess the rate of concentration in the broadcasting industry are computed with
respect to audience rather than turnover or advertising revenues for two main reasons: (i) the recourse to turnover or advertising revenues
implies that the level of market share is strongly influenced by the different sources of financing of the TV channels; (ii) the distribution of
the audience among the various channels is considered as the most relevant measure of market power for public policy.

The European Audiovisual Industry: an Overview
O. Debande & G. Chetrit – 07/09/01 – Final version
60
Table 20: Concentration in the European broadcasting industry
C
4
Audience
1
C
2
Audience
2
∆
C
4
∆
C
2
1992 1999 1992 1999
∆
(92-99)
∆
(92-99)
Austria
83 71 81 73 -2.2% -1.6%
Belgium
72 65 57 54 -1.5% -0.9%
Denmark
85 83 75 68 -0.3% -1.4%
Finland
93 95 93 86 0.3% -1.1%
France
89 88 79 74 -0.2% -0.9%
Germany
73 55 51 53 -3.9% 0.6%
Greece
82 74 64 44 -1.4% -5.1%
Ireland
n.a. 69 70 60
-2.2%
Italy
68 71 89 90 0.6% 0.2%
Luxembourg
n.a. 45 n.a. 45
Netherlands
74 54 76 64 -5.1% -2.8%
Portugal
100 95 93 80 -0.8% -2.6%
Spain
81 77 66 56 -0.8% -2.5%
Sweden
88 85 79 74 -0.6% -1.0%
UK
95 59 85 52 -6.6% -6.7%
Source: Author’s calculation based on European Audiovisual Observatory (1996, 2000)
1. C4: Cumulated audience of the first four channels; 2. C2: Cumulated audience of the first two
(private and/or public) TV groups on a daily basis.
As a consequence, the following pattern emerges in terms of market structure:
•
Significant rate of creation of new channels, expected to continue in the medium term due to
the emergence of digital transmission infrastructure, favoring the diversity in the supply of
programmes which is positively valued by the consumers. This situation sustains the demand
for new content production.
•
Persistence of high level of concentration in the broadcasting industry. Since a strong
correlation appears between concentration in audience and in advertising revenues
, the most
popular channels collect the larger share of the spending on advertising which could affect the
commercial viability of some channels or require the development of new business models.
4.2.1. Production
In the production segment, as already discussed in section 2.1., a distinction has to be made between
flow and stock programmes, the former type being essentially realised internally. In this section, the
focus is on “stock programmes”, i.e. TV fiction (including films), documentaries, animation and
magazines. By its activity in the production segment (partially due to regulatory and legal
obligations), the broadcasting industry is also an important investor in national film production. As an
illustration in France in 2000
, public and private free (TF1, FR2, FR3, M6, La Sept ) and pay-TV
(Canal + and TPS) channels invested around EUR 248 M, amounting for 40% of the total investment
in films productions
. Canal+ accounted for 58% of the total investment by TV channels. Although
the importance of the broadcasters in film financing varies among the European countries, the French
example reflects the complementarities between the development of the broadcasting industry and the
film industry. The development of a thematic cinema channel, like Canal+, could sustain the
production of films.
The funding of cinema, TV fiction or animation could take various forms
:
•
Commission: the TV channel orders a programme or a series from a producer, retaining full
editorial control. In this type of scheme, the producer is remunerated by a fee and often a
share of royalties but loses his rights on the production. This scheme is essentially used for
short programmes and does not cover the entire production cost.
109
Motta and Polo (1997)
110
CNC (2001)
111
Corresponding to French-initiative films, i.e. those films which are wholly or mostly produced by French investment.
112
Screen Digest (2001)

The European Audiovisual Industry: an Overview
O. Debande & G. Chetrit – 07/09/01 – Final version
61
•
Coproduction
: the TV channel, jointly with others investors (other TV channels in other
territories in general, the producer, international distributors), provides a part of the funding of
the production in return for a share of editorial control and rights.
•
Pre-sale: the TV-channel commits to buy a series, a film at pre-production stage. The contract
could include some “approval rights” over a programme’s design, script.
•
Licence fee: a TV channel acquires the right to broadcast a programme for a limited number of
runs over a limited period of time. In this scheme, the TV channel has in general no impact on
the design of the programme.
The pre-sale of rights is one of the most common schemes of financing the production of programmes,
coproduction being more developed in France, Germany and Italy.
Between 1995 and 1999, total film and programme sales to European TV increased by 22% p.a., from
EUR 1,408 M and to EUR 3,124 M. While the French and Italian markets have recorded a growth of
8% p.a., the Spanish, German and UK markets have been particularly dynamic, facing respectively an
increase of 37%, 29% and 26% p.a. of film and programme sales. Figure 19 depicts the evolution of
the market in the free and pay-TV sub-sectors. While sales to free TV still account for the largest
share (around 70% of total film and programme sales in 1999, varying from 56% in the UK to 83% of
the total in Germany), sales to pay-TV have increased more rapidly over the last five years, especially
in Germany, Spain and Italy.
Figure 19: Total film and programme sales to European TV channels
(with the distinction between sales to free and pay-TV) – 1995-1999
0,0
500,0
1000,0
1500,0
2000,0
2500,0
1995
1996
1997
1998
1999
S
a
le
s
to
fre
e
T
V
(E
U
R
M
)
France
Germany
Italy
Spain
UK
Western Europe
0,0
200,0
400,0
600,0
800,0
1000,0
1200,0
1995
1996
1997
1998
1999
S
a
le
s
to
pa
y T
V
(
E
U
R
M
)
France
Germany
Italy
Spain
UK
Western Europe
Source: Screen Digest (2000a)
The German market is the largest one in terms of acquired programmes, total spending on bought
programming passed EUR 1,000 M during 1999. It reflects the dynamism of the TV market in
Germany. On the free TV market, two groups have a dominant position among the private
broadcasters, i.e. CLT-UFA/Group RTL and the Kirch Group, backing channels like ProSieben, Sat1
and Vox. Those two groups have a sufficient market power to negotiate large output deals with
suppliers. The diversity of the free TV market in Germany allows broadcasters to focus on particular
themes of programming, e.g. Super RTL targeted children’s/family audience; ProSieben and Vox
focused on a young audience with mainly American films and TV series. The two private
broadcasters are in competition with public channels, ARD and ZDF, with a stratification in the
market according to the audience share. The strategy followed by the different channels in terms of
programme acquisitions differs between the public and private channels. While there is a trend to
diversification in the origin of the programme acquired in favour of European products, the share of
fiction imported from the US by German broadcasters is still around 79% in 1998, compared with an
average US fiction programmes import in the EU around 72%. Indeed, private channels like
ProSieben and Vox or channels from the Group RTL favour US products whilst ARD and ZDF are
buying a low proportion of US programmes. In parallel, there is a trend to in-house production of TV
113
The notion of coproduction may vary according to the definition used, but generally a co-producing TV channel contributes for at least
10-15% of the production budget.

The European Audiovisual Industry: an Overview
O. Debande & G. Chetrit – 07/09/01 – Final version
62
series and commissioning
of programmes to independent producers. The development of the cable
market in the future is expected to sustain the expansion of the acquired programmes market since it
will allow the diffusion of new packages of channels.
By size, the UK market is the second largest but, contrary to Germany with a stronger pay-TV market.
The free TV market is dominated by the public broadcasters, BBC and Channel 4
, and the private
ones, ITV and Channel 5. Among them, Channel 4 and ITV are the major spenders on acquired
programmes
. The pay-TV market is dominated by BSkyB, which is the buyer of major film rights,
sporting rights and has negotiated output and major package deals with the US majors as well as
significant independent producers. This operator is facing increased competition from cable
companies and digital terrestrial service providers (i.e. Ondigital entered into an on-going programme
supply deal with BSkyB). Although rapid development in the free TV market has been sustained over
the last year, a steady longer-term trend is expected. The expansion of the market has rested on a
strong independent producer sector, able to fulfill the programming needs of the major broadcasters
Since 1998, the Spanish TV market became the third major European market in terms of sales of
programmes. It reflects the high growth of the market observed over the last five years, especially in
the free TV market. The competition in the free TV market for programme rights (particularly top
sporting events and films) has been intense between two-major digital platforms: Canal Plus-backed
Canal Satélite and Telefónica backed Vía Digital since 1997, when the two digital platforms were
launched. On the free market, the main competitors are the public broadcasters RTVE and the private
one Antena 3 (controlled by Telefónica) and TeleCinco (controlled by Mediaset). While the public
broadcasters are more generalists, private channels are targeted to a younger audience, Antena 3 not
only spending important amount to acquire programmes but also developing its production business,
with a strong potential for exportation into Latin America.
The French TV market is the fourth one in terms of spending for acquired programming, showing a
contrasted evolution between the free and pay-TV markets. The former, dominated by the public
broadcasters - France 2 and France 3 - and the private broadcaster TF1 is stagnating while the latter
thanks to the activity of Canal+ and the launch of two digital platforms – Canal Satellite and TPS
(backed by France Television, TF1 and M6) is developing quite rapidly
. Although the share of US
fiction still remained stable at around 68% in 1998, essentially due to the purchase of programmes by
thematic films pay-channels, major French free TV channels are allocating more resources to local
production, French TV-series becoming the most popular format (achieving audience market share
comparable to US blockbuster films), reducing the diffusion in prime time to a limited number of US
TV series.
Finally in Italy, two major groups dominate the free TV market: a public one, i.e. the RAI group
controlling three channels (RAI1, 2, 3) and a private one, i.e. the Mediaset Group controlling also
three channels (Italia 1, Rete4 and Canale5). The Mediaset Group has an active policy of big output
deals with major Hollywood producers, also reflecting its involvement in cinema activities (production
and distribution). Around EUR 657 M has been disbursed by Mediaset in terms of programme
acquisition in 1999
. The same type of duopoly market structure is prevailing in the pay-TV market
where there is a competition between Canal Plus-backed Telepiù and Stream, controlled by Telecom
Italia and the US company, News Corporation
. While until now the competition between the two
broadcasters has essentially concerned flow programmes (in this case the acquisition of broadcast
rights for sport events), it is expected that the competition between the two operators will affect the
114
This type of investment by a broadcaster (see Section 5.2.) rests on the following mechanism where the broadcasters order a programme
from a producer, the broadcaster in general acquires the full editorial control. The producer is remunerated by a fee and a share of royalties
but does not retain the rights.
115
Although this channel is a public service broadcaster, but funded solely from commercial revenues it earns
116
Screen Digest (2000a)
117
UK is performing well in terms of exporting its production, being the second biggest exporter of TV content to the international market
after the US.
118
Screen Digest (2000a) estimated that Canal+ spend EUR 120 M a year on film rights and TPS around EUR 60 M.
119
Screen Digest (2000a)
120
Both operators are in discussion, since the bad performance of Stream recorded in 2000. The shareholders of this company want to sell
their share to Telepiù but the transaction is under scrutiny due to the negative consequence of the market restructuring on the level of
competition.

The European Audiovisual Industry: an Overview
O. Debande & G. Chetrit – 07/09/01 – Final version
63
TV market programme in a near future. This evolution will reflect the current trend characterized by a
stabilisation in the free TV market compensated by a strong growth in the pay-TV one.
Focusing on TV fiction, a distinction could be made between national and imported programmes.
Concerning the national programmes, Figure 20 describes the evolution between 1996 and 1998
in
terms of number of national TV fiction hours produced by public and private channels in the major
European markets. In 1998, for the total set of countries, the volume of first run national fiction
programmes was estimated to around 5,000 hours, corresponding to a total of 876 different titles
produced. First estimation for 1999 shown an increase up to 5,193 hours
. Compared to 1996, it
represented an increase of 8% p.a.
Figure 20: Number of national TV fiction hours produced by public and private channels (1996-
1998)
0
200
400
600
800
1000
1200
FR Public
FR Private
GE Public
GE p rivate
IT Public
IT Private
UK Public
UK Private
SP Total
TV fiction hours produced
1998
1997
1996
Source: Eurofiction – European Audiovisual Observatory (2000)
This increase in European fiction output is the result of various factors: the reduced attraction of US
TV fiction for large audiences (i.e., during prime time) compared to national TV series, the
modification in the format of the European series becoming longer and the increase in prices for film
and sport events rights. This growth is showing some signs of “shortness of breath” reflecting the
increasing production costs, the shortfall in creative staff as well as constraints on the production
budget of broadcasters
.
Among the five European countries, the UK and Germany accounted for around two thirds of the total
hours produced. While the Italian share was stable around 7% but showing sign of recovery in 1999
(increasing from 357 hours in 1998 to 504 hours produced in 1999), the number of TV fiction hours
produced in France decreased, especially due to a shrinking of the share of private broadcasters.
Finally, the Spanish market was booming becoming the third European market. The dynamism of the
German and UK markets could be explained by the important funds available to those two
broadcasting markets (see also section 5.2.). Indeed, they are the two most important advertising
market in Europe and the fee paid by German and British households is one of the highest in the EU
(although the financial situation of some German broadcasters is not so good due to high programming
expenses for the acquisition of rights on sports events or films).
In a recent study
, an estimation of the financial value of the TV fiction produced in 1999 for the five
major European countries has been done on the basis of a specific methodology assessing a
121
Including for France in 1998, Canal+ and ARTE not monitored in 1996 and 1997.
122
Television 2000 (2000).
123
European Audiovisual Observatory (2000).
124
European Audiovisual Observatory and CNC (2000)

The European Audiovisual Industry: an Overview
O. Debande & G. Chetrit – 07/09/01 – Final version
64
standardised production costs of the different types of TV fiction. The value of the fiction was
estimated around EUR 2.7 billion; Germany accounting for 37%; the UK for 33%; France for 15%;
Italy for 8% and Spain for 7%. International coproductions represent around 15% of the total value of
the TV fiction produced with a different pattern across countries, i.e. France and Italy being more open
to coproduction due to their participation to high budget production and the low amount of resources
available for investing in the production of TV fiction. In addition, there is a linguistic proximity in
the nature of the countries involved in the coproduction schemes. The study identified the channels
with the highest financial valuations of TV fiction broadcast; the top five for respectively the public
and private channels is:
•
Public channels: BBC1 (EUR 309,022 investment in TV fiction); ARD (EUR 285,244); ZDF
(250,894); FR2 (EUR 123,750) ; Channel 4 (EUR 105,655) ;
•
Private channels: ITV (EUR 405,726) ; RTL (EUR 197,444) ; TF1 (EUR 166,300) ; Pro7
(EUR 123,706) ; Sat.1 (EUR 122,725).
The structure of the production sector of TV fiction is quite fragmented in the EU with different
institutional organisations in the five main countries resulting from cultural and historical
evolutions
. Concerning the distinction between independent and captive producers – in function of
their institutional links with broadcasters - it appears that a larger share of TV fiction produced in the
UK and Germany compared to the other countries is realised by captive producers. In the UK, BBC
rests on its internal production unit “BBC” while “Granada” and “Carlton” are essentially working for
ITV. Only Channel4 is not only linked to one production company, even if an significant share of its
production is sub-contrated to “Mersey Television Group”. In Germany, ARD has a long history of
integrating its production activities and has still subsidiaries directly in charge of the production of TV
fiction managed by regional stations of ARD (“La Bavaria”, “ Studio Hamburg”…). Among the
private channels, the Kirch group has always been active as a producer and is still the owner of
production companies like “Beta” or “Taurus”. Since the merger of different entities with the RTL
group, this latter has increased its market power in the production segment, having the ownership of
“UFA”, “Trebitsch”, “Grundy”… The cumulative market share of the four major German producer
126
,
linked to broadcasters, is estimated around 50%. As a consequence, the German market is
characterized by a dual structure where a fringe of small independent producers is competing for the
remaining 50% of the market. In France, the market structure of the TV fiction producers is
characterized by the existence of few groups of producers, i.e. “AB”, “Ellipse-Expand”, “Hachette”
and “Telfrance”, owning various production companies, but not depending on the major broadcasters.
Those groups have a market share estimated around 41%. “Gaumont TV” is also an active producers.
In Italy and in Spain, the market is fragmented. Internal production is essentially limited to some
Spanish regional channels and the Italian private channel “Mediaset” which has been active in the co-
financing of various internal productions.
The programming of TV channels in the EU rests also on the import of various programmes. An
analysis of the import by geographical origin showed the persisting dominant share of US fictions
programmes (including feature films) as described in Figure 21. The share of American programmes
is stable at around 70% (having increased from 69.8% of the hourly volume of imported fiction in
1994 to 71.7% in 1998), meaning that this type of TV production continued to fill at least the non-
prime time fictions slots of the schedules. This situation resulted in an important EU trade deficit in
TV rights, estimated in 1998 at around EUR 2.6 billion (meaning that TV fiction, animation and other
programmes accounted for a substantial share of the total AV trade deficit). On the contrary, the
European broadcasters have also obtained some important success in exporting the “concept” of
various TV reality/game shows, like the British quiz show “Who wants to be a millionaire” acquired
by the US network ABC or the rights on “Big Brother” acquired by CBS.
125
See European Audiovisual Observatory and CNC (2000) for a more comprehensive analysis.
126
Those producers are also active for other competitors but the “privileged” relationship with a major broadcaster allows to stabilise the
activities of those production companies.

The European Audiovisual Industry: an Overview
O. Debande & G. Chetrit – 07/09/01 – Final version
65
Figure 21: Origin of fiction imported by TV-channels in the EU
0%
10%
20%
30%
40%
50%
60%
70%
80%
90%
100%
1994
1995
1996
1997
1998
%
o
f to
ta
l h
o
u
rs
b
ro
a
d
c
a
st
Others
JP
AU+NZ
CA
US
Co-prod. Non-Eur.
Co-prod. Mixed
Co-prod. Eur.
Unidentified
Other EU
IT
UK
FR
SP
GE
Source: European Audiovisual Observatory (1996, 2000)
Although a slight increase in the import of European coproduction has been observed, reaching 3.8%
of the total volume of hours imported in the EU in 1998, this type of production is still facing up and
downs (only 141 new co-produced titles in the fiction category were realized in 1999, compared to
180 titles in 1998), reflecting the difficulty of managing this type of production arrangement. As
already stressed, coproductions mainly concern series with high production costs. For instance in
1999
, it concerned prestige mini-series like “The Count of Monte-Cristo” and “Les Miserables”, co-
produced by he private French channel TF1, the private Italian Mediaset Group and the German
producer, Taurus.
The national production with the high export potential are the UK (around 5%), the French and
German TV fictions having a lower “attractivity” for foreign broadcasters. As stressed in Television
(2000), in addition to being the largest market in terms of production of TV fiction, Germany has
increased its market share in other European markets. For instance, the RTL series “Der Clown” has
broadcast on M6 in prime time. The Kirsch Group has had some success with the series “Kommissar
Rex” and the public broadcaster ZDF with “Derrick” expecting to reproduce the same success with the
new police series “Siska” already sold in 36 countries. French TV series seem to be more “culturally”
oriented towards the national market or the French-speaking market.
Figure 22 provides a short overview of the respective size of the various major European markets with
respect to the import of US fiction. The private German TV channels are the main “buyers” of
American fiction, accounting in 1998 for 37% of the fiction imported by the five major European
markets (compared to 35% in 1994). The Italian market is the second most important market for the
import of US fictions. The importance of those two markets for US TV fiction might result from the
strong market power of private broadcaster groups, being able to negotiate output deals at attractive
conditions.
Figure 22 also shows the contrasted situation between private and public TV channels, the latter being
less inclined to buy rights on US TV fictions due to public service obligations. To some extent, it
allows to ensure a minimum level of diversity between the programming of public and private
operators, which is one of the “raisons d’être” of the public broadcasters
.
127
Television (2000).
128
Other justifications are: the necessity to ensure a sufficient representation of a plurality of opinions, the broadcasting of programme with a
low profitability but high cultural value (such as programme with educational content or programmes defending the right of expression of
certain minorities). As a public service, those channels face a trade-off between broadcasting high-quality programme and reaching a
sufficiently large audience (only with an indirect constraint from the audience compared to private channels funded by advertising, but the
audience results are a good indicator of the ability of those channels to provide programmes meeting the demand from a large audience, i.e.

The European Audiovisual Industry: an Overview
O. Debande & G. Chetrit – 07/09/01 – Final version
66
Figure 22: Number of US fiction hours broadcast by main unencrypted TV channels
in 1994 and 1998
0
5000
10000
15000
20000
25000
30000
GE Public
GE Private
FR Public
FR Private
UK Public
UK Private
SP Public
SP Private
IT Public
IT Private
1998
1994
Source: European Audiovisual Observatory (1996, 2000)
4.2.2. Regulation
The broadcasting market is regulated by national and European legislation
. Those various
regulations have affected the functioning of this industry (see also section 3.1.3.). One major
European regulatory text is the “Television without frontiers directive”
, which was set-up in 1989 in
order to create the framework for the free movement of TV broadcasting services across the EU and a
common European programme production and distribution market. This legislation only applies to
television programme (transfrontier and domestic) but not to radio stations, and is based on the
“country of origin principle”, i.e. programmes are subject to the legislation of the country where the
broadcaster is established. The Directive defines broadcast quotas that affect the strategy of
programme acquisition of the TV channels. More precisely, it states that broadcasters in EU member
states have to reserve a majority (at least 50%) of their airtime for works of European origin. This
broadcast quota excludes airtime dedicated to news, advertising, sports, teletext and home shopping
services. Concerning advertising regulation, some products are banned or restricted from TV
advertising and the transmission time for advertising spots is limited to 15%
of daily transmission
time. In order to support the independent production sector, an additional quota requires that
broadcasters reserve 10% of their airtime or, in some case, 10% of their programme budget, for works
from independent producers; i.e. producers independent of the broadcasters. The Directive allows the
Member State to enforce more stringent regulations. The monitoring of the implementation of the
Directive is carried out each two years, at the time when Member States have to report to the EC on
compliance with the quota defined in the Directive and justify the non-attainment of the target as well
as detail measures adopted to correct the situation.
The European regulatory framework is completed with regulation on copyrights
, broadcasting
standards and the liberalisation of the telecommunication sector. In addition, competition policy is
concerned for the nature of the financing of public broadcasters as well as for the vertical and
fulfilling their public service obligations. In some sense, the audience could be considered as a proxy of system of “voting by foot” but with
a very limited sanction value on the financing of those channels which will continue to be funded by taxpayers).
129
See OECD (1999), European Audiovisual Observatory (1999, 2000) and IRIS
130
Directive 97/36/EC of 30 june 1997 (OJ L 202, 30/7/97), amending the 1989 Directive 89/552/EC “Television without Frontiers” (OJ L
298, 17/10/89).
131
Extended to 20% when including teleshopping windows.
132
See also WTO and WIPO legislations.

The European Audiovisual Industry: an Overview
O. Debande & G. Chetrit – 07/09/01 – Final version
67
horizontal integration observed in the media industry. Broadly speaking, the main regulatory
instruments, having various pro and cons, are the following
1. the organisation of the market structure through regulation of the competition between public
and private channels, the control of vertical and horizontal concentration;
2. limitations on advertising time aiming to protect viewers against too frequent programme
interruptions. While it could effectively protect consumers, it distorts the advertising markets
by increasing price, diverting advertising resources towards other media and affecting the
investment capacity of broadcasters (if the advertising quotas are binding);
3. the obligation of minimal national and European content of programmes aiming to sustain the
national/European production and to preserve the cultural diversity. The recourse to quotas
might also induce market distortions (as in international trade): reduction in variety and
quality, incentive of collusion among national producers, increase in the price for programmes
imported… An alternative might be to sustain directly the producers rather than by the
intermediation of TV channels;
4. quotas for independent production, aiming to limit the risk of vertical integration and the risk
of market foreclosure by the main broadcasters and to favour diversity and innovation in the
content production. The discussion on quotas for independent producers is related to
preceding point and on the role of the broadcasters in the production segment. Indeed, a
counter argument with respect to the inadequacy of sustaining broadcasters directly is the fact
that they have an expertise to assess the viability of a production (in terms of the needs of the
viewers) and the ability to spread the risks over a large set of projects.
5. the limits on cross-shareholding among firms active in different media sectors (TV, radio,
newspapers) and restrictions on multi-licenses to preserve pluralism and avoid dominant
market power.
4.2.3. Diffusion
and
audience
The development of the broadcasting industry giving rise to a steady and diversified increase of the
supply of TV services is facing a relatively stable demand, measured in terms of viewing time.
Indeed, as shown in Table 21, the average viewing time in the EU has increased by 2% p.a., individual
spending on average three hours watching TV per day
Table 21: Viewing time per individuals (in min)
Target groups
1997
1999
Children
1999
Austria
12+ 142 147 3-11
69
Belgium
15+ 184 186 4-14
98
Denmark
4+ 162 165 4-11
94
Finland
10+ 150 161 n.a. n.a.
France
15+ 192 199 4-10 122
Germany
14+ 196 198 3-13 97
Greece
6+ 212 227 6-14 150
Ireland
15+ 188 188 4-14 175
Italy
15+ 221 229 n.a. n.a.
Luxembourg
12+ 115 124
12-14 137
Netherlands
13+ 157 166 6-12 97
Portugal
15+ 173 194 4-14 172
Spain
16+ 218 220 4-12 158
Sweden
15+ 149 152 3-14 93
UK
16+ 229 232 4-15 157
EU
179 186
125
US
18+ 254 259 2-11 177
Source: Television 2000
However, even if the US evolution might be a good proxy, it is too early to assess the potential impact
of the development of mass access to Internet on the daily viewing time, especially to be able to take
133
Motta and Polo (1997)
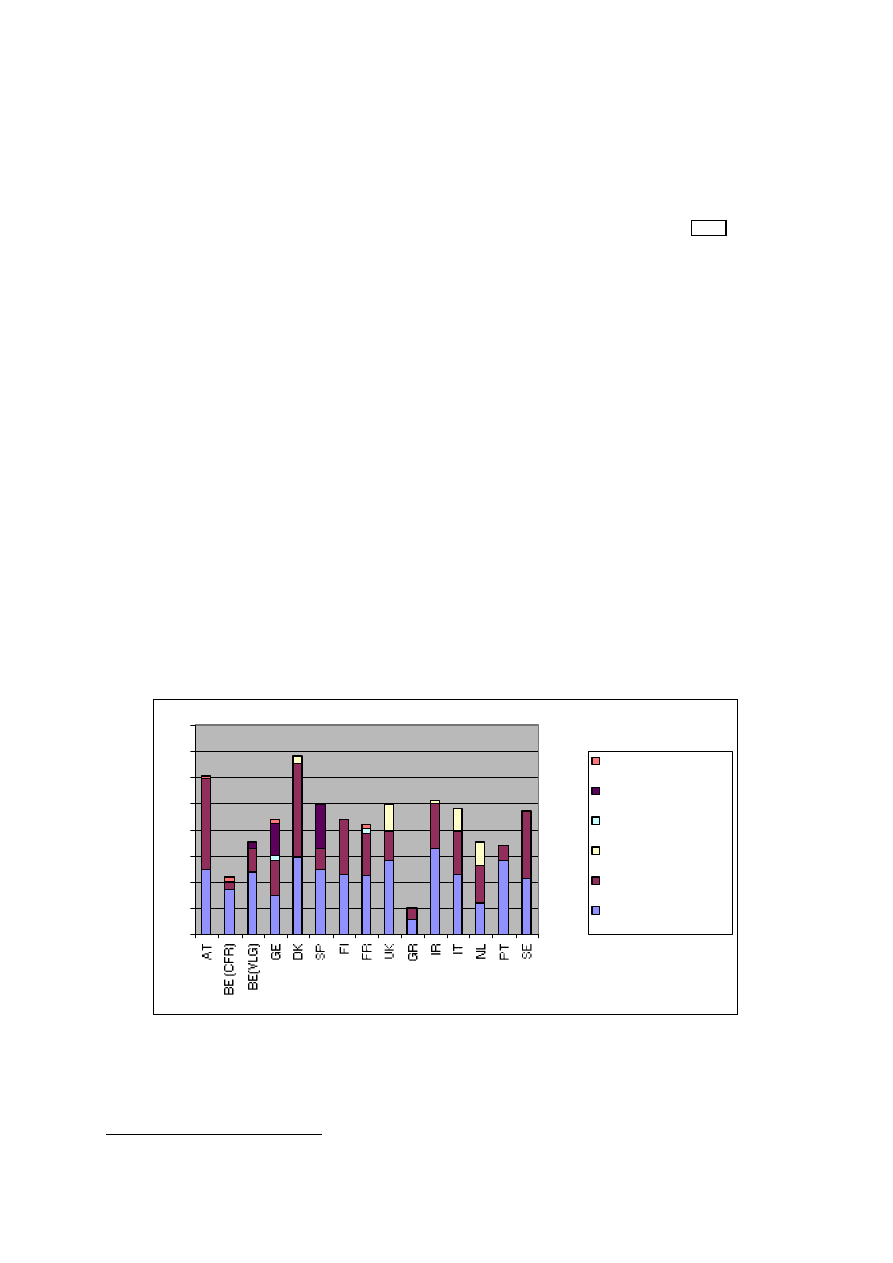
The European Audiovisual Industry: an Overview
O. Debande & G. Chetrit – 07/09/01 – Final version
68
also into consideration the effect of the emergence of TV interactivity. The emergence of new
channels and delivery platforms has sustained the demand for TV viewing.
Important disparities exist between the individuals’ behaviour across Europe: while individuals in
Luxembourg only spend 124 minutes/day watching TV, they spend around 232 minutes/day in front of
their TV screens in the UK. More generally, in Southern countries, people have a higher daily
viewing time. In addition to the limitations in the audience research data (methodological choice in
the measurement systems,…), the daily viewing time is influenced by various factors
: (i) the
number of channels available in the country, i.e. there is a positive correlation between the number of
channels available and the daily viewing time; (ii) the age structure of the population, knowing that
younger people have a lower daily viewing time; (iii) the live coverage of international events; (iv) the
gender structure of the population, i.e. women are spending more time watching TV with some
restrictions when they are working; (v) the cultural habits of the population, e.g. the south European
countries tending to have a second TV prime time around lunchtime; and (vi) the level of income, i.e.
people with a high revenue have a lower daily viewing time than unemployed people.
The audience structure is also affected by the development of the transmission modes in the various
European countries. For instance, in Germany, the market is quite fragmented reflecting the widely
developed cable and satellite reception of TV signals. In Belgium and Netherlands, where cable
distribution reaches the vast majority of households, terrestrial broadcasting is essentially limited to
public channels, while the main private broadcasters are transmitted by cable. This situation contrasts
with Italy, where cable transmission is quasi non-existent, the pay-TV channels being received via
satellite transmission and public and private channels by terrestrial transmission.
The analysis of the daily viewing time could be done in considering the relative performance of the
public and private broadcasters. As described in Figure 23, the audience of public channels widely
differed across the EU: reaching close to 70% in Denmark and being limited to around 10% in Greece.
Between those two extreme situations, the level of audience is around 40% in most of the EU
countries. The performance of the public channels in Germany and in Spain has been positively
affected by the development of new regional channels, following the institutional trend of federalism
transferring more autonomy to local/regional entities.
Figure 23: Audience market shares of European public televisions - 1st Semester 1999
0
10
20
30
40
50
60
70
80
Audience market shares
(Daily share)
European cooperative
channel
Regional channel
Education/Culture
3th channel
2nd channel
1st channel
Source: European Audiovisual Observatory (2000)
A more detailed analysis of the performance of private and public channels is depicted in Figures 24
and 25 looking at the respective evolution of the market shares, defined in terms of average daily
audience, for the public TV channels and the main private competitors in the major European
countries. Since 1993, the combined market shares of public channels in the five major markets in
134
Television 2000 (2000) and Bonnell (1996)
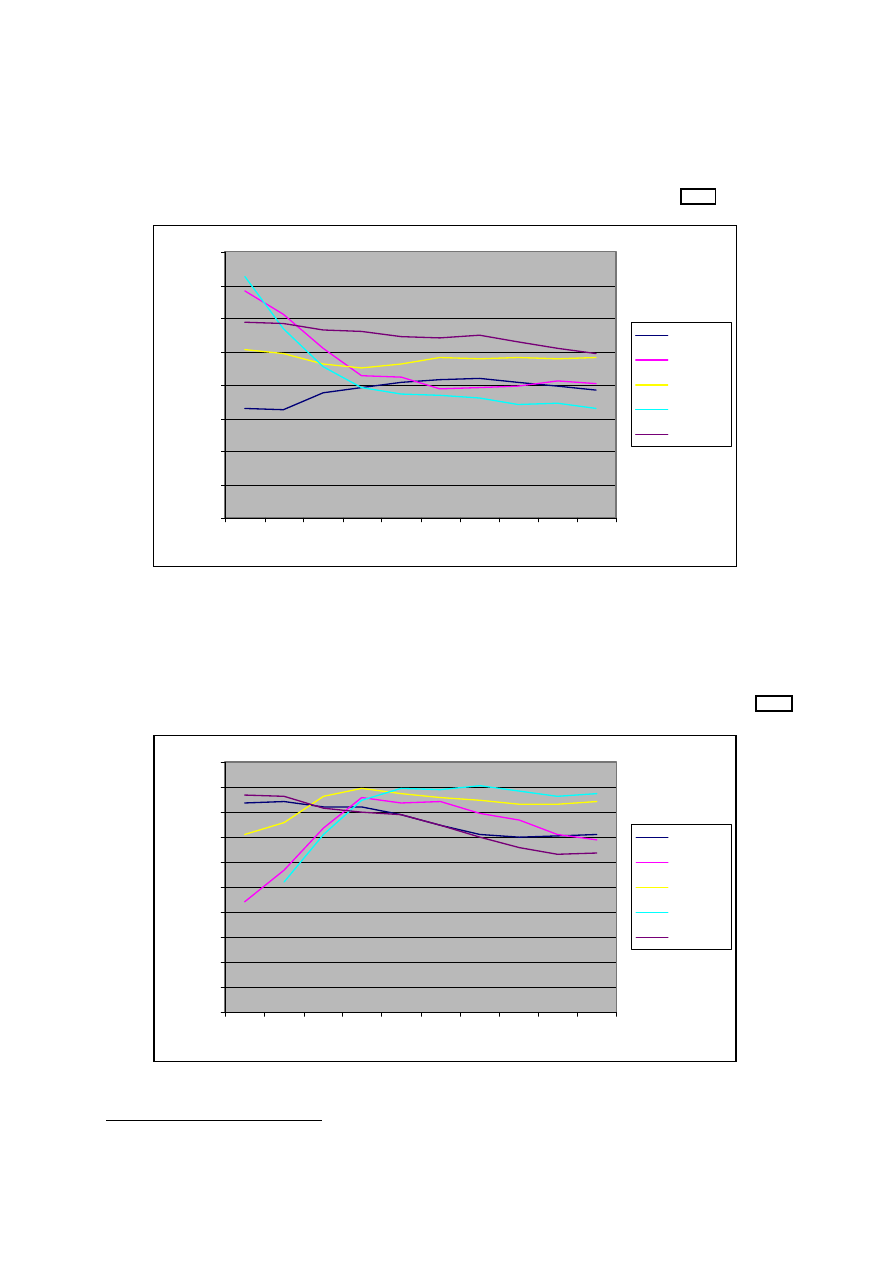
The European Audiovisual Industry: an Overview
O. Debande & G. Chetrit – 07/09/01 – Final version
69
Europe are quite stable, only the Spanish public channels are confronted with a continuous erosion of
the market share. However, considering the evolution during 1990s, the market share of those public
channels decreased quite significantly in Germany and in Spain, was steady in the UK and in Italy,
and increased in France.
Figure 24: Public TV channels average daily audience share – 1990 -1999
0
10
20
30
40
50
60
70
80
1990 1991 1992 1993 1994 1995 1996 1997 1998 1999
T
V
au
di
e
n
ce
d
ai
ly
m
ar
k
et
s
h
ar
e (
%
)
France
Germany
Italy
Spain
UK
Source: European Audiovisual Observatory (1996, 2000)
Comparing the performance of the public and private channels, the UK and German markets (and to a
lower the French market) are characterized by an important decrease in the market share of the private
broadcasters since the mid-1990s: the combined share of the private networks in Germany (i.e., RTL,
Sat-1, Pro-7) and in the UK (i.e., ITV) has fallen by respectively 8.4% and 8.2% between 1993 and
1999.
Figure 25: Main private unencrypted TV channels average daily audience share – 1990 -1999
0
5
10
15
20
25
30
35
40
45
50
1990 1991 1992 1993 1994 1995 1996 1997 1998 1999
T
V
a
u
di
e
n
ce
d
ai
ly
m
a
rk
et
s
h
ar
e (
%
)
France
Germany
It aly
Spain
UK
Source: European Audiovisual Observatory (1996, 2000)
135
France: FR2, FR3; Germany: ARD, ARD3, ZDF; Italy: RAI1, 2, 3; Spain: TVE1, TVE2; UK: BBC1, BBC2, C4.
136
France: TF1; Germany: RTL, Pro-7, Sat-1; Italy: Italia 1, Rete 4, Canale 5; Spain: Antena3, Tele 5; UK: ITV.

The European Audiovisual Industry: an Overview
O. Debande & G. Chetrit – 07/09/01 – Final version
70
Although the level of competition has increased since the launch of new commercial terrestrial
channels and the massive growth in uptake of cable and satellite, the public TV channels have been
able to preserve their position in the market. This evolution appears quite positive with respect to the
future introduction of digital TV, implying a shift from generalist to specific channels, from
universality to individual choice.
The audience targeted by private channels is also affected by the need to satisfy the requirements of
advertisers. As a consequence, the target group of young adults has attracted a lot of interest from
private channels. In some countries like Italy, it is not the same channel which achieves the highest
audience for adults and young adults. Finally, children are also a special target group for two main
reasons: specific groups attractive for the advertising market (impact on children wishes on parents’
consumption behaviour…) and the young generation representing potential loyal adult viewers in the
future. To reach this target group, the broadcasters have either dedicated specific time slots in their
programming or launched new special channels.

The European Audiovisual Industry: an Overview
O. Debande & G. Chetrit – 07/09/01 – Final version
71
5.
FINANCING OF THE AUDIOVISUAL INDUSTRY
The financing of the production of films and TV programmes rests on various sources of funding: pre-
sales of rights to TV channels and video/DVD distributors, minimum guarantee payments from
domestic or international cinema distributors, cash investment from the production companies and
public support from national and/or European authorities. TV channels play an important role in the
financing of European AV works. Indeed, European TV channels have become a major contributor in
film financing and have sustained the production slates of independent producers in terms of TV
series. However, the involvement of TV channels and/or distributors in the financing of AV works
generates a major drawback for the producer, i.e. the loss of control on the rights associated with the
film or TV programmes. Indeed, especially in the case of production companies which are under-
capitalized, the producer is constrained to pre-sell all the distribution rights associated to his film and
therefore cannot grow and diversity its activities.
Financial needs differ with the production phases, i.e. at the development phases, the film should be
financed by equity or specialized financial institutions (like Coficiné and Cofiloisirs in France) backed
by a letter of intend from a TV channel or distributor; at the production phases, the film should be
financed by short or medium debt (as well as subordinated debt). The nature of the film financing
business is similar to project finance since the repayment does not come from the production company
ability to generate cash-flow but from its ability to bring the film upon completion within a given
budget and to generate necessary revenues to repay the debt. The European film finance market is
characterized by a relatively narrow lending capacity reflecting its expert nature and the deterrence
effect of past mistakes.
At the difference of the US market, European banks are mainly discounting contracts from TV pre-
sales and minimum guarantee and are not providing true gap financing
unless they are financing
US film production. The securitisation of a future slate of completed films (portfolio approach) is
paying an increasing role in film financing. In terms of risk diversification, there is an interest in the
financing of portfolios of films rather than the financing of single films. The remaining risk in the
financing of a portfolio of films is essentially a revenue or market risk since the profitability of the
investment will depend on the sales forecast through the various distribution channels. The main risk
associated to any single film is the non-delivery of the film and cost overruns postponing the delivery,
which could be partially mitigated by finding new distribution contracts or reducing the remuneration
of the producer. Another major difference between the European and US markets is the importance
given to public support in European film and TV programmes financing.
The financing of film production has to take into account the consequence of the Parkinson law. If
one line of intervention aims at backing national system of public support for film production (namely
to be able to sustain small independent national producers), this could induce a vicious effect: either
an increase in the number of projects financed which means financing the marginal producer with a
low quality product or an inflation in the budget size of the films, all other things being equal. In
addition, such a type of intervention will not contribute to favour the circulation of European
production across the EU. To avoid this drawback, there is an interest to develop a pan-European
scheme, which would also allow to internalize the cross-border effects; and to back the support to
specialized financial institutions able to screen, assess and monitor the film projects.
Financing of the AV sector has a series of common features with financing of R&D; notably to cope
with the high level of intangibles and risk involved. The recourse to different financial instruments is
required, depending on the stage of development of the companies, the funding needs and the risk
associated with each market segment. For instance, venture capital might be more appropriate for
financing projects addressing the development or pre-production of AV goods. Furthermore, the AV
137
Gap financing means the financing of a film for which the pre-sales of rights on the film do not cover the budget (in general, funds are still
needed but they are also unsold territory rights

The European Audiovisual Industry: an Overview
O. Debande & G. Chetrit – 07/09/01 – Final version
72
sector is characterized by complex interaction among the various players and different sources of
funds. Figure 26 tries to schematically represent the main financial flows.
Figure 26: The main financial flows within the AV sector
Original
screenplay
TV and cinema
producers
Purchase of
Property rights
Distributors
Public
authorities
Co-production
shares
AV facilities
companies
TV channels
Video/DVD
editors
Cinema
Sat. and
cable
operators
Households
International
Firms
Advertiser
Exportations
Foreign co-prod.
Importations
Foreign co-prod.
Internal
production
Ticket
sales
VHS/DVD
Sales/rentals
Pay-Tv
subscription
Sta. and cable
subscription
Public
support
Public
support
Public
support
AV
fee
AV
fee
Exhibition
receipts
Turnover
taxes
Distr. Rights
purchase
Purchase of
technical
services
Fee
Purchase of
advertising space
Pre-purchase
Private lenders
or investors
The following sub-sections examine the funding mechanisms existing in the cinema and broadcasting
sectors.
5.1. Film
financing
Financing a film requires a large investment that is sunk and entails a palpable hazard of loss. The
“nobody knows” property (see section 2) implies a high variance of gross profits from film to film.
On average in a sample of 10 films produced; 6 or 7 may be broadly characterized as unprofitable, 2 or
3 as break-even productions, and 1 a successful film allowing to pay back the cost of the production of
the set of 10 films
. In addition, as discussed in section 2, there is a lack of indicators about what are
the main determinants of a film success:
138
Vogel (2001)

The European Audiovisual Industry: an Overview
O. Debande & G. Chetrit – 07/09/01 – Final version
73
•
Large budgets are not necessarily an indicator of success – a simple correlation analysis
between the film budget and box office success for the top US films budget in 1999 shows a
weak correlation coefficient of just 0.3.
•
Stars (actors, directors) or producers with a good track record do not guarantee box office
success either. They essentially attract rents which might help make the film “bankable” by
increasing the likelihood of debt repayment by increasing the expected gross revenue, but do
not reduce the riskiness of gross profits (unless the star(s) accept substantial contingent
compensation).
The structure of the American film industry has allowed to partially address the debt-equity moral
hazard problem, i.e. supplying debt in a risky world when the creative talent prefers to risk all for a big
win (only mitigated by some reputation effect). The lenders will be interested in having talent
committed to guarantee the project’s success reflecting the importance of creative staff in the
completion of the production, while the talent prefers to commit only when funds are secured. The
studio’s output model pools numerous risky projects, making their aggregate cash flow reasonably
safe for the suppliers of debt, especially since the exhibitors’ profits, though sensitive to the business
cycle, are relatively immune to the hazards of individual film. Besides, a cinema theatre as collateral
could be considered as more comfortable for a bank that a film negative. As a consequence, a few
banks support studio activities, knowing that lending some moderate proportion of a Studio’s
production cost was not particularly risky. However, the business is limited to just a few banks, which
can bear the fixed costs of developing a specialized and costly monitoring system.
The financing of film production (and to some extent TV-series) is subject to Parkinson's law
, with
the number of projects expanding to absorb all capital available, regardless of quality and virtually
without regard to the quantity of other films scheduled for completion and release at around the same
time. This “law” is particularly relevant in an industry where films produced are essentially financed
by lenders’ money. In addition, there is an unavoidable bias for costs to rise at least as fast as
anticipated revenues, meaning that the existence of new windows would not necessarily lead to higher
profitability of a film over its life cycle.
Contrary to the US model, no typical structure is apparent/identifiable for the financing of films in
Europe, with varied sources of finance available. The proportion accounted for by the television
channels and by the major audiovisual groups has become crucial. In addition, the share of public
funding in the total budget of a typical European film is substantial (estimated around 25% of total
production investment
but reaching more than 50% in European coproductions). The amount of
public subsidies is higher for low-budget films than for more ambitious projects based on a
commercial strategy and national and Community public investment, but still accounts for only.
Before analyzing the different financing models available to producers, Figure 27 compares the
average budgets of feature films in the EU and in the US in 1996 and 1999. It appears that European
budgets are still relatively modest by US standards, with the exception of the UK.
Considering the evolution of production investment in real terms between 1988 and 1999, the trend
has been contrasted among the various major European countries: while production investment
increased by around 3.3% p.a. in France and 5.1% p.a. in Spain, Italy has been confronted with a
reduction of 5.6 % p.a. The UK has recorded the most important increase, i.e. 10.8 % p.a. In
Germany, the increase has been quite important over the last years (around 13.2% p.a. between 1996
and 1999).
139
Vogel (2001)
140
European Commission (1997)

The European Audiovisual Industry: an Overview
O. Debande & G. Chetrit – 07/09/01 – Final version
74
Figure 27: Average film budget per country, 1996 and 1999
0
2
4
6
8
10
12
14
Aus tria
B e lgium
De nm a rk
F inla nd
F ra nc e
Ge rm a ny
Gre e c e
Ire la nd
Ita ly
Ne the rla nds
P o rtuga l
S pa in
S we de n
UK
EU
US
Ave rage inve stme nt pe r film (EUR, M)
1999
1996
Source: Screen Digest (2000b)
In terms of financing, the audiovisual sector is undergoing major changes worldwide, notably through
the increasingly close relationship between cinema and television production and distribution.
5.1.1. Private
funding
Various funding alternatives involving private investors and private banks are available to film
producers
:
1. Industry sources, including studio development and in-house production deals in the US, and
financing by independent distributors, completion, and other end-users such as television
networks, pay cable, and home video (including DVD) distributors;
2. Lenders, including banks, insurance companies and distributors;
3. Private
investors.
This simple classification according to the source of funding has to be matched with he various film
financing instruments:
1. In-house financing and production-finance-distribution deals;
2. Negative
pick-ups;
3. Distribution sales or pre-sale of exhibition rights (minimum guarantees);
4. TV
pre-sales;
5. Debt
financing;
6. End-user
financing.
Table 22 reviews the main financing mechanisms available in the US, identifying the main advantages
and disadvantages for the producers.
141
The distinction between private and public funding schemes is to some extent artificial since public authorities could provide implicit or
explicit guarantee, impose some legal obligations on some players like TV channels… In addition, the broadcasting industry is characterized
by a mixed oligopoly structure with the competition between private and public operators, both types supporting the production of films.
142
Vogel (2001)

The European Audiovisual Industry: an Overview
O. Debande & G. Chetrit – 07/09/01 – Final version
75
Table 22: Alternative financing mechanisms for producers
Schemes
Main players
Basic structure
Advantages
Disadvantages
‘In-house”
financing
Writter/producer
and studio
Studio in charge of the
development of the
screenplay, of the
production and financing
of the film and finally of
the marketing and
distribution
•
Financing borne by
the Studio
•
Provision of
facilities by the
Studio
•
Loss of creative power
of the producer
•
Lack of control on the
decision of studio of
“greenlighting” or not
the film
•
Lack of participation
of the producer in
potential upside
Production-
finance-
distribution
(PDF)
Producer, studio
and distributor
Studio lending the cost of
producing the film,
managing its distribution
and sharing with the
producer (and other
participants) the resulting
net profits
•
Financing raised by
the Studio (partially
coming from the
pre-selling of
distribution rights
to distributors)
•
Option contract
feature with the
Studio
•
Loss of creative power
of the producer
•
Lack of control by the
producer on the
agreement with the
different distributors
Negative
pick-up
Producer and
studio/distributor
Commitment made by
studio/distributor to
purchase distribution
rights at an agreed price
before production. This
commitment is usually
made before production
allowing producer to use it
as a security to obtain
financing
•
Possibility of
negotiating better
terms with the
distributor since
offering a less
uncertain product
•
Valorisation of the
commitment to
secure debt
financing
•
Strong bargaining
power in the hands of
the distributor,
especially since budget
is pre-agreed putting
the liability of any cost
overruns over the
producer
Pre-sale of
exhibition
rights
Producer and
distributors
Distributors purchasing
the distribution rights over
territories and release
windows against the
provision of funds, the
producer having to
provide some equity
•
Valorisation of the
guaranteed
minimum payment
to secure debt
financing
•
Higher discretion in
terms of risk sharing
and cross-
collateralisation
•
Higher creative
freedom
•
Limited market for this
type of deals
•
Bargaining and
monitoring costs over
distributors’ agreement
•
Lower integration
between the various
windows release
reducing the potential
internalisation of P&A
efforts
TV pre-sales
Producer and TV
channels
TV channels (pre-
)purchase the rights to
broadcast the film against
the provision of funds
•
Valorisation of the
guaranteed
minimum payment
to secure debt
financing
•
Possibility of pre-
sale when the TV
channel acts as a co-
producer
•
Higher creative
freedom
•
Loss of control on the
management of the
film rights
Debt
financing
Producer and
lenders
Lender providing a
recourse loan secured on
other assets than the film
and with fixed repayment
date
•
Film profits not
shared with lenders
•
Higher creative
freedom
•
Cost of guarantees that
the producer has to
provide
End-user
financing
Producer and end-
investor
Cash investment by the
end-user in exchange for
an equity participation in
the film’s revenues in
specified territories or
release windows
•
Preservation of
equity interest and
creative control
•
Strong incentives of
the end-users for an
optimal exploitation
•
Limited to producer
with an established
track record
•
Cost of raising funds
Source: adapted from Morgan Stanley Dean Witter (2000)

The European Audiovisual Industry: an Overview
O. Debande & G. Chetrit – 07/09/01 – Final version
76
Broadly speaking in the US market, the producer has the choice between studio or independent-type
financing. The most characteristic financing mechanism is the production-distribution-financing
scheme (PDF) where the studio lends up to the cost of producing the film and undertakes to manage its
distribution to some or all exhibition channels in exchange of sharing with the producer and other
participants the resulting net profits. The distributor’s services, which could be performed directly by
the Studio network or by an independent distribution network, involve the acquisition of sufficient
prints of the film, planning and executing the promotion and advertising campaign, and physically
distribute the film through its network of branch offices. The distributor’s compensation takes two
forms:
(i) overhead charge deducted from gross rental (the payment received from exhibitors) estimated
at around 40%
(as described in Figure 26);
(ii) cash inflow net of the overhead charge to recoup the distributor’s cost of prints and
advertising.
If the distributor has participated in funding the production, the interest on the loans has a first claim.
The distributor bears a substantial part of the risks giving him a strong incentive to promote the film,
given the existing compensation structure. The contractual structure of PDF schemes is close to an
option-contract structure
, i.e. expenses incurred up to any point in a project’s development are sunk
and so the decision (i.e., the control rights) to continue is given to the party which has to put money
after what might now appears to be bad, in a sequential way. If the studio decides to exit at any such
step, the producer has the option to purchase all rights by paying the studio’s cost plus an overhead fee
and a profit participation (between 2.5 and 5%) if the film is produced elsewhere. In the US, around
25 - 35% of the completed film have been exposed to the recourse to this option mechanism. In
parallel, the distributor retains full discretion over the decision of promoting the film and is not
obligated to distribute even a completed negative but has to provide some compensation to other
parties.
Another common way of financing films is to pre-sell exhibition rights to national and foreign
distributors, for a pre-defined period of time and for a specified geographical area. The producer can
use the guaranteed minimum payment from distributors to obtain additional financing from lenders or
investors (i.e. providing promissory notes discountable at banks). This scheme offers more creative
freedom to the producer, but the latter loses in terms of internalizing the spillover benefits from a
film’s promotion at each stage because these are retained by the distributor(s). Indeed, the distributor
can profit from price discrimination policy by managing the promotion on the basis of the rights it has
obtained both in terms of duration and geographical coverage. The pre-selling of rights to several
independent distributors makes it difficult for the producer to benefit from the interdependency
between the various exhibition “windows” but at the same time, the producer benefits from greater
creative freedom since the dispersion of the bargaining power among various distributors lowers their
ability to affect artistic choices. Finally, this scheme implies another risk-sharing due to the absence
of “cross-collateralisation”, since each agreement with a distributor is independent of the others.
Producers generally relying on presale strategies manage to reduce their downside risks while giving
away much of the substantial upside profits and cash flow potential from hits. The producer will still
usually need interim loans to cover cash outlays during the period of production.
The producer could also pre-sell the rights on his film to national or regional TV channels. The
mechanism shares some similarities with the pre-sell of exhibition rights, since the producers could
discount the TV channels contracts to banks in order finance the production of his films. In most of
the case for the pre-selling of TV rights, i.e. the rights are sold before the film is finished, the TV
channel is a co-producer, which could give some control on the artistic package (script, “bible”,
trailer-if needed, director, cast) to the channel.
The US market, and to a lower extent some European markets, have also seen the emergence of
completion bonds
to back financial scheme either with a studio or for independently financed film.
143
This percentage could vary depending on the country, the size of the network…
144
Caves (2000)
145
Garçon (1999)

The European Audiovisual Industry: an Overview
O. Debande & G. Chetrit – 07/09/01 – Final version
77
A completion bond, often required by the financier, commits a third party to take over and finish the
production of a film if the producer and/or director have exceeded some stated budget or time. In
general, guarantors charge 6% of the production budget (3% reimbursed if the guarantee is not used).
Although the ability of a financier to step in to complete a film could be challenged, the associated
loss of control of the project for the producer as well as the reputation effect could incite him not to
“throw budgetary rectitude to the winds in the pursuit of art”
.
The debt finance market can be split into two categories:
•
the global lenders' market, where the main players are large international banks such as SG,
Chase, Citibank, Dresdner, ING and ABN operating from head offices, LA and sometimes
London. They concentrate on large deals (USD 10m minimum) for large sponsors (either
Hollywood majors, European mini majors or large independent companies);
•
the niche domestic lenders' markets, where players are small specialised finance institutions
(sometimes part of larger retail banks) who provide finance on the back of national public
aid mechanisms for small local production/distribution companies. These are the likes of
France's Coficiné or Cofiloisirs.
Focusing on global lenders, they provide the following senior debt products, not really developing
subordinated debt/equity products:
•
single picture distribution contract-based financing: These deals are usually put together for
independent producers: before engaging heavily in production the producer pre-sells its
rights to a (several) distributor(s). The distributor(s) guarantee(s) payment of a fee once the
film is completed and delivered. The role of the lenders is therefore to fund the bridge from
production expenditure to receipt of the distributor's fee. The financing relies on the credit
quality of distributor(s), the assurance that the film will be completed (completion bonds are
used) and the receivables to cost cover ("borrowing base value") to avoid funding gaps
(although on larger productions gap financings are sometimes used). There is a variety of
structures on the same theme such as "negative pick-ups" where letter of conforts are
provided to a sales agent which offers a series of distribution commitments as security.
Contract-based facilities are short term (12/18 months).
•
Structured finance deals. Such financings tend to be of a longer term (5 to 7 years) and more
complicated given the structuring and risk aspects. These can take several forms:
-
Insurance/tax/accounting driven structures provided for US majors or European
mini majors;
-
Single film project finance: although lenders rarely take theatrical performance
risks, single film project financings are sometimes put together for the large US
studios. In these structures, lenders rely on the film's future box office receipts. The
lenders analysis concentrates on the suitability of the debt to equity ratio, the talents
quality (both directing and acting) and the commitment to P&A. Studios sometimes
offer partial security coverage in the form of assignment of receivables or rights on
an existing film library.
-
Package financing (securitisation), where debt repayment relies on the cash flows of
an existing vast film library (cash generated from video sales and rentals, pay-TV or
mainstream TV showings). These structures are relatively common in the US (given
the extent of the US majors film libraries) but have so far failed to take off in
Europe.
In the case of independent producers, little collateral usually can be provided to back a loan except by
having recourse to presale contracts and other rights agreement relating directly to the production
(making a production loan more akin to an account receivable scheme). The lender then has to look at
the creditworthiness of the licensees for repayment of the loan and hence is exposed to the risk that a
licensee failed to accept delivery of a completed picture, especially for loan with a relatively long
term. As a consequence, the best option is to lend a fraction of the total amount of the presales
146
Caves (2000)

The European Audiovisual Industry: an Overview
O. Debande & G. Chetrit – 07/09/01 – Final version
78
advances, or better to design the loan on the basis of a portfolio of films to “cross-collateralize” the
risks between the various films.
More recently, various German company (like Constantin, Kinowelt, Helkon…) have raised
significant amounts of funds on the Neuer Markt, invested essentially in American production.
The financing of film production has an impact on the market structure observed in the cinema
industry. On the one hand, distributors are increasingly aware of the need to invest upstream and
expand their financial involvement in production and the acquisition of film rights. On the other hand,
producers are becoming aware of the importance of an integrated production, distribution and
exploitation structure for the success of a film in order to manage more profitably their rights on a film
over its life cycle and to add those assets to the company’s catalogue. Indeed, consider the typical
flow of revenue for an independent producer who has decided to finance his production by pre-selling
the exhibition rights to a distributor or the broadcasting rights to TV channels. In order to set up the
financing package, the independent producers might end up selling in advance practically all
distribution rights to their films. It is apparent that little of the box office revenue (assuming good
performance) will reach the producer
and he will be left with little net profit to re-invest into
production. Although vertical integration could partially solve the challenge faced by the producers,
there is an upper-limit to the scope for vertical integration due to the risk of losing independence, and
hence the creativity skills which is the crucial asset for the realisation of film.
Figure 28 also describes the claims’ sequence on profits generated or the recoupment structure. The
exhibitors’ full cost (including a normal profit remuneration) has to be repaid firstly.
Figure 28: Profit generation from a theatrical release for a producer
Gross box office revenues
Distributor’s gross
Exhibitor
Distributor’s fee
Producer’s gross
Residual and deferred fees
Producer’s net
Equity investors
Producer
40%
60%
50%
50%
50%
50%
Distributor recoups P&A
Distributor recoups advance
Recoupment of equity investors
Source: Creative Industry Task Force (1998)
It reflects the fact that contracts in creative industries are based on the approach that the party about to
sink resources into a project has either the first right to terminate the venture or the first claim on the
revenue that it generates. The percentage associated to the sharing of the profits coming from films
147
In addition on the US market, “creative” accounting procedure used by the studio and to a lower extent by the independent distributor
networks generates an elusiveness of net profits for producers whose compensation includes a profit share. This situation impacts the terms
of participation for major talents (requiring up-front fixed compensation or gross participation) and induces important transaction costs to
decide on the “appropriate” definition of net profit.

The European Audiovisual Industry: an Overview
O. Debande & G. Chetrit – 07/09/01 – Final version
79
exhibitions is only an indication. Although the producer could be in difficult situation in terms of his
ability to recover production costs, the divergent interests of the distributor and the exhibitor could
affect their respective share of the profits. Indeed, the distributor has an interest to ensure that the film
will be widely shown, i.e. the distributor’s profit could increase with the density of exhibitors. On the
contrary, the exhibitor is interested in having a local monopoly (which could vary with the level of
vertical integration with the distributor). The same conflict of interest appears for the temporal price
discrimination across the various release windows, the length of film play, the determination of the
exhibitor’s admission price.
Although a key strength of the US studios is the integration of production, financing and distribution,
they have now more recourse to outside distributors
148
: sales agent (acting as owner of rights in a
given territory in exchange for a sales agency fee), territorial distributors and global independent
distributors. This evolution could reflect a strategy of risk-sharing given the increasingly higher cost
of advertising and promotion.
The European market is still quite different to the US in terms of financing schemes, private funding
being strongly supported by public funding (see section 5.1.2.). The situation reflects the existing
structure of the European film industry which is characterized by a lack of economies of scale due to
diverse and heterogeneous national European markets (mainly due to cultural, linguistic reasons), by
the lack of sufficient know-how especially at the development stage, of inadequate promotion and
advertising budgets, of the difficulty of offering competitive conditions to creative workers
(international recognition, salaries, profit participation). Therefore, the potential for and the
probability of significant return for European films through worldwide exploitation is quite limited,
this, in turn, leads to a weaker funding of producers and distributors. The resulting vicious cycle could
be partially alleviated by the emergence of pan-European distributors which would be able to sustain
coproduction-distribution deals. For instance, domestic and emerging pan- European distributors, in a
“split-rights” arrangement, might contribute to a film’s production cost and be entitled to distribution
fees earned in their respective territories. Agreement needs to be achieved to “cross-colateralise”
profits and losses to solve the issue of having different distribution costs and box-office appeal
depending on the national market.
The increased participation of TV-channels in coproduction schemes (partially due to legal obligations
of investing in cinema production) has made available more funds to film production. In general, a
broadcaster provides a significant part of the funding in return for rights. Another form of support
from broadcasters is through the pre-sale of rights for the diffusion of a film. However, a distinction
has to be made between cinema-thematic and generalist channels. Indeed, generalist channels might
be less interested to sustain significant film budget since this unique creation could only marginally
contribute to the completion of the programme planning. In some sense, the role of the end-users is
becoming more important in film financing, which is also partially reflected by the fact that exhibitors,
in order to obtain exhibition rights for prospective blockbuster films, may agree to commit to making
other risk-exposed payments.
5.1.2. Public
funding
Since the end of the 1950s, the creation of public systems to fund film has become widespread in the
EU. The UK and Italy, which passed their first laws to protect their national cinema in the 1920s,
were the pioneers of the field. The first public funding systems were in the form of automatic
financial support for film production
, where a sum of money is calculated on the box-office
revenues of a film and then transferred automatically to the producer or distributor, to help them to
finance their next film. In Italy, the automatic funding of production was put in place in 1938. In
France and Spain, such a system was established in 1948 and 1964, respectively (but effectively
implemented in 1977). The first selective funding systems, which were also initially focused on film
148
Morgan Stanley Dean Witter (2000)
149
This section is essentially based on European Audiovisual Observatory (1999), Le Floch-Andersen (2001) and on the Primarolo Report
(1999) for the fiscal aspect. See also Dubet (2000).
150
This type of mechanism is based on actual receipts or estimated ones and operates differently depending on the countries (existence of
requirements to reinvest in production…). This mechanism exists for distributor and is based in this case on the number of admission tickets
sold.

The European Audiovisual Industry: an Overview
O. Debande & G. Chetrit – 07/09/01 – Final version
80
production, were introduced during the 1950s at a moment when the first significant drop in cinema
attendance was observed. British selective funding dates from 1949, and the French “advances on
receipts” was introduced in 1959 along with the creation of the Ministry of Culture, while the Spanish
system was introduced in 1983. Selective funding systems are a form of soft loan given to the
producer to be recouped against future revenues. The last countries to introduce public funding were
Portugal (1971), Greece (1980), Austria (1981) and finally, Luxembourg (1990). Automatic systems
are perceived as sustaining the broad competitiveness of the industry (by providing a subsidy in the
form of reward for success of the film), while the selective ones aim to achieve more cultural
objectives targeted to specific niches of the film production like experimental works.
Although various public funding instruments are common to most European countries, such as
automatic and selective systems, most European countries have integrated both the cultural and
commercial dimensions into their methods of financing film (and television). However, differences
among the major European countries can be identified: the recourse to guaranteed low-interest loans in
Italy, the federal or decentralized approach in Germany and Spain, France’s aim at national level to
treat all the relevant sectors as a whole and to mark closely the changes in the film industry
(introduction of new programmes for the multimedia sector, the financing of public funds) and finally
the UK approach emphasized on commercial income and private sources. In addition, some countries
have supported the development of “tax-shelter” system or guarantees system
. The following
sections shortly review the situation in the five main European markets, a summary of the public aid
system being provided in Appendix 2.
5.1.2.1. National mechanisms
In France, around 75% of the financial resources (measured in terms of the Centre National de la
Cinématographie (CNC) budget) comes from the taxes and levies on the turnover of public and private
TV channels or from their direct contributions, and the remaining share coming from a tax levied on
all cinema tickets for films released in France. In other words, the French system is based on a
principle of “compulsory saving” based on the consumption of the services (at the origin, through this
tax on the cinema tickets) and leading to a cycle of internal redistribution
. The support does not
come directly from the State budget, since the financing is linked to the film's market performance.
The size of these resources dedicated to the support of the AV industry is also the result of a strong
funding initiative to support television productions, which receive over half of total production
funding in France. The allocation of these resources is chiefly done through automatic support
mechanisms, i.e. accounting for 71% of production. Furthermore, in France, these automatic
mechanisms, which aim to sustain French (or French majority coproduction) production, cover the
various stages of the cinema value chain (exhibition, distribution and video). In addition, the amounts
allocated by the selective funds are also larger than in the other European countries.
The cornerstone of the support and regulatory system in France is the CNC. This institution is in
charge of administrating the distribution of this funding as well regulating the market (access to the
profession, agreement for the film which is a prerequisite to benefit from the public support schemes,
support to the “Registre Public du Cinéma et de l’Audiovisuel” (RCPA) enabling financial institutions
to register their assignments of film rights and to check its validity…). The French system aims to
ensure an effective balance between the sectors and a close link between industrial objectives and
cultural aims. The funding managed by the CNC has allowed to sustain a high volume of production
(around 150 films produced each year). This system of direct intervention is fitted into a regulatory
framework aiming to structure the market, such as the obligations of the television companies to
directly contribute to the financing of film and television production.
The “Institut de Financement du Cinéma et des Industries Culturelles” (IFCIC), was established in
1983 as a link between the support mechanisms managed by the CNC and the banks, playing a crucial
role by discounting pre-sales contracts to distributors or TV channels, obtained by producers. It shares
up to 55% of the credit risk on loans made by banks for the production of AV works. Once the
151
As explained below, the system of guarantees in the EU is only working in France.
152
Sauvaget (2000)

The European Audiovisual Industry: an Overview
O. Debande & G. Chetrit – 07/09/01 – Final version
81
producer has secured the various contracts with other partners and with government subsidy agencies,
he has to negotiate with a bank to obtain the financing for his film, offering those contracts as
collateral. As this stage, IFCI intervenes and guarantees these contracts vis-à-vis the lending bank and
only covers loss once all possible ways of recovering the loan have been exhausted. Having the status
of credit establishment, IFCIC received in 1995 some EUR 6.1 M of own capital under a capital
increase subscribed to principally by private bank shareholders
. This provides it with more than
EUR 12.2 M of own and associated funds, allowing it to take EUR 152.4 billion in risk, and thus to
guarantee some EUR 304.9 billion of loans.
On average between 1991 and 2000, 5,2% of financing for French majority feature films is coming
through the “Sociétés de Financement des Industries Cinématographiques et Audiovisuelles”
(SOFICA) investment funds. The SOFICAS were created in 1985 to offer attractive tax-efficient
products aiming to encourage individuals to invest in the production of primarily French film and TV
programmes, and around EUR 548.8 million have been raised and recycled through this system.
Investors who purchase shares in a SOFICA and hold them for a minimum of 5 years (up to 8 years
investors with a guaranteed capital) for benefit from a fiscal advantage, i.e. companies may carry out
exceptional depreciation equal to 50% of cash subscriptions to the capital of SOFICAs while
individuals are allowed to deduct all their investment from up to 25% of their taxable income. In
reciprocity for the fiscal benefit, shares taken in a SOFICA by individuals and companies must be held
for a minimum of 5 years (up to 8 years if there is a guarantee for the capital). The SOFICAs are
obliged to finance productions of French producers or which have been registered with the CNC. In
addition, they have to invest a minimum of 35% of their capital with independent producers (80% of
funds raised).
In Germany, the public funding system for the audiovisual industry rests on the decentralisation of the
responsibility to regional film and television funds, managed at the Länder level: the Filmstiftung
Nordrhein-Westfalen (EUR 27.24 M), the Filmboard Berlin-Brandenburg (EUR 21.47 M), the
Medien- und Filmges Baden-Würtemberg (EUR 7.2 M), FilmförderungHamburg (EUR 10.49 M), the
FilmFernsehFond Bayern (EUR 31.24 M) and the Mitteldeutsche Medienförderung (EUR 14.22 M).
The implementation of these regional bodies seems to have generated a form of competition to attract
AV productions into a region. The share of these regional funds accounts for 62% of German public
support. Other supports come from the Film FörderungsAnstalt (FFA) (around 28% of the public
support) and the Beauftragter der Bundesreg. Für Angelegenheiten d. Kulture und der Medien -BKM
(around 8.75%). Finally, a small contribution (about EUR 1-1,5 M) is made by the Stiftung
Kuratorium des jungen deutschen films.
Since 1974, an agreement between the public-sector television channels and the FFA defines the
contribution of the two main public TV channels, i.e. ARD and ZDF, to the cinema industry.
Renegotiated on a periodical basis, this agreement provides a significant amount of funding for the
FFA (EUR 5.6 M p.a.), and includes obligations to co-produce German films for a total annual amount
of EUR 4.6 M. Recently, special fiscal measures, the creation of investment funds, have been
introduced to attract more private investment into the German AV sector, but the recent stock market
downturn for technology and media companies has had an adverse effect.
In the UK, the support system has been recently reviewed aiming to rationalize the current
organisation and attract more private funds. Indeed until 1992, public funding system for the cinema
was under the supervision of different government departments. There was a willingness to
restructure the existing bodies providing public support (BFI, British Screen Finance and the British
Film Institute) into a single body known as the Film Council. This institution will also take over the
Lottery responsibilities for film support which rested with the Arts Council of England. From April
2000, the Film Council became responsible for all direct government funding
from the Department
153
Currently IFCIC's shareholding consists of: the State at 20%, Sofaris at 20%, Credit national at 20% and various French commercial
banks.
154
It means: the Arts Council of England's Lottery Film Department (temporarily name Film Council Lottery Department); The British Film
Institute's production department (temporarily renamed Film Council Production Department); funding the production/development agency
British Screen Finance and the British Screen European Coproduction Fund; funding the BFI as a whole although it continues as an
independent body delivering cultural and educational objectives for the Film Council; funding regional production activities; and the British
Film Commission.

The European Audiovisual Industry: an Overview
O. Debande & G. Chetrit – 07/09/01 – Final version
82
for Culture, Media and Sport for film with the exception of the National Film and Television School.
By the end of 2000, the Film Council has delivered separate and detailed policy proposals to the
Department for Culture, Media and Sport containing a number of new funding initiatives
.
In parallel to this internal restructuring of the support system, a process of decentralisation has been
implemented transferring responsibilities for support to film productions to local authorities and
regional development agencies. This evolution reflects the increased interest at local and regional
levels for the audiovisual (and to a broader extent, cultural industries), as a potential instrument to
stimulate local economic development. This approach has been followed, for instance in the creation
of the Glasgow Film Fund, sustained through Glasgow City Council, the Glasgow Development
Agency and the European Regional Development Fund. Set up in 1993, this Fund is focused on the
support of film produced in the Glasgow area or with a Glasgow-based company.
The creation of the national lottery in the nineties has introduced a major change in the funding of the
AV industry in the UK. Indeed, under the National Lottery Act, the activities of film production were
considered as a capital project and as a consequence, eligible for funding. It was also applicable for
projects supporting the distribution and exhibition of film. The support to the cinema industry
implemented by the Arts Council of England – the Film Programme - through lottery funded film
activity aimed to restructure the British film production sector. This sector is characterised by the
existence of few large production companies producing a small proportion of films, the majority of
films being produced by small production companies often set up solely to produce a single title. This
Film Programme is organised around four axes aiming to improve the competitiveness of the cinema
industry by creating the conditions for the emergence of competitive production companies:
(i) support for individual films on top of public funding from other sources;
(ii) the Greenlight Fund managed for the Arts Council by British Screen and designed to part-
finance larger budget films with directors of high international standing;
(iii) film production franchising aiming to introduce lottery film franchises to three companies
in order to enable development, production and distribution of between 16 and 39 feature
films each over a six-year period in 1998; and
(iv) artists' film and video.
In 1997/1998, the funding allocated to the film and video production through lottery funds was around
EUR 73.7 M, for a total of 406 projects. The Film Programme channeled EUR 40.8 M to the film
industry to sustain 92 awards.
The support to the film industry in the UK also included a tax-relief scheme. In July 1997, the UK
Government agreed to 100 tax write-offs for film production, investment and acquisition in the first
year. The 1997 Finance Act decreed that qualifying British films
budgeted up to EUR 21.7 M
qualify for the scheme. This tax incentive scheme was expected to boost film investment and as a
consequence to generate a high number of new jobs. This tax-relief scheme was recently extended up
to April 2005. The long-term future of the scheme is, however, vulnerable to progress towards
European tax harmonisation.
In Italy, the legislative and financial public support to the film industry has been reviewed, following
the severe crisis that affected the film industry in the 1970s. Although support for the film industry is
coming from all levels of government -State, regions, provinces and municipalities, the State is the
major administrative authority
that is also involved in supporting production to a significant degree
155
See Le Floch-Andersen (2001, p.47) for a description of the existing Scottish and North-Irish support system.
156
The three franchises, awarded in May 1997, are worth in total EUR 138.2 M over a six-year period. The three franchises were awarded to
Pathé Pictures Ltd (EUR 47.9 M), DNA Films Ltd (EUR 41.9 M) and The Film Consortium (EUR 48.4 M). In 2000, after the mid-term of
the three franchises, the Film Council renewed the DNA and Pathé franchises, while the extension of the franchise for the Film Consortium
was maintained on a film-by-film basis (reflecting low performance and changes in ownership).
157
To be certified as a qualifying film, the following criteria have to be fulfilled: (i) the film is made by a company that is both registered and
centrally managed in the UK or other EU state; (ii) any studio used must be in the UK, but a maximum of 7.5% of playing time may be shot
in studios in Eire or Commonwealth countries; (iii) if more than 20% of playing time is shot on locations outside the UK, the film must be
prepared, equipped and processed in or from the UK; and (iv) 75% of the labour costs must be represented by payment to Commonwealth or
EU citizens or ordinary residents of those countries.
158
The regions and local authorities, in fact, mainly intervene in supporting cinemas and promoting film culture, with the former also doing
so by organising regional film circuits, while both are often very active in setting up film libraries, in supporting experimental cinema and

The European Audiovisual Industry: an Overview
O. Debande & G. Chetrit – 07/09/01 – Final version
83
(i.e. the state annually allocates over EUR 60.4 M of its budget to the film industry, while regional
finance varies between EUR 2.6 and 5.2 M). Production activities are mainly concentrated in Rome
but regional authorities, like Naples, Milan and Turin want to develop production facilities. In
addition, a number of regional authorities have set up film commissions to provide support, incentives
and organisation to production companies. Finally, the Italian public broadcaster - RAI - - plays an
important role in film production and distribution.
The government department responsible for the film industry is the Dipartimento dello spettacolo
(Department of Performing Arts also responsible for music, theatre and dance). Funding for the film
industry (and theatre and music activities) came from a single fund for the performing arts since 1985,
a three-year Fund. The amount managed by this fund is revised annually when the budget law is
approved. Due to budgetary constraints, the resources allocated to the Fund are limited. The
production segment of the film industry attracts the most important part of the public funding (58%),
while promotion only receives 13%. The remaining amount of public funding (29%) goes to state film
organisations, in particular the Cinecittà Holding. A distinction has to be made between the funds paid
directly by the Ministry as subsidies for supporting films’ promotion and the state film bodies and
funds managed by the “Film Loans Section”. This latter entity was originally set up by Law
1213/1965 at Banca Nazionale del Lavoro
(BNL) and managed the largest share of funding (EUR
35.1 M in 1998) allocated to the film industry in the form of loans. The allocation of funds by the
BNL is subject to a specific regulation, controlled by the Department of the Performing Arts and
involving two special commissions, the Commissione consultativa per il Cinema (Consultative Film
Commission) and the Commissione per il Credito Cinematografico (Commission for Film Loans).
The former Commission expresses a qualitative judgement regarding the films having applied to the
Department to be included in the specially funded category of “films of national cultural interest”.
The latter Commission has to evaluate the economic/commercial viability of each production project
submitted.
This funds allocated under the form of loans should be repaid to the “Film loan section”, with the
exception of the films of “national cultural interest” benefiting from the intervention of the Guarantee
Fund. This Guarantee Fund intervenes when market receipts are insufficient.
In Spain, the organisation of the public support system has been affected by the trends to
decentralisation as in Germany. There is a co-sharing of the responsibility between the national level,
through the Ministry of Culture in charge of supervising the Institute for Cinema and the Audiovisual
Arts (ICAA) managing the film industry support system
, and the regional level, where the
independent communities have set up their own film and audiovisual support mechanisms.
As in other European countries, the public support mechanisms are more dedicated to the production
segment, and to a lower extent to the distribution and exhibition segments. The type of support is:
(i). Automatic support mechanism, called amortisation aid, allocated as a subsidy and calculated
on the basis of box-office takings. This mechanism allows producers to recover part of the
investment made for the production of a film. Spanish films are entitled to obtain, during
the first two years' screening in Spanish cinemas, an amount of fund equivalent to 15% of
gross takings. A ceiling has been imposed on the total amount that the producer could
recoup through this mechanism, i.e. not more than 50% of production costs or EUR
601,012. In addition to this mechanism, for producers not being eligible for the selective aid
mechanism, two additional mechanisms have been enforced: either an amount equivalent to
25% of box-office takings collected during the first two years, or an amount equivalent to
33% of the producer's investment cost for films achieving receipts of at least EUR 300,506
(EUR 180,304 for films with budgets below EUR 1,2 M).
film clubs, as well as, more recently, incentivising the redevelopment and modernisation of cinemas. A few regions, such as Tuscany,
provide contributions for the production of films that "document life in the region".
159
Three main categories of film have been identified: films of national cultural interest, nationally-produced films, and first and second
works, each of them being eligible to a different form of finance and subsidies paid by banks.
160
Loans to the AV industry are also granted by the Institute of Official Credit (ICO) and Banco Exterior (BEX).

The European Audiovisual Industry: an Overview
O. Debande & G. Chetrit – 07/09/01 – Final version
84
(ii). Selective support mechanism corresponding to an advance on receipts given to promote
young filmmakers having produced less than three films. This scheme aims to promote the
renewal of the Spanish film production, or the realisation of experimental films.
Since the budget of the film production aid fund has not been index-linked to the inflation and
adjusted to reflect the increase in production costs since end of the eighties, the real contribution of
this public support scheme has been shrinking.
Finally, the Spanish government has also implemented a tax-relief scheme to support the production of
AV works. Tax payers liable to corporate tax are entitled to a tax-relief for any investment made in
Spanish films and TV programmes (fictions, animation or documentary), allowing the development of
a master version prior to its mass production. Tax-relief could represent at most 20% of the capital
investment.
Concerning the role of the banking sector, an agreement exists with Argentaria and the ICAA for the
implementation of loans with an interest rate subsidies. This institution provides credits at a
preferential interest rate for film production and for renovation of film theatres. The credit agreement
implies that Argentaria requires an interest rate of MIBOR plus 2%, and the ICAA supports 5.5 points
of that interest rate.
5.1.2.2. European mechanism
To support the development of European film production, various attempts have been made through
European policies to improve the mobility of national European films and TV programmes, to protect
and promote cultural and linguistic diversity, to encourage TV channels to invest in European TV
programmes and to sustain training schemes for those involved in the film and TV industry. An
overview of the existing programmes indicates a large span of programmes addressing the different
stages of the film industry:
•
Coproduction (Eurimages, the Nordic Film and Television Fund, the Script Fund, Cartoon and
Documentary under Media I);
•
Project development phase (Media I, II, +, the Nordic Film and Television Fund);
•
Distribution (Eurimages, EFDO, Media I, II, +);
•
Exhibition (Eurimages, Media I, II, + through the Europa Cinemas network, Audiovisual
Eureka in its action plan of 1998);
•
Training (Media I, II, +, Audiovisual Eureka, Baltic Media Centre);
•
Preparation of legal instruments relating to production, investment, film and TV distribution
and film and TV export (EC, Council of Europe, OECD, WITO);
This section focuses on the Media programme. Support for the programme industry has been one of
the mainstays of the Community’s strategy for the audiovisual industry for almost ten years. The first
Media Programme, adopted in 1990, encouraged re-structuring the cinema and programme industries,
instilling certain working habits and forging cooperation links between professionals, as required by
the Sngle Market. The second Media Programme, dating to 1996 and allocated EUR 310 million over
a five-year period, focused on three key areas: training, the development of potentially successful
works and transnational distribution of films and audiovisual programmes. The new Media +
programme
is organized along the same key areas: development, distribution and promotion of
European audiovisual works (called Media Plus – Development, Distribution and Promotion aiming to
allocate EUR 350 million between 2001 and 2005) and training programme for professionals in the
European audiovisual industry (Media Training aiming to allocate EUR 50 million between 2001 and
2005)
The support for the development stage takes different forms:
(i) support for the development of production projects under the form of loans are granted to
European independent production companies for the development of production projects in the
161
OJEC (2001), L13/35, 17.1.2001, 2000/821/EC. OJEC (2001), L26/1, 27.1.2001.

The European Audiovisual Industry: an Overview
O. Debande & G. Chetrit – 07/09/01 – Final version
85
following genres: fiction (feature film and television production), creative documentary,
animation;
(ii) support for the development of multimedia projects submitted by companies specialized in
this sector and related to interactive entertainment and/or educational products (on-line, off-
line or hybrids) created using digital technologies and experienced via computer based
delivery. They must be developped with a view to commercial exploitation and have already
aroused the interest of publishers or distributors;
(iii) support for the development of European independent production companies in the form of
Slate Funding (development of packages of projects) aimed at European independent
companies with a proven track record in developing and producing projects (fiction,
documentary, animation) with potential to sell in the international market, and
(iv) support to production companies to partly finance (50% maximum) the investments intended
to ensure the expansion of independent production companies.
Finally, two complementary forms of support are proposed: support for the establishment of a business
plan and for the development of the company (company loans), granted on the basis of a viable
business plan, aims at supporting the structuring and/or diversification efforts of the company. On the
distribution side, the programme aims to support the distribution and broadcasting of audiovisual
works (fiction, documentary, animation, interactive programmes) and of European films in cinema
theatres, on video, on digital disc and on television. The main objectives of the measure are to
promote groups of distributors, multiply the number of television coproductions and build up
catalogues of European programmes. In addition, it facilitates the promotion and access to the market
of European works by supporting independent producers and distributors on audio-visual markets and
in festivals. Lastly, it provides support to networks of cinemas presenting a common strategy for the
promotion and marketing of European films. Various types of mechanisms are available covering an
automatic support scheme, a selective support scheme, support for video and multimedia publishing
and distribution, support for TV broadcasting to participate to independent producers project, support
to the marketing of licensing rights granted in independent European distributors in order to compile
and market catalogues of European works, support to cinema theatres aiming at developing the
networking of cinemas presenting a common strategy for the promotion and marketing of European,
films support for promotion and access to the market granted to European initiatives aiming at
facilitating the promotion of the European independent production on the occasion of large trade
markets and audio-visual festivals or specialised markets, both inside and outside the EU. In terms of
promotion, the aim of the financial support is to encourage all kind of promotional activities designed
to facilitate European producers and distributors' access and participation to major European and
international events.
To conclude on the public funding mechanisms based on this short overview of the main European
markets and on the description of the European Media programme, it appears that two issues are
central to the various approaches: the balance between the cultural and the commercial/industrial
objectives and the role of the industry in the design of the public support schemes. Considering the
share of responsibilities between national and European support schemes, most of the existing national
schemes focus on the production stage while the main European weaknesses are the development and
distribution stages. This situation could reflect some coordination failures between the various
Member States not able to internalise the positive effect of spreading the promotion and advertising on
a larger network. On the other hand, this coordination failure might simply result from the existing
cultural and linguistic diversity making it difficult to implement the same distribution strategy in each
member state. On the basis of some implicit optimal sharing of responsibilities between levels of
authorities, the internalisation of having a larger distribution network is done by the EC through its
Media programme.
5.2. Broadcasting
financing
The financing of the broadcasting industry is essentially organized around the advertising market and
licence fees. However, Table 23 gives a more comprehensive overview of the potential source of
revenues for the broadcasting industry. A distinction could be made between private and public

The European Audiovisual Industry: an Overview
O. Debande & G. Chetrit – 07/09/01 – Final version
86
funding, the former type being raised either from market or non-market sources while the former being
linked directly or indirectly to the broadcasting market. Both private and public channels could
benefit from revenues coming from private or public sources.
Table 23: Revenue types for the financing of broadcasting
Public funding
Private funding
Directly related to
broadcasting
Indirectly related to
broadcasting
Market-related
Non market-related
User fees:
•
Media based
•
Income-based
•
Appliance-based
Product taxes on
acquisition of
equipment
Fees:
•
Individual fees
•
Subscription
Donations
Taxation of private
suppliers
Allocation from various
public budgets
Advertising:
•
Commercials
•
Sponsoring
•
Teleshopping
•
Informercials
•
Product placement
Member contributions
Proceeds form
auctioning of
transmission license
Other income:
•
Co-financing
•
Licensing
•
Merchandising
•
Bartering
•
Rental of assets
•
Interest
•
Stock revenues
Source: Based on Zerdick and al. (2000)
The total revenue of public channels in 1998 was estimated around EUR 23.8 billion (i.e., an increase
of 4.2% with respect to 1997). As described in Figure 29, the public channels are still mainly funded
by the licence fee, accounting for around 60% of the total revenues. Between 1993 and 1997, the
revenues of public channels grew by 22.1%, which is comparable to the growth in the turnover of the
video market but lower than the growth of the receipts from cinema screens and of pay-TV
Figure 29: Breakdown of revenues for the public broadcasters in European union (1993-1997)
0%
10%
20%
30%
40%
50%
60%
70%
80%
90%
100%
1993
1994
1995
1996
1997
Ot hers
Ot hers commercial
Programmes sales
Sponsoring
Advert ising
Ot hers public funds
Licence fee
Source: European Audiovisual Observatory (2000)
162
Lange (1999)
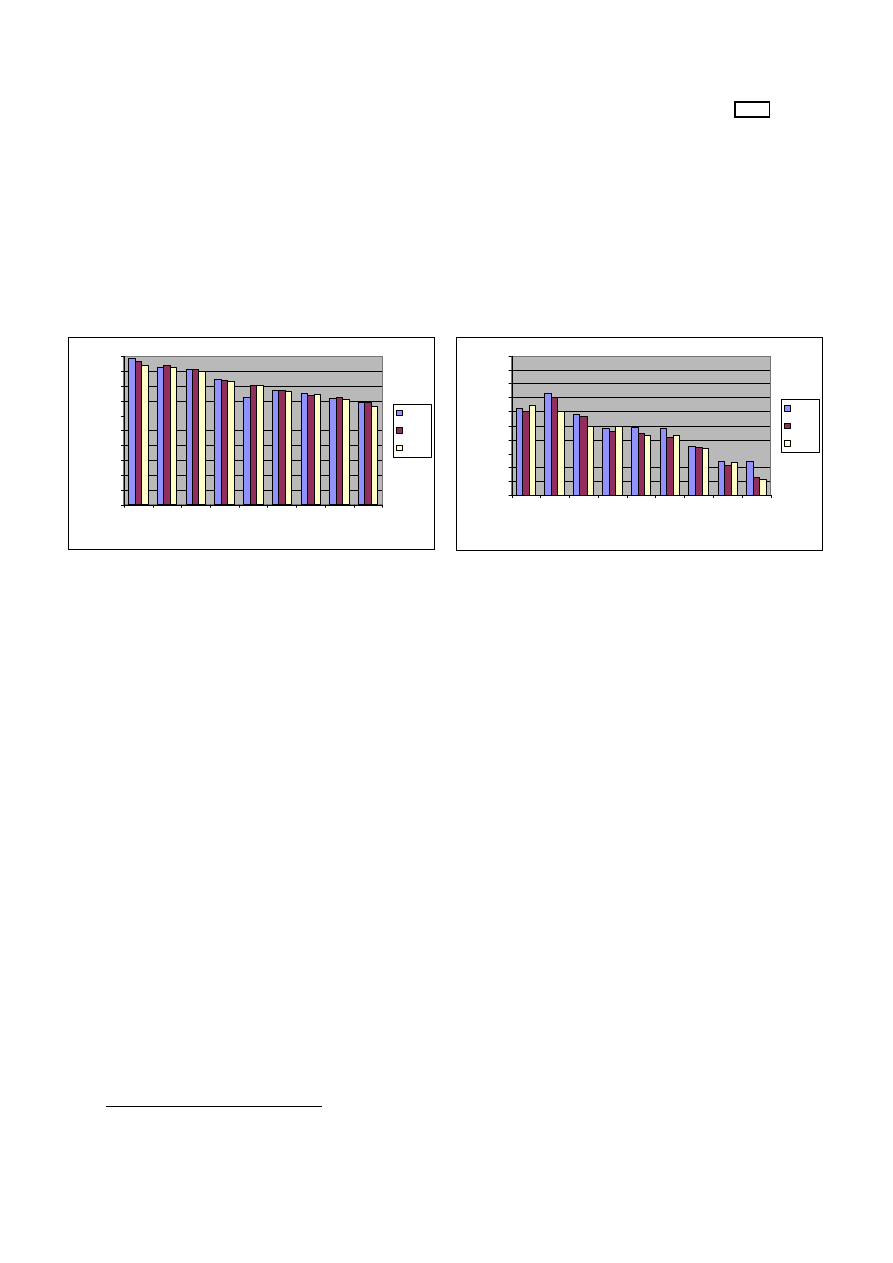
The European Audiovisual Industry: an Overview
O. Debande & G. Chetrit – 07/09/01 – Final version
87
The aggregate figure hides important diversity among the various European public broadcasters
. As
described in Figure 30, the TV channels which receive a substantial amount of public funds (licence
fees or other revenues like subsidies) are essentially the Scandinavian channels, i.e. Denmark (DR)
and Sweden (SVT) , the Greek channel (ERT), the British (BBC) and German (ARD and ZDF)
channels. At the other side of the interval, the Spanish (RTVE) and Irish (RTE) only receive a small
of public funds, i.e. having essentially to recourse to advertising or other commercial services. The
share of commercial revenues has increased in some countries, like Belgium, Spain, Italy or Sweden
(to some extent in Denmark when including the public channel, TV2), accounting in general for a third
of total revenues.
Figure 30: Public TV channels with the highest …. and lowest level of public funding
(in % of operating revenues) (1996-1998)
0
10
20
30
40
50
60
70
80
90
100
ER
T
SV
T
DR
BBC
ZD
F
AR
D
YL
E
RT
B
F
NO
S
(%
o
f o
p
er
at
in
g
r
e
v
e
n
u
es
)
1996
1997
1998
0
10
20
30
40
50
60
70
80
90
100
Fr
a
n
ce
3
VR
T
RA
I
OR
F
Fr
a
n
ce
2
RT
P
RT
E
TV
2
RT
V
E
(%
o
f
ope
ra
ti
ng
r
e
ve
nu
es
)
1996
1997
1998
Source: European Audiovisual Observatory (2000)
In addition, some countries like Netherlands have reformed the general public funding system, e.g. in
the case of Netherlands the licence fee system has been replaced by funding through the general
taxation system since the beginning of 2000.
The relative weight of public funding has slightly decreased in France, in the UK and in Italy, while
increasing in Germany. The reduction in Spain has been more important. To complete the picture, a
comparison of the average revenue of pubic channels per inhabitant shows the major discrepancy
between European countries (Figure 31). The Danish public service perceived around EUR 106 of
revenues per inhabitant for only EUR 18 in Portugal. Considering only public funds, the German
public channels benefit from the highest level of revenues, i.e. EUR 72 per inhabitant, while the
Spanish public channels only EUR 11. In addition, this last figure allows to qualify the situation of
some public channels like ERT in Greece. Indeed, although this channel receives important resources
from public authorities, the level of financing expressed per inhabitant is very low compared to other
European countries.
163
Considering another indicator, i.e. the amount of TV licence fee on 1.1.2000 as paid by viewer in EUR, the following ranking among
countries emerges: Denmark EUR 247; Austria EUR 220; Belgium EUR 189; Sweden EUR 187; Germany EUR 173; UK EUR 158; Finland
EUR 148; France EUR 114; Ireland EUR 89; Italy EUR 89; and Netherlands EUR 88.
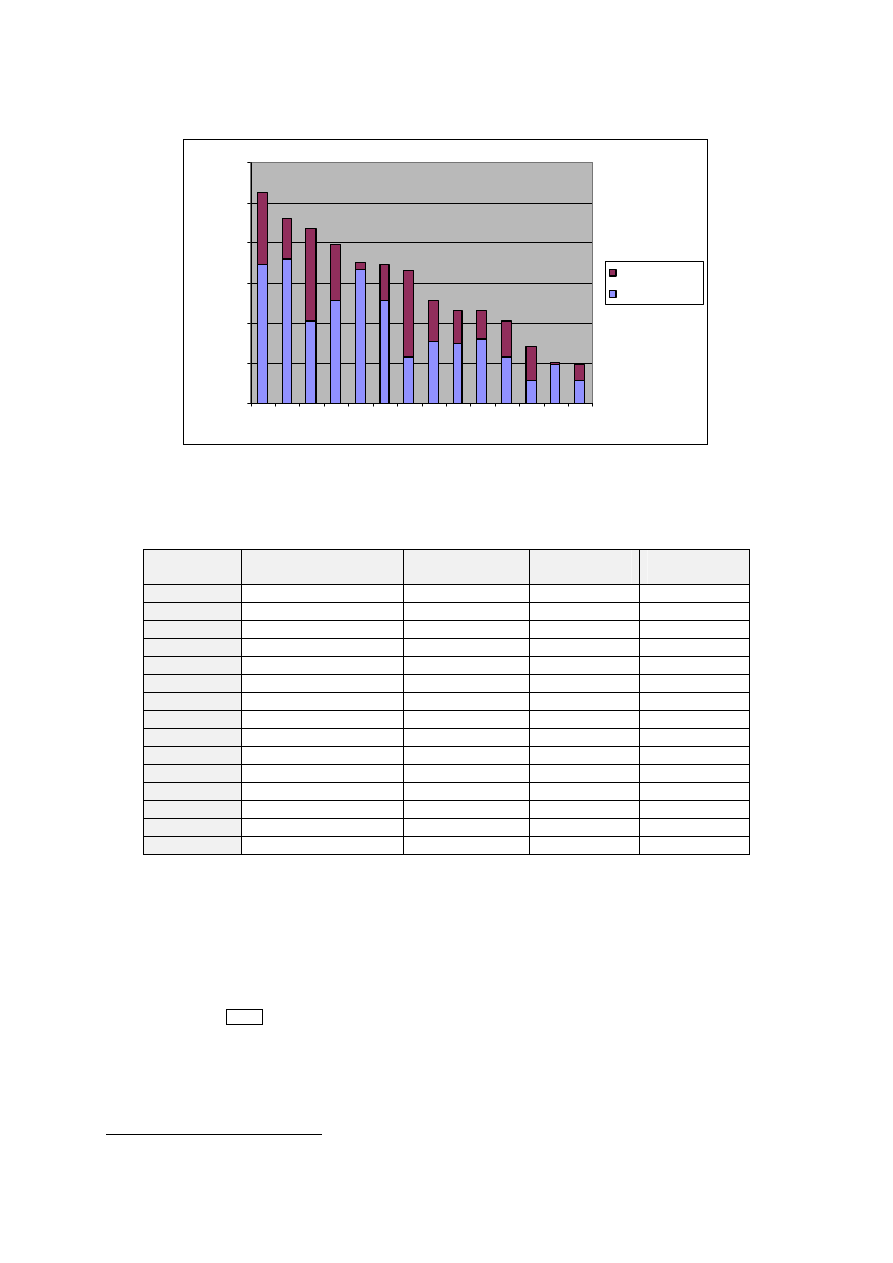
The European Audiovisual Industry: an Overview
O. Debande & G. Chetrit – 07/09/01 – Final version
88
Figure 31: Financing of the public service per inhabitant in 1997
0
20
40
60
80
100
120
DK DE AT GB SE
FI
IE BE FR NL IT
ES GR PT
E
U
R
pe
r i
n
h
a
b
it
a
nt
Other revenues
Public funds
Source: Lange (1999)
Advertising is one of the major sources of financing for private channels but also for public ones.
Table 24 gives an overview of the size of the advertising market in the EU.
Table 24: TV advertising expenditure in the EU - 1998
TV adspend (EUR M)
% TV share
1
TV adpsend in
% of GDP
TV adpsend
per capita
Austria
347,4 23.8%
0,18%
43,0
Belgium
603,1 37.0%
0,27%
59,2
Denmark
268 20.1%
0,17%
50,6
Finland
201,2 29.6%
0,18%
39,1
France
2972,8 33.9%
0,23%
50,6
Germany
4490,8 25.1%
0,24%
54,7
Greece
421 45.8%
0,39%
40,1
Ireland
140,5 22.1%
0,19%
38,0
Italy
3248,2 55.7%
0,31%
56,4
Netherlands
571,3 18.8%
0,17%
36,5
Portugal
2
427 47.0%
0,45%
42,9
Spain
1730,9 39.9%
0,35%
44,0
Sweden
326,5 19.5%
0,16%
36,9
UK
5069,1 32.7%
0,42%
85,8
EU-14
20817,8 31.9%
0,28%
55,6
Source: European Audiovisual Observatory (2000)
1. Including classified adspend.
As already mentioned, Germany and the UK are the two major markets in volume while in Italy,
Greece, Spain, Belgium and the UK, the advertising expenditure on TV represents an important share
of the total advertising expenditure (i.e. higher than the European average). The TV share of the total
German advertising expenditure is still lower than the European average.
In 1999, the gross TV advertising market for private and public channels was estimated around EUR
23.2 billion, a growth of 11.4% with respect 1998. The market is expected to grow by 8.8% in 2000
and 6.8% in 2001
. Since 1990, the European TV advertising market has grown by 8.8% p.a., which
reflected a sustained growth of this market. In parallel, the TV market has increased its market share,
from 23.1% in 1990 to 31.9% in 1999. The ability of the TV market to increase its market share is
related to the greater flexibility of the TV advertising market in terms of ability of the broadcasters to
164
European Advertising and Media Forecast, September 2000.

The European Audiovisual Industry: an Overview
O. Debande & G. Chetrit – 07/09/01 – Final version
89
target the advertising to specific viewer groups, of the reduction in price, of the recourse to a
guaranteed audience…
The development of the TV advertising market is constrained by various regulations (see section
5.1.2.) and is not able to sustain the entry of a lot of new channels. The emergence of pay-TV
channels could to some extent redirect the limited resources available away from the advertising
market. In parallel, the interactivity could allow the creation of new “business models “ based on a
true pricing of the services supplied to the viewers.

The European Audiovisual Industry: an Overview
O. Debande & G. Chetrit – 07/09/01 – Final version
90
REFERENCES
Albert S. (1999), “Movie Stars and the Distribution of Financially Successful Films in the Motion
Picture Industry – A reply”, Journal of Cultural Economics, 23, pp. 325-329.
Arendt D. and Steil N. (2001), Film production and film financing – An overview, Presentation to
EIB/EIF (8/05/2001), Deloitte and Touch Luxembourg and ULPA.
Banerjee A. (1992), “A Simple Model of Herd Behavior”, Quarterly Journal of Economics, 107, pp.
797-812.
Baskerville Communication Corporation (2000), Global Film Exhibition & Distribution, 3th edition,
Baskerville Communication Corp.
Benhamou F. (2000), L’économie de la culture, Editions La découverte, Collections Repères.
Bikhchandani S., Hirshleifer D. and Welch I. (1992), “A Theory of Fads, Fashion, Custom and
Cultural Change as Information Cascades”, Journal of Political Economy, 100, pp. 992-1026.
BIPE (1998), Media II Programme Mid-term Evaluation, Final report for DG X/C-Directorate of
Culture and Audiovisual Policy, Brussels.
Bonnell R. (1996), La Vingt-cinquième Image. Une économie de l’audiovisuel, Gallimard.
Bourdieu P. and Darbel P. (1969), L’Amour de l’art. Les musées d’art européen et leur public, Ed. de
Minuit, Paris.
Caves R.E. (2000), Creative Industries – Contract between Art and Commerce, Harvard University
press, Cambridge, Massachusetts.
CNC (2001), Bilan 2000, CNC Info, n°280, Mai, Paris.
Creton L. (1997), Economie du cinéma – Perspectives stratégiques, Nathan Université – Série
“Cinéma”, Paris.
De Vany A. and Walls W.D. (1999), “Uncertainty in the Movie Industry: Does Star Power Reduce the
Terror of the Box Office?”, Journal of Cultural Economics, 23, pp. 285-318.
Deiss R. (2001), Cinema statistics - Strong growth in cinema-going, Statistics in focus/Industry, Trade
and Services, Theme 4-2/2001, Eurostat, Luxembourg.
Deiss R. 2001), Audiovisual services - Video cassette and DVD disc sales increase while video rental
decrease, Statistics in focus/Industry, Trade and Services, Theme 4-3/2001, Eurostat, Luxembourg.
Deiss R. (2001), Information Society Statistics – Strong growth of PC, Internet and mobile phone
usage in the European Union, Statistics in focus/Industry, Trade and Services, Theme 4-4/2001,
Eurostat, Luxembourg.
Delon F., Marchand J.-R. and Thibout J. (2000), Les multiplexes, Rapport au Ministre de la Culture et
de la Communication, France.
Department of Culture, Media and Sport (1998), Creative industries – Mapping document, London.
Dubet E. (2000), Economie du cinéma européen: de l’interventionnisme à l’action entrepreneuriale,
L’Harmattan, Collection Champs Visuels, Paris.
Durie J., Pham A. and Watson N. (2000), Marketing and Selling your Film Around the World – A
Guide for Independent Filmmaking, Silman-James Press, Los Angeles.
European Audiovisual Observatory and Hans-Bredow Institute (1999, 2000), Radio and Television
Systems in Europe, European Audiovisual Observatory, Strasbourg.
European Audiovisual Observatory and CNC (1999), Public Aid Mechanisms for the Film and the
Audio-visual Industry in Europe, vol. 1 (Comparative Analysis of National Aid Mechanisms) and vol.
2 (National Monographs), European Audiovisual Observatory, Strasbourg.

The European Audiovisual Industry: an Overview
O. Debande & G. Chetrit – 07/09/01 – Final version
91
European Audiovisual Observatory (1996, 2000), Statistical Yearbook. Film, Television, Video & New
Media in Europe., European Audiovisual Observatory, Strasbourg.
European Audiovisual Observatory and CNC (2000), Économie de la Fiction Télévisuelle en Europe,
European Audiovisual Observatory, Strasbourg.
European Audiovisual Observatory (2001), Focus 2001: World Film Market Trend, European
Audiovisual Observatory, Strasbourg.
European Audiovisual Observatory - National Reports on the Film Industry, available on the EAO
website (
European Commission (1997), The European Film Industry under Analysis. Second Information
Report, DG X/C-Directorate of Culture and Audiovisual Policy, Brussels.
Eurostat (2001), Audio-visual statistics in Europe
: 1980-1998, AUVIS Database, Eurostat,
Luxembourg.
Farchy J. (1999), La fin de l’exception culturelle, CNRS Communication, CNRS Editions, Paris.
Garçon F. (1999), “Du risque de fabrication dans l’industrie cinématographique: la garantie de bonne
fin”, in: Creton L. (ed.), Le Cinéma et l’argent, Nathan Université – Série “Cinéma”, Paris, pp. 75-87.
Gassot C. (2000), L'écriture et le développement des scénarios des films de long métrage, Centre
National de la Cinématographique, Paris.
Ginsburgh V. and Weyers S. (1999), “On the Perceived Quality of Movies”, Journal of Cultural
Economics, 23, pp. 269-283.
Goudineau D. (2000), La Distribution des films en salle, Rapport à Mme la Ministre de la Culture et
de la Communication, Paris.
Hamlen W.A. (1991), “Superstardom in Popular Music: Empirical Evidence”, Review of Economics
and Statistics, 73, pp. 729-733.
Hansen A. F. (2000), “The Block Booking of Films Reexamined”, Journal of Law & Economics,
XLIII(2), pp. 395-426.
Hay D.A. and Morris D.J. (1991), Industrial Economics and Organization: Theory and Evidence, 2th
edition, Oxford University Press, Oxford.
IDATE (2001), The World Film and Television Markets – “Industries and markets”, IDATE –
Montpellier.
IP (2000), Television 2000: European key facts, IP Group, Paris.
Lange A. (1999), “Diversité et divergences dans le financement des organismes de radio-télévision de
service public dans l’Union Européenne”, Communication & Stratégies, Politiques Publiques, n°35 –
3ème trimester, pp. 183-196.
Lange A. (2001), “La distribution cinématographique : un univers très éclaté”, Cinecittà, n°3-4,
Maggio, pp. 17-36
.
Le Floch-Andersen L. (2001), “Different ways but same objective: Fostering sustainable film and
audiovisual industries in EU”, Cinecittà, n°3-4, Maggio, pp. 41-53
.
Kenney R.W. and Klein B. (1983), “The Economics of Block Booking”, Journal of Law &
Economics, XXIII(2), pp. 497-540.
Kenney R.W. and Klein B. (2000), “How Block Booking Facilitated Self-Enforcing Film Contracts”,
Journal of Law & Economics, XLIII(2), pp. 427-435.
McCain R. A. (1981), “Cultivation of taste, Catastrophe Theory, and Demand for Works of Art”,
American Economic Review, 71, pp. 332-334.
Media Salles (1999, 2000), European Cinema Yearbook, Media Salles, Milan.

The European Audiovisual Industry: an Overview
O. Debande & G. Chetrit – 07/09/01 – Final version
92
MKW GmbH (2001), Exploitation and development of the job potential in the cultural sector in the
age of digitalisation, Report for the DG Employment and Social Affairs, EC, Brussels.
Moody (2000), You Ought to Be in Pictures: Moody’s Approach to Rating Future Film
Securitizations, Special Report - Structured Finance, Moody’s Investor Service, New York.
Morgan Stanley Dean Witter (2000), ‘Ja Baby’; Here Come the German Majors, Neuer Markt Film
Group, Industry Overview – December 1, 2000, Equity Research Europe.
Motta M. and Polo M. (1997), “Concentration and public policies in the broadcasting industry: the
future of television”, Economic Policy, 25 (October), pp. 294-334.
Motion Picture Association of America (2001), Economic Review 2000, MPAA, Los Angeles.
Musgrave R. (1959), The Theory of Public Finance, Mac Graw Hill, New York.
OECD (1999), Regulation and Competition Issues in Broadcasting in the Light of Convergence,
OECD, Directorate for Financial, Fiscal and Enterprise Affaires, Committee on Competition Law and
Policy, Paris.
Prag J. and Casavant J. (1994), “An Empirical Study of the Determinants of Revenues and Marketing
Expenditures in the Motion Picture Industry”, Journal of Cultural Economics, 18, pp. 217-235.
Ravid S.A. (1999), “Information, Blockbusters, and Stars: A Study of the Film Industry”, Journal of
Business, 72(4), pp. 463-492.
Rosen S. (1981), “The Economics of Superstars”, American Economic Review, 71, pp. 845-858.
Sauvaget D. (1999), “L’argent de l’Etat et la filière cinématographique en France”, in: Creton L. (ed.),
Le Cinéma et l’argent, Nathan Université – Série “Cinéma”, Paris, pp. 59-74.
Sedgwick J. and Pokorny M. (1999), “Movie Stars and the Distribution of Financially Successful
Films in the Motion Picture Industry”, Journal of Cultural Economics, 23, pp. 319-323.
Screen Digest (1999a), “Electronic Cinema: Digital delivery for the big screen”, April 1999, pp. 81-
88.
Screen Digest (1999b), “Film production/distribution: Year of mixed fortunes”, June 1999, pp. 129-
136.
Screen Digest (1999c), “Towards a single European market in film”, October 1999, pp. 261-268.
Screen Digest (2000a), “European TV programme market buoyant”, April 2000, p. 117-124.
Screen Digest (2000b), “Film production and distribution trends”, June 2000, pp. 181-187.
Screen Digest (2000c), “UK films earn more in the US than at home”, August 2000, p. 254.
Screen Digest (2000d), “Worldwide Cinema – Poor product fails the multiplex boom”, September
2000, pp. 277-284.
Screen Digest (2000e), “Global cinema stocks hit rock bottom”, November 2000, p. 350.
Screen Digest (2000f), DVD Video – European market assessment and forecast to 2003, Screen Digest
Limited, London.
Screen Digest and International Video Federation (2000), The European Video Yearbook 2000/2001,
Screen Digest Limited, London.
Screen Digest (2001), Animation : The challenge for investors, Screen Digest Limited, London.
Siroën J.-M. (2000), “Le cinéma, une industrie ancienne de la nouvelle économie”, Revue d’Économie
Industrielle, 1st Trimestre, pp. 93-118
Siwek S. (2000), Copyright Industries in the U.S. Economy: The 2000 Report, International
Intellectual Property Alliance, Washington.

The European Audiovisual Industry: an Overview
O. Debande & G. Chetrit – 07/09/01 – Final version
93
Stigler G. and Becker G. (1977), “De Gustibus Non Est Disputandum”, American Economic Review,
67, pp. 76-90.
Sutton J. (1992), Sunk Costs and Market Structure – Price Competition, Advertising and the Evolution
of Concentration, MIT Press, Cambridge, Massachusetts.
Tirole J. (1989), Theory of Industrial Organization, MIT Press, Cambridge, Massachusetts.
Vogel H. (2001), Entertainment industry economics – A guide for financial analysis (5th edition),
Cambridge University Press, Cambridge.
Zerdick A., Picot A., Schrape K., Artopé A., Goldhammer K., Lange U.T., Vierkant E., López-
Escobar E. and Silverstone R. (2000), E-conomics: Strategies for the Digital Marketplace, European
Communication Council Report, Springer-Verlag, Berlin.

The European Audiovisual Industry: an Overview
O. Debande & G. Chetrit – 07/09/01 – Final version
APPENDICES

Appendix 1/1
The European Audiovisual Industry: an Overview
O. Debande & G. Chetrit – 07/09/01 – Final version
APPENDIX 1: SELECTED TABLES AND FIGURES
Table A: Household expenditure on audiovisual equipment (EUR million)
TV-set
VCR
Camcorders
Blank video cassettes
DVD
players
Laser
Disc
players
PC
Computer
peripherals
Video-
game
console
Entertainment
software and
videogames
cartridge
1992
1998
p.a. %
1992
1998
p.a. %
1992
1998
p.a. %
1992
1998
p.a. %
1998
1998
1992
1998
p.a. %
1998
1998
1998
Austria
288 253 -2.1 141 87 -7.7 112 57 -10.6
61 40 -6.6 2 1 251 607
15.9 359 n.a.
n.a.
Belgium
293 304 0.6 139 108 -4.1 124 83 -6.5 67 35
-10.2 2 0 313
1220
25.5 507 30
44
Denmark
209 220 0.9 91 86 -0.9 28 n.a. n.a.
31 26 -2.8 n.a.
n.a.
17 26 6.6 n.a.
n.a.
n.a.
Finland
84 172 12.7 70 48 -6.1 n.a. n.a. n.a.
27 22 -3.2 n.a.
n.a.
35 82
15.3 n.a.
n.a.
n.a.
France
1875 1757 -1.1 999 705 -5.6 547 347 -7.3
511
370
-5.2 3 18 1653
4686
19.0 2357 205
476
Germany
3285 2856 -2.3 1392 854 -7.8 1075 470 -12.9
602
301
-10.9 29 1 2841
8859
20.9 4850 264
1203
Greece
132 102 -4.2 3 48 58.7 n.a.
n.a.
n.a.
34 16 -11.8 n.a.
n.a.
7 14
10.9 n.a.
n.a.
n.a.
Ireland
56 80 6.1 29 21 -5.2 n.a.
n.a.
n.a.
11 8 -5.6 n.a.
n.a.
6 10
9.3 n.a.
n.a.
n.a.
Italy
1545 1112 -5.3 658 282 -13.2 357 223 -7.5
258
152
-8.4 7 1 1787
2550
6.1 1160 91
83
Luxembourg
11 10 -1.6 6 4 -6.5
n.a.
n.a.
n.a.
3 2 -8.2
n.a.
n.a.
3 4
3.0 n.a.
n.a.
n.a.
Netherlands
469 618 4.7 215 197 -1.4 171 166 -0.5 98 56 -8.8 4 0 814
2367
19.5 987 19
140
Portugal
266 225 -2.8 57 43 -4.6 n.a.
n.a.
n.a.
31 13 -13.6 n.a.
n.a.
62 65 0.6 n.a.
n.a.
n.a.
Spain
1046 837 -3.6 344 264 -4.3 289 138 -11.6
177
77
-13.0 7 8 396
1492
24.7 819 143
170
Sweden
290 252 -2.3 114 98 -2.5 83 50 -8.1 53 39 -5.2 n.a.
n.a.
629 1750 18.6 693
4
44
UK
1098
1508 5.4 705 798 2.1 449 293 -6.9
261
158
-8.0 16 2 5463
7233
4.8 2018 258
364
EU
10947
10306 -1.0 4963 3643 -5.0 3235 1827 -9.1
2226
1316
-8.4 70 31 14278
30964
13.8 13751 1014
2524
US
Source: European Audiovisual Observatory (2000))

Appendix 1/2
The European Audiovisual Industry: an Overview
O. Debande & G. Chetrit – 07/09/01 – Final version
Table B: Release Windows
(months after theatrical release)
Video
Rental
Video Sale
PPV
Pay-TV
Free-to-air
Austria
2-6 n/a 6 12
6-18
Belgium
6-12 6-12 n/a 18-24 33-38
Denmark
3 6-12 9-12 12-18 18-24
Finland
6-12
n/a n/a 18-24 12-24
France
6-9 6-9
12
12-18 36
Germany
6
6 9-12 12-18 24-36
Greece
6
6 n/a 18-24 36-48
Ireland
6-12
n/a n/a 12-18 24-36
Italy
8 8
12 18 24
Netherlands
6 n/a
10 12 24
Portugal
12 12
n/a n/a 24
Spain
6
6
9 12-18 30-36
Sweden
6 n/a
6-9
18-24 18
Switzerland
4-12 8-12 n/a 12-18 18-24
UK
6 12
9-12 18 36
US
3 3
6-9
9-22
22
Source : Baskerville Communications Corp. (2000) and Vogel (2001) for the US
Table C: Production and P&A costs for major film releases, 1980-2000
MPAA total
releases
Average cost per film (USD millions)
P&A
share
Negatives Advertising
Total
2000
197 54.8 24.0 3.3
82.1
33%
1999
218 51.5 21.4 3.1
76.0
32%
1998
235 52.7 22.1 3.3
78.1
33%
1997
253 53.4 19.2 3.0
75.7
29%
1996
240 39.8 17.2 2.6
59.7
33%
1995
234 36.4 15.4 2.4
54.1
33%
1994
183 34.3 13.9 2.2
50.3
32%
1993
161 29.9 12.1 1.9
44.0
32%
1992
150 28.9 11.5 2.0
42.3
32%
1991
164 26.1 10.4 1.7
38.2
32%
1990
169 26.8 10.2 1.7
38.8
31%
1985
153 16.8 5.2 1.2
23.2
28%
1980
161 9.4 3.5
0.8
13.7
31%
80-00 (p.a.)
1.0% 9.2% 10.1% 7.3% 9.4%
Source : MPAA. (2001)
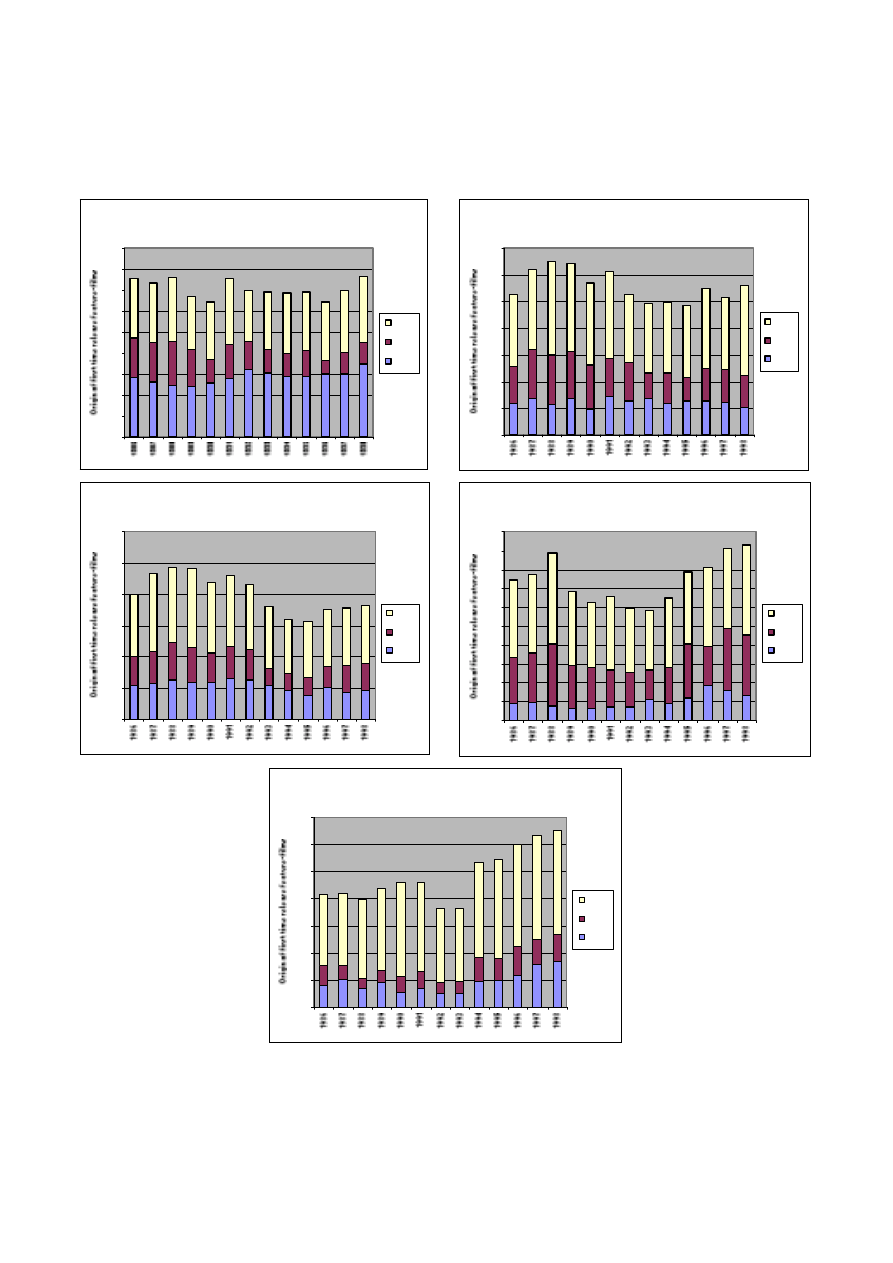
Appendix 1/3
The European Audiovisual Industry: an Overview
O. Debande & G. Chetrit – 07/09/01 – Final version
Figure A: Number of first time release feature-films by origin in the five major European
countries
France 1986-1998
0
50
100
150
200
250
300
350
400
450
US
NNE
Na t.
Ge rmany 1986-1998
0
50
100
150
200
250
300
350
US
NNE
Na t.
Italie 1986-1998
0
100
200
300
400
500
600
US
NNE
Na t.
Spain 1986-1998
0
50
100
150
200
250
300
350
400
450
500
US
NNE
Na t.
UK 1986-1998
0
50
100
150
200
250
300
350
US
NNE
Na t.
Source: European Audiovisual Observatory (2000)
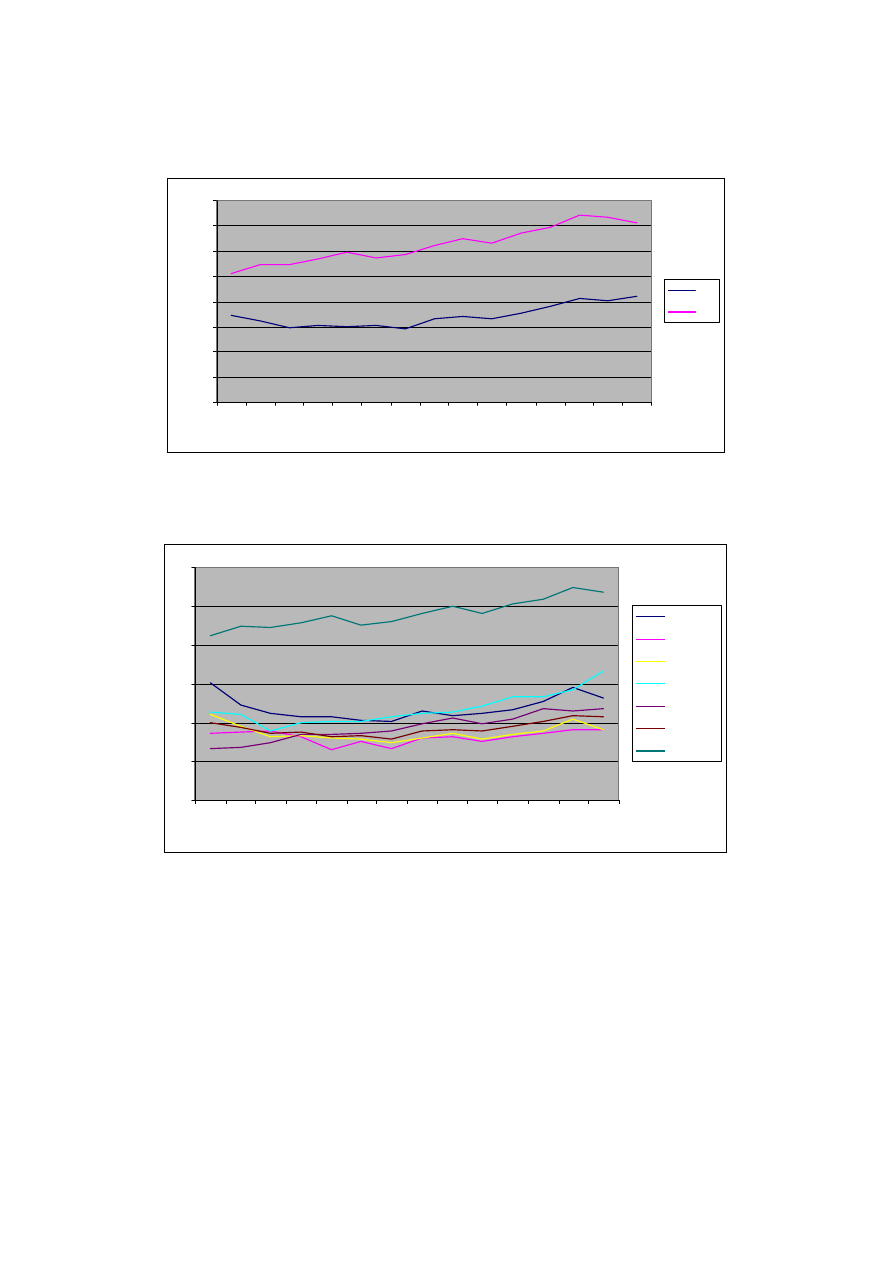
Appendix 1/4
The European Audiovisual Industry: an Overview
O. Debande & G. Chetrit – 07/09/01 – Final version
Figure B: Evolution of cinema attendance in the EU and in the US – 1986-1999
0
200
400
600
800
1000
1200
1400
1600
19
86
19
87
19
88
19
89
19
90
19
91
19
92
19
93
19
94
19
95
19
96
19
97
19
98
19
99
20
00
EU
US
Source: European Audiovisual Observatory (1996, 2000)
Figure C: Cinema attendance per head in the EU and in the US
0
1
2
3
4
5
6
1986
1987
1988
1989
1990
1991
1992
1993
1994
1995
1996
1997
1998
1999
France
Germany
Italy
Spain
UK
EU
US
Source: European Audiovisual Observatory (1996, 2000)

Appendix 1/5
The European Audiovisual Industry: an Overview
O. Debande & G. Chetrit – 07/09/01 – Final version
Figure D: Evolution of the number of screens per 100,000 inhabitant
0
2
4
6
8
10
12
14
16
19
86
19
87
19
88
19
89
19
90
19
91
19
92
19
93
19
94
19
95
19
96
19
97
19
98
19
99
France
Germany
Italy
Spain
UK
EU
US
Source: European Audiovisual Observatory (1996, 2000)

Appendix 2/1
The European Audiovisual Industry: an Overview
O. Debande & G. Chetrit – 07/09/01 – Final version
APPENDIX 2: PUBLIC AID MECHANISMS IN THE EUROPEAN UNION
Country
Development and production
Distribution (including marketing)
Austria
Direct & selective:
National (AFI) & Regional (Vienna Fund) funds
Automatic
Selective
Belgium
Direct & selective:
Flemish Fund – Wallonian Fund
Automatic:
Tax-relief scheme (to be set up)
Automatic
Selective
Denmark
Direct & selective:
National Fund (DFI) + Nordic Fund
Automatic
Selective
Finland
Direct & selective:
National Fund + Nordic Fund
Automatic
Selective
France
Direct & automatic:
National Fund (Compte de Soutien/COSIP)
Direct & selective:
National Fund (Avance sur recettes) and Regional Funds
(DRAC, Conseil régionaux, etc.)
Indirect & automatic :
Tax-relief scheme (SOFICA)
Automatic
Selective
Germany
Direct & selective:
National Funds (FFA, BMI) and Regional Funds (NRW
Filmstiftung, FilmBoard Berlin-Brandeburg, Filmförderung
Hamburg, Bayerische Filmförderung, etc.)
Indirect & automatic :
Tax-relief scheme (Anleger Modell)
Automatic
Selective
Greece
Direct & selective:
National Fund
Selective
Ireland
Direct & selective:
National Fund (Irish Film Board)
Indirect & selective:
Tax-relief scheme (Section 35)
Automatic
Selective
Italy
Direct & selective:
National and Regional Funds
Indirect & selective:
Tax-relief scheme (to be set up)
Automatic
Luxembourg
Direct & selective:
National Fund (FONSPA)
Indirect & selective:
Tax-relief scheme (CIAV)
Selective
Netherlands
Direct & selective:
National Fund and Regional Fund (Rotterdam Film Fund, etc.)
Indirect & selective:
Tax-relief scheme
Selective
Portugal
Direct & selective:
National Fund
Automatic
Selective
Spain
Direct & selective:
National Fund (ICAA) and Regional Funds (Catalogne,
Basque Country, Andalusia, etc)
Indirect & selective:
Tax-relief scheme
Automatic
Selective
Sweden
Direct & selective:
National Fund (SFI) + Nordic Fund
Automatic
Selective
UK
Direct & selective:
National Funds (The Arts Council/Lottery, British Film
Institute, British Screen, The Coproduction Fund, etc.) and
Regional Funds (Scottish Film Institute, etc.)
Indirect & selective:
Tax-relief scheme
Automatic
Selective
Source: Arendt and Steil (2001)

Appendix 3/1
The European Audiovisual Industry: an Overview
O. Debande & G. Chetrit – 07/09/01 – Final version
APPENDIX 3: AUDIOVISUAL GLOSSARY
Above-the-line costs:
Those production-period costs related to acquiring the story rights and
screenplay and signing the producer, director, and major members of the cast.
Acquisition deal:
Scheme in which the distributor bears the distribution costs (P&A costs…), but
the film’s production cost is already financed by other parties.
Artistic package:
Key ingredients (script, ‘bible’, trailer-if needed, director cast) shown at the
time of the search for financial partners.
Audience, primary or target:
A particular audience composition or demographic to which a message is
believed to have the most appeal and is therefore primarily directed.
Automatic aid system:
Subsidies based on the film’s success and calculated as a share of box-office
revenues of film and transferred automatically to the producer or the distributor
to help them finance their next film.
Below-the-line costs:
All costs, charges, and expenses incurred in the production of a film other than
the above-the-line costs, including such items as extras, art and set costs,
camera, electrical, wardrobe, transportations, raw film stock, etc.
Blind bidding:
The practice by which distributors, through a bid-request letter and without
having previously screened the film, request that interested exhibitors submit
bids to license a film for showing the market.
Block booking:
Governed by the Paramount consent decree of 1948, major distributors were
forbidden to employ the practice of tying together one or more films for
licensing within a market. The basic premise of this decree is that film must be
licensed one by one, cinema by cinema, so as to give all exhibitors equal
opportunities to show a given film.
Bouquet:
Package of channels.
Box-office receipt:
The money that has been paid by the public for admission (tickets) to see a
specific motion picture.
Cable TV:
Transmission of a television signal for home viewing by wire (cable) as
opposed to airwave broadcast. A fee or monthly subscription charge is
assessed. Often used in remote or isolated viewing areas, many cable systems
offer subscribers an opportunity to see films, sporting events, and other
programming not available on free TV.
Clearance:
The relative exclusivity a cinema specifies as a condition to licensing a film
within a market. A cinema may request an exclusive run within an entire market
or may request exclusivity for exhibition of a film only over those cinemas that
are in geographic proximity and may be considered competitive.
Completion bonds:
Guarantees provided to the financing institutions ensuring that the film which
they are financing will be delivered on time, on budget, and to the distributor’s
requirements. Completion bonds are supplied by specialised institutions with a
right of take over the production in case of default.
Convergence:
Combined evolution of the computer, telecommunication and audiovisual
sectors, meaning that providers of communication systems can deliver products
and services that compete with products and services now delivered by other
networks. For instance, an Internet TV can combine functions of a radio, TV,
PC and phone. This evolution implies an increase in the available equipment
options for the end-user to carry out a particular task.
Coproducer:
Production company or TV channel investing in a film produced by another
production company against a certain percentage of the rights and/or of the
future revenues
Cross-collateralisation:
The practice in film and music distribution of offsetting profits in one territory
or nation or category of earnings by losses in others. In practice, a distinction
could be done between the cross-collateralisation of rights, by which the
distributor offsets any loses incurred from a film’s cinema distribution against
profits from sales in other supports/medias (video, TV), and the cross-
collateralisation of territories through the acquisition of international
165
This glossary is essentially a compilation of Vogel’s glossary.

Appendix 3/2
The European Audiovisual Industry: an Overview
O. Debande & G. Chetrit – 07/09/01 – Final version
distribution rights. It is a practice that obviously favours the distributor.
Day and date release:
Simultaneous (same day, same date) release of a film on the sama day
throughout the country, generally with the maximum number of prints. A wide
opening release is a different strategy where the release dates are staggered,
starting with key cities. Finally, an intermediate technique is the platform
release where the number of initial prints is limited and released in few cities.
After on or two weeks, depending on the film’s success, the distributor could
broaden the distribution.
Deficit financing:
Funds are still needed, i.e. there is a difference between the expenses or credit
facility and the future revenues secured or committed through minimum
guarantees, pre-sales,… but all the rights have already been sold.
Delivery:
Supply of a completed film, i.e. a print with married sound and picture and front
and end credits
Digital television:
Transmission of television signals as digital rather than conventional analogue
signals. Advantages of digital TV over analogue one include superior image
resolution and audio quality for an equivalent bandwidth (i.e. capacity available
to transfer information – Hertz in analogue system, binary digits in digital one),
and consistent reception quality.
Distribution fee:
Contractual rate assessed by a distributor on the gross film revenue. Used in
computation of contingent compensation (i.e., profit participation).
Distributor:
Company in charge of the distribution of a film which could be a domestic film
distributor (negotiating with the exhibitor the release of the film and the number
of screens on which it is released; and bearing the marketing and advertising
expenses, on top of editing costs); an international distributor or sales agent (all-
rights selling of the film worldwide to national distributors) and a video
distributor (in charge of the copyright of all the tapes of the film and of the
marketing and advertising expenses). All of them could issue minimum
guarantee.
DVD:
Digital Versatile Disc – optical disk technology expected to replace the CD-
ROM disk (as well as the audio compact disc) in the future. A family of
standards which includes DVD Video, DVD Audio, DVD Rom, DVD Ram,
DVD R/W.
Exhibitor:
Company owning the cinema, negotiating with the distributors the release of the
films in cinema in order to optimise the revenues per screen.
Film library:
A library of films either produced by a producer or purchased by another
company.
Film rental:
The monies paid by the exhibitor to the distributor as rental fees for the right to
license a film for public showing. Generally computed weekly on a consecutive
seven-day basis. Film rental may be determined by several different methods,
including a 90:10 basis, sliding scale, fixed percentage, minimums (floor) that
relate specifically to the gross box-office receipts, or a flat-fee basis that is a
predetermined, unchanging amount. The film rental earned usually changes
from week to week, with the distributor’s relative share generally decreasing
and the exhibitor’s share increasing from the first through subsequent weeks.
Flow programme:
Type of TV programmes, corresponding to light and music entertainment,
sports, news/information talk-shows, produced immediate consumption and
programmed on a recurrent basis over relatively long periods of time.
Free-to-air television service: Services that can be received by the viewer without charge and which are
normally broadcast in the clear.
Gap financing:
Funds are still needed but there are also unsold territory rights
Gross rentals:
The total of the distributor’s share of the money taken in at the box office
computed on the basis of negotiated agreements between the distributor and the
exhibitor (also called gross proceeds).
In-house financing:
Scheme in which the studio funds the development, production and distribution
of the film.
Licence fee:
Compulsory levy on the ownership of the receiving equipment irrespective of
i
I
l li
f
h
i
f f
di
f
bli TV

Appendix 3/3
The European Audiovisual Industry: an Overview
O. Debande & G. Chetrit – 07/09/01 – Final version
its use. In general, licence fees are the main source of funding for public TV
channels (which could be complemented by advertising revenues), and fixed by
public authorities such to ensure that the public TV channel is able to cover the
costs of providing the (public) service.
Multimedia:
A term broadly used to describe the convergence of digitalised computer,
telecommunication, and cable technologies in the development of new
entertainment software applications that mix text, audio and video.
Multiplexes:
Usually defined as cinema theatres with 8 or more screens, megaplexes
corresponding to infrastructure with 16 or more screens.
Negative cost:
All of the various costs, charges, and expenses incurred in the acquisition and
production of a film. These include such items as facilities (sound stage, film
lab, editing room, etc.) and raw material (set construction, raw film stock, etc.).
Typically segregated as above-the-line production-period costs and post-
production-period costs.
Negative pick-up deal:
Commitment by the distributor or studio in the US to purchase distribution
rights at an agreed price to the producer. This commitment could be in some
case discounted to obtain cash financing as long as the producer has obtained a
completion guarantee bond..
Negotiated deal:
If the distributor rejects all bid offers submitted by exhibitors for the right to
license a film for exhibition within a market, the branch office will in turn either
rebid the picture, suggesting different terms, or sent out a notice to all exhibitors
by which it offers to negotiate openly in an effort to award the film to the
cinema that offers the most attractive deal.
Net profits (contractual):
Generally, the amount of gross receipts remaining after deducting distribution
fees, distribution expenses, negative cost (including interest), certain
deferments, and gross participations.
Net rental or distributor’s
gross receipts:
Percentage that the exhibitor pays to the distributor. Before calculating the
distributor’s share of the gross box-office, the cinema operator deducts his
expenses from the total gross.
Output Deal:
Agreements with distributors (e.g., foreign theatrical, pay-TV, etc.) in which the
distributor agrees to pay a specific amount for the distribution rights for a
specific number of films, with the price sometimes adjusted for box office
performance and production costs.
Pay-per-view:
A cable service that makes available to a subscriber an individual film, sporting
event, or concert on payment of a fee for that single event.
Pay-TV:
A generic term used to indicate subscriber-paid-for television, presented in an
uncut and uncensored format.
Print:
A copy made from the master for the purpose of film presentation. For all
intents and purposes, the print is the specific film release, because the master is
preserved for additional duplication. A distributor may make only a few copies
or more than 1,500 prints, depending on the expected or experienced success
with a particular film.
Print and advertising costs
(P&A):
Costs of prints, advertising, publicity, promotion and sometimes market
research for a film. The main items are: (i) print costs – subtitling or dubbing,
accessing or buying an inter-negative, production of the prints, shipping costs
and import taxes, costs for recutting due to censorship requirements; (ii)
advertising costs – designing and printing posters, creating trailers, advertising
space and time in various media, outdoor advertising; (iii) publicity costs – stills
and transparencies for distribution to media, press release; (iv) promotional
costs – merchandising, ties-ins and advance screenings.
Production-financing and
distribution (PDF):
Agreement in which a project is brought by an independent producer to the
studio, the latter providing funding for the production and distribution
Public broadcasters:
TV channels hold by public authorities and aiming to broadcast education,
information and entertainment programmes for all. Public authorities in general
regulate their activities.
Recoupment:
Ranking of the different parties having invested funds in a film: subsidy funds
d l
hil di
ib i
f
d
d fi
f
h
hibi

Appendix 3/4
The European Audiovisual Industry: an Overview
O. Debande & G. Chetrit – 07/09/01 – Final version
are recouped last, while distribution funds are recouped first after the exhibitors.
The distributors will first recoup his commission, then the distribution costs
(P&A) depending on the number of copies and money spend for the promotion
campaign; and then its minimum guarantee. Once the first ranking financial
contributors have recouped their investment, all other investors are recouped on
a “pari passu” basis depending on the share of the funds invested.
Sales agent:
Companies in charge of selling or licensing films to distributors in each
international territory
Selective aid system:
Various mechanisms, advance on receipts (or soft loans), specific grants…, for
audiovisual works aiming to support producers, distributors and exhibitors
having not access to the automatic aid system. The main objective is to
promote and ensure cultural diversity.
Set-top box:
Device enabling a TV set to receive and decode signals transmitted in a form
which the set was not originally designed to receive. In general, conventional
analogue televisions require a set-top box for cable and satellite TV and all
digital transmissions, whether cable, satellite or terrestrial. Set-top boxes are
also available which, when connected to the telephone line or cable, can enable
a television set to become an Internet terminal.
Share of audience:
The percentage of total households or population (either local or national
depending on survey criteria) that are using television or radio during a specific
time and that are also tuned into a particular program.
Stock programme:
Type of programme, corresponding to TV fiction, documentaries/magazine,
animation series, that could be included in the library of the broadcaster and
allow for a long-term exploitation.
Tax-shelter:
Subsidies providing a tax deduction benefits to sustain the production of films
Terms:
The conditions under which the distributor agrees to allow the exhibitor to show
its product in a given cinema and the exhibitor agrees to show the product.
Relates to such items as the basis on which film rental will be paid (as a
percentage of weekly gross box-office receipts or flat fee), the playing time
(number of weeks), choice of cinema, dollar participation in cooperative
advertising expenditure, clearance over other cinema, etc.
Video-on-Demand:
An event or film is transmitted once at the time chosen by the viewer, against
the payment of a fee.
Window:
In film and television, the period of time during which contracts permit
exclusive exhibition of a product on a specific media and a specific territory.
For example, domestic and international video/DVD market release window
would normally follow a film’s initial domestic cinema window, three to six
months later. This would be followed by the opening of pay-TV, free-TV, and
other windows.

Appendix 4/1
The European Audiovisual Industry: an Overview
O. Debande & G. Chetrit – 07/09/01 – Final version
APPENDIX 4: SOURCES OF INFORMATION
This appendix provides a selective review of various sources of on-line information for the AV
industry
. It is organised in five sections:
A. National sources: Links to national organisations active in the cinema and broadcasting
sectors. The scope of this section is essentially to list public or regulatory organisations and
not aiming to a exhaustive indexation of all private and public organisations active in the AV
(e.g., the links to private and public TV channels, US studios…). Links to such institutions
could be find by having recourse to standard search engine like Yahoo (see for instance,
http://dir.yahoo.com/News_and_Media/Television/Stations/By_Region/Countries/
http://dir.yahoo.com/News_and_Media/Radio/By_Region/Countries/
http://dir.yahoo.com/Entertainment/movies_and_film/organizations/
) or for the broadcasting
sector, through
B. International sources: Links to international institutions active in the AV sector (regulation,
statistics, studies…)
C. Professional
sources: Links to professional institutions connected to the AV sector
D. Trade journals: Links to various trade journals providing information, news, statistics (for free
or against subscription) on the AV sectors
E. Academic
journals: Link to journal(s) specialised in cultural economics
A. National
sources
Names
Websites
Austria
Austrian Boradcasting Regulatory body
Austrian Film Commission
Austrian Film Institute
Vlaams Commissariat voor de Media
www.vlaanderen.be/http://portal-svr1-
web.portal.vlaanderen.be:8080/Desktop
Servlet
(“cultuur, sport en media” section)
Flemish Film Institute
idem
Audiovisual services of the French-speaking Community
Conseil Supérieur de l’Audiovisuel de la Communauté
Française
Denmark
Danish Film Institute
Radio and television board
Finland
Finish Film Foundation
Telecommunication Administration Centre
France
Centre National de la Cinématographie (CNC)
Conseil Supérieur de l’Audiovisuel (CSA)
Médiamétrie
Germany
Arbeitsgemeinschaft der Landesmedienanstatlten
Filmförderungsanstalt (FFA)
Spitzenorganisation der Filmwirtschaft e.V. (SPIO)
Greece
Greek Film Centre (GFC)
166
See also the following website,
http://histv2.free.fr/cadrehistv3.htm
.

Appendix 4/2
The European Audiovisual Industry: an Overview
O. Debande & G. Chetrit – 07/09/01 – Final version
Ireland
Film Institue of Ireland
Independent Radio and Television Commission (IRTC)
Irish Film Board
Irish Business and Employers Confederation
Italy
Autorità per le Garanzie nelle Comunicazioni (AGCOM)
Associazione Nazionale Industrie Cinematografiche ed Affini
Associazione Nazionale Esercenti Cinema
Società Italiana degli Autori ed Editori
Luxembourg
Service des médias et de l’audiovisuel
Netherlands
Commissariat voor de Media
National Filmfund
Holland Film
www.hollandfilm.nl/factsfigures
Portugal
Alta Autoridade para a Communicação Social (AACS)
Instituto do Cinema, Audiovisuel e Multimedia
Inspecção Geral das Actividades Culturais
Spain
Insituto de la Cinematografia y de las Artes Audiovisuales
Sweden
Swedish Broadcasting Commission
Swedish Film Institute
UK
Broadcasting Standards Commission (BSC)
British Council
British Film Institute
Department for Culture, Media and Sport
Film Council
Independent Television Commission (ITC)
Radio Authority
B. International
sources
European Union :
European Audiovisual Observatory (OBS)
European Broadcasting Union (EBU)
European Commission (EC)
www.europa.eu.int/comm/avpolicy/index_fr.htm
European Media Landscape, providing general
information about the media in several countries in
Europe
European Media Landscape
Institut de l’Audiovisuel et des télécommunications en
Europe (IDATE)
Media Salles (MS)
Nordicom
Australia :
Australian Film Institute (AFI), promoting Australian film and TV in
Australia and overseas

Appendix 4/3
The European Audiovisual Industry: an Overview
O. Debande & G. Chetrit – 07/09/01 – Final version
Australian Broadcasting Authority (ABA)
Australian Film Commission (AFC)
Canada :
Conseil de la radiodiffusion et des télécommunications canadiennes (CRTC)
Statistics Canada
United-States:
Federal Communication Commission (FCC)
C. Professional
associations
American Film Marketing Association (AFMA), the trade association for the
independent film and television industry
Association of Commercial Television in Europe (ACT)
European Cable Communication Association (ECCA)
International Federation of the Phonographic Industry (IFPI)
International Video Federation (IVF)
Motion Picture Association of America (MPAA), the trade association
representing the interests of seven
168
of the major international producers and
distributors of cinema, home video entertainment and television
programming.
Motion Picture Theatre Association of Canada (MPTAC)
D.
Trade journals or on-line information sources
Cine Box Office (
): Site providing on-line, data collected from the
distributors on box-office performances in France. Cinefil (
) and AlloCiné
) are other sites providing this type of information.
Internet movie database (
): International organisation providing up-to-date free
information on films and television programmes (including budget, box-office results…).
Hollywood Reporter (
): Journal providing daily on the cinema industry.
Kagan Associates (
): Site providing news on the media industry.
Le Film Francais (
): Sites providing daily on-line news service for the film
industry in France (free of charge).
Mediabiz (
): Sites providing daily on-line news service for the film industry in
Germany (free of charge). The two sites, Moviedata (
) and Movieline
(
) provide the same type of information.
ScreenDaily (
): Site, produced by Screen International, providing daily on-line
news service for the film industry (free of charge).
ScreenDigest (
): Journal providing monthly business media news covering the
film, video, television and multimedia markets.
Variety (
): Journal providing box-office information and current news and reviews
on the cinema industry.
E. Academic
Journals
Journal of Cultural Economics (
www.wkap.nl/journalhome.htm/0885-2545
167
This section does not cover all various professional associations active in the cinema or audiovisual industry, like Fédération Européenne
des Réalisateurs de l'audiovisuel (FERA,
www.fera-matin.org/fera/default.html
), Fédération Internationale des Associations de Producteurs
de Films (FIAPF,
www.fiapf.org/
), etc.
168
It members are: Buena Vista International Inc. (Walt Disney); Sony Pictures Entertainment Inc. (Columbia/Tristar); Metro-Goldwyn-
Mayer Inc. (MGM/United Artists); Paramount Pictures Association; Twentieth Century Fox International Corporation; Vivendi Universal
SA; and AOL Time Warner Inc.
Document Outline
- CONTENTS
- EXECUTIVE SUMMARY
- 1.INTRODUCTION
- 2.THE EUROPEAN AUDIOVISUAL INDUSTRY
- 3.ECONOMIC CHARACTERISTICS OF AUDIOVISUAL PRODUCTS
- 4.MARKET STRUCTURE OF THE AUDIOVISUAL INDUSTRY
- 5.FINANCING OF THE AUDIOVISUAL INDUSTRY
- REFERENCES
- APPENDICES
Wyszukiwarka
Podobne podstrony:
An analysis of the European low Nieznany
Heathen Ethics and Values An overview of heathen ethics including the Nine Noble Virtues and the Th
Jim Marrs An Overview of the War on Terror
Piotr Siuda Prosumption in the Pop Industry An Analysis of Polish Entertainment Companies
The law of the European Union
The?fects of Industrialization on Society
Orzeczenia, dyrektywa 200438, DIRECTIVE 2004/58/EC OF THE EUROPEAN PARLIAMENT AND OF THE COUNCIL of
The?onomic Underpinnings of the First British Industrial R
MERCOURIOS GEORGIADIS THE OBSIDIAN IN THE AEGEAN BEYOND MELOS AN OUTLOOK FROM YALI
Geodynamic evolution of the European Variscan fold belt
Discuss some of the issues raised in An Inspector?ls
Clint Leung An Overview of Canadian Artic Inuit Art (2006)
Law An Overview
The European Union is the world
Master Wonhyo An Overview of His Life and Teachings by Byeong Jo Jeong (2010)
więcej podobnych podstron