Harvard Business Review Online | How Much Cash Does Your Company Need?
Click here to visit:
How Much Cash Does Your Company
Need?
More than you think—a lot more—if yours is a knowledge-
based corporation. That’s because you need to provide for
intangible liabilities—the investments a company has to make
to realize the benefits of its knowledge.
by Richard Passov
Richard Passov is the treasurer of Pfizer. He is based in New York.
After its merger with rival Warner-Lambert in 2000, New York–based pharmaceutical giant Pfizer found itself
sitting on a net cash position approaching $6 billion. That seemed extraordinarily conservative for a company
whose products generated close to $30 billion in revenues. Those products included some of the world’s best-
selling drugs. The anticholesterol blockbuster Lipitor alone generated worldwide revenues in excess of $7 billion
in 2001.
Most large companies with revenues that healthy would increase their leverage, or the amount of debt they
carry, thereby unlocking tremendous value for their shareholders, both from tax benefits and from the market’s
well-documented perception that managers with less money to spend will spend it more wisely. Consider Bank of
America. Its capital structure, like that of most banks, relies heavily on debt. The value of the tax shields alone
accounts for approximately one-third of the company’s $120 billion market capitalization. But is this kind of
strategy appropriate for a knowledge-based company like Pfizer? To answer that question, Tim Opler of Credit
Suisse First Boston and I undertook an in-depth study of the knowledge-based businesses that were most
closely comparable to Pfizer. There, we saw a rather different picture: The world’s largest and most successful
technology and life sciences companies were consistently holding significant net cash positions.
Like Pfizer, these companies had market valuations that were much greater than the value attributable to their
ongoing businesses, a premium that reflects these companies’ ability to create new products through R&D. And
like Pfizer’s, these companies’ assets were very risky—a fact often obscured by the companies’ balance sheet
structure. Pfizer shares, for example, had approximately the same price volatility (30%) as those of Bank of
America in 2001. But Pfizer had a negative leverage ratio of 0.3:1 where Bank of America had a ratio
approaching 10:1. If the equity volatilities are adjusted to eliminate the effect of the two companies’ balance
sheet structures—treating both companies as if they were wholly equity financed and had no cash—we see that
Pfizer has an underlying asset volatility of close to 30% while Bank of America has a volatility closer to 5%.
Because of this higher underlying volatility, Pfizer and the other knowledge companies we looked at were in a
group apart from other large corporations.
We believe that these companies’ decisions to run large cash balances is one of the key factors in sustaining the
value of their intangible assets—which typically comprise a substantial portion of overall valuations for
knowledge companies. Only by consistently investing in their intangible assets can knowledge companies hope
to preserve the value of those assets. A company that finds itself unable to meet such commitments because
unfavorable market conditions reduce its operating cash flows will find its share price suffering almost as much
as if it were to default on its debts. By the same token, with the right balance sheet, knowledge companies can
profitably insure against the risk of failing to sustain value-added investments in difficult times. An optimal
capital structure that calls for significant cash balances is at odds with the results of a traditional capital
structure analysis but explains the financial policies of many well-run knowledge companies.
http://harvardbusinessonline.hbsp.harvard.edu/b01/en/hbr/hbrsa/current/0311/article/R0311JPrint.jhtml (1 of 8) [04-Nov-03 21:39:10]

Harvard Business Review Online | How Much Cash Does Your Company Need?
Funding the Intangible
To see why knowledge companies aren’t suited to traditional capital structures, consider again Pfizer. In mid-
2001, the company’s market valuation was in excess of $200 billion. Of that amount, Wall Street analysts
estimated that more than 30% was derived from the company’s R&D pipeline and its worldwide branding and
marketing capabilities. A large portion of the drug pipeline was in advanced stages of development, but
significant investment and risks were still associated with realizing the potential value. Furthermore, a great deal
of value was attributed to early-stage development projects. Indeed, looking forward, Pfizer’s anticipated
revenue stream relied more and more on products yet to be developed and less on those already being
marketed.
Pfizer’s intangible assets are the product of heavy ongoing investment. The company’s R&D alone consumes
about $7 billion a year. What’s more, the productivity of the company’s research scientists depends on
maintaining a vast, interconnected IT infrastructure. Such investments are not treated as liabilities in a
traditional capital structure analysis. To see why that’s a problem, consider what would happen if Pfizer found
itself in a situation where internally generated funds could no longer sustain R&D. Finance theory maintains that
the market will always be willing to provide funds for a good investment opportunity. Based on that reasoning,
companies with promising pipelines should always be able to find funding for R&D. History has shown, however,
that in times of need, external financing can be exorbitantly expensive or simply unavailable for knowledge
companies.
Intel experienced just such a funding crisis in the early 1980s. At that time, the company’s 80286
microprocessor chip had just emerged as the key hardware component for IBM’s burgeoning personal computer
business. Unfortunately, Intel was at the same time involved in producing DRAM memory chips, which were
becoming commoditized due to competition from Japanese manufacturers. Intel’s cash position dwindled and its
debt rose to the point where the company was unable to make the capital expenditures necessary to complete
the development of its microprocessors. Intel was forced to raise new equity capital from its primary business
partner, IBM, which purchased 12% of the company for $250 million. The capital infusion allowed Intel to
continue its R&D program and build manufacturing plants for new microprocessors while simultaneously
sustaining a costly transition away from the DRAM market.
Arguably, Intel’s inability to meet its R&D commitment cost its shareholders as much as a debt default would
have. Like a debt crisis, the funding crisis had forced the company into financial distress. Had Intel not shrewdly
repurchased the stake in the late 1980s, by 2001, IBM would have earned a 100-fold increase on its initial
investment.
Of course, Intel and Pfizer are not the only companies that have large capital commitments. Oil companies, for
example, spend huge amounts of money on exploration and development. Yet they often use more leverage and
seem less vulnerable to the whims of the capital markets. The difference in financial strategies seems to lie in
two important distinctions between tangible and intangible assets. These factors also explain the relatively high
asset volatility of Intel, Pfizer, and other successful knowledge-based companies.
Intangible assets are company dependent.
The value of tangible assets—even those that require
considerable investments to exploit—is usually widely recognized by outside investors. An oil reserve, for
example, has a generally agreed-upon value, regardless of the company that owns it. Energy giant
ChevronTexaco has to spend billions to exploit its reserves. But because the value of those reserves can be
estimated and easily communicated, the company usually can find the money to fund development regardless of
the state of its finances. By contrast, the value of a company’s intangible assets is typically understood only by
the company itself or its close partners. If the company fails to invest in maintaining the value of its intangible
assets, no one else is likely to volunteer. In other words, the value of intangible assets is highly dependent on a
company’s own ability to fund those assets, while the value of tangible assets is independent of the company. In
Intel’s case, nobody had any idea in 1983 what a huge market microprocessors would become, which explains
why the company could obtain funding only on expensive terms from IBM. This experience cast into sharp relief
the value of holding cash reserves, and Intel went on to build a strong balance sheet to provide insurance
against potential future funding needs.
Intangible liabilities cannot be hedged.
The second reason intangible assets are different from tangible ones
is that the risk that a company will be unable to meet commitments on intangible assets cannot be easily
hedged. The value of an oil company’s exploration and development budget is subject to the variable market
pricing of oil; a sharp fall in oil prices reduces the value of those projects. However, the risk of a fall in oil prices
can be hedged in the financial markets, which allows the company to preserve the value of its exploration and
development projects even when business conditions deteriorate. Even if it decides not to protect its exploration
and development projects in this way, the company enjoys a natural hedge because the price of oil is highly
correlated with cash flows. When the firm’s cash flows are low, so is the expected value of exploration and
development. That means the company is most likely to be short on funds when it least needs to spend the
money on the asset. By contrast, a knowledge company’s primary risk—whether or not the various molecular
compounds in its pipeline will react as hoped, for example—is impossible to hedge in the financial markets. That
http://harvardbusinessonline.hbsp.harvard.edu/b01/en/hbr/hbrsa/current/0311/article/R0311JPrint.jhtml (2 of 8) [04-Nov-03 21:39:10]
Harvard Business Review Online | How Much Cash Does Your Company Need?
risk is also unlikely to be correlated with the company’s cash flows. A particular molecule may react as planned,
but the company may run out of funds before discovering that. Unlike an oil company, therefore, a
pharmaceutical company may face a funding crisis just when the value of continuing its research is highest. The
only way to manage that risk is to ensure that the company always has on hand enough liquid
assets—essentially, cash—to meet its R&D liabilities.
If the defining characteristic of a liability is that the company’s inability to meet it triggers financial distress, then
it is only logical that R&D expenditures of Intel, Pfizer, and their peer companies should be considered
liabilities—just as inescapable a commitment as if they were a debt obligation. Companies do not currently treat
R&D and comparable investments in intangible assets as balance sheet items. But from an economic
perspective, they probably should. After all, if the market is placing a value on the promise of future success in
drug discovery, for example, it is also expecting that the resources necessary to discover these drugs will be
available to spend as needed.
Reoptimizing the Balance Sheet
Once a company’s intangible assets—and the unhedgeable liability associated with them—are recognized as
being capable of causing financial distress, a key input variable into the calculation of optimal capital structure
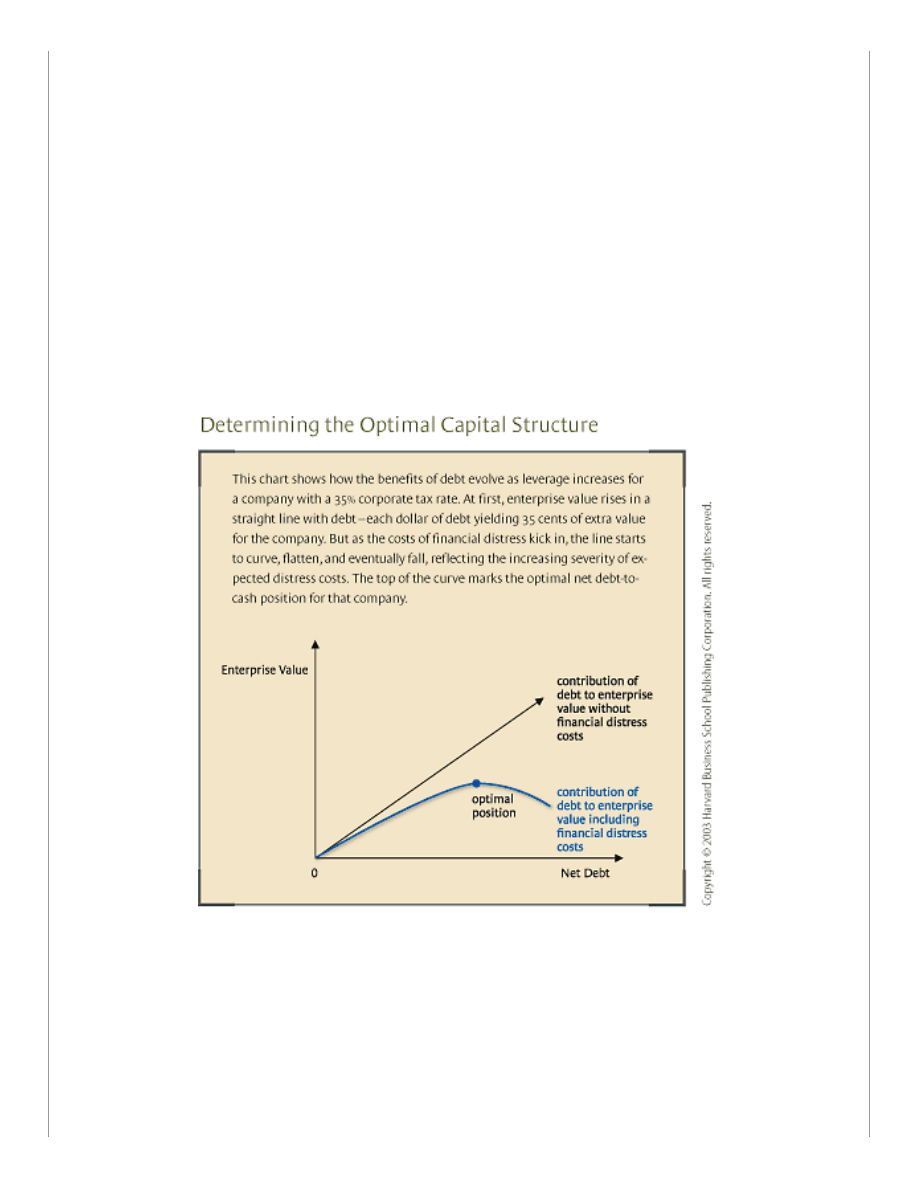
changes. Traditionally, companies determine the optimal capital structure by calculating the point at which the
expected costs of financial distress from the likelihood of defaulting on debt begin to outweigh the tax benefits of
debt—unlike dividends, debt interest payments are tax deductible. (See the exhibit “Determining the Optimal
Capital Structure.”)
Let’s look at the numbers in more detail. The tax benefit, or tax shield as it is usually called, is determined by
the corporate tax rate: Simply multiply the amount of debt by the marginal corporate tax rate. Arriving at the
cost of defaulting on debt is a bit more complicated: The probability that the company will not be able to meet
its debt obligations is multiplied by the likely impact of that default, should it happen, on the company’s value.
One practical way to estimate the probability of default is to look at the historical volatility of a company’s cash
flows. From that, you can determine through statistical analysis how frequently a company’s cash flows are likely
to be less than the level of interest payable for a given level of debt. Obviously, the greater the size of the
interest bill, the higher that probability. If a company’s historical cash flows are not available, analysts can use
industry data or empirical studies that provide default rates. Debts rated Aaa by Moody’s, for instance, have
historically had a 0.1% chance of defaulting within five years, a Baa rating a 1.8% chance, and a B rating a 32%
chance. A more ambitious analyst could also use default rates implied by an analysis of spreads on corporate
http://harvardbusinessonline.hbsp.harvard.edu/b01/en/hbr/hbrsa/current/0311/article/R0311JPrint.jhtml (3 of 8) [04-Nov-03 21:39:10]

Harvard Business Review Online | How Much Cash Does Your Company Need?
bonds or credit derivatives.
The impact of default can be estimated by looking at the empirical data. Research shows that a typical company
will lose roughly 20% of its enterprise value (market value of the company’s shares plus the value of its debt
less cash) in times of financial distress. Multiplying this number by the probability of default determined above
produces the expected cost of default, or the amount a company would want to insure itself for, if it could. So
for an average company with a default probability of 5% over a five-year horizon, the expected cost of default,
over that same time period, would be 1% of the firm’s enterprise value.
The underlying assumption in using this method of calculating optimal capital structure is that a company’s debt
level is the principal determinant of whether or not a company will suffer financial distress. But as we’ve argued,
a company can lose just as much value, if not more, if it cannot fund the intangible liabilities associated with its
intangible assets. In other words, financial distress costs can kick in even while a company has a net-cash
position. On that basis, the calculation needs to be adjusted. First, the probability of default must be adjusted to
encompass the probability of distress: It should be determined not by the probability of interest costs exceeding
cash flow but by the probability of interest costs plus R&D expenses (or other capital expenditures) exceeding
cash flow. Similarly, the impact of default must be adjusted to reflect the fact that the value of intangible assets
tends to be much more volatile than that of tangible ones and their higher volatility exposes the company to
greater financial risk.
Recalculating Distress Probability.
The adjustment for this is quite simple, since all you are doing is raising
the cash flow bar. In effect, you’re increasing interest costs by the size of your R&D budget, or at least that
portion of it for which it would be difficult to obtain external financing on reasonable terms. Applying historical
cash flow volatility to this new number gives you the probability of distress due to default on intangible liabilities.
Companies may wish to make even more precise estimates. At Pfizer, for instance, an analysis of our historical
cash flows allows us to quantify the impact of losing patent protection on currently marketed products. Another
key risk we consider is the possibility that a drug might be withdrawn from the market due to safety concerns.
To account for that, we use industry data to model the likelihood of an approved drug being pulled from the
market.
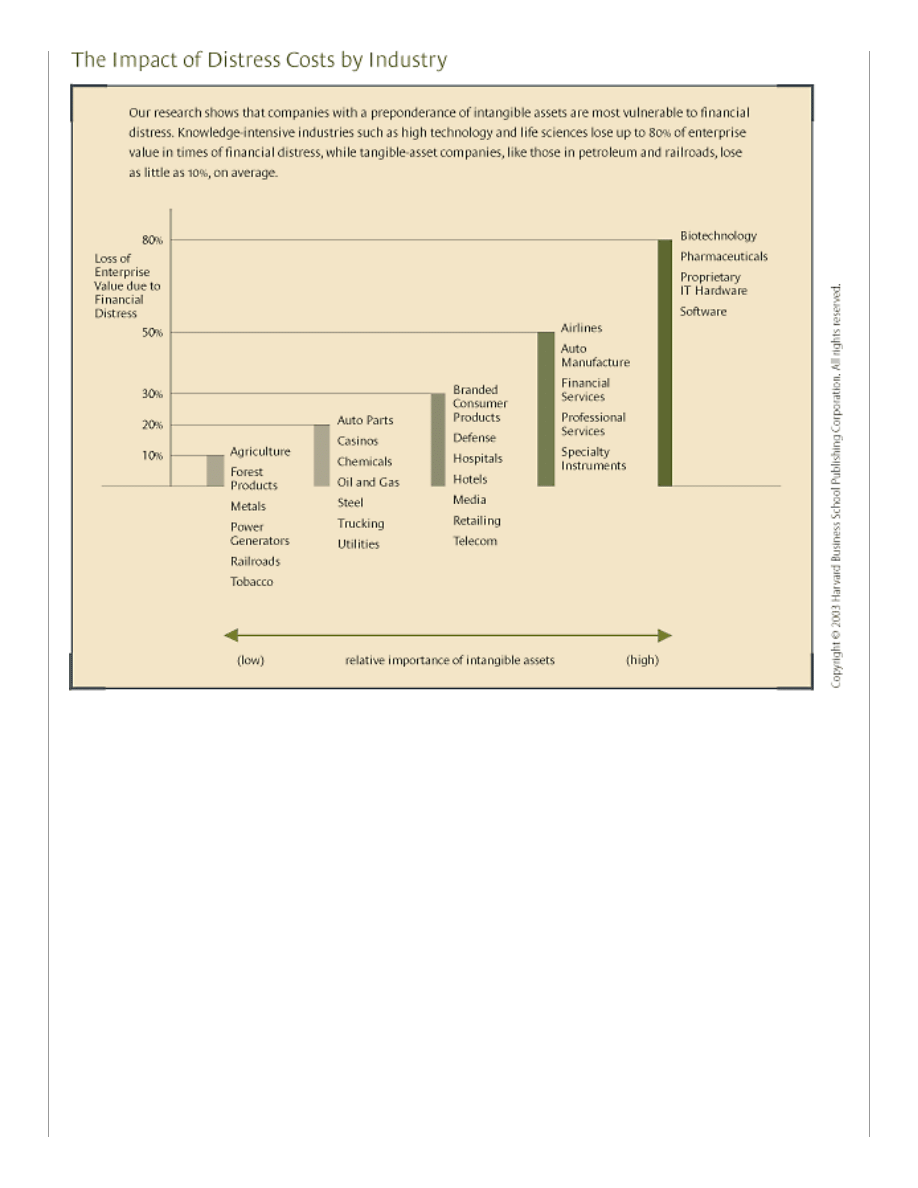
Recalculating Distress Impact.
Intangible assets tend to be more volatile than tangible ones, so one would
expect companies with substantial intangible assets to suffer more in financial distress than companies whose
assets were largely tangible. Our own empirical research confirms this. We found that the extent of value loss
during a period of financial difficulty is positively correlated to a company’s underlying business risk—that is, its
asset volatility. (See the exhibit “The Impact of Distress Costs by Industry.”) When calculating the impact of
distress costs, companies must take this higher volatility into account.
http://harvardbusinessonline.hbsp.harvard.edu/b01/en/hbr/hbrsa/current/0311/article/R0311JPrint.jhtml (4 of 8) [04-Nov-03 21:39:10]
Harvard Business Review Online | How Much Cash Does Your Company Need?
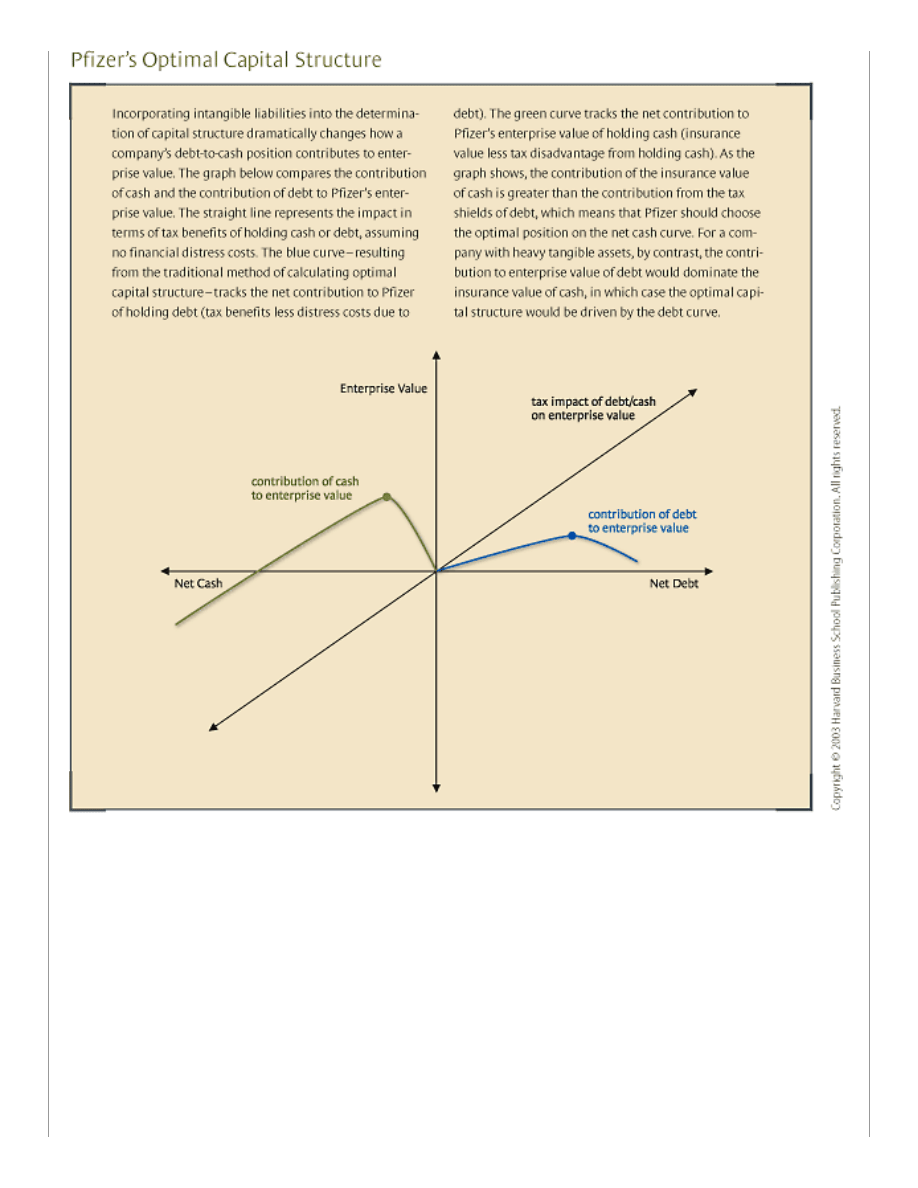
Running the numbers for Pfizer, we found that the company’s optimal capital structure—the structure that
maximized the company’s value—called for holding a positive net financial balance, as shown in the exhibit
“Pfizer’s Optimal Capital Structure.” That stands in sharp contrast with the optimal capital structure predicted by
a conventional approach—a net debt position entirely inadequate to maintain the value of Pfizer’s intangible
assets.
http://harvardbusinessonline.hbsp.harvard.edu/b01/en/hbr/hbrsa/current/0311/article/R0311JPrint.jhtml (5 of 8) [04-Nov-03 21:39:10]
Harvard Business Review Online | How Much Cash Does Your Company Need?
Beyond Pfizer
Our model does not apply only to knowledge-based firms; it can be used to calculate the optimal capital
structure of all types of firms. Consider again ChevronTexaco, which has $99 billion in annual revenues, nearly
$10 billion in cash flow from operations, and annual capital expenditures approaching $8 billion in 2002. While
the company has comparable capital outlays to those of Pfizer, it does not rely nearly as heavily on intangible
assets.
The bulk of ChevronTexaco’s capital commitments consists of exploration and development expenditures. As we
have pointed out, development costs can be easily hedged. Exploration, however, counts as a true liability. To
calculate the probability of distress at various levels of leverage, therefore, we looked at the volatility of
ChevronTexaco’s cash flows and applied that to the combined average historical interest and exploration costs.
To estimate the impact of financial distress, we looked at our empirical data, which showed that oil companies
typically lose about 20% of their enterprise value in times of distress. Our analysis indicated an optimal net debt
level of approximately $10 billion for the company. This compares with ChevronTexaco’s actual net debt position
of $12 billion as of year-end 2002. A conventional model based on the weighted average cost of capital approach
would suggest that ChevronTexaco should have debt in excess of $20 billion. Clearly, our model does a better
http://harvardbusinessonline.hbsp.harvard.edu/b01/en/hbr/hbrsa/current/0311/article/R0311JPrint.jhtml (6 of 8) [04-Nov-03 21:39:10]

Harvard Business Review Online | How Much Cash Does Your Company Need?
job of explaining this well-run company’s financial policy.
Does our model always find that traditional firms can operate with leverage while knowledge-based firms
shouldn’t? Not necessarily. Consider the case of Oracle, the enterprise software giant that had nearly $9.7 billion
in revenues in 2002. Approximately 60% of Oracle’s revenues come from licenses associated with its software,
while nearly 40% come from product support and consulting services. To counter fierce competition from giants
like Microsoft and IBM, as well as newer competitors like SAP, Siebel, and PeopleSoft, Oracle invests
considerable sums in R&D, marketing, and training. More than 10% of annual revenues are committed to the
research and development of new products. In 2001 and 2002, the company spent over $1.4 billion each year
on capital expenditures and R&D. To determine the probability of default for various net cash-to-debt scenarios,
we used historical cash flow volatility, analysts’ projections for the company’s future debt, and R&D
expenditures. To estimate the impact of default, we looked at the cost for companies with asset volatility
comparable to Oracle’s.
The value of intangible assets is highly
dependent on a company’s own ability to fund
those assets, while the value of tangible assets
is independent of the company.
Our analysis suggested an optimal net cash position of approximately $1 billion, which contrasts with Oracle’s
actual net cash position of around $6 billion. This finding raises some strategic questions. If current predictions
about the slowing growth potential in the software industry come to pass, then there may come a time when
even Oracle shareholders would fare better with a nice, steady dividend and leverage in the company’s capital
structure. (It is interesting to note that Oracle’s move to acquire PeopleSoft, were it funded by debt, would bring
its net cash position much closer to the optimal level predicted by our model.)
Business strategy and financial strategy are inextricably linked. Therefore, companies must develop capital
policies in light of their business risks. Indeed, balance sheet management is best viewed as a form of risk
management to be coordinated with the other ways in which companies manage business and financial risks.
Johnson & Johnson’s consumer products business, for example, has had strong and stable operating cash flows,
which tend to buffer the potential liquidity requirements of the company’s riskier pharmaceutical business. As a
result, Johnson & Johnson can afford to have a smaller financial asset position than would a pure-play
pharmaceutical company. (For more on the risk implications of balance sheet structure, see the sidebar
“Managing the Cash Position.”)
Managing the Cash Position
Sidebar R0311J_A (Located at the end of this
article)
• • •
Intangible assets are the “dark matter” of the business universe. Since we can only observe them by their
effects, it’s difficult to understand and catalog them, which is precisely why the accounting balance sheet differs
from the economic one. Accountants like to deal in concrete fact, while economists are happy enough with
theory. But even accountants cannot deny that the effects of intangible assets are far-reaching. The ability of
intangible assets to influence the likelihood and degree of financial distress through the liabilities they create is
not the least important of those effects. By suggesting ways to measure the effects, we hope to have made a
small contribution toward incorporating intangible assets into capital structure analysis.
Reprint Number R0311J
Managing the Cash Position
Sidebar R0311J_A
http://harvardbusinessonline.hbsp.harvard.edu/b01/en/hbr/hbrsa/current/0311/article/R0311JPrint.jhtml (7 of 8) [04-Nov-03 21:39:10]

Harvard Business Review Online | How Much Cash Does Your Company Need?
The way in which companies create and manage their optimal cash (or debt) positions can make a difference to
shareholder value. If a company issues short-term debt and holds the proceeds on the balance in matching short-
term investments, for instance, it will create no value in terms of managing its business risks. On the other
hand, a company that borrows longer term and invests at a shorter term creates a pool of liquidity that can be
accessed to cover cash flow shortfalls until the debt matures. By reducing the risk of default in this way,
companies increase their overall value. This is one reason why automotive and finance companies often borrow
with maturities that are longer than the assets they hold.
In deciding how to manage a company’s net cash, the first rule is to make sure that the asset you invest in is
not subject to the same risks as those you are insuring against with that cash. A technology company that holds
cash to ensure the completion of a multiyear development project even when its core business is failing should
not invest those funds in other related technology companies. That doesn’t mean, however, that you should
avoid investing your cash in risky assets altogether. On the contrary, by avoiding risky assets, your company
may well miss out on valuable opportunities.
Imagine that your company has determined that it is too highly leveraged and starts reducing its debt by adding
to its cash position. Each extra dollar of cash confers a marginal benefit in that it lowers the company’s expected
distress costs. But that marginal benefit will gradually fall until the company achieves its optimal cash position,
after which the marginal benefit of holding an extra dollar of cash turns negative, because the benefit of a dollar
of debt starts to outweigh the benefit of a dollar of cash. The first dollar of cash, therefore, makes more
difference to the company’s overall value than the last dollar of cash. Given that difference, we believe that it
makes sense for a company to allocate its cash position to reflect the different values of each dollar held as
cash. Because the first dollar is worth the most, it should be invested in the safest possible asset. By the same
token, it may make sense to put the last dollar of cash in a riskier security.
Copyright © 2003 Harvard Business School Publishing.
This content may not be reproduced or transmitted in any form or by any means, electronic or
mechanical, including photocopy, recording, or any information storage or retrieval system, without
written permission. Requests for permission should be directed to permissions@hbsp.harvard.edu, 1-
888-500-1020, or mailed to Permissions, Harvard Business School Publishing, 60 Harvard Way,
Boston, MA 02163.
http://harvardbusinessonline.hbsp.harvard.edu/b01/en/hbr/hbrsa/current/0311/article/R0311JPrint.jhtml (8 of 8) [04-Nov-03 21:39:10]
Document Outline
Wyszukiwarka
Podobne podstrony:
How Many Friends Does One Person Need Prof Robin Dunbar
Financial Times Prentice Hall, Executive Briefings, Business Continuity Management How To Protect Y
Jossey Bass Decision Management How To Assure Better Decisions In Your Company
2003 11 12
2003 11 28
LaRouche Lyndon, How the British East India Company Took Over the USA
2003 11 16
2003 11 10
2003 11 36
2003 11 25
How To Naturally Increase your Height
2003 11 14
2003 11 42
FGAG explained 2003 11 17 de
2003 11 24
2003 11 14 2011
2003 11 39
2003 11 20
więcej podobnych podstron