
ARTICLE
Received 20 Sep 2016
|
Accepted 1 Nov 2016
|
Published 9 Dec 2016
Carbon monoxide in an extremely
metal-poor galaxy
Yong Shi
1,2,3
, Junzhi Wang
4,5
, Zhi-Yu Zhang
6,7
, Yu Gao
5,8
, Cai-Na Hao
9
, Xiao-Yang Xia
9
& Qiusheng Gu
1,2,3
Extremely metal-poor galaxies with metallicity below 10% of the solar value in the local
universe are the best analogues to investigating the interstellar medium at a quasi-primitive
environment in the early universe. In spite of the ongoing formation of stars in these galaxies,
the presence of molecular gas (which is known to provide the material reservoir for star
formation in galaxies such as our Milky Way) remains unclear. Here we report the detection
of carbon monoxide (CO), the primary tracer of molecular gas, in a galaxy with 7% solar
metallicity, with additional detections in two galaxies at higher metallicities. Such detections
offer direct evidence for the existence of molecular gas in these galaxies that contain
few metals. Using archived infrared data, it is shown that the molecular gas mass per
CO luminosity at extremely low metallicity is approximately one-thousand times the
Milky Way value.
DOI: 10.1038/ncomms13789
OPEN
1
School of Astronomy and Space Science, Nanjing University, Nanjing 210093, China.
2
Key Laboratory of Modern Astronomy and Astrophysics (Nanjing
University), Ministry of Education, Nanjing 210093, China.
3
Collaborative Innovation Center of Modern Astronomy and Space Exploration, Nanjing 210093,
China.
4
Shanghai Astronomical Observatory, Chinese Academy of Sciences, 80 Nandan Road, Shanghai 200030, China.
5
Key Laboratory of Radio
Astronomy, Chinese Academy of Sciences, Nanjing 210008, China.
6
Institute for Astronomy, University of Edinburgh, Royal Observatory, Blackford Hill,
Edinburgh EH9 3HJ, UK.
7
ESO, Karl-Schwarzschild-Strasse 2, Garching 85748, Germany.
8
Purple Mountain Observatory, Chinese Academy of Sciences,
2 West Beijing Road, Nanjing 210008, China.
9
Tianjin Astrophysics Center, Tianjin Normal University, Tianjin 300387, China. Correspondence and requests
for materials should be addressed to Y.S. (email: yshipku@gmail.com).
NATURE COMMUNICATIONS
| 7:13789 | DOI: 10.1038/ncomms13789 | www.nature.com/naturecommunications
1
G
alaxies in the early universe contained few metals
(elements heavier than helium) and dust grains
. On
the surface of dust grains, hydrogen atoms combined
efficiently into hydrogen molecules
, which served as the fuel of
star formation in present-day spiral galaxies, including our own
Milky Way galaxy
. The lack of metals thus poses a question
regarding the presence of molecular gas in the primordial
galaxies through, for example, the gas-phase reaction
. The
extremely metal-poor galaxies in the local universe, with the
oxygen abundance relative to hydrogen
o10% of the solar value,
provide the best local insights into understanding the interstellar
medium in a quasi-primitive environment. Although there is an
indirect evidence for the presence of molecular gas in these
galaxies
, the emission from the molecule carbon monoxide
(CO), which is the primary tracer of molecular gas, has never
been detected in them
.
In this study, we report the detection of CO in a galaxy at 7% of
solar metallicity, along with additional detections in galaxies
at 13% and 18% solar metallicity; these data offer direct evidence
for the existence of molecular gas in these metal-poor galaxies. By
comparing this data to the gas mass as traced by dust emission,
the molecular gas mass per CO luminosity in these galaxies is
found to be much higher than that of the Milky Way galaxy.
Results
Observations
. The galaxy DDO 70 is an extremely metal-poor
galaxy at a distance of 1.38 Mpc (ref. 14), with the gas-phase
oxygen abundance relative to hydrogen 12 þ log(O/H) ¼ 7.53
(ref.
compared
with
the
solar
abundance
at
12 þ log(O/H) ¼ 8.66
We
have
observed
two
additional dwarf galaxies at somewhat higher metallicity,
including DDO 53 and DDO 50 at 3.68 Mpc (ref. 14) and
3.27 Mpc (ref. 14), respectively, with 12 þ log(O/H) ¼ 7.82
(ref. 17) and 7.92 (ref. 17), respectively. As shown in Fig. 1, we
targeted four dusty star-forming regions in these three galaxies
as listed in Table 1, using the Institut de Radioastronomie
Millimetrique (IRAM) 30-m telescope. For each star-forming
region, we pointed the telescope to the far-infrared peak that
traces gas density enhancement with ongoing star formation.
No prior CO detections of these regions have been reported,
possibly because previous works targeted the peak of atomic gas
often with a short exposure time
CO emission
. We detected CO J ¼ 2 1 emission in all four star-
forming regions, including one in DDO 70 at 7% (labelled as
DDO70-A), one in DDO 53 at 14% (labelled as DDO53-A) and
two in DDO 50 at 18% (labelled as DDO50-A and DDO50-B)
solar metallicity. The spectra and results are shown in Fig. 1 and
listed in Table 1. The 1 s continuum sensitivity is 3.94, 4.17,
3.13 and 4.89 mK for DDO70-A, DDO53-A, DDO50-A and
DDO50-B, respectively, at a spectral resolution of 0.5, 1.0, 4.0 and
1.0 km s
1
, respectively. The CO J ¼ 2 1 of DDO70-A has a S/
N of 5.5 with a full width at half maximum (FWHM) of
2.4 km s
1
, and the CO J ¼ 2 1 of DDO53-A is detected at a
signal-to-noise ratio (S/N) of 7.1 with a FWHM of 7 km s
1
.
The CO line of DDO50-A has an integrated S/N of 5.9 with a
FWHM of 18 km s
1
. The emission of DDO50-B appears to have
two velocity components. A single Gaussian fitting gives a value
of S/N of 6.1 for the integrated strength peaked at the velocity of
163 km s
1
with an FWHM of 10 km s
1
, and two Gaussian
fittings give S/Ns of 6.1 and 3.2 for the two components at 161
and 167 km s
1
, respectively, with FWHMs of 3.2 and
3.4 km s
1
, respectively. The CO J ¼ 1 0 transition was covered
by our observation but was not detected. The 3 s lower limits to
the ratios CO(J ¼ 2 1)/CO(J ¼ 1 0) in the main-beam
temperature are 1.9, 0.9, 1.5 and 0.9 for DDO70-A, DDO53-A,
DDO50-A and DDO50-B, respectively. As the size of a
CO-emitting region shrinks significantly at the low metallicity
,
we assumed point sources for CO-emitting regions relative
to our IRAM beam (
B100–200 pc). The above ratio is thus
still consistent with the assumption that the CO emission is
thermalized and optically thick.
Figure 2 shows the total infrared luminosity (8–1,000 mm)
versus the CO luminosity as well as the star-formation rate (SFR)
versus the CO luminosity of these metal-poor star-forming
regions. Here the CO luminosity defined for J ¼ 1 0 is obtained
20
DDO 70
DDO 53
DDO 50
A
A
A
B
–10
275
280
285
290
Velocity (km s
–1
)
–10
–10
–10
10
30
50
50
150
250
150
170
–10
a
b
c
DDO70-A
DDO53-A
DDO50-A
DDO50-B
Tmb (mK)
20
10
0
20
10
0
10
0
10
0
d
e
f
g
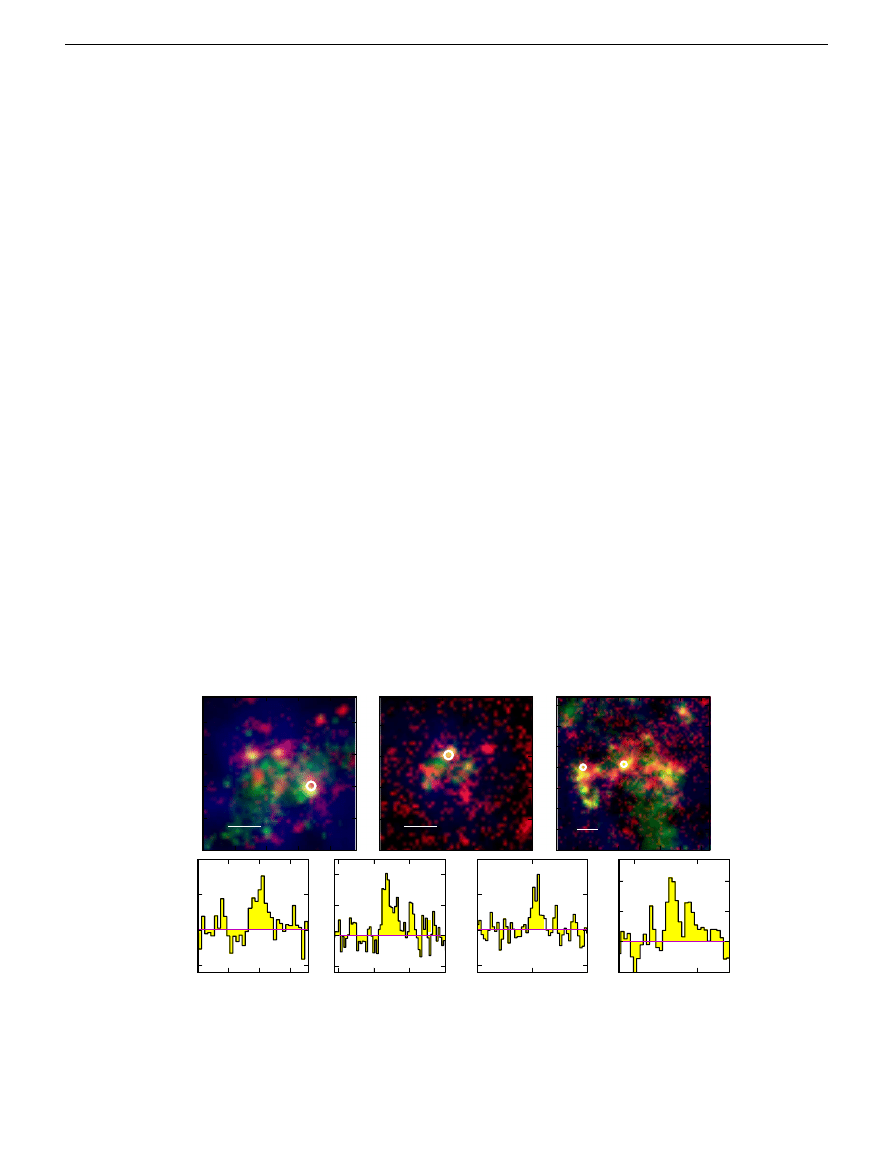
Figure 1 | False-colour images of three galaxies along with the CO J
¼ 2 1 spectra. (a) The image of DDO 70, where red denotes infrared emission at
160 mm, green denotes the far-UV emission and blue denotes the atomic hydrogen 21 cm emission. (b) The image of DDO 53. (c) The image of DDO 50.
All the white scale bars are 40
00
across. (
d) The CO J
¼ 2 1 spectra for region A in DDO 70. (e) The CO J ¼ 2 1 spectra for region A in DDO 53. (f) The
CO J
¼ 2 1 spectra for region A in DDO 50. (g) The CO J ¼ 2 1 spectra for region B in DDO 50. The spectral channel width is 0.5, 1.0, 4.0 and
1.0 km s
1
for DDO70-A, DDO53-A, DDO50-A and DDO50-B, respectively, and the corresponding 1
s continuum sensitivity is 3.94, 4.17, 3.13 and
4.89 mK, respectively.
ARTICLE
NATURE COMMUNICATIONS | DOI: 10.1038/ncomms13789
2
NATURE COMMUNICATIONS
| 7:13789 | DOI: 10.1038/ncomms13789 | www.nature.com/naturecommunications
with L
0
CO
(J ¼ 1 0) ¼ L
0
CO
(J ¼ 2 1) by assuming optically thick
and thermalized CO emission. Both the infrared luminosity and
SFR are measured after convolution to match the beam of the
IRAM 30 m at the CO J ¼ 2 1 frequency. For comparison,
massive star-forming galaxies of approximately solar metalli-
city
are also included in the figure. As is well known, the CO
luminosity is related to both far-infrared luminosities and SFRs
among massive star-forming galaxies, indicating that the
molecular gas mass as traced by CO is related to star-formation
activities. At a low metallicity, CO decreases because of not only
the eliminated reservoir of carbon and oxygen elements but also
the increased dissociation of CO molecules by ultraviolet photons
under the condition of low dust extinction. As indicated in the
figure, both infrared/CO and SFR/CO ratios at a low metallicity
are significantly higher than those of massive galaxies. In massive
galaxies, infrared luminosity is a good tracer of the SFR,
accounting for only a part of the SFR because of the low dust
content in metal-poor galaxies. As a result, the increase in the
SFR/CO ratio from massive galaxies to metal-poor ones is greater
than that in the infrared/CO ratio.
Discussion
The detection of CO in these objects indicates that molecular gas is
present at a very low metallicity. This presence implies that CO can
still be a tracer of molecular gas at a very low metallicity.
To constrain the conversion factor from the CO luminosity to the
molecular gas mass, we estimated the gas mass through the dust
emission. All our galaxies have multiband infrared images available in
the archive of the Herschel Space Observatory and HI gas maps as
observed by Very Large Array
. We constructed the infrared spectral
energy distribution (SED) of each region covered by the IRAM 30-m
beam (11
00
) and fitted it with a dust model
to derive the dust mass
(see Methods section). We used the gas-to-dust ratio of an extremely
metal-poor galaxy (Sextans A, 7% solar metallicity)
by assuming the
gas-to-dust ratio equal to 8,000(Z/0.07)
1.0
, where Z is the
metallicity. Here the function of the gas-to-dust ratio with the
metallicity is suggested by some observations
. Note that we used the
same dust model set-up as that for Sextans A to derive the dust mass,
thus eliminating the uncertainty caused by the variation of the dust
grain properties. After subtracting the atomic gas, the molecular gas
mass is obtained. The derived molecular gas has a relatively large
uncertainty that results from the photometric error in the infrared
SED, the uncertainty in the dust modelling, the HI gas mass error and
the error of the gas-to-dust ratio (see Methods section for details).
Figure 3 shows the conversion factor of our metal-poor star-
forming regions along with those in the literatures
, where the
molecular gas content is derived through the spatially resolved
dust and HI gas map. Although previous works are limited to the
metallicity 12 þ log(O/H)48.0, our study indicates that the
conversion factor increases rapidly below this metallicity limit.
The extremely metal-poor galaxy DDO 70 has a conversion factor
about three orders of magnitude higher than the value of the
Milky Way galaxy. Another three star-forming regions at 10–20%
solar metallicity have conversion factors between
B100 and 500.
One difference in our study compared with those at higher
metallicity is that we only targeted the intense star-formation
peaks. In these regions, the strong radiation field may increase the
effects of CO dissociation, thus biasing the conversion factor
towards large values. However, these regions are also infrared
peaks with more abundant dust with respective to the rest of the
galaxy; such dust may protect CO from dissociation.
In spite of the large uncertainties, the derived conversion factors
are still useful to differentiate different theoretical models that give
a very large range of predictions at a low metallicity as illustrated in
Fig. 3. The empirical relationship (solid yellow line)
based on
data above 12 þ log(O/H) ¼ 8.0 is a steep function, and its
extrapolations at our metallicity are consistent with our
observations. Among all theoretical models, the one that invokes
photodissociation of CO and H
2
self-shielding
matches the
observations including ours at a very low metallicity. Other models
either overpredict or significantly underpredict the data at the low
metallicity end
Methods
Observation details
.
We carried out the CO J ¼ 2 1 observation using the IRAM
30 m during 22–29 March 2016 (programme ID: 168–15, PI: Y. Shi) with a total of
Table 1 | Properties of IRAM-30m-targeted regions.
Name
D
(Mpc)
12
þlog(O/H)
Pos. (J2000)
M
star
*
(M
)
L
8–1,000 lm
ðL
Þ
SFR*
(
M
year
1
)
T
peak,CO
(mK)
v
CO
(km s
1
)
FWHM
CO
(km s
1
)
S
CO
DV
(mK km s
1
)
L
CO
(K km s
1
pc
2
)
a
CO
(M
pc
2
(K km s
1
))
DDO70-A 1.38
7.53
09 59 58.08
þ 05
19 45.5
1.7
10
5
(1.8±0.9)
10
5
2.7
10
5
13.0
285.0
2.4±0.5
33±6
204±37
6; 949
þ 23;403
6;067
DDO53-A 3.68
7.82
08 34 07.63
þ 66
10 52.4
3.5
10
5
(3.2±1.6)
10
6
2.3
10
4
16.6
17.6
7.3±1.3
129±18
5,635±788
261
þ 940
249
DDO50-A 3.27
7.92
08 19 12.30
þ 70
43 08.3
1.1
10
6
(6.1±3.1)
10
6
7.3
10
4
12.3
155.3
18.0±3.5
234±40
8,084±1382
546
þ 1;095
286
DDO50-B
3.27
7.92
08 19 28.21
þ 70
43 02.3
4.5
10
5
(3.8±1.9)
10
6
2.1
10
4
13.3
163.4
10.6±2.1
151±25
5,217±864
302
þ 793
202
*The stellar mass and SFR are measured within the IRAM 30 m beam (11
00
). The uncertainties on both measurements are dominated by the systematic errors (about 0.3 dex).
12
2
10
10
8
8
6
6
4
4
2
10
8
6
4
2
Log (
L
IR
(L
sun
))
SFR (FUV
+
24
μ
m)
(M
sun
/ y
ear)
Log (L
CO1–0
(K km s
–1
pc
2
))
Log (L
CO1–0
(K km s
–1
pc
2
))
1
0
–1
–2
–3
–4
–5
a
b
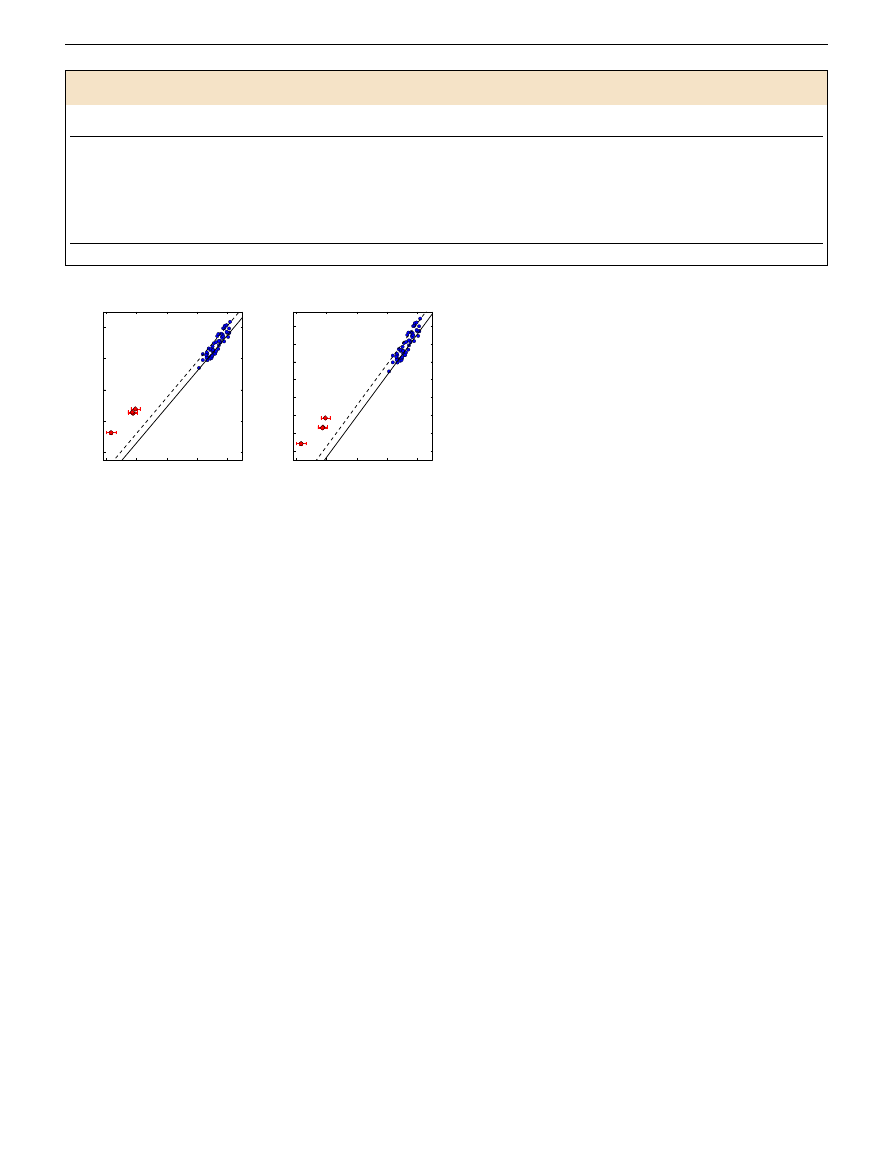
Figure 2 | The infrared luminosity and star-formation rate against
CO luminosity. (a) The infrared luminosity versus CO luminosity of our
metal-poor star-forming regions compared with massive star-forming
galaxies. The error bar is the s.d., which is basically the photon noise for
each measurement of luminosity. (
b) The SFR versus CO luminosity of our
metal-poor star-forming regions as compared with massive star-forming
galaxies. The error bar is the s.d. The error of the CO luminosity is the
photon noise, and the error of the SFR is the photon noise plus systematic
uncertainty. The red diamonds denote our observed four regions, and the
blue circles denote massive star-forming galaxies
. The solid line is the best
fit to star-forming disk galaxies
, whereas the dashed line is the best fit to
the star-forming starburst galaxies
.
NATURE COMMUNICATIONS | DOI: 10.1038/ncomms13789
ARTICLE
NATURE COMMUNICATIONS
| 7:13789 | DOI: 10.1038/ncomms13789 | www.nature.com/naturecommunications
3
59.5 h granted. The Eight Mixer Receiver with dual polarization and the Fourier
Transform Spectrometers backend were used. To have a good baseline for the
spectrum, we adopted the standard wobbler switching mode at a 0.5-Hz beam
throwing with an offset of ±120
00
. The pointing and focussing were set at the
beginning of each run and then re-calibrated every 2 h by pointing to the bright
quasars close to our targets. The data reduction was performed with CLASS in the
GILDAS package. For each region, we averaged all scans to obtain the final one. The
effective on-source integration time including two polarization as indicated by CLASS
is 1210, 413, 369 and 556 min for DDO70-A, DDO53-A, DDO50-A and DDO 50-B,
respectively, with system temperatures of 252, 223, 382 and 283 K, respectively.
Supplementary Fig. 1 shows the CO spectra over a velocity range of
±150 km s
1
to illustrate the goodness of a long baseline for our observations.
The HI spectrum within each IRAM beam is also extracted from the HI data cube
and overlaid on the CO spectrum as shown in Supplementary Fig. 1. The CO line is
within the HI velocity range, although there are some offsets in the central velocity
between the two that further validates the reliability of our CO detections.
Infrared spectral energy distributions
.
The infrared images from 70 to 250 mm as
shown in Supplementary Fig. 2 were retrieved from the archive of the Herschel Space
Observatory. The spatial resolutions are about 6
00
, 12
00
and 18
00
at 70, 160 and
250 mm, respectively. The data were reduced using the unimap
. The standard
procedure of the reduction includes the time ordering of the pixels, signal
preprocessing, glitch removal, drift removal, making the noise spectrum and
generalized least square (GLS) filter, map making with GLS, postprocessing of the
GLS map and finally the weighted postprocessing of the GLS map. The mid-infrared
images at 3.6, 4.5, 5.8, 8.0 and 24 mm were retrieved from the archive of the Spitzer
Space Telescope that is available through the Local Volume Legacy program
with
the corresponding spatial resolutions of 1.6
00
, 1.7
00
, 1.9
00
, 2.0
00
and 6
00
, respectively.
To estimate the dust mass, we constructed the infrared SED based on the Spitzer
and Herschel images. We first checked the astrometry using field stars and corrected
the offsets between the two telescopes, about 1 arcsec for DDO 70 and DDO 53 and
7 arcsec for DDO 50. As the IRAM beam size (11
00
) is relatively small given the spatial
resolutions at those IR wavelengths, the aperture correction is important. We used
three approaches to derive the infrared SED. The first approach is to assume point
sources for the aperture corrections at all infrared wavelengths and then measure the
flux within the IRAM beam for each band at native spatial resolutions. This approach
gives the largest possible aperture corrections, which could be treated as upperlimits,
given that the star-forming regions are spatially resolved at Spitzer 24 mm and
Herschel 70 mm. The following two methods assume that the star-forming regions are
extended sources at Spitzer 24 mm and Herschel 70 mm to correct the flux loss for
Herschel 160 and 250 mm. For the second approach, we convolved all infrared images
above 24 mm to the SPIRE 250 mm using the convolution Kernels
and then measured
the flux within the IRAM beam. These fluxes are then corrected for the aperture loss
by multiplying with the ratio of the flux of Spitzer 24 mm at its native resolution to that
at the convolved resolution. The third method is the same as the second one but
convolves the 24 mm, 70 and 160-mm images to Gaussian 11
00
beams excluding the
250-mm image, and again, this approach corrects the flux loss with the ratio of the
24-mm flux at the native resolution to that at the convolved resolution. The derived
photometric results using three approaches were found to be within 50%. For our
discussion, we have adopted the second approach, which adopts images convolved to
the Herschel 250 mm resolution and aperture corrections based on the Spitzer 24 mm
image, given that the star-forming regions are spatially resolved at 24 mm. As we
pointed at the bright infrared peaks, the photon noise is small while the photometric
error is instead dominated by the aperture correction because of the small IRAM
beam. We assigned 50% of fluxes as systematic uncertainties for the infrared
photometry at all wavelengths. The final SED is shown in Supplementary Fig. 3.
Measurements of the physical properties
.
Following our previous work
, the
infrared SED is fitted with a dust model
to obtain the dust mass measurement.
We adopted the Milky Way dust grains and fixed the polycyclic aromatic
hydrocarbon fraction to be the minimum given the low metallicity of our galaxies.
The maximum intensity of the stellar radiation field is further fixed to be 10
6
. Thus
the model has three free parameters, including the dust mass, the minimum stellar
light intensity and the fraction of dust exposed to the minimum radiation field. An
additional 4,000 K black body is included to model the emission from the stellar
photosphere. As shown in Supplementary Fig. 3 and listed in Supplementary
Table 1, the fitting results are reasonably good. If using the Small Magellanic Cloud
(SMC) dust model, the dust mass differs by no more than 15%, which is consistent
with previous studies
To derive the total gas mass from the dust mass, the gas-to-dust ratio is needed.
Unlike our previous work
, the infrared observation is not deep enough to derive the
gas-to-dust ratio based on the diffuse light for individual galaxies. We thus adopted
the gas-to-dust ratio (8,000) of Sextans A at 7% solar from the previous work
that is
based on the diffuse light as the value for DDO 70, which is at the same metallicity.
Given the large variation in the gas-to-dust ratio from object to object
at this
metallicity, we assigned 0.5 dex as 1 s uncertainty of the ratio. For DDO 50 and
DDO 53, we assumed a linear increase of the gas-to-dust ratio with the decreasing
metallicity following the literature study
, with a 1 s uncertainty of
B0.3 dex at
their metallicities. As discussed in the previous work
, although different dust grain
models provide different dust masses, these different dust masses do not affect the
derived gas masses because the dust-to-gas ratio changes accordingly.
To obtain the molecular gas, the atomic gas mass is subtracted from the dust-
based total gas mass. The HI gas maps of three galaxies were observed with the
Very Large Array through the program of Local Irregulars That Trace Luminosity
Extremes
. We adopted the robust-weighted maps with the synthesized beam sizes
of 13.8
00
13.2
00
, 6.3
00
5.7
00
and 7.0
00
6.1
00
for DDO 70, DDO 53 and DDO 50,
respectively. Although the DDO 70 has a resolution that is slightly worse than that
of our IRAM beam, the HI emission is pretty diffuse so that we can assume the HI
mass surface density measured at its resolution is a good approximation of that
within the IRAM beam. For DDO 53 and DDO 50, we convolved the HI maps to
the 11
00
beam to measure the HI mass, which is almost the same (
o10%) as those
measured at the native resolution, given the HI emission is diffuse. We also
retrieved the reduced far-ultraviolet images from the GALEX data archive (http://
galex.stsci.edu/GalexView/) whose spatial resolution is about 5
00
. The SFR is the
combination
of the unobscured part (as traced by far-ultraviolet) and the
obscured part (as traced by 24-mm emission). The SFRs of massive galaxies used for
comparison in Fig. 2 are based on their infrared luminosities
using the formula
with corrections for Chabier initial mass function (IMF). The stellar mass is derived
based on the 3.6 and 4.5-mm emission
.
Data availability
.
The data that support the findings of this study are available
from the corresponding author upon reasonable request.
References
1. Walter, F. et al. Evidence for low extinction in actively star-forming galaxies at
z46.5. Astrophys. J. 752, 93–98 (2012).
2. Wolfire, M. G. et al. Chemical rates on small grains and PAHs: C
þ
recombination and H
2
formation. Astrophys. J. 680, 384–397 (2008).
3. Gao, Y. & Solomon, P. M. HCN survey of normal spiral, infrared-luminous,
and ultraluminous galaxies. Astrophys. J. Suppl. 152, 63–80 (2004).
4. Abel, T. et al. Modeling primordial gas in numerical cosmology. New Astron.
Rev. 2, 181–207 (1997).
5. Madden, S. C. et al. [C II] 158 micron observations of IC 10: evidence for
hidden molecular hydrogen in irregular galaxies. Astrophys. J. 483, 200–209
(1997).
6. Hunt, L. et al. The Spitzer view of low-metallicity star formation. III.
Fine-structure lines, aromatic features, and molecules. Astrophys. J. 712,
164–187 (2010).
7. Shi, Y. et al. Inefficient star formation in extremely metal poor galaxies.
Nature 514, 335–338 (2014).
8. Bolatto, A. et al. The CO-to-H
2
conversion factor. Annu. Rev. Astron.
Astrophys. 51, 207–268 (2013).
9. Elmegreen, B. G. et al. Carbon monoxide in clouds at low metallicity in the
dwarf irregular galaxy WLM. Nature 495, 487–489 (2013).
10. Warren, S. R. et al. CARMA CO observations of three extremely metal-poor,
star-forming galaxies. Astrophys. J. 814, 30–38 (2015).
10
5
10
4
DDO70/A
DDO53/A
DDO50/A
DDO50/B
Sextans A
10
3
WLM
10
2
10
1
10
0
7.2
7.6
8.0
12+log (O/H)
8.4
8.8
9.2
Milky Way
Sandstrom 2013
Leroy 2011
Israel 1997
Feldmann 2012
Wolfire 2010
Narayanan 2012
Elmegreen 2013
Shi 2015
Israel 1997 fitting
Glover & Mac Low 2011
α
CO
(M pc
–2
(K km s
–1
)
–1
)
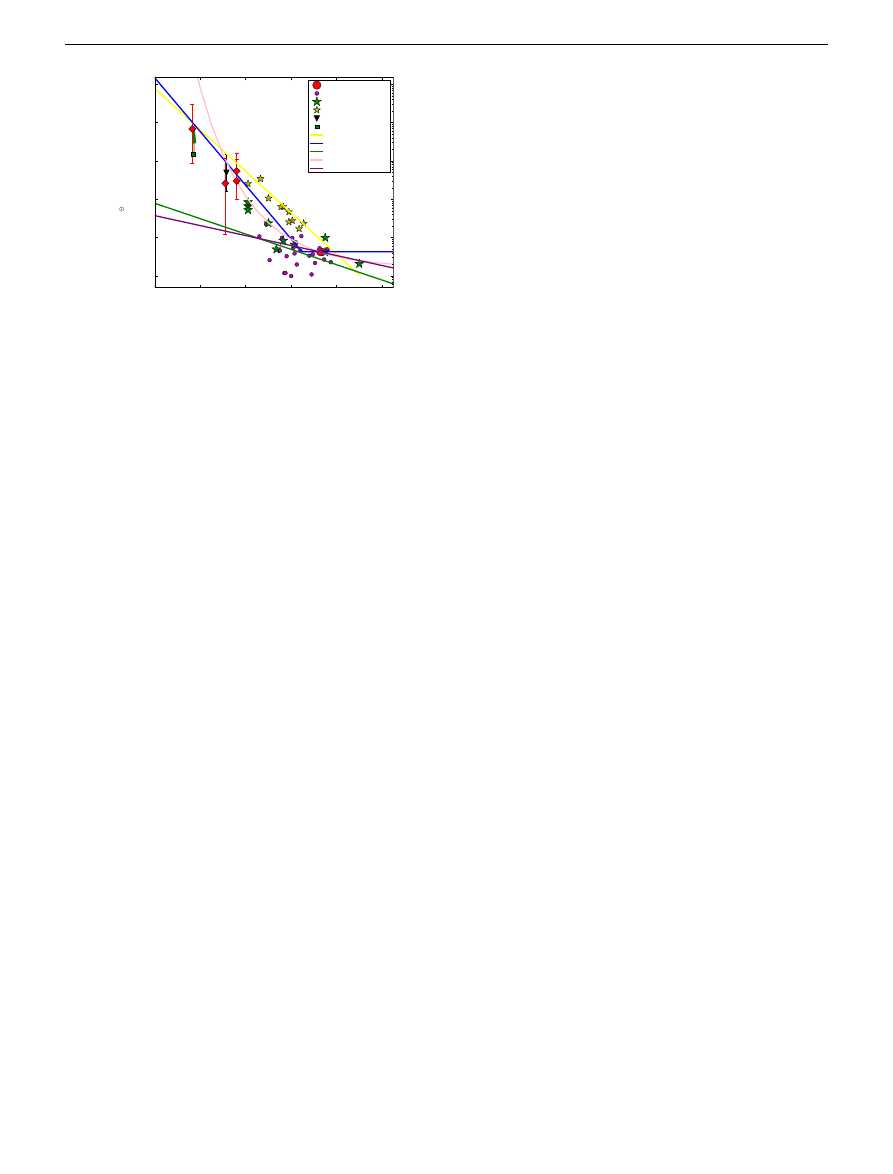
Figure 3 | The conversion factor from CO luminosity to molecular gas
mass. The four red diamonds denote the result of our metal-poor star-
forming regions, and all other symbols denote those observations in the
literature
. The error bars of our measurements are the s.d., which are
caused by the uncertainties on the CO luminosity, the HI gas mass and the
dust mass as well as the dust-to-gas ratio. The lines denote models’
predictions, including the empirical one
as well as theoretical ones
The parameters in those models were set basically following the literature
work
, including a linear scaling of the dust-to-gas ratio with the metallicity,
and a typical gas surface density of 100 M
pc
2
in the Milky Way.
ARTICLE
NATURE COMMUNICATIONS | DOI: 10.1038/ncomms13789
4
NATURE COMMUNICATIONS
| 7:13789 | DOI: 10.1038/ncomms13789 | www.nature.com/naturecommunications
11. Rubio, M. et al. Dense cloud cores revealed by CO in the low metallicity dwarf
galaxy WLM. Nature 525, 218–221 (2015).
12. Hunt, L. K. et al. Molecular depletion times and the CO-to-H
2
conversion
factor in metal-poor galaxies. Astron. Astrophys. 583, A114 (2015).
13. Amorn, R. et al. Molecular gas in low-metallicity starburst galaxies: scaling
relations and the CO-to-H
2
conversion factor. Astron. Astrophys. 588, A23 (2016).
14. Tully, R. B. et al. Cosmicflows-2: the data. Astron. J. 146, 86–110 (2013).
15. Kniazev, A. Y. et al. Spectrophotometry of Sextans A and B: chemical abundances
of H II regions and planetary nebulae. Astron. J. 130, 1558–1573 (2005).
16. Asplund, M. et al. The chemical composition of the Sun. Annu. Rev. Astron.
Astrophys. 47, 481–522 (2009).
17. Croxall, K. V. et al. Chemical abundances of seven irregular and three tidal
dwarf galaxies in the M81 group. Astrophys. J. 705, 723–738 (2009).
18. Genzel, R. et al. A study of the gas-star formation relation over cosmic time.
Mon. Not. R. Astron. Soc. 2010, 2091–2108 (2010).
19. Hunter, D. A. et al. Little things. Astron. J. 144, 134–162 (2012).
20. Draine, B. T. et al. Infrared emission from interstellar dust. IV. The silicate-
graphite-PAH model in the post-Spitzer era. Astrophys. J. 657, 810–837 (2007).
21. Re´my-Ruyer, A. et al. Gas-to-dust mass ratios in local galaxies over a 2 dex
metallicity range. Astron. Astrophys. 2014, A31 (2014).
22. Sandstrom, K. M. et al. The CO-to-H
2
conversion factor and dust-to-gas ratio
on kiloparsec scales in nearby galaxies. Astrophys. J. 777, 5–37 (2013).
23. Leroy, A. K. et al. The CO-to-H
2
conversion factor from infrared dust emission
across the local group. Astrophys. J. 737, 12–24 (2011).
24. Israel, F. P. H
2
and its relation to CO in the LMC and other magellanic irregular
galaxies. Astron. Astrophys. 328, 471–482 (1997).
25. Shi, Y. et al. The weak carbon monoxide emission in an extremely metal-poor
galaxy, Sextans. Astrophys. J. Lett. 804, 11–14 (2015).
26. Glover, S. C. O. & Mac Low, M.-M. On the relationship between molecular
hydrogen and carbon monoxide abundances in molecular clouds. Mon. Not. R.
Astron. Soc. 412, 337–350 (2011).
27. Narayanan, D. et al. A general model for the CO-H
2
conversion factor in
galaxies with applications to the star formation law. Mon. Not. R. Astron. Soc.
2012,
3127–3146 (2012).
28. Wolfire, M. G. et al. The dark molecular gas. Astrophys. J. 716, 1191–1207 (2010).
29. Feldmann, R., Gnedin, N. Y. & Kravtsov, A. V. The X-factor in galaxies. I.
Dependence on environment and scale. Astrophys. J. 747, 124–144 (2012).
30. Traficante, A. et al. Data reduction pipeline for the Hi-GAL survey. Maris 416,
2932–2943 (2011).
31. Dale, D. A. et al. The Spitzer local volume legacy: survey description and
infrared photometry. Astrophys. J. 703, 517–556 (2009).
32. Aniano, G. et al. Common-resolution convolution kernels for space- and
ground-based telescopes. Publ. Astron. Soc. Pac. 123, 1218–1236 (2011).
33. Draine, B. et al. Dust masses, PAH abundances, and starlight intensities in the
SINGS galaxy sample. Astrophys. J. 663, 866–894 (2007b).
34. Leroy, A. K. et al. The star formation efficiency in nearby galaxies: measuring
where gas forms stars effectively. Astron. J. 136, 2782–2845 (2012).
35. Kennicutt, R. Star formation in galaxies along the Hubble sequence. Annu. Rev.
Astron. Astrophys. 36, 189–232 (1998).
36. Eskew, M., Zaritsky, D. & Meidt, S. Converting from 3.6 and 4.5 mm fluxes
to stellar mass. Astron. J. 143, 139–145 (2012).
Acknowledgements
This study is based on observations carried out under project number 168-15 with the
IRAM 30-m telescope. IRAM is supported by INSU/CNRS (France), MPG (Germany)
and IGN (Spain). Y.S. acknowledges support for this work from the National Natural
Science Foundation of China (NSFC grant 11373021), the Strategic Priority Research
Program The Emergence of Cosmological Structures of the Chinese Academy of Sciences
(grant no. XDB09000000) and the Excellent Youth Foundation of the Jiangsu Scientific
Committee (grant BK20150014). J.W. is supported by the National 973 program
(grant 2012CB821805) and by the NSFC (grant 11590783). Z.-Y.Z. acknowledges support
from the European Research Council in the form of the Advanced Investigator
Programme, 321302, COSMICISM. Y.G. is supported by Pilot-b (XDB09000000) and
NSFC (grant 11390373 and 11420101002). C.-N.H. and X.-Y.X. acknowledge the support
from the NSFC grant 11373027. Q.G. was supported by the NSFC (11273015 and
11133001) and by the National 973 programme (grant 2013CB834905).
Author contributions
Y.S. led the IRAM proposal and the writing of the manuscript. Y.S. and J.W. performed
the observations and reduced the data. All others helped develop the proposal and
commented on the manuscript.
Additional information
Supplementary Information
accompanies this paper at http://www.nature.com/
Competing financial interests:
The authors declare no competing financial interests.
Reprints and permission
information is available online at http://npg.nature.com/
How to cite this article:
Shi, Y. et al. Carbon monoxide in an extremely metal-poor
galaxy. Nat. Commun. 7, 13789 doi: 10.1038/ncomms13789 (2016).
Publisher’s note
: Springer Nature remains neutral with regard to jurisdictional claims in
published maps and institutional affiliations.
This work is licensed under a Creative Commons Attribution 4.0
International License. The images or other third party material in this
article are included in the article’s Creative Commons license, unless indicated otherwise
in the credit line; if the material is not included under the Creative Commons license,
users will need to obtain permission from the license holder to reproduce the material.
To view a copy of this license, visit http://creativecommons.org/licenses/by/4.0/
r
The Author(s) 2016
NATURE COMMUNICATIONS | DOI: 10.1038/ncomms13789
ARTICLE
NATURE COMMUNICATIONS
| 7:13789 | DOI: 10.1038/ncomms13789 | www.nature.com/naturecommunications
5
Document Outline
- title_link
- Results
- Figure™1False-colour images of three galaxies along with the CO J=2-1 spectra.(a) The image of DDO 70, where red denotes infrared emission at 160thinspmgrm, green denotes the far-UV emission and blue denotes the atomic hydrogen 21thinspcm emission. (b) Th
- Discussion
- Methods
- Table 1
- Figure™2The infrared luminosity and star-formation rate against CO luminosity.(a) The infrared luminosity versus CO luminosity of our metal-poor star-forming regions compared with massive star-forming galaxies. The error bar is the s.d., which is basicall
- WalterF.Evidence for low extinction in actively star-forming galaxies at zgt6.5Astrophys. J.75293982012WolfireM. G.Chemical rates on small grains and PAHs: C+ recombination and H2 formationAstrophys. J.6803843972008GaoY.SolomonP. M.HCN survey of normal sp
- Figure™3The conversion factor from CO luminosity to molecular gas mass.The four red diamonds denote the result of our metal-poor star-forming regions, and all other symbols denote those observations in the literature9,22-24. The error bars of our measurem
- This study is based on observations carried out under project number 168-15 with the IRAM 30-m telescope. IRAM is supported by INSUsolCNRS (France), MPG (Germany) and IGN (Spain). Y.S. acknowledges support for this work from the National Natural Science F
- ACKNOWLEDGEMENTS
- Author contributions
- Additional information
Wyszukiwarka
Podobne podstrony:
Iannace, Ianniello, Romano Room Acoustic Conditions Of Performers In An Old Opera House
Discuss some of the issues raised in An Inspector?ls
Emergency Survival Safety Preparations Food And Water In An Emergency
Evidence of an oscillating peripheral clock in an equine fib
20090702 01 One?ghan man?ad of wounds sustained in an escalation of force incident Friday
[PIC] Carbon Monoxide Alarm, 105031 cosensorpcb
Angielski tematy Working in an international context
Estimating Temperatures in an Air
METAREPRESENTATIONS IN AN EVOLUTIONARY PERSPECTIVE
Performance Improvements in an arc welding power supply based on resonant inverters (1)
Variations in Risk and Treatment Factors Among Adolescents Engaging in Different Types of Deliberate
Sean Michael Love in an Elevator
The Effect of DNS Delays on Worm Propagation in an IPv6 Internet
#0733 – Voting in an Election
Rethinking SSL Development in an Appified World
Ingold, T Bindings against boundaries entanglements of life in an open world
Determination of carbonyl compounds in water by derivatizati
więcej podobnych podstron