

Rodney Landrum
and Walter J. Voytek II
Pro SQL Server 2005
Reporting Services
4983FM.qxd 10/7/05 12:05 PM Page i

Pro SQL Server 2005 Reporting Services
Copyright © 2006 by Rodney Landrum and Walter J. Voytek II
All rights reserved. No part of this work may be reproduced or transmitted in any form or by any means,
electronic or mechanical, including photocopying, recording, or by any information storage or retrieval
system, without the prior written permission of the copyright owner and the publisher.
ISBN (pbk): 1-59059-498-3
Printed and bound in the United States of America 9 8 7 6 5 4 3 2 1
Trademarked names may appear in this book. Rather than use a trademark symbol with every occurrence
of a trademarked name, we use the names only in an editorial fashion and to the benefit of the trademark
owner, with no intention of infringement of the trademark.
Lead Editor: Tony Davis
Technical Reviewer: Trish Middleton, Chris Rausch, Thomas Rizzo
Editorial Board: Steve Anglin, Dan Appleman, Ewan Buckingham, Gary Cornell, Tony Davis, Jason Gilmore,
Jonathan Hassell, Chris Mills, Dominic Shakeshaft, Jim Sumser
Project Manager: Sofia Marchant
Copy Edit Manager: Nicole LeClerc
Copy Editor: Kim Wimpsett, Julie McNamee
Assistant Production Director: Kari Brooks-Copony
Production Editor: Laura Cheu
Compositor and Artist: Kinetic Publishing Services, LLC
Proofreader: April Eddy, Linda Seifert
Indexer: Broccoli Information Management
Cover Designer: Kurt Krames
Manufacturing Director: Tom Debolski
Distributed to the book trade worldwide by Springer-Verlag New York, Inc., 233 Spring Street, 6th Floor,
New York, NY 10013. Phone 1-800-SPRINGER, fax 201-348-4505, e-mail orders-ny@springer-sbm.com, or
visit http://www.springeronline.com.
For information on translations, please contact Apress directly at 2560 Ninth Street, Suite 219, Berkeley,
CA 94710. Phone 510-549-5930, fax 510-549-5939, e-mail info@apress.com, or visit http://www.apress.com.
The information in this book is distributed on an “as is” basis, without warranty. Although every precaution
has been taken in the preparation of this work, neither the author(s) nor Apress shall have any liability to
any person or entity with respect to any loss or damage caused or alleged to be caused directly or indirectly
by the information contained in this work.
The source code for this book is available to readers at http://www.apress.com in the Source Code section.
4983FM.qxd 10/7/05 12:05 PM Page ii

To all the victims of hurricanes Dennis, Katrina, and Rita,
which ravaged the Gulf Coast during the 2005 hurricane season.
Rodney Landrum andWalter J. Voytek II
4983FM.qxd 10/7/05 12:05 PM Page iii

4983FM.qxd 10/7/05 12:05 PM Page iv

Contents at a Glance
About the Authors
. . . . . . . . . . . . . . . . . . . . . . . . . . . . . . . . . . . . . . . . . . . . . . . . . . . . . . . . . . . . . . . . xiii
About the Technical Reviewers
. . . . . . . . . . . . . . . . . . . . . . . . . . . . . . . . . . . . . . . . . . . . . . . . . . . . . . xv
Acknowledgments
. . . . . . . . . . . . . . . . . . . . . . . . . . . . . . . . . . . . . . . . . . . . . . . . . . . . . . . . . . . . . . . xvii
Introduction
. . . . . . . . . . . . . . . . . . . . . . . . . . . . . . . . . . . . . . . . . . . . . . . . . . . . . . . . . . . . . . . . . . . . . . xix
■
CHAPTER 1
Introducing the Reporting Services Architecture
. . . . . . . . . . . . . . . . . 1
■
CHAPTER 2
Report Authoring: Designing Efficient Queries
. . . . . . . . . . . . . . . . . . 17
■
CHAPTER 3
Using Report Designer
. . . . . . . . . . . . . . . . . . . . . . . . . . . . . . . . . . . . . . . . . 35
■
CHAPTER 4
Building Reports
. . . . . . . . . . . . . . . . . . . . . . . . . . . . . . . . . . . . . . . . . . . . . . . 81
■
CHAPTER 5
Using Custom .NET Code with Reports
. . . . . . . . . . . . . . . . . . . . . . . . 123
■
CHAPTER 6
Rendering Reports from .NET Applications
. . . . . . . . . . . . . . . . . . . . . 147
■
CHAPTER 7
Deploying Reports
. . . . . . . . . . . . . . . . . . . . . . . . . . . . . . . . . . . . . . . . . . . . 175
■
CHAPTER 8
Managing Reports
. . . . . . . . . . . . . . . . . . . . . . . . . . . . . . . . . . . . . . . . . . . . 197
■
CHAPTER 9
Securing Reports
. . . . . . . . . . . . . . . . . . . . . . . . . . . . . . . . . . . . . . . . . . . . . 249
■
CHAPTER 10
Delivering Business Intelligence with SSRS
. . . . . . . . . . . . . . . . . . . . 285
■
CHAPTER 11
Performing Ad Hoc Reporting Using Report Builder
. . . . . . . . . . . . 321
■
INDEX
. . . . . . . . . . . . . . . . . . . . . . . . . . . . . . . . . . . . . . . . . . . . . . . . . . . . . . . . . . . . . . . . . . . . . . . 363
v
4983FM.qxd 10/7/05 12:05 PM Page v

4983FM.qxd 10/7/05 12:05 PM Page vi

Contents
About the Authors
. . . . . . . . . . . . . . . . . . . . . . . . . . . . . . . . . . . . . . . . . . . . . . . . . . . . . . . . . . . . . . . . xiii
About the Technical Reviewers
. . . . . . . . . . . . . . . . . . . . . . . . . . . . . . . . . . . . . . . . . . . . . . . . . . . . . . xv
Acknowledgments
. . . . . . . . . . . . . . . . . . . . . . . . . . . . . . . . . . . . . . . . . . . . . . . . . . . . . . . . . . . . . . . xvii
Introduction
. . . . . . . . . . . . . . . . . . . . . . . . . . . . . . . . . . . . . . . . . . . . . . . . . . . . . . . . . . . . . . . . . . . . . . xix
■
CHAPTER 1
Introducing the Reporting Services Architecture
. . . . . . . . . . 1
Understanding the Benefits of SSRS
. . . . . . . . . . . . . . . . . . . . . . . . . . . . . . . . 2
SQL Server 2005 Reporting Services Enhancements
. . . . . . . . . . . . . 4
SSRS and Business Intelligence
. . . . . . . . . . . . . . . . . . . . . . . . . . . . . . . 6
Exploring the SSRS Architecture
. . . . . . . . . . . . . . . . . . . . . . . . . . . . . . . . . . . . 7
SSRS Databases
. . . . . . . . . . . . . . . . . . . . . . . . . . . . . . . . . . . . . . . . . . . . 8
The SSRS Report Server
. . . . . . . . . . . . . . . . . . . . . . . . . . . . . . . . . . . . . . 8
Client Applications
. . . . . . . . . . . . . . . . . . . . . . . . . . . . . . . . . . . . . . . . . . 10
Installing and Configuring
. . . . . . . . . . . . . . . . . . . . . . . . . . . . . . . . . . . . . . . . 13
Deploying SSRS Securely
. . . . . . . . . . . . . . . . . . . . . . . . . . . . . . . . . . . . . . . . . 14
Summary
. . . . . . . . . . . . . . . . . . . . . . . . . . . . . . . . . . . . . . . . . . . . . . . . . . . . . . 15
■
CHAPTER 2
Report Authoring: Designing Efficient Queries
. . . . . . . . . . . . 17
Introducing the Sample Relational Database
. . . . . . . . . . . . . . . . . . . . . . . . 18
Introducing the Schema Design
. . . . . . . . . . . . . . . . . . . . . . . . . . . . . . 18
Knowing Your Data: A Quick Trick with a Small Procedure
. . . . . . . . 19
Introducing Query Design Basics
. . . . . . . . . . . . . . . . . . . . . . . . . . . . . . . . . . 21
Creating a Simple Query Graphically
. . . . . . . . . . . . . . . . . . . . . . . . . . 21
Creating an Advanced Query
. . . . . . . . . . . . . . . . . . . . . . . . . . . . . . . . . 24
Using a Parameterized Stored Procedure
. . . . . . . . . . . . . . . . . . . . . . . . . . . 30
Using Case and ISNULL to Evaluate the Parameters
. . . . . . . . . . . . . 32
Testing the Procedure
. . . . . . . . . . . . . . . . . . . . . . . . . . . . . . . . . . . . . . . 33
Summary
. . . . . . . . . . . . . . . . . . . . . . . . . . . . . . . . . . . . . . . . . . . . . . . . . . . . . . 34
vii
4983FM.qxd 10/7/05 12:05 PM Page vii

■
CHAPTER 3
Using Report Designer
. . . . . . . . . . . . . . . . . . . . . . . . . . . . . . . . . . . . . . 35
Exploring the Elements of BIDS
. . . . . . . . . . . . . . . . . . . . . . . . . . . . . . . . . . . . 36
Setting Up a Basic IDE
. . . . . . . . . . . . . . . . . . . . . . . . . . . . . . . . . . . . . . 38
Understanding Report Definition Language (RDL)
. . . . . . . . . . . . . . . 39
Adding a Report
. . . . . . . . . . . . . . . . . . . . . . . . . . . . . . . . . . . . . . . . . . . . 40
Setting Up Data Sources and Datasets
. . . . . . . . . . . . . . . . . . . . . . . . 41
Setting Parameters
. . . . . . . . . . . . . . . . . . . . . . . . . . . . . . . . . . . . . . . . . 46
Setting Up Filters
. . . . . . . . . . . . . . . . . . . . . . . . . . . . . . . . . . . . . . . . . . . 48
Expressions
. . . . . . . . . . . . . . . . . . . . . . . . . . . . . . . . . . . . . . . . . . . . . . . . 50
Laying Out a Report
. . . . . . . . . . . . . . . . . . . . . . . . . . . . . . . . . . . . . . . . . . . . . 51
Setting Up Pagination
. . . . . . . . . . . . . . . . . . . . . . . . . . . . . . . . . . . . . . . 52
Using Report Objects
. . . . . . . . . . . . . . . . . . . . . . . . . . . . . . . . . . . . . . . . 53
Implementing Two Simple Report Design Tips
. . . . . . . . . . . . . . . . . . 77
Summary
. . . . . . . . . . . . . . . . . . . . . . . . . . . . . . . . . . . . . . . . . . . . . . . . . . . . . . 79
■
CHAPTER 4
Building Reports
. . . . . . . . . . . . . . . . . . . . . . . . . . . . . . . . . . . . . . . . . . . . 81
Creating a Report with the Report Wizard
. . . . . . . . . . . . . . . . . . . . . . . . . . . 82
Building Reports from Scratch
. . . . . . . . . . . . . . . . . . . . . . . . . . . . . . . . . . . . 85
Formatting the Output
. . . . . . . . . . . . . . . . . . . . . . . . . . . . . . . . . . . . . . . 87
Adding Subtotals
. . . . . . . . . . . . . . . . . . . . . . . . . . . . . . . . . . . . . . . . . . . 88
Adding Interactivity
. . . . . . . . . . . . . . . . . . . . . . . . . . . . . . . . . . . . . . . . . 89
Setting Report Parameters with Stored Procedures
. . . . . . . . . . . . . . . . . 105
Applying a Filter
. . . . . . . . . . . . . . . . . . . . . . . . . . . . . . . . . . . . . . . . . . . 111
Adding a Chart
. . . . . . . . . . . . . . . . . . . . . . . . . . . . . . . . . . . . . . . . . . . . 112
Adding the Final Touches
. . . . . . . . . . . . . . . . . . . . . . . . . . . . . . . . . . . . . . . . 114
Working with Multivalued Parameters
. . . . . . . . . . . . . . . . . . . . . . . . . . . . . 116
Summary
. . . . . . . . . . . . . . . . . . . . . . . . . . . . . . . . . . . . . . . . . . . . . . . . . . . . . 121
■
CHAPTER 5
Using Custom .NET Code with Reports
. . . . . . . . . . . . . . . . . . . 123
Using Embedded Code in Your Report
. . . . . . . . . . . . . . . . . . . . . . . . . . . . . 124
Using the ExceedMaxVisits Function
. . . . . . . . . . . . . . . . . . . . . . . . . 125
Using the ExceedMaxVisits Function in a Report
. . . . . . . . . . . . . . . 128
Accessing .NET Assemblies from Embedded Code
. . . . . . . . . . . . . 131
Using Custom Assemblies with Your Report
. . . . . . . . . . . . . . . . . . . . . . . . 132
Adding a Class Library Project to Your Reporting Solution
. . . . . . . 133
Deploying a Custom Assembly
. . . . . . . . . . . . . . . . . . . . . . . . . . . . . . 136
Adding an Assembly Reference to a Report
. . . . . . . . . . . . . . . . . . . 140
Debugging Custom Assemblies
. . . . . . . . . . . . . . . . . . . . . . . . . . . . . . 143
Troubleshooting Your Project
. . . . . . . . . . . . . . . . . . . . . . . . . . . . . . . . 145
■
C O N T E N T S
viii
4983FM.qxd 10/7/05 12:05 PM Page viii

■
CHAPTER 6
Rendering Reports from .NET Applications
. . . . . . . . . . . . . . 147
Implementing URL Access
. . . . . . . . . . . . . . . . . . . . . . . . . . . . . . . . . . . . . . . 149
URL Report Access Path Format
. . . . . . . . . . . . . . . . . . . . . . . . . . . . . 150
URL Parameters and Prefixes
. . . . . . . . . . . . . . . . . . . . . . . . . . . . . . . 150
Report Parameters
. . . . . . . . . . . . . . . . . . . . . . . . . . . . . . . . . . . . . . . . . 151
HTML Viewer Commands
. . . . . . . . . . . . . . . . . . . . . . . . . . . . . . . . . . . 151
Report Server Command Parameters
. . . . . . . . . . . . . . . . . . . . . . . . . 151
Credential Parameters
. . . . . . . . . . . . . . . . . . . . . . . . . . . . . . . . . . . . . 152
Example URLs
. . . . . . . . . . . . . . . . . . . . . . . . . . . . . . . . . . . . . . . . . . . . . 152
Integrating SSRS 2005 with .NET Applications
. . . . . . . . . . . . . . . . . . . . . 153
Building the Report Viewer Using a WebBrowser Control
. . . . . . . . 153
Building the Report Viewer Using a Report Viewer Control
. . . . . . . 155
Summary
. . . . . . . . . . . . . . . . . . . . . . . . . . . . . . . . . . . . . . . . . . . . . . . . . . . . . 173
■
CHAPTER 7
Deploying Reports
. . . . . . . . . . . . . . . . . . . . . . . . . . . . . . . . . . . . . . . . . 175
Using Report Manager
. . . . . . . . . . . . . . . . . . . . . . . . . . . . . . . . . . . . . . . . . . 176
Using SQL Server Management Studio (SSMS)
. . . . . . . . . . . . . . . . . . . . . 179
Using BIDS and Visual Studio 2005
. . . . . . . . . . . . . . . . . . . . . . . . . . . . . . . 181
Configuring Report Deployment Options
. . . . . . . . . . . . . . . . . . . . . . 181
Using the Report Server Web Service
. . . . . . . . . . . . . . . . . . . . . . . . . . . . . 184
Accessing the Web Service
. . . . . . . . . . . . . . . . . . . . . . . . . . . . . . . . . 185
Laying Out the Form
. . . . . . . . . . . . . . . . . . . . . . . . . . . . . . . . . . . . . . . 186
Coding the Form
. . . . . . . . . . . . . . . . . . . . . . . . . . . . . . . . . . . . . . . . . . . 187
Running the Application
. . . . . . . . . . . . . . . . . . . . . . . . . . . . . . . . . . . . 193
Summary
. . . . . . . . . . . . . . . . . . . . . . . . . . . . . . . . . . . . . . . . . . . . . . . . . . . . . 195
■
CHAPTER 8
Managing Reports
. . . . . . . . . . . . . . . . . . . . . . . . . . . . . . . . . . . . . . . . . 197
Exploring Management Roles in SSRS Deployment
. . . . . . . . . . . . . . . . . 197
Managing Content
. . . . . . . . . . . . . . . . . . . . . . . . . . . . . . . . . . . . . . . . . . . . . . 198
Setting Up Shared Schedules
. . . . . . . . . . . . . . . . . . . . . . . . . . . . . . . 198
Setting Up a Data Source for the Report
. . . . . . . . . . . . . . . . . . . . . . 205
Creating Snapshots for the Report History
. . . . . . . . . . . . . . . . . . . . 206
Executing Reports and Performing Caching
. . . . . . . . . . . . . . . . . . . 209
Managing Subscriptions
. . . . . . . . . . . . . . . . . . . . . . . . . . . . . . . . . . . . 211
Using SSMS and SSRS
. . . . . . . . . . . . . . . . . . . . . . . . . . . . . . . . . . . . . . . . . . 222
Performing Execution Auditing and Performance Analysis
. . . . . . . . . . . . 225
Configuring SSRS Logging
. . . . . . . . . . . . . . . . . . . . . . . . . . . . . . . . . . 226
Monitoring Performance
. . . . . . . . . . . . . . . . . . . . . . . . . . . . . . . . . . . . 231
■
C O N T E N T S
ix
4983FM.qxd 10/7/05 12:05 PM Page ix

Controlling SSRS Programmatically
. . . . . . . . . . . . . . . . . . . . . . . . . . . . . . . 234
Controlling SSRS with SOAP
. . . . . . . . . . . . . . . . . . . . . . . . . . . . . . . . 234
Controlling SSRS with WMI
. . . . . . . . . . . . . . . . . . . . . . . . . . . . . . . . . 245
Summary
. . . . . . . . . . . . . . . . . . . . . . . . . . . . . . . . . . . . . . . . . . . . . . . . . . . . . 246
■
CHAPTER 9
Securing Reports
. . . . . . . . . . . . . . . . . . . . . . . . . . . . . . . . . . . . . . . . . . . 249
Encrypting Data
. . . . . . . . . . . . . . . . . . . . . . . . . . . . . . . . . . . . . . . . . . . . . . . . 250
Introducing Encryption
. . . . . . . . . . . . . . . . . . . . . . . . . . . . . . . . . . . . . 250
Securing Network Traffic Using SSL
. . . . . . . . . . . . . . . . . . . . . . . . . . 251
Setting Up Authentication and User Access to Data
. . . . . . . . . . . . . . . . . 261
Introducing SSRS Roles
. . . . . . . . . . . . . . . . . . . . . . . . . . . . . . . . . . . . 262
Testing SSRS Role Assignments
. . . . . . . . . . . . . . . . . . . . . . . . . . . . . 267
Filtering Report Content with User!UserID
. . . . . . . . . . . . . . . . . . . . . 273
Setting Data Source Security
. . . . . . . . . . . . . . . . . . . . . . . . . . . . . . . . 275
Setting SQL Server Permissions
. . . . . . . . . . . . . . . . . . . . . . . . . . . . . 276
Auditing Reports
. . . . . . . . . . . . . . . . . . . . . . . . . . . . . . . . . . . . . . . . . . . . . . . 277
Introducing SSRS Auditing
. . . . . . . . . . . . . . . . . . . . . . . . . . . . . . . . . . 277
Introducing Log File Auditing
. . . . . . . . . . . . . . . . . . . . . . . . . . . . . . . . 278
Exploring Deployment Models
. . . . . . . . . . . . . . . . . . . . . . . . . . . . . . . . . . . . 278
Implementing SSRS with Terminal Services
. . . . . . . . . . . . . . . . . . . 279
Implementing for Internal Access
. . . . . . . . . . . . . . . . . . . . . . . . . . . . 282
Summary
. . . . . . . . . . . . . . . . . . . . . . . . . . . . . . . . . . . . . . . . . . . . . . . . . . . . . 283
■
CHAPTER 10
Delivering Business Intelligence with SSRS
. . . . . . . . . . . . . 285
Extending Microsoft CRM with SSRS
. . . . . . . . . . . . . . . . . . . . . . . . . . . . . . 286
Using the Report Pack for Microsoft CRM 1.2
. . . . . . . . . . . . . . . . . 287
Creating Custom SSRS Reports for Microsoft CRM
. . . . . . . . . . . . . 291
Creating the Sales Projections Chart Report
. . . . . . . . . . . . . . . . . . . 292
Creating the Lead Conversion Report
. . . . . . . . . . . . . . . . . . . . . . . . . 293
Managing Projects with SSRS
. . . . . . . . . . . . . . . . . . . . . . . . . . . . . . . . . . . . 294
Building SSRS Reports for SQL Analysis Services
. . . . . . . . . . . . . . . . . . . 296
Using Analysis Service Cube with SSRS
. . . . . . . . . . . . . . . . . . . . . . 301
Setting Up the Analysis Services Data Source
. . . . . . . . . . . . . . . . . 301
Working with the Graphical MDX Query Builder
. . . . . . . . . . . . . . . . 303
Incorporating SSRS with SharePoint Portal Server
. . . . . . . . . . . . . . . . . . 308
Creating a Web Part Page
. . . . . . . . . . . . . . . . . . . . . . . . . . . . . . . . . . . 308
Adding Web Parts
. . . . . . . . . . . . . . . . . . . . . . . . . . . . . . . . . . . . . . . . . . 310
Summary
. . . . . . . . . . . . . . . . . . . . . . . . . . . . . . . . . . . . . . . . . . . . . . . . . . . . . 319
■
C O N T E N T S
x
4983FM.qxd 10/7/05 12:05 PM Page x

■
CHAPTER 11
Performing Ad Hoc Reporting Using Report Builder
. . . . . 321
Getting User Feedback
. . . . . . . . . . . . . . . . . . . . . . . . . . . . . . . . . . . . . . . . . . 322
Introducing the Report Model
. . . . . . . . . . . . . . . . . . . . . . . . . . . . . . . . . . . . 324
Adding a Report Model to BIDS
. . . . . . . . . . . . . . . . . . . . . . . . . . . . . . 324
Adding a Data Source
. . . . . . . . . . . . . . . . . . . . . . . . . . . . . . . . . . . . . . 325
Creating a Data Source View
. . . . . . . . . . . . . . . . . . . . . . . . . . . . . . . . 328
Creating a Report Model
. . . . . . . . . . . . . . . . . . . . . . . . . . . . . . . . . . . . 334
Using Report Builder
. . . . . . . . . . . . . . . . . . . . . . . . . . . . . . . . . . . . . . . . . . . . 341
Creating a Table Report
. . . . . . . . . . . . . . . . . . . . . . . . . . . . . . . . . . . . . 344
Adding a Matrix Report
. . . . . . . . . . . . . . . . . . . . . . . . . . . . . . . . . . . . . 351
Adding a Chart Report
. . . . . . . . . . . . . . . . . . . . . . . . . . . . . . . . . . . . . . 357
Summary
. . . . . . . . . . . . . . . . . . . . . . . . . . . . . . . . . . . . . . . . . . . . . . . . . . . . . 362
■
INDEX
. . . . . . . . . . . . . . . . . . . . . . . . . . . . . . . . . . . . . . . . . . . . . . . . . . . . . . . . . . . . . . . . . . . . . . . 363
■
C O N T E N T S
xi
4983FM.qxd 10/7/05 12:05 PM Page xi

4983FM.qxd 10/7/05 12:05 PM Page xii

About the Authors
■
RODNEY LANDRUM
is an MCSE working as a systems engineer, DBA,
and data analyst for a software development company in Pensacola,
Florida, that specializes in applications for the health-care industry.
He writes software reviews and feature articles for numerous maga-
zines, including Windows & .NET Magazine, SQL Server Magazine,
Connected Home, T-SQL Solutions, Microsoft Certified Professional
Magazine, and Electronic House.
■
WALTER J. VOYTEK II (JIM)
is the CEO and president of HealthWare
Corporation, a Microsoft Certified Partner, which specializes in infor-
mation technology solutions for the health-care industry. He has
worked in information technology for more than 30 years and in
health-care IT for nearly 20 years. He has spoken publicly at several
national conventions and also speaks for HealthWare in a variety of
settings each year. As the founder and chief software architect for
HealthWare, Jim has been instrumental in the design and develop-
ment of HealthWare’s award-winning solutions based on Microsoft
technologies.
xiii
4983FM.qxd 10/7/05 12:05 PM Page xiii

4983FM.qxd 10/7/05 12:05 PM Page xiv

About the Technical Reviewers
■
TRISH MIDDLETON
is a professional software developer with more than
15 years of experience. She is currently focused on C#, HTML, XSLT,
XML, and SQL Server while developing a Web application for Travis
Software. She obtained her MCSD and MCDBA last year while taking a
sabbatical from the corporate world. Outside of computers, Trish likes
to run, rollerblade, do yard work, and do home improvements. When she
isn’t doing those things, she’s playing with her three dogs—Toppsin,
Backspin, and Juliet.
■
CHRIS RAUSCH
has been a software engineer for the Sheridan Press for
more than eight years and has more than eleven years’ programming
experience. Chris has developed for the Unix/Solaris and Windows
platforms, creating Web applications and GUI-driven Windows appli-
cations using multiple languages, data stores, and protocols. Most
recently, he has accepted the role of project manager for several digital
technology projects.
■
THOMAS RIZZO
is a director in the SQL Server group and an 11-year
veteran at Microsoft. Beyond his work in SQL Server, Thomas has
worked in various server groups at Microsoft, including Exchange,
SharePoint, and BizTalk Server. He is also the author of books about
programming using Microsoft’s collaborative technologies, and he
recently coauthored Pro SQL Server 2005 (Apress, 2005). You can reach
Thomas at thomriz@microsoft.com.
xv
4983FM.qxd 10/7/05 12:05 PM Page xv

4983FM.qxd 10/7/05 12:05 PM Page xvi

Acknowledgments
I
would first like to thank my father, who, when I was 13, wanted me to be a systems analysts
like him. I didn’t know what that was exactly, but I knew that there were computers involved.
And computers meant games. When he bought my first Atari, with a 300-baud modem and a
Microsoft Basic Programming cartridge, I knew his intentions were good. Fifteen years later,
when I had become the modern equivalent of a systems analyst, he didn’t stop me from get-
ting an Atari tattoo, though he laughed the whole way through. So, I want to thank my dad for
his investment in my future and for his continuing encouragement.
I cannot thank enough my mother, Faye, for her support while I was writing this book and
during many other times. Knowing that I had three small children, a full-time profession, and
a book to write on a tight deadline constantly made her ask, “How do you do it?” I can say now,
“Not without you, Mom!”
I would also like to thank Karla, who has been a constant source of inspiration and encour-
agement, keeping me heads-down at the computer when I would rather have been shooting
pool—and for understanding while I worked on Chapter 2 in the train station in Madrid while
on vacation.
Jim, thank you for being the coauthor of this book. I enjoyed all the book meetings. You did
an excellent job.
I also would like to thank Eric Doverspike, who turned me on to the creative uses of ISNULL.
Eric is a dedicated .NET programmer with the sort of sound work ethic that I envy. I wish I could
get to work as early as he does. But 5:30 a.m. is sleepy time.
Finally, I would like to thank everyone at Apress who played important roles in shaping
the book. It’s immensely better, thanks to all your careful attention. Special thanks go to Tony
Davis, lead editor, and Tom Rizzo, technical reviewer, whose thoughtful comments not only
helped the book but made me a better writer. Thanks to Laura Cheu, who, under a pressured
deadline, kept everything moving swiftly forward and brought it all together. Hats off to the
copy editors, Kim Wimpsett and Julie McNamee, who leapfrogged over many hurdles to insure—
I mean, ensure—the text made sense.
You all did a great job!
Rodney Landrum
I would like to thank Rodney, my coauthor, because without him I would not have been involved
with this book at all. We have been colleagues for many years, and it has been a pleasure work-
ing with him. Having already written another book with Rodney and knowing the quality of his
writing, doing this book with him was an easy choice.
I would also like to thank my father, who introduced me to the world of electronics when
I was still very young. His interest in digital electronics would prove to be the spark that set me
on my path to a career in information technology. I remember so clearly the day he brought a book
home called Digital Computers Made Simple. I read it and thought to myself how exciting it was
xvii
4983FM.qxd 10/7/05 12:05 PM Page xvii

that a machine could be built and programmed to do so many different things. I could see so
many possibilities, and at that point I knew I was hooked.
My first exposure to computer technology started about the time the Intel 8008 became
available. With my father’s help, I was able to procure one of these early microprocessors, and
it became the basis for the first microcomputer I ever built. Using these early technologies, I built
and entered several computer systems in science-fair projects throughout my high-school years,
eventually competing at the international level.
My corporate career began early when I started my first company while still in high school.
Today I am the CEO of HealthWare Corporation, a company that provides information tech-
nology to the health-care field. I am also partners in several other businesses with interests
ranging from technology to real estate.
I would like to thank my wife, Kathi, who has put up with the long hours that it took to
write the book. She is a wonderful companion who understands me well and always provides
support and encouragement for any endeavor I undertake.
I would also like to thank my mother, who encouraged me all those years in school when
I was participating in science fairs. Thanks to my sister, who always tells me she gave up her
computer technology genes so I could have them. And to the rest of my family, friends, and
colleagues who supported me and my wife, Kathi, throughout the process of writing this book.
A very big thank you goes to HealthWare Corporation and all of its employees and customers.
They have been instrumental in my career and have provided inspiration for writing the book.
Special thanks go to Bruce and Cindi Yarbrough, who welcomed me into their home when
hurricanes forced us to move HealthWare’s data center operations to Atlanta. Thank you also
to my nephew Ethan for introducing me to gaming on Microsoft’s Xbox while I was there.
Thanks also go to Apress and the wonderful people involved with this project for their
important roles in getting this book to print: lead editor Tony Davis; project manager Sofia
Marchant; technical reviewers Chris Rausch, Trish Middleton, and Tom Rizzo; copy editors
Kim Wimpsett and Julie McNamee; production editor Laura Cheu; indexer Kevin Broccoli;
proofreaders April Eddy and Linda Seifert; comp house Kinetic Publishing Services; and any
others involved with their important roles in getting this book to print.
Special thanks go to Tom Rizzo, the SQL Server product manager at Microsoft, for answer-
ing many questions for us during the course of our writing and for putting us in contact with
other resources within Microsoft when needed.
Walter J. Voytek II
■
A C K N O W L E D G M E N T S
xviii
4983FM.qxd 10/7/05 12:05 PM Page xviii

Introduction
A
t its core, the process of designing reports hasn’t changed substantially in the past 15 years.
The report designer lays out report objects, which contain data from a known data source, in
a design application such as Crystal Reports or Microsoft Access. He or she then tests report
execution, verifies the accuracy of the results, and distributes the report to the target audience.
Sure, there are enough differences between design applications to mean that the designer
must become familiar with each particular environment. However, there’s enough crossover
functionality to make this learning curve small. For example, the SUM function is the same in
Crystal Reports as it is in Microsoft Access as it is in Structured Query Language (SQL).
With Microsoft SQL Server 2005 Reporting Services (referred to as SSRS throughout the book),
there is, again, only a marginal difference in the way reports are designed from one graphical
report design application to another. So, if you do have previous reporting experience, your
learning curve for SSRS should be relatively shallow. This is especially true if you come from a
.NET environment, because the report designer application for SSRS is Visual Studio 2005 or
the application included with SQL Server 2005, Business Intelligence Development Studio (BIDS).
Having said all this, several differences set SSRS apart from other reporting solutions:
• It provides a standard reporting platform based on Report Definition Language (RDL),
which is the XML schema that dictates the common structure of all SSRS reports. This
allows for report creation from any third-party application that supports the RDL schema.
• SSRS is an integral part of the SQL Server 2005 release.
• SSRS offers features out of the box that in other products would be expensive additions
to a basic deployment. These features include subscription services, report caching,
report history, and scheduling of report execution.
• SSRS, being a Web-based solution, can be deployed across a variety of platforms.
This book was written in parallel with a real SSRS deployment for a health-care application,
so it covers almost every design and deployment consideration for SSRS, always from the stand-
point of how to get the job done effectively. You’ll find step-by-step guides, practical tips, and
best practices, along with code samples that you’ll be able to modify and use in your own SSRS
applications.
What This Book Covers
From designing reports and stored procedures in Chapters 2–4, to deployment, management,
and security processes in Chapters 6–9, the book uses a standard real-world theme to show
how we chose to work with SSRS. Throughout, you’ll find tips and tricks that we discov-
ered while working closely with SSRS. The book also covers extending SSRS functionality with
xix
4983FM.qxd 10/7/05 12:05 PM Page xix

custom code in Chapter 5. In addition, we will demonstrate almost all the enhancements that
are included with the SQL Server 2005 version of SSRS, including multivalued parameters, inter-
active sorting, and an entire chapter devoted to the ad hoc Report Builder application.
The following is a chapter-by-chapter breakdown to give you a feel for what the book covers:
Chapter 1, “Introducing the Reporting Services Architecture”: This chapter introduces
SSRS and discusses some of the driving forces behind our company’s adoption of this
technology. We then take a detailed look at the component pieces of the SSRS architecture,
including Report Manager, BIDS, and the SSRS report server and databases. We describe
how these work together to provide an effective reporting solution. We will also highlight
all the new features and enhancements to the latest version of SSRS for SQL Server 2005.
We finish with installation and configuration instructions.
Chapter 2, “Report Authoring: Designing Efficient Queries”: The foundation of any report
is the SQL query that defines the report data. In this chapter, we examine the query devel-
opment process and show how to build and test high-performance queries for business
reports. We also show how to encapsulate such queries in parameterized stored proce-
dures to benefit from precompilation and reuse.
Chapter 3, “Using Report Designer”: This chapter explores BIDS in detail, demonstrating
the use of all the major embedded elements of SSRS within that environment. It shows
how to create data sources; how to add report parameters, filters, and expressions; and
provides an in-depth look at the layout section for report design.
Chapter 4, “Building Reports”: Having covered query and report design basics, we now
walk you through the process of building a full business report, including interactive
features such as document maps, hyperlinks, and bookmarks.
Chapter 5, “Using Custom .NET Code with Reports”: This chapter shows you how to
customize your reports using .NET code, either by embedding Visual Basic .NET code
directly in your report or by using a custom .NET assembly. We discuss and demonstrate
each technique and its pros and cons.
Chapter 6,“Rendering Reports from .NET Applications”: This chapter shows how to control
the rendering of your reports programmatically in a variety of supported formats, either
via URL access or by using the Web services API.
Chapter 7, “Deploying Reports”: SSRS provides several means of deploying reports: using
the Report Manager interface, using VS .NET, using the rs command-line utility, or writing
code using the Web services API. This chapter demonstrates and explains each of these
techniques.
Chapter 8, “Managing Reports”: This chapter examines the many facets of SSRS report
management, including content management, performance monitoring, report execu-
tion auditing, and control. It shows how to perform each of these tasks effectively, using
built-in tools such as Report Manager, the new Report Server Configuration Manager, and
command-line utilities, as well as using custom .NET management tools.
Chapter 9, “Securing Reports”: This chapter introduces several important components of
SSRS security, namely, data encryption, authentication and user access, and report auditing.
This chapter also shows how to use each of these components in a secure SSRS deployment.
■
I N T R O D U C T I O N
xx
4983FM.qxd 10/7/05 12:05 PM Page xx

Chapter 10, “Delivering Business Intelligence with SSRS”: In our work, we found that by
integrating SSRS with many of the other components of the business intelligence (BI)
platform, we were able to provide all the necessary information to our employees wherever
they were and whenever they needed it, thus dramatically improving our overall business
strategy. In this chapter, we demonstrate how we set about integrating SSRS with BI com-
ponents such as CRM, SharePoint Portal Server, and Analysis Services.
Chapter 11, “Performing Ad Hoc Reporting Using Report Builder”: In the final chapter,
we will demonstrate the much anticipated Report Builder application, a Web-based report
design tool for end users to build their own reports. The reports are created using report mod-
els as data sources. We will show how to build and deploy a report model and tap into it with
Report Builder.
In each chapter, we’ve tried to touch on every aspect of SSRS in enough detail to allow you
to translate the concepts into your own applications. Our intention was to provide truly practical,
useful information on every page and not to parrot material that’s adequately covered in Books
Online (BOL). To that end, concepts such as cascading parameters and designing reports with
hierarchical data using the LEVEL function aren’t covered, because you can find adequate expla-
nations and working examples in BOL.
We believe this book will serve as both an introduction and a step-by-step guide through
many common tasks associated with SSRS, while also offering concepts and solutions that
we’ve been developing ourselves for our own applications.
Who This Book Is For
We coauthored the book with the intention of demonstrating how to use SSRS from multiple
vantage points. As a data analyst and engineer, Rodney goes through the report design and
deployment processes using standard SSRS tools such as Report Designer and Report Manager.
As a .NET developer, Jim takes on the role of showing how other developers can extend SSRS
by creating custom Windows Forms applications, as he explains the SSRS programming model.
Source Code
In this book, we use a subset of a real database designed for a health-care application that we
developed. You can find that prepopulated database (which we named Pro_SSRS, for the book),
the data mart database and cube file used in Chapter 10, the completed RDL files, queries,
stored procedures, and .NET application projects, as well as full installation instructions, in
the Source Code section of the Apress Web site (http://www.apress.com).
■
I N T R O D U C T I O N
xxi
4983FM.qxd 10/7/05 12:05 PM Page xxi

4983FM.qxd 10/7/05 12:05 PM Page xxii

Introducing the Reporting
Services Architecture
W
hen Microsoft announced in 2003 that it was going to release SQL Server Reporting Services
(SSRS) as a SQL Server 2000 add-on, a frenzy of excitement ensued. The product was originally
slated for release with SQL Server 2005, so the early release was a welcome event for many. Our
software development company decided to embrace SSRS early on and was fortunate to work
with Microsoft during the beta phases. In January 2004, the month SSRS was released to man-
ufacturing (RTM), we deployed it immediately. We intended to migrate all of our existing reports
(which had been developed on as many as five reporting applications and platforms over the
past ten years) to SSRS. We can sum up the reason for the seemingly rapid decision in one word:
standardization.
Just as Microsoft wanted to create an industry standard with Report Definition Language
(RDL), the Extensible Markup Language (XML) schema that dictates the common structure of
all SSRS reports, we wanted to provide a standard reporting solution to our customers. Even in
the first version of the product, SSRS delivered almost all the features we needed. Thanks to
its extensibility via SSRS’s Web service, we could programmatically add other features that
weren’t already directly supported. In addition, Microsoft was committed to enhancing SSRS
over time. Even prior to SSRS for SQL Server 2005 (SS2005), Microsoft provided valuable enhance-
ments such as client-side printing in service pack releases.
That brings us to present day, to the SSRS enhancements that have been incorporated
into the long-awaited release of SQL Server 2005. SSRS has taken its place as a key component
in the latest release of SQL Server and can no longer be thought of as just an add-on. The new
features in SSRS are extensive (we provide an overview of these features shortly), and in most
cases the incubus for their inclusion in the SSRS for SQL Server 2005 release was direct user
feedback. Throughout the book, we will demonstrate each of these new features as we show
how to build reports and applications. Furthermore, we’ll explore how SSRS integrates with
other new features in SSRS of SQL Server 2005 and how you can utilize these features to build
comprehensive and effective business intelligence (BI) and Web reporting solutions.
1
C H A P T E R 1
■ ■ ■
4983ch01.qxd 10/7/05 10:00 AM Page 1

C H A P T E R 1
■
I N T R O D U C I N G T H E R E P O RT I N G S E R V I C E S A R C H I T E C T U R E
2
Understanding the Benefits of SSRS
The decision of our company to migrate immediately to SSRS was based on the following
perceived benefits for the company and for our customers:
Standard platform: In addition to providing a standard realized with the RDL, our devel-
opment teams had been using Visual Studio .NET (VS .NET) as their main development
environment. Because SSRS reports were currently developed within this platform, we
wouldn’t need to purchase additional development software. Our clients would need to
purchase only a low-cost edition of a designer—Visual Basic (VB) .NET, for example—to
gain the benefit of developing custom reports themselves. In SQL Server 2005, Business
Intelligence Development Studio (BIDS) is included as a free, alternative report designer.
Because it is based on Visual Studio 2005 (VS 2005), report designers who learn to design
reports with BIDS can move to the full VS 2005 environment anytime with no additional
training.
Cost: SSRS is an integral part of SQL Server 2005 and is available in many editions, from
Express to Enterprise. When you purchase SQL Server, you get SSRS as well.
Web-enabled: Because SSRS is a Web-based reporting solution, a single deployed report
is accessible to a variety of clients, from the browser to custom Windows Forms. Also,
because reports are accessed via Hypertext Transfer Protocol (HTTP) or HTTP Secure
(HTTPS), you can view reports from any location that has access to the SSRS Web server,
which no longer requires reports to be installed locally with heavy client applications.
Customizable: SSRS provides a .NET Web service as a front end and as such can be accessed
programmatically to extend the delivery of reports beyond the browser. As .NET program-
mers, we knew we would want to build custom applications to render reports where we
could control the look and feel of the report viewer. We show one such application in
Chapter 6, which covers report rendering.
Subscriptions: Having the ability to deliver reports through e-mail or a file share and
processed during off-peak hours, which was offered with SSRS subscription abilities, was
a huge advantage for our company and our clients. We show how to set up two different
kinds of subscriptions, standard and data-driven, in Chapter 8.
As you’ll see, SSRS is a full reporting solution that encompasses many levels of professional
expertise, from report design to database administration. In many organizations, especially
small- to medium-sized ones, information technology (IT) professionals are asked to perform
many jobs. They write a query and design a report in the morning, perform database backups
or restores in the afternoon, and update all the systems before heading home.
Fortunately, during external deployment of SSRS to our clients and internal deployment
for my software development company, I (Rodney) have worn each of these hats on a day-to-
day basis. I have been entrenched in every deployment phase. By developing efficient stored
procedures, designing reports, testing security, and maintaining deployed reports as a content
manager, I have witnessed the day-to-day operation of SSRS from many perspectives.
In addition to those roles, I have also been responsible for our company’s overall strategy
for building solutions to analyze and transform the data that’s gathered through both our own
and other third-party applications. To that end, an essential part of my job was integrating SSRS
into the overall BI strategy that incorporated the following:
4983ch01.qxd 10/7/05 10:00 AM Page 2

C H A P T E R 1
■
I N T R O D U C I N G T H E R E P O RT I N G S E R V I C E S A R C H I T E C T U R E
3
• Disparate data sources such as Analysis Services Cubes and SQL Server relational
databases
• Applications and tools such as Microsoft Excel and Business Scorecards
• Document management systems such as Microsoft SharePoint Portal Server
We’ll dive into the details of such integration projects in Chapter 10, which is devoted to BI.
SSRS represents another world—a world that an administrator who uses standard man-
agement tools doesn’t typically witness. That is the world of the software developer who can
extend and control SSRS programmatically, building custom report viewers and deployment
applications. In this book, as you work through each step of building a reporting solution for
health-care professionals, we’ll demonstrate how an administrator can accomplish the task
with built-in tools, as well as how a developer can create an application to provide enhanced
functionality.
SSRS IN CONTEXT: GREEN BAR, ANYONE?
Before we begin our breakdown of the overall SSRS platform, I (Rodney) will share a personal experience
that illustrates one of the many challenges that SSRS addresses. That is, the story shows that creating an
environment where the method in which the data is delivered to users is often as crucial as the data itself.
Users want easy and fast access to data in an intuitive but powerful interface. SSRS overcomes this challenge
of changing the way users work by delivering reports in applications that are already familiar to most users:
browsers and e-mail clients.
Jumping back in time a few years—well, 12 years—when I started down the path of what is now
described correctly as IT, I took a job as an intern in the government sector. I should have known by the
Data Processing Center banner over the door to my interviewer’s office that I wasn’t exactly stepping into the
modern digital age. I was offered the lowly position of mainframe computer operator, which I took eagerly
despite that I knew I would be eating boiled eggs and tomato soup for the foreseeable future. On the first day,
I was introduced to two assemblages of technology that my father, who also worked in data processing (DP),
introduced me to in the early 1980s: a vault full of reel-to-reel magnetic tapes and box after box of green bar
paper. In time I came to both appreciate and loathe the rote task of, every night, printing thousands of pages
of reports that I knew would only be scanned by a few people and then discarded. I say that I appreciated the
task because every so often I would be visited by a programmer who wrote one of the reports. We’d talk about
the time it took to write the report, why he constantly had to update the reports, and who was asking for the
updates (typically a high official). We would also commiserate about the fact that generating such a report
each night was a complete waste of valuable resources. I could only hope he meant me.
One day I heard a rumor that my beloved Data Processing Center was going to be absorbed by another
government body. I learned, as many did, that sweeping changes would affect my position. New supervisors
came in and surveyed the inherited archaic technology landscape. What happened was astounding in many
regards. The banner over my former boss’s door was the first to be altered; with the stroke of a paintbrush
we were now
Information Resources. The new regime didn’t think “computer operator” was a good title for
me anymore. In less than the time it takes to print 3,000 checks, I became a “data specialist,” and I could
now eat spaghetti with real meat sauce.
4983ch01.qxd 10/7/05 10:00 AM Page 3

C H A P T E R 1
■
I N T R O D U C I N G T H E R E P O RT I N G S E R V I C E S A R C H I T E C T U R E
4
I bided my time, awaiting a new system that would mean I could take the reins in my new administrative
position and stop hauling the green bar. A new system was duly purchased, and I was elated. Finally, I thought,
they’ll bring in a modern networked system that will have online report delivery technologies. On the day the
hardware was delivered, I looked in awe at my—technically, their—new IBM RS6000. Fortunately for every-
one except me, the new printer that was delivered accepted the same green bar paper that we had
stockpiled for years to come!
This story demonstrates that often the benefits of new technologies go unrealized because of the habitual
nature of the workers who are forced to adopt that new technology. Users who relied on the Data Processing
Center were used to receiving their 200-page reports each morning and tossing them by noon. If the reports
weren’t discarded, they were bound, bundled, and hauled to the basement for future reference. It had been
done that way for years. It seemed that only the people who appreciated the work that went into the reports—
the programmers and computer operators—understood the ridiculousness of the practice.
In the ensuing years, I had a number of positions, all of which involved delivering data in myriad report-
ing technologies, using a plethora of data stores. One day it was scrubbing data from Indexed Sequential
Access Method (ISAM) files; the next day saw me pulling data from a Unix-based Oracle database. With the
blessing of Open Database Connectivity (ODBC), data was accessible in almost any format.
Eventually I began work with Microsoft SQL Server 6.5 and have remained there through versions 7.0
and 2000. Over the latter years, Microsoft released a variety of applications that made my job significantly
easier while offering much in the way of data delivery. A notable example was the introduction of Online
Analytical Processing (OLAP) Services in 7.0, which became Analysis Services in 2000. However, one item
that always seemed just out of reach was a client application that could be used to effectively deliver the
data contained within these new technologies. Sure, Excel could tap into OLAP cubes, and Data Analyzer
was a promising addition, but these were expensive applications that required local installations. Surely
a Web-enabled reporting application would be available soon, right?
This brings me to the present, where SSRS has been unveiled and is holding its own as a prime
contender in the reporting market space. SSRS has been available as an add-on to SQL Server 2000 for
more than a year now. It met or exceeded my expectations as a version 1 product in most areas. Yet, from
reading the public newsgroups and through my own experience, it was obvious that Microsoft needed to
address a number of shortcomings. A couple of the SSRS enhancements, such as client-side printing func-
tionality and SharePoint Web Parts for Reporting Services, made their way into the two service packs that
have been released for SSRS for SQL Server 2000. However, many other features are specific to SQL Server
2005. In the following two sections, we’ll cover first the new SSRS features and then the enhancements to
Microsoft’s BI platform, with which SSRS can be fully integrated (as we will demonstrate throughout the book).
SQL Server 2005 Reporting Services Enhancements
The following are the most significant enhancements made to the SSRS technology that have
emerged since version 1.
Report Builder/Data Modeler
The Report Builder application, a new feature to SSRS for SQL Server 2005, is a local, ad hoc,
report-designing application that is intended to be used more by report consumers than by
report developers. The business logic and underlying data structures are created as a data model
by an administrator who is familiar with the source data. With the Report Builder application,
the user can create and publish reports based on available models. Chapter 11 covers how to
ts with the Report Builder application.
4983ch01.qxd 10/7/05 10:00 AM Page 4

C H A P T E R 1
■
I N T R O D U C I N G T H E R E P O RT I N G S E R V I C E S A R C H I T E C T U R E
5
Multivalue Parameters
SSRS 2000 supported report input parameters, allowing for the autogeneration of report
parameters from query or stored procedures parameters, drop-down selectable data values,
and default values. However, it soon became evident that the inability to select more than one
value at a time to pass into the report was a serious limitation. What if you needed to see, for
example, 2003 and 2004 data from a list of available values such as “2002,2003,2004”? In SSRS
for SQL Server 2000, you could see 2003 or 2004 or all the years, but 2003 and 2004 was not an
available option. SSRS for SQL Server 2005 addresses this limitation. We will cover multivalued
parameters in Chapter 4.
Enhanced Expression Builder
Expressions are the core components of any SSRS report. With expressions it is possible to
selectively control not only the content but also the desired behavior of report. Knowing this,
Microsoft has included an enhanced expression editor in SSRS for SQL Server 2005, replacing
the limited version in the previous release. The expression builder in SSRS for SQL Server 2000
was little more than a textbox for code entry. Now the expression builder includes a categorized
list of available functions, such as String and DateTime functions, as well a built-in IntelliSense
that validates the expression as it is being typed.
Graphical MDX Query Builder
Multidimensional Expressions (MDX), used to query OLAP data cubes, is a robust language
that when used effectively can derive information that would be impractical to do with Transact
SQL (T-SQL). However, MDX is a complex language with strict syntactical requirements, and
thus MDX queries can be tricky to formulate. In SSRS for SQL Server 2000, MDX was supported,
but the queries could not be created graphically. SSRS for SQL Server 2005 includes a graphical
MDX query builder that you will use in Chapter 10 when designing your Analysis Services
application.
Embeddable SSRS Controls
The ability to embed controls in custom applications makes it easier for developers to inte-
grate SSRS into their projects. SQL Server 2005 includes freely distributable controls that you
can use for Windows Forms development and ASP.NET Web Forms development. These controls
provide additional benefits to developers, such as the ability to render reports while disconnected
from the SSRS. We will cover SSRS controls in Chapter 6.
Rich Client Printing
SSRS has always had the capability to deliver reports in a variety of formats, but not all of them
were print-ready. Reports rendered in Hypertext Markup Language (HTML), for example,
provided interactive features such as drilling down, but printing large reports rendered in the
browser was not printer-friendly. Often, sections of the report would be truncated or paginated
incorrectly. You could create delivery extensions with SSRS for SQL Server 2000 to print directly
to a client printer. With SSRS for SQL Server 2005, this functionality is built in.
4983ch01.qxd 10/7/05 10:00 AM Page 5

C H A P T E R 1
■
I N T R O D U C I N G T H E R E P O RT I N G S E R V I C E S A R C H I T E C T U R E
6
Interactive Sorting
The ability of users to sort report data after rendering provides another level of interactivity
that, potentially, mitigates the need to deploy multiple reports. SSRS for SQL Server 2005
allows report developers to define interactive sorting, which you will explore in Chapter 4.
SSRS and Business Intelligence
Because SSRS is but one component of Microsoft’s BI platform, we’ll now cover other new
features and enhancements to SQL Server 2005 that will form an integral part of your overall
reporting solution.
Business Intelligence Development Studio (BIDS)
BIDS is a limited version of Visual Studio 2005 that is included with the SQL Server 2005 base
installation. With BIDS, developers can create entire projects for each of the supported com-
ponents of SQL Server 2005, including SQL Server Integration Services (SSIS), SQL Server
Analysis Services (SSAS), and of course SSRS. We will use BIDS throughout the book to show
how to design and deploy SSRS reports and Analysis Services projects.
SQL Server Management Studio (SSMS)
With the new SQL Server Management Studio (SSMS), Microsoft has taken a big step toward
consolidating within one environment many of the tools that in previous versions of SQL
Server would have been executed individually. SSMS replaces Enterprise Manager and Query
Analyzer, offering a much more elaborate set of tools for creating and managing SQL Server
objects and queries. In addition to managing SQL Server and Analysis Services servers, admin-
istrators can use SSMS to manage instances of their SSRS reporting servers. In the previous
version of SSRS, this level of control was available graphically through the browser-based
Report Manager or a custom application.
We will show how to use both SSMS and Report Manager throughout the book for differ-
ent tasks. We will show how to use SSMS, for example, to test query performance, a task done
previously with Query Analyzer. In addition, we will show you how to use the browser-based
Report Manager to view published reports, set security permissions, and create subscriptions.
Both applications share functionality for managing SSRS; however, Report Manager is often
preferable to SSMS because it does not require a local installation. You can access Report
Manager from a browser anywhere on your network. You would need to have access to the
installed SQL Server 2005 client tools in order to use SSMS.
SharePoint Web Parts
SharePoint, either in Microsoft SharePoint Portal Server (SPS) or in Windows SharePoint Services
(WSS), has become one of Microsoft’s most successful products. SSRS for SQL Server 2005
provides tighter integration with SharePoint by way of Web Parts that connect directly to SSRS
reports on the report server. Chapter 10 covers how to incorporate these controls into a BI
application.
4983ch01.qxd 10/7/05 10:00 AM Page 6

C H A P T E R 1
■
I N T R O D U C I N G T H E R E P O RT I N G S E R V I C E S A R C H I T E C T U R E
7
Exploring the SSRS Architecture
You’ve probably heard the expression that the devil is in the details. You’ll be drilling into
those details throughout the book, right down to the data packets that SSRS constructs, as you
explore each aspect of SSRS from design to security. For now, let’s pull back to a broader vantage
point—the 10,000-foot view—and look at the three main components that work together to
make SSRS a true multitier application: the client, the report server, and the SQL Server report
databases. Figure 1-1 shows the conceptual breakdown of the three component pieces.
Figure 1-1.
SSRS components
4983ch01.qxd 10/7/05 10:00 AM Page 7

Here, the data source and the SSRS databases, ReportServer and ReportServerTempDB, are
separate entities; the data source is the origin of the data that will populate the reports; and
the report server databases store information about the reports. Both the data source and the
report server databases can physically be located on the same SQL Server, assuming the data
source is a SQL Server database. The data source can be any supported data provider, such as
SQL Server, Oracle, Lightweight Directory Access Protocol (LDAP), or Analysis Services. It’s
possible to configure a single server to act as both the SSRS report server web service and report
server database as well as the data source server. However, this isn’t recommended unless you
have a small user base. We’ll show how to monitor the performance of the SSRS configuration
and build a small Web farm, post-installation, in Chapter 8.
SSRS Databases
The SSRS installation creates two databases:
ReportServer: This is the primary database that stores all the information about reports
that was originally provided from the RDL files used to create and publish the reports to
the ReportServer database. In addition to report properties (such as data sources) and
report parameters, ReportServer also stores folder hierarchy and report execution log
information.
ReportServerTempDB: This database houses cached copies of reports that you can use to
increase performance for many simultaneous users. By caching reports using a nonvolatile
storage mechanism, you make sure they remain available to users even if the report server
is restarted.
Database administrators can use standard tools to back up and restore these two databases.
An additional database might be added after the initial installation of SSRS: the RSExecutionLog
database. This database stores more discernable information about report execution, such as
the user who ran the report, the time of execution, and performance statistics. We’ll cover cre-
ating the RSExecutionLog database and discuss report execution logging in detail in Chapter 8.
The SSRS Report Server
The SSRS report server plays the most important role in the SSRS model. Working in the mid-
dle, it’s responsible for every client request to render a report or to perform a management
request, such as creating a subscription. You can break down the report server into several
subcomponents by their function:
• Programming interface
• Report processing
• Data processing
• Report rendering
• Report scheduling and delivery
C H A P T E R 1
■
I N T R O D U C I N G T H E R E P O RT I N G S E R V I C E S A R C H I T E C T U R E
8
4983ch01.qxd 10/7/05 10:00 AM Page 8

C H A P T E R 1
■
I N T R O D U C I N G T H E R E P O RT I N G S E R V I C E S A R C H I T E C T U R E
9
SSRS Web Service Interface
The programming interface, exposed as .NET Web service application programming interfaces
(APIs) and uniform resource locator (URL) access methods, handles all incoming requests from
clients, whether the request is a report request or a management request. Depending on the type
of request, the programming interface either processes it directly by accessing the ReportServer
database or passes it off to another component for further processing. If the request is for an
on-demand report or a snapshot, the Web service passes it to the Report Processor before
delivering the completed request to the client or storing it in the ReportServer database.
■
Note
On-demand reports are ones that are rendered and delivered directly to the client, while snapshots
are reports that are processed at a point in time and delivered to the client through e-mail, to the client through
file shares, or (if configured) directly to a printer.
The Report Processor
The Report Processor component is responsible for all report requests. Like the programming
interface, it communicates directly with the ReportServer database to receive the report defi-
nition information that it then uses to combine with the data returned from the data source,
which is accessed via one of the data processing extensions.
Data Processing
SSRS supports four data processing extensions to connect to data sources. These are SQL
Server, Oracle, OLE DB, and ODBC. When the data processing component receives the request
from the Report Processor, it initiates a connection to the data source and passes it the source
query. Data is returned and sent back to the Report Processor, which then combines the elements
of the report with the data returned from the Data Processor extension.
Report Rendering
The combined report and data is handed off to the rendering extension component to be
turned into one of several supported formats, based on the rendering type specified by the
client (we cover rendering in depth in Chapter 6):
• HTML: Default rendering format, supporting HTML versions 4.0 and 3.2.
• Portable Document Format (PDF): Format used to produce print-ready reports using
Adobe Acrobat Reader. SSRS doesn’t require that you have an Adobe license to render in
PDF, which is a great benefit to customers. All you need is a PDF reader.
• HTML using the Office Web Components (OWC): Can be used for rendering reports that
are designed to take advantage of the extended features of OWC, such as a pivot table or
chart. HTML for OWC has been depreciated in SSRS 2005 and needs to be enabled post
installation. We show you how to do this in Chapter 8.
• Excel 2002 and 2003: Service Pack 1 of SSRS supports Excel 97 and later.
eports that are exported to XML.
4983ch01.qxd 10/7/05 10:00 AM Page 9

• Comma-separated values (CSVs): By rendering to a CSV file, you can further process the
report by importing it into other CSV-supported applications such as Microsoft Excel.
• MIME HTML (MHTML): You can use this format, also known as a Web archive, to deliver
reports directly in e-mail or to deliver them for storage, because the report contents,
including images, are embedded within a single file.
• Tagged Image File Format (TIFF): Rendering image files using TIFF guarantees a stan-
dard view of the report, as it’s processed the same way for all users despite their browser
settings or versions.
Scheduling and Delivery
If the request from the client requires a schedule or delivery extension, such as a snapshot or
subscription, the programming interface calls the Scheduling and Delivery Processor to handle
the request. You can generate and deliver report snapshots based on a user-defined or shared
schedule to one of two supported delivery extensions: an e-mail or a file share. Note that SSRS
uses the SQL Server Agent to create the scheduled job. If the SQL Server Agent isn’t running,
the job won’t execute. We’ll cover creating subscriptions and snapshots based on shared
schedules in Chapter 8.
Client Applications
SSRS includes several client applications that use the SSRS programming interface, namely,
its Web service APIs, along with URL access methods to provide front-end tools for users to
access both SSRS reports and configuration tools. These tools provide report server manage-
ment, security implementation, and report-rendering functionality. The tools are as follows:
• Report Manager: This browser-based application ships with SSRS and provides a graph-
ical interface for users who need to view or print reports or to manage report objects for
their workgroups or departments. We cover Report Manager in detail in Chapter 8, which
covers managing SSRS.
• BIDS: This tool provides an integrated environment for developing SSRS reports. We
introduce BIDS in Chapter 3 and step through building reports in this environment in
Chapter 4.
• Command-line utilities: You can use several command-line tools to configure and man-
age the SSRS environment, including rs, rsconfig, RSKeyMgmt.
• Custom clients: These VB .NET Windows Forms and Web applications call the SSRS Web
service to perform such tasks as rendering reports and managing report objects. SSRS
includes sample application projects that you can compile and run to extend the func-
tionality provided by the main tools listed earlier. In Chapters 6 and 7 we show how to
develop your own custom applications: a report viewer and a report publisher.
• Reporting Services Configuration Manager: Previously, SSRS relied on command-line
utilities or on direct modification of config files for changing many of the properties of
the SSRS installation. SSRS for SQL Server 2005 includes a new tool designed specifically
to change many of these properties in a graphical environment.
C H A P T E R 1
■
I N T R O D U C I N G T H E R E P O RT I N G S E R V I C E S A R C H I T E C T U R E
10
4983ch01.qxd 10/7/05 10:00 AM Page 10

C H A P T E R 1
■
I N T R O D U C I N G T H E R E P O RT I N G S E R V I C E S A R C H I T E C T U R E
11
When thinking of a Web-based application, the natural inclination is to think Web
browser. Even though other front-end tools, such as SSMS and BIDS, connect to the report
server, a Web browser plays an important role in providing the graphical interface for users
who view or print reports or remotely manage the report server for their workgroups or
departments.
Report Manager
Within Report Manager, users can render reports, create report subscriptions, modify the
properties of report objects, and configure security, as well as perform a host of other tasks.
Users can access Report Manager by simply opening their Web browser and navigating to
a URL of the form http://Servername/Reports. Figure 1-2 shows Report Manager in action,
with a listing of reports in a folder deployed specifically for clinicians.
Business Intelligence Development Studio (BIDS)
The browser is only one of several clients that can use the SSRS Web service. In fact, BIDS is
a client when it interacts with the Web service to deploy reports and data sources. BIDS offers
a graphical design environment that report developers use to produce the RDL files that SSRS
uses for deploying and rendering reports.
■
Note
Because RDL is a defined standard, you can use any design application that supports the creation
and many more are forthcoming.
Figure 1-2.
The Web-based Report Manager application
4983ch01.qxd 10/7/05 10:00 AM Page 11

C H A P T E R 1
■
I N T R O D U C I N G T H E R E P O RT I N G S E R V I C E S A R C H I T E C T U R E
12
Figure 1-3.
BIDS environment
By defining the base URL and folder name in a BIDS report project, you can deploy the
RDL files that are created directly to the report server while in design mode. The base URL is of
the form http://Servername/ReportServer. We’ll cover the entire BIDS design environment in
Chapter 3, including most available report objects. We’ll also describe the RDL schema that
defines every aspect of an SSRS report. Figure 1-3 shows the BIDS design environment, also
called an integrated development environment (IDE), with a report loaded in design mode.
Command-Line Utilities
In addition to graphical applications such as BIDS and SSMS, SSRS provides several command-
line utilities that are considered Web service clients. The tools have the added benefit of being
automated by using built-in task scheduling in Windows. SSRS includes four main command-
line utilities:
• rs: Processes report services script (RSS) files that are written with VB .NET code.
Because you can access the full SSRS API via the code in the script, all SSRS Web service
methods are available.
• rsconfig: Configures the authentication methods and credentials for how SSRS con-
nects to the ReportServer database. rsconfig also sets the unattended SSRS execution
credentials for SSRS.
• RSKeyMgmt: Manages the encryption keys that SSRS uses to store sensitive data securely,
such as authentication credentials. Chapter 9 covers how to use rskeymgmt.
4983ch01.qxd 10/7/05 10:00 AM Page 12

C H A P T E R 1
■
I N T R O D U C I N G T H E R E P O RT I N G S E R V I C E S A R C H I T E C T U R E
13
Custom Clients
The final types of clients are those custom designed to access the SSRS Web services. We’ve
built several such applications for our own company, such as a report viewer and report pub-
lisher. Third-party commercial applications exist that provide extended functionality. Other
clients, such as the new Report Builder application, is a good example of building not just
a report-rendering form but an entire design application that connects directly to the report
server and can be installed using standard ClickOnce technologies from within the browser.
Installing and Configuring
You can install SSRS—like Analysis Services, Integration Services, and Notification Services—
as part of the main SQL Server 2005 installation. When installing SSRS, you can choose which
components to install and also specify the initial configuration settings. You can see the com-
ponents available within the SSRS install portion of SQL Server 2005 in Figure 1-4; these include
both server and client components.
Figure 1-4.
Installation of SSRS components
Server components include the report server Web service, ReportServer databases, and
Report Manager. When installing the server components, you may have the option of config-
uring the installation to connect to an already existing SSRS database. By choosing this option,
the instance of SSRS you’re installing joins a Web farm of other SSRS servers, all using the same
ReportServer
database.
4983ch01.qxd 10/7/05 10:00 AM Page 13

C H A P T E R 1
■
I N T R O D U C I N G T H E R E P O RT I N G S E R V I C E S A R C H I T E C T U R E
14
■
Note
The standard edition of SSRS doesn’t provide support for setting up Web farms. Throughout the
book, we’ll be using the Developer edition of SSRS, which provides support for Web farms and for another
enterprise feature: data-driven subscriptions.
Client components include the administrative command-line tools mentioned previously,
such as rs and rsconfig, as well as documentation, samples and the Reporting Services
Configuration Manager.
As noted, the install process also allows you to set your initial SSRS configuration. For
example, you can do the following:
• You can choose security settings, such as whether the report server will use HTTP, use
HTTPS, or use both.
• You configure a Simple Mail Transfer Protocol (SMTP) mail server to handle the delivery
of subscriptions.
After you install SSRS, you can modify the configuration settings you chose during the
install in a few ways. For example, after reviewing performance data, you might decide that
the report server needs to connect to an existing Web farm. You can perform this task using
the rsconfig utility or using the graphical Report Services Configuration Manager.
You can reconfigure the security settings or the mail server by directly modifying the
RSReportServer.config
file. We’ll cover using these tools, modifying the configuration file set-
tings, and gathering performance measures in Chapters 8 and 9.
Deploying SSRS Securely
Security ranks as one of the highest priorities for businesses today. Providing customers and
employees with a secure and reliable computing environment is not only good practice but in
many cases it’s a requirement, mandated by stringent federal regulations. In our case, this meant
adherence to the Health Insurance Portability and Accountability Act (HIPAA), which requires
policies and procedures to be in place to guarantee that confidential patient information is
securely transmitted and accessible only by those with the authority to view it. To that end, we
have to ensure that the data we transmit over a network connection, especially the Internet, is
encrypted at its source.
SSRS is a role-based application that provides access to the objects it stores through the
use of defined roles, such as content browsers who may only view reports and report data. The
roles that SSRS provides are associated with Windows-based login accounts, so SSRS relies on
Windows as its primary source of authentication. It is possible to extend the security model
for SSRS to support other methods of authentication, such as forms-based authentication
whereby users can log in with accounts maintained outside Windows to access the report
server. Since SSRS has multiple authentication points—namely, at the report server level
through IIS and the data-access level, SQL, or Windows authentication—specific security risks
exist when altering the default Windows roles-based security model. For one, IIS would need
to be set up to allow anonymous access. Another is that SSRS can support only one security
extension at a time. In other words, a single SSRS report server either can be extended to sup-
Windows authentication, but
4983ch01.qxd 10/7/05 10:00 AM Page 14

C H A P T E R 1
■
I N T R O D U C I N G T H E R E P O RT I N G S E R V I C E S A R C H I T E C T U R E
15
not both simultaneously. Depending on your level of need for custom security—say, for example,
you need to deploy SSRS on an Internet-facing server, or your application already supports
forms authentication, and it would be too difficult to work within the constraints of Windows
authentication—then you might need to consider a custom security extension. Our needs
were such that we could easily incorporate SSRS into an existing Windows authentication
model.
In this book, we’ll cover two deployment scenarios:
• Intranet deployment using Virtual Private Network (VPN) and firewall technologies to
allow access to the SSRS report server
• Internet-hosted application that uses Terminal Services to connect securely to an SSRS
report server
In Chapter 9, we’ll walk you through securing the SSRS deployment models with technologies
that provide the required encryption levels and user authentication. In addition to the two
models that we will cover, we will also briefly discuss ways to integrate a forms-based authenti-
cation method that will allow clients to connect directly to SSRS via the Internet.
Summary
Having created and deployed numerous projects with SSRS for SQL Server 2000, we have been
anxiously awaiting, along with the rest of the SQL Server community, the release of SQL Server
2005 and the promised enhancements to SSRS. Though SQL Server 2005 has been a long time
coming, SSRS was fortunately released ahead of its anticipated schedule, so it has been tested
for more than a year. As you work through the book, we will point out enhancements where
applicable, but our aim, as with the first edition of the book, is to show how to take advantage
of advanced features, provide useful examples, and, mostly, put SSRS to work in a real-world
environment where the user who will be working with the reports and applications that you
deploy will have the final say on the solution’s success.
4983ch01.qxd 10/7/05 10:00 AM Page 15

4983ch01.qxd 10/7/05 10:00 AM Page 16

Report Authoring: Designing
Efficient Queries
S
SRS provides a platform for developing and managing reports in an environment that
includes multiple data sources of information. These data sources can include both relational
data (for example, SQL Server, Oracle, MySQL, and so on) and nonrelational data (for example,
Active Directory, LDAP stores, and Exchange Server). Standards such as ODBC, OLE DB, and
.NET facilitate the retrieval of data from these disparate data stores, so as long as your system
has the relevant drivers, SSRS can access the data. In the SSRS report design environment,
configuring a dataset that drives the report content is the first step of the design process.
However, before we introduce the many elements of the report design environment, it’s
important to begin with the heart of any data-driven report—whether it’s Crystal Reports,
SSRS, or Microsoft Access—and that is the query. With any report design application, develop-
ing a query that returns the desired data efficiently is the key to a successful report.
In this chapter, we will describe the following:
• The health-care database that is the target of the reporting queries in this book—you
cannot design efficient queries unless you understand the design of the data. We’ll also
describe an easy way to familiarize yourself with your data when the full schema details
are not available.
• How to design basic but effective SQL queries for reporting purposes; we’ll create
queries based on real-world applications, the kind that report writers and database
administrators create every day.
• How to use SSMS to gauge query performance; the initial query defines the performance
and value of the report, so it’s important to understand the tools required to create and
test the query to ensure that it’s both accurate and tuned for high performance.
• How to transform the optimized query into a parameterized stored procedure. This
gives you the benefit of precompilation for faster performance and the benefit of the
procedure being centrally updated and secured on SQL Server.
17
C H A P T E R 2
■ ■ ■
4983ch02.qxd 10/7/05 10:01 AM Page 17

C H A P T E R 2
■
R E P O RT A U T H O R I N G : D E S I G N I N G E F F I C I E N T Q U E R I E S
18
Introducing the Sample Relational Database
Throughout the book, we’ll show how to design and deploy a reporting solution and build
custom .NET SSRS applications for a SQL Server–based health-care application using relational
tables and stored procedures. The application was originally designed for home health and
hospice facilities that offer clinical care to their patients, typically in their homes. The Online
Transactional Processing (OLTP) database that powers this application, and the one we’ll use
for examples in this book, captures billing and clinical information for home health and hos-
pice patients. The database that we will use is called Pro_SSRS and is available for download in
the Source Code area of the Apress Web site (http://www.apress.com) with instructions avail-
able in the ReadMe.txt file on how to restore the database in preparation for use in this and
subsequent chapters.
Introducing the Schema Design
Over the years, the application has had features added, and the database schema has been
altered many times to accommodate the new functionality and to capture data that is required.
This data is needed not only to perform operational processes such as creating bills and post-
ing payments to the patient’s account but also to provide valuable reports that show how well
the company is serving its patients. Because these types of health-care facilities offer long-term
care, our customers need to know if their patients’ conditions are improving over time and the
overall cost of the care delivered to them.
The database that was ultimately designed for the application consists of more than 200
tables and has many stored procedures. In this book, you’ll use a subset of that database to
learn how to develop reports that show the cost of care for patients. You’ll use eight main tables
for the queries and for the stored procedures you’ll begin using to build reports in the next
chapter. These tables are as follows:
• Trx: The main transactional data table that stores detailed patient services information.
We use the term services to refer to items with an associated cost that are provided for
patient care.
• Services: Stores the names and categories for the detailed line items found in the Trx
table. Services could be clinical visits such as a skilled nurse visit, but they could also
include billable supplies, such as a gauze bandage or syringes.
• ServiceLogCtgry: The main grouping of services that are similar and provide a higher-
level grouping. For example, all visits can be associated with a “Visits” ServiceLogCtgry
for reporting.
• Employee: Stores records specific to the employee, which in this case is the clinician or
other service personnel such as a chaplain visiting a hospice patient. An employee is
assigned to each visit that’s stored in the Trx table.
• Patient: Includes demographic information about the patient receiving the care. This
table, like the Employee table, links directly to the Trx table for detailed transactional data.
• Branch: Stores the branch name and location of the patient receiving the care. Branches,
in the sample reports, are cost centers from where visits and services were delivered.
4983ch02.qxd 10/7/05 10:01 AM Page 18

C H A P T E R 2
■
R E P O RT A U T H O R I N G : D E S I G N I N G E F F I C I E N T Q U E R I E S
19
Figure 2-1.
Viewing the sample application’s database tables
• ChargeInfo: Contains additional information related to the individual Trx records that
is specific to charges. Charges have an associated charge, unlike payments and adjust-
ments, which are also stored in the Trx table.
• Diag: Stores the primary diagnoses of the patient being cared for and links to a record in
the Trx table.
Figure 2-1 shows a graphical layout of the eight tables and how they’re joined.
Knowing Your Data: A Quick Trick with a Small Procedure
For every report writer, familiarity with the location of the data in a given database can come
only with time. Of course, having a database diagram or schema provided by a vendor is a use-
ful tool, and we have the luxury of that here, but this isn’t always available. One day, faced with
the dilemma of trying to find the right table for a specific piece of missing data, we decided to
put together a stored procedure, which we named sp_FieldInfo. It returns a list of all the tables
in a specific database that contains the same field names, typically the primary or foreign key
fields. For example, in the health-care database, if you wanted a list of fields that contained
the PatID field (the patient’s ID number that’s used to join several tables), you would use the
following command:
4983ch02.qxd 10/7/05 10:01 AM Page 19

The output would be similar to that shown in Table 2-1.
Table 2-1.
Output of sp_fieldinfo
Table Name
Field Name
PatCertDates
PatID
PatDiag
PatID
PatEMRDoc
PatID
Trx
PatID
Patient
PatID
Admissions
PatID
Armed with this information, you could at least deduce that, for example, the patient’s
physician information is stored in the PatPhysician table. However, often table and field
names aren’t intuitively named. When we encounter a database such as this from time to time,
we run a Profiler trace and perform some routine tasks on the associated application, such as
opening a form and searching for an identifiable record to get a starting point with the captured
data. The Profiler returns the resulting query with table and field names that we can then use
to discern the database structure.
■
Tip
SQL Server Profiler is an excellent tool for capturing not only the actual queries and stored procedures
that are executing against the server but also the performance data, such as the duration of the execution
time, the central processing unit (CPU) cycles and input/output (I/O) measurements, and the application that
initiated the query. Because you can save this data directly to a SQL table, you can analyze it readily, and it
even makes good fodder as a source for a report in SSRS.
Listing 2-1 displays the code to create the sp_fieldinfo stored procedure. You can find
the code for this query in the code download file in the SQL Queries folder. The file is called
CreateFieldInfo.sql
.
Listing 2-1.
Creating the sp_fieldinfo Stored Procedure
IF EXISTS (SELECT * FROM sys.objects WHERE object_id =
OBJECT_ID(N'[dbo].[sp_FieldInfo]'))
DROP PROCEDURE [dbo].[sp_FieldInfo]
Go
CREATE PROCEDURE sp_FieldInfo
(
@column_name nvarchar(384) = NULL
)
AS
SELECT
C H A P T E R 2
■
R E P O RT A U T H O R I N G : D E S I G N I N G E F F I C I E N T Q U E R I E S
20
4983ch02.qxd 10/7/05 10:01 AM Page 20

C H A P T E R 2
■
R E P O RT A U T H O R I N G : D E S I G N I N G E F F I C I E N T Q U E R I E S
21
Object_Name(id) as "Table Name",
rtrim(name) as "Field Name"
FROM
syscolumns
WHERE
Name like @column_name
Introducing Query Design Basics
Whether you’re a seasoned pro at writing SQL queries manually through a text editor or
someone who prefers to design queries graphically, the end result is what matters. Accuracy,
versatility, and efficiency of the underlying query are the three goals that designers strive to
achieve. Accuracy is critical; however, having a query that’s versatile enough to be used in more
than one report and performs well makes the subsequent report design task much easier. For
scalability and low response times, efficiency is paramount. A great report that takes 15 min-
utes to render will be a report your users rarely run. Keep the following goals in mind as you
begin to develop your report queries:
The query must contain accurate data: As the query logic becomes more complex, the
chance of inaccuracy increases with extensive criteria and multiple joins.
The query must be scalable: As the query is developed and tested, be aware that its
performance might be entirely different as the load increases with more users. We cover
performance monitoring with simulated loads in Chapter 8. However, in this chapter we’ll
show how to use tools to test query response times for a single execution in order to
improve performance.
The query should be versatile: Often a single query or stored procedure can drive many
reports at once, saving on the time it takes to maintain, administer, and develop reports.
However, delivering too much data to a report at once, to support both details and a sum-
mary, can impact performance. It’s important to balance versatility with efficiency.
Creating a Simple Query Graphically
Query design typically begins with a request. As the report writer or database administrator
(DBA), you’re probably often tasked with producing data that’s otherwise unavailable through
standard reports that are often delivered with third-party applications.
Let’s begin with a hypothetical scenario. Say you receive an e-mail that details a report
that needs to be created and deployed for an upcoming meeting. It has already been deter-
mined that the data is unavailable from any known reports, yet you can derive the data using
a simple custom query.
In this first example, you’ll look at the following request for a health-care organization:
Deliver a report that shows the ten most common diagnoses by service count.
4983ch02.qxd 10/7/05 10:01 AM Page 21

Assuming you are familiar with the database, the query design process begins in SSMS,
either graphically or by coding the query with the generic query designer. Both methods are
available within SSMS.
■
Note
We’ll cover setting up the data source connection required for building an SSRS report in Chapter 3.
For now, you’ll connect directly to the data with the available query design tools within SSMS. It is important
to mention that though you are designing the query within SSMS, similar tools are available within the BIDS
so that you can create your queries at the same time you create your report. We chose SSMS in this case
because it contains lists of database objects that you may need to reference as you begin to develop the query.
We’ll show how to design the query with the graphical tool to demonstrate how the
underlying SQL code is created. You can access the graphical query designer by right-clicking
anywhere in the new query window within SSMS and selecting Design Query in Editor (see
Figure 2-2).
C H A P T E R 2
■
R E P O RT A U T H O R I N G : D E S I G N I N G E F F I C I E N T Q U E R I E S
22
After you open the query designer, you can perform tasks such as adding and joining addi-
tional tables and sorting, grouping, and selecting criteria using the task panes (see Figure 2-3).
Figure 2-2.
Accessing the query design tool in SSMS
4983ch02.qxd 10/7/05 10:01 AM Page 22

C H A P T E R 2
■
R E P O RT A U T H O R I N G : D E S I G N I N G E F F I C I E N T Q U E R I E S
23
This initial query is a relatively simple one; it uses four tables joined on relational columns.
Through the graphical query designer, you can add basic criteria and sorting, and you can select
only two fields for the report: a count of the patients and a specific medical diagnosis. You can
order the count descending so that you can see the trend for the most common diagnoses. You
can directly transport the SQL query that was produced to a report, which we’ll show how to
do in Chapter 4. Listing 2-2 shows the query produced. You can find the code for this query in
the code download file in the Source Code area of the Apress Web site (http://www.apress.com)
in the SQL Queries folder. The file is called Top10Diagnosis.sql.
Listing 2-2.
The SQL Query Produced Using the Graphical Query Designer to Return the Top Ten
Patient Diagnoses
SELECT
TOP 10 COUNT(DISTINCT Patient.PatID) AS [Patient Count], Diag.Dscr AS
Diagnosis
FROM
Admissions INNER JOIN
Patient ON Admissions.PatID = Patient.PatID INNER JOIN
PatDiag ON Admissions.PatProgramID = PatDiag.PatProgramID INNER JOIN
Diag ON PatDiag.DiagTblID = Diag.DiagTblID
Figure 2-3.
Working with the graphical query designer in SSMS
4983ch02.qxd 10/7/05 10:01 AM Page 23

C H A P T E R 2
■
R E P O RT A U T H O R I N G : D E S I G N I N G E F F I C I E N T Q U E R I E S
24
GROUP BY
Diag.Dscr
ORDER BY
COUNT(DISTINCT Patient.PatID) DESC
Table 2-2 shows the output of this query.
Table 2-2.
Sample Output from the Top Ten Diagnoses Query
Patient Count
Diagnosis
206
ABNORMALITY OF GAIT
134
BENIGN HYPERTENSION
116
BENIGN HYP HRT DIS W CHF
104
PHYSICAL THERAPY NEC
89
DECUBITUS ULCER
85
DMI UNSPF UNCNTRLD
77
ABNRML COAGULTION PRFILE
72
CHR AIRWAY OBSTRUCT NEC
65
DMII UNSPF NT ST UNCNTRL
63
CONGESTIVE HEART FAILURE
This particular query has a small result set. Even though it’s potentially working with tens
of thousands of records to produce the resulting ten records, it runs in less than a second. This
tells you that the query is efficient, at least in a single-user execution scenario.
This type of query is designed to deliver data for quick review by professionals who will
make business decisions from the results of the data. In this example, a health-care administrator
will notice a demand for physical therapy and might review the staffing level for physical ther-
apists in the company. Because physical therapists are in high demand, the administrator might
need to investigate the cost of caring for physical therapy patients.
Creating an Advanced Query
Next, we’ll show how to design a query that reports the cost of care for the physical therapy
patients. The goal is to design it in such a way that the query and subsequent report are flexi-
ble enough to include other types of medical services that can be analyzed as well, not only
physical therapy. This query requires more data for analysis than the previous query for the
top ten diagnoses. Because you’ll process thousands of records, you need to assess the perfor-
mance impact.
The design process is the same. Begin by adding the necessary tables to the graphical
query designer and selecting the fields you want to include in the report. The required data
output for the report needs to include the following information:
4983ch02.qxd 10/7/05 10:01 AM Page 24

C H A P T E R 2
■
R E P O RT A U T H O R I N G : D E S I G N I N G E F F I C I E N T Q U E R I E S
25
• Patient name and ID number
• Employee name, specialty, and branch
• Total service count for patient by specialty
• Diagnosis of the patient
• Estimated cost
• Dates of services
Listing 2-3 shows the query to produce this desired output from the health-care applica-
tion. You can find the code for this query in the code download file in the SQL Queries folder.
The file is called EmployeeServices.sql.
Listing 2-3.
Employee Cost Query for Health-Care Database
SELECT
Trx.PatID,
RTRIM(RTRIM(Patient.LastName) + ',' + RTRIM(Patient.FirstName)) AS
[Patient Name],
Employee.EmployeeID,
RTRIM(RTRIM(Employee.LastName) + ',' + RTRIM(Employee.FirstName)) AS
[Employee Name],
ServicesLogCtgry.Service AS [Service Type],
SUM(ChargeInfo.Cost) AS [Estimated Cost],
COUNT(Trx.ServicesTblID) AS Visit_Count,
Diag.Dscr AS Diagnosis, DATENAME(mm, Trx.ChargeServiceStartDate) AS
[Month],
DATEPART(yy, Trx.ChargeServiceStartDate) AS [Year],
FROM
Trx INNER JOIN
ChargeInfo ON Trx.ChargeInfoID = ChargeInfo.ChargeInfoID
INNER JOIN Patient ON Trx.PatID = Patient.PatID INNER JOIN
Services ON Trx.ServicesTblID = Services.ServicesTblID JOIN
ServicesLogCtgry ON
Services.ServicesLogCtgryID = ServicesLogCtgry.ServicesLogCtgryID
INNER JOIN
Employee ON ChargeInfo.EmployeeTblID = Employee.EmployeeTblID INNER JOIN
Diag ON ChargeInfo.DiagTblID = Diag.DiagTblID INNER JOIN
Branch on TRX.BranchID = Branch.BranchID
WHERE
(Trx.TrxTypeID = 1) AND (Services.ServiceTypeID = 'v')
4983ch02.qxd 10/7/05 10:01 AM Page 25

C H A P T E R 2
■
R E P O RT A U T H O R I N G : D E S I G N I N G E F F I C I E N T Q U E R I E S
26
GROUP BY
ServicesLogCtgry.Service,
Diag.Dscr,
Trx.PatID,
RTRIM(RTRIM(Patient.LastName) + ',' + RTRIM(Patient.FirstName)),
RTRIM(RTRIM(Employee.LastName) + ',' + RTRIM(Employee.FirstName)),
Employee.EmployeeID,
DATENAME(mm, Trx.ChargeServiceStartDate),
DATEPART(yy, Trx.ChargeServiceStartDate),
Branch.BranchName
ORDER BY
Trx.PatID
The alias names identified with AS in the SELECT clause of the query should serve as
pointers to the data that answers the requirements of the report request. Again, knowing the
schema of the database that you’ll be working with to produce queries is important, but for
the sake of the example, the joined tables are typical of a normalized database where detailed
transactional data is stored in a separate table from the descriptive information and therefore
must be joined. The Trx table in Listing 2-3 is where the transactional patient service informa-
tion is stored, while the descriptive information of the specialty services such as “Physical
Therapy” is stored in the Services table.
Other tables, such as the Patient and Employee tables, are also joined to retrieve their
respective data elements. You use the SQL functions COUNT and SUM to provide aggregated cal-
culations on cost and service information and RTRIM to remove any trailing spaces in the
concatenated patient and employee names. You can use the ORDER BY PATID clause for testing
the query to ensure that it’s returning multiple rows per patient as expected. It isn’t necessary
to add the burden of sorting to the query. As you’ll see in the next chapters, sorting is handled
within the report. Dividing the load between the SQL Server machine that houses the report
data and the report server itself is important and often requires performance monitoring to
assess where such tasks as sorting, grouping, and calculating sums or averages for aggregated
data will be performed. If the report server is substantial enough to shoulder the burden and
is less taxed by user access than the actual data server, it might be conceivable to allow the
reporting server to handle more of the grouping and sorting loads.
Testing Performance with SQL Server Management Studio (SSMS)
Now that you have developed the query, you’ll look at the output to make sure it’s returning
accurate data within acceptable time frames before moving on to the next phase of develop-
ment. You can see the results of the output from SSMS along with the time it took to execute
the query in Figure 2-4. You can further modify the query directly in SSMS if desired. However,
one of the best features of SSMS you’ll notice is the ability to view quickly both the number of
records returned and the execution time. Once you do that, the next step is to create the
stored procedure.
4983ch02.qxd 10/7/05 10:01 AM Page 26
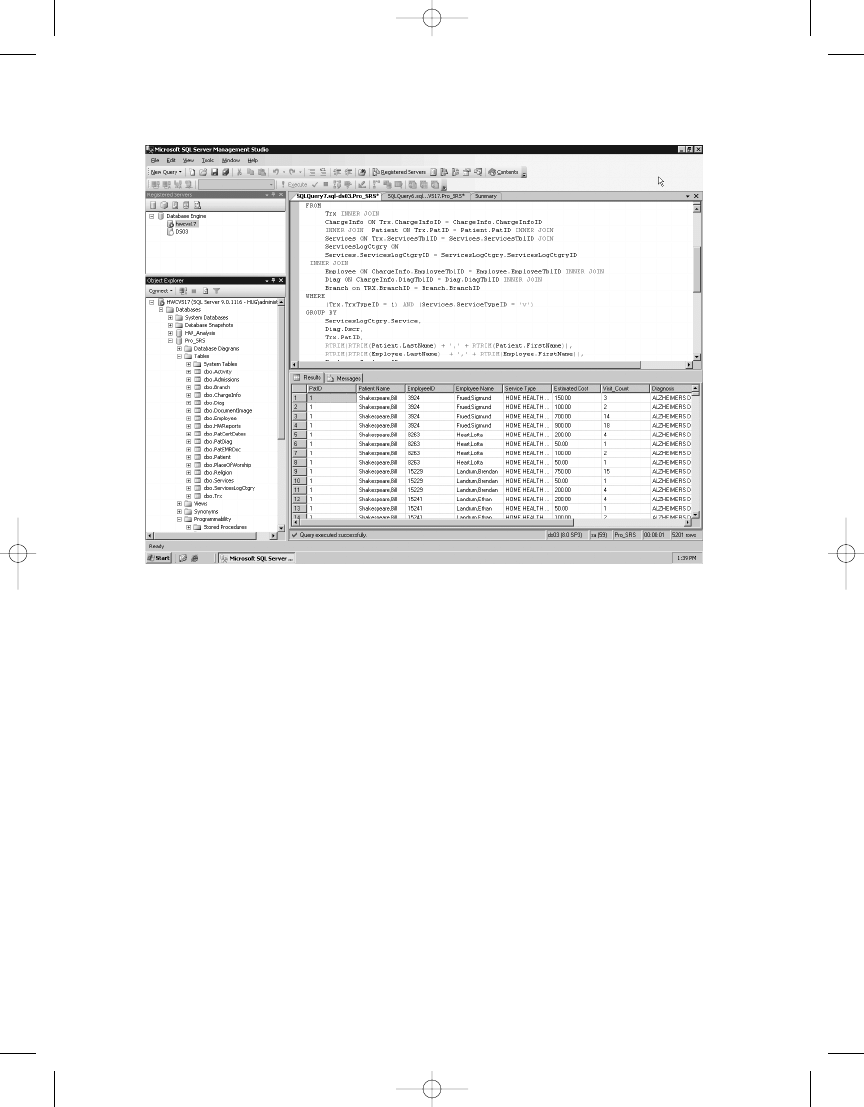
C H A P T E R 2
■
R E P O RT A U T H O R I N G : D E S I G N I N G E F F I C I E N T Q U E R I E S
27
You now have the data the way you want, and the query is executing in an average of one
second. To verify the execution times, run the query 15 times in sequence from two different
sessions of SSMS. Execution times will vary from one to two seconds for each execution.
For 5,201 records, which is what the query is returning, the execution time is acceptable for
a single-user execution. However, you need to improve it before you create the stored proce-
dure, which you will want to scale out to accommodate hundreds of users, and begin building
reports.
Looking at the Execution Plan tab in SSMS will give you a better understanding of what’s
happening when you execute the query. In SSMS, click the Display Estimated Execution Plan
button on the toolbar. When the query is executed, the Execution Plan tab appears in the
Results pane.
The Execution Plan tab in SSMS shows graphically how the SQL query optimizer chose
the most efficient method for executing the report, based on the different elements of the
query. For example, the query optimizer may have chosen a clustered index instead of a table
scan. Each execution step has an associated cost. Figure 2-5 shows the Execution Plan tab for
this query.
Figure 2-4.
Viewing the query execution output in SSMS
4983ch02.qxd 10/7/05 10:01 AM Page 27
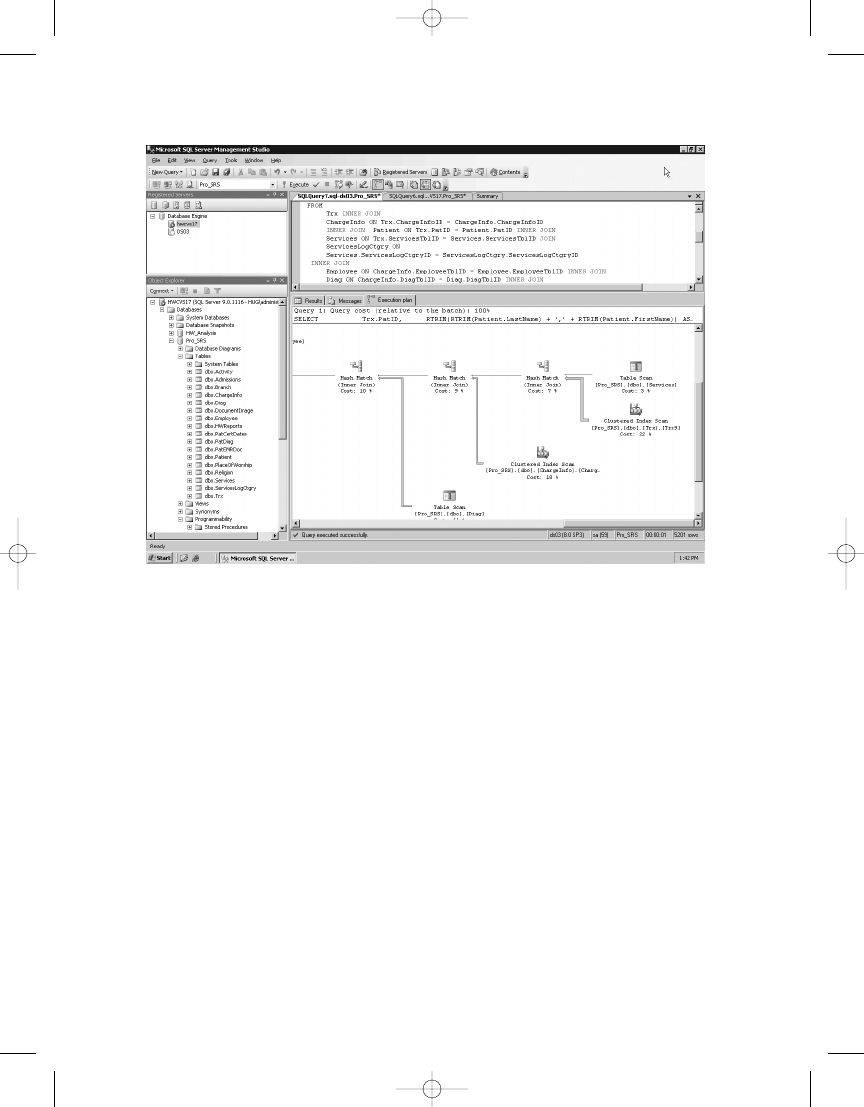
C H A P T E R 2
■
R E P O RT A U T H O R I N G : D E S I G N I N G E F F I C I E N T Q U E R I E S
28
The query took one second to execute, and from this execution plan it’s easy to see which
section of the query had the highest cost percentage. The WHERE clause in the query had a 22
percent cost when determining the TrxTypeID value and the service type. For reference, the
TrxTypeID
integer field specifies the type of financial transactions as charges, payments, or
adjustments. You’re concerned only with the TrxTypeID value of 1, representing charges. For
the service type, you’re interested only in “V,” representing visits, and not in other types of bill-
able services, such as medical supplies. If you could get the cost of the WHERE clause down to
a lower number, the query might improve the overall performance.
Optimizing Performance: Dividing the Load
Because SSRS and T-SQL share many data formatting and manipulation functions, you can
choose in which process—query or report—these functions should be used. You can choose to
have the query handle the bulk of the processing. This limits the number of rows that the report
has to work with, making report rendering much faster. Alternatively, you can limit the selectiv-
ity of the query, allowing it to return more rows than are possibly required. You can then have
the report perform additional filtering, grouping, and calculations, which allows the query or
stored procedure to execute faster. With many users accessing the report simultaneously, hav-
ing the report share the processing load also limits the impact on the data source server, in this
case, SQL Server.
Figure 2-5.
Viewing the Execution Plan tab displayed in SSMS
4983ch02.qxd 10/7/05 10:01 AM Page 28
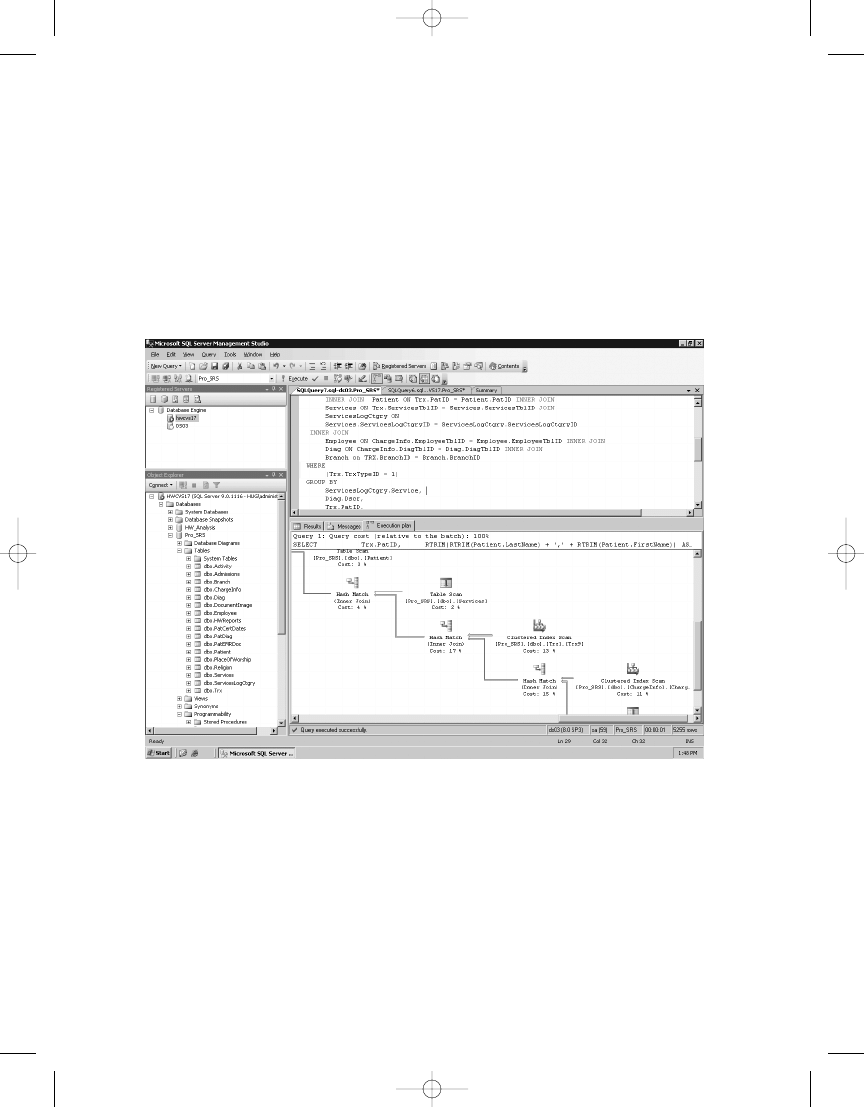
C H A P T E R 2
■
R E P O RT A U T H O R I N G : D E S I G N I N G E F F I C I E N T Q U E R I E S
29
In this query, based on initial benchmarking, we’ve determined we’ll remove the portion
of the WHERE clause that specifies that the query should return only service types with a value
of “V” for visits. Instead, we’ll let the report filter out any service types that aren’t visits. When
you remove the service type criteria from the query and reexecute it, you can see that the overall
execution time remains constant at or is less than one second, and the cost of the WHERE clause
goes from 22 percent to 13 percent. Also, it’s important to note in the performance analysis that
the record count went up by only 54 records, from 5,201 to 5,255 by removing the “V” from the
WHERE
clause. You can see this in the lower-right corner of Figure 2-6.
To take advantage of a report filter, you need to add a field—Services.ServiceTypeID—to
the SELECT portion of the query, like so:
Select
...
Branch.BranchName AS Branch ,
Services.ServiceTypeID
You will use the additional field Services.ServiceTypeID as the filter value in the report
that you will be designing. By proceeding in this fashion, even though you’re returning more
Figure 2-6.
Viewing the execution plan with the modified query
4983ch02.qxd 10/7/05 10:01 AM Page 29

C H A P T E R 2
■
R E P O RT A U T H O R I N G : D E S I G N I N G E F F I C I E N T Q U E R I E S
30
rows than you might need for a particular report, you also gain the benefit of using this same
base query for other reports when you eventually make it a stored procedure, which you will
do in the following sections. Other reports might need to show service types other than visits,
and this query will serve this purpose as well with only slight modifications to the report. For
example, you might need to investigate the cost or quantity of supplies (a service type of “S”)
used by employees. You can use this same query and stored procedure for that report as well.
The query as it stands, now including the ServiceTypeID as a value in the SELECT clause
and not as criteria, is ready to begin its life as a stored procedure. Queries serve many purposes
and are good to develop reports with, as you’ll do in Chapter 4. However, encapsulating queries
in stored procedures is typically the preferred method of deployment for several reasons.
Stored procedures, like ad hoc queries, execute according to the execution plan generated by
the query optimizer. Having the ability to reuse the execution plan saves time and resources.
Stored procedures, which are also beneficial because they’re precompiled, can reuse an execu-
tion plan despite that its parameters, which are passed to it when it’s executed, might have
changed values. You can centrally maintain stored procedures on the SQL Server machine,
unlike ad hoc queries that might be embedded in an application or in the RDL file in this case.
When the underlying schema of a database changes, you can update the stored procedure in
one location, whereas embedded queries all need to be modified separately for each report in
which they reside. In the next section, we’ll show how to create a stored procedure based on
the employee cost query.
Using a Parameterized Stored Procedure
You can use SSMS to produce the code to create a stored procedure based on the employee
cost query and also to drop it (if the stored procedure already exists in the database). In the
database where you create the procedure, simply right-click the Stored Procedures folder,
which is under the Programmability folder, and select New Stored Procedure. This opens
a window that contains a sample CREATE PROCEDURE command for the new stored procedure.
CREATE PROCEDURE <Procedure_Name, sysname, ProcedureName>
To complete the new stored procedure, which you should name Emp_Svc_Cost, you simply
need to paste in your SELECT statement. However, you can provide optional parameters with
the stored procedure. These parameters limit the result set based on the following criteria:
• Service time (year and month)
• The branch where the employee works
• The individual employee
• The type of service
To create parameters for a stored procedure, you add the variable names preceded by @
characters and provide the appropriate data types and initial value; the initial value for all the
parameters is NULL, as Listing 2-4 shows. You can find the code for this query that creates the
stored procedure Emp_Svc_Cost in the code download file in the SQL Queries folder. The file is
called CreateEmpSvcCost.sql.
4983ch02.qxd 10/7/05 10:01 AM Page 30

C H A P T E R 2
■
R E P O RT A U T H O R I N G : D E S I G N I N G E F F I C I E N T Q U E R I E S
31
Listing 2-4.
Creating the Emp_Svc_Cost Stored Procedure
IF EXISTS
(
SELECT name from sysobjects
WHERE name = 'Emp_Svc_Cost'
)
DROP Procedure Emp_Svc_Cost
GO
CREATE PROCEDURE [dbo].[Emp_Svc_Cost]
@ServiceMonth Int=NULL,
@ServiceYear Int=NULL,
@BranchID Int=NULL,
@EmployeeTblID Int=NULL,
@ServicesLogCtgryID char(5)=NULL
AS
SELECT
Trx.PatID,
RTRIM(RTRIM(Patient.LastName) + ',' + RTRIM(Patient.FirstName)) AS
[Patient Name],
Branch.BranchName,
Employee.EmployeeID,
RTRIM(RTRIM(Employee.LastName) + ',' + RTRIM(Employee.FirstName)) AS
[Employee Name],
Employee.EmployeeClassID,
ServicesLogCtgry.Service AS [Service Type],
SUM(ChargeInfo.Cost) AS [Estimated Cost],
COUNT(Trx.ServicesTblID) AS Visit_Count,
Diag.Dscr AS Diagnosis, DATENAME(mm, Trx.ChargeServiceStartDate) AS [Month],
DATEPART(yy, Trx.ChargeServiceStartDate) AS [Year],
Services.ServiceTypeID
FROM
Trx INNER JOIN
Branch on Trx.Branchid = Branch.BranchID INNER JOIN
ChargeInfo ON Trx.ChargeInfoID = ChargeInfo.ChargeInfoID
INNER JOIN Patient ON Trx.PatID = Patient.PatID INNER JOIN
Services ON Trx.ServicesTblID = Services.ServicesTblID INNER JOIN
ServicesLogCtgry ON
Services.ServicesLogCtgryID = ServicesLogCtgry.ServicesLogCtgryID INNER JOIN
Employee ON ChargeInfo.EmployeeTblID = Employee.EmployeeTblID INNER JOIN
Diag ON ChargeInfo.DiagTblID = Diag.DiagTblID
WHERE
(Trx.TrxTypeID = 1) AND
(ISNULL(Branch.BranchID,0) = ISNULL(@BranchID,ISNULL(Branch.BranchID,0)))
AND
(ISNULL(Services.ServicesLogCtgryID,0) = ISNULL(@ServicesLogCtgryID,
ISNULL(Services.ServicesLogCtgryID,0))) AND
(ISNULL(Employee.EmployeeTblID,0) = ISNULL(@EmployeeTblID,
4983ch02.qxd 10/7/05 10:01 AM Page 31

--Case to determine whether Year and Month were passed in
1=Case
When ( @ServiceYear is NULL) then 1
When ( @ServiceYear is NOT NULL)
AND @ServiceYear = Cast(DatePart(YY,ChargeServiceStartDate) as int)
Then 1
ELSE 0
End
AND
1=Case
When (@ServiceMonth is NULL) then 1
When (@ServiceMonth is NOT NULL)
AND @ServiceMonth = Cast(DatePart(MM,ChargeServiceStartDate) as int)
Then 1
ELSE 0
END
GROUP BY
ServicesLogCtgry.Service,
Diag.Dscr,
Trx.PatID,
Branch.BranchName,
RTRIM(RTRIM(Patient.LastName) + ',' + RTRIM(Patient.FirstName)),
RTRIM(RTRIM(Employee.LastName) + ',' + RTRIM(Employee.FirstName)),
Employee.EmployeeClassid,
Employee.EmployeeID,
DATENAME(mm, Trx.ChargeServiceStartDate),
DATEPART(yy, Trx.ChargeServiceStartDate),
Services.ServiceTypeID
ORDER BY
Trx.PatID
GO
Using Case and ISNULL to Evaluate the Parameters
In the previous query, you added several new criteria to the WHERE clause for evaluating the
parameters. You used the ISNULL function and a CASE statement to evaluate the values of the
database fields and parameters.
(ISNULL(Branch.BranchID,0) = ISNULL(@BranchID,ISNULL(Branch.BranchID,0)))
1=Case
AND
When ( @ServiceYear is NULL) then 1
When ( @ServiceYear is NOT NULL)
AND @ServiceYear = Cast(DatePart(YY,ChargeServiceStartDate) as int) then 1
ELSE 0
End
C H A P T E R 2
■
R E P O RT A U T H O R I N G : D E S I G N I N G E F F I C I E N T Q U E R I E S
32
4983ch02.qxd 10/7/05 10:01 AM Page 32

At first the logic for these evaluations might seem confusing, but remember that as long
as the criteria are equal, results are returned. This is true through the entire WHERE clause because
it’s evaluated with AND. This is easier to understand with the following sample statement:
SELECT * from Table1 WHERE 1 = 1
In this statement, all rows are returned, because 1 always equals 1. It doesn’t matter that
you aren’t comparing values from the table itself.
For the ISNULL function, you look to see whether the value of a database field—BranchID,
for example—contains a NULL value, and if so, ISNULL replaces NULL with zero. The right side of
that equation looks to see whether the @BranchID parameter was passed in as NULL; if so, then
the value for @BranchID is set to the value of BranchID in the database table and equals every row.
If the @BranchID parameter is passed to the stored procedure as a value—say, 2 for the branch
Nested Valley—then only BranchID 2 is returned because BranchID = @BranchID = 2. This
evaluation is performed when there might be NULL values in the field because NULL values can’t
be compared with standard operators such as =.
For fields that always have non-NULL values such as service dates, you can evaluate those
with a CASE statement in the WHERE clause. For the two time values, Service Year and Month,
you use similar logic as with the ISNULL evaluations. If the parameters @ServiceMonth and
@ServiceYear
are passed in as NULL to the stored procedure, then the stored procedure returns
every record, and the CASE statement sets the equation to 1 = 1. If the parameters contain
legitimate values, such as 2004 for the year, the CASE statement is set to 1 = 1 only when the
parameter value equals the database value. Otherwise, the CASE statement is set to the equa-
tion to 1 = 0, and the record is skipped.
Testing the Procedure
The next step is to grant execute privileges for the stored procedure in SSMS by navigating to
the database Pro_SSRS and then expanding the folder to Programmability. From here, select
Stored Procedures, then right-click Emp_Svc_Cos, and finally select Properties. A Permissions
property page will allow you to add the public role and grant execute permission to any group
or user you desire. In this case, click Add on the Permissions page, find Public in the list of
available users, and grant the Execute permission. (We’re sure the humor of this wasn’t lost on
the developer, who knew someone would grant a public execution.)
■
Note
The test server on which we’re developing the reports is an isolated and secure system. Typically,
granting execution privileges to the public role isn’t recommended. We’ll lock down both the stored procedure
and the report in Chapter 9.
You can now test the procedure directly in SSMS with the following command:
EXEC Emp_Svc_Cost
Because you have allowed NULL values for the parameters, you don’t explicitly have to pass
them in on the command line. However, to test the functionality of the stored procedure, you
can pass in the full command line with the appropriate parameters; for example, you can pass
all services rendered in September 2003, like so:
C H A P T E R 2
■
R E P O RT A U T H O R I N G : D E S I G N I N G E F F I C I E N T Q U E R I E S
33
4983ch02.qxd 10/7/05 10:01 AM Page 33
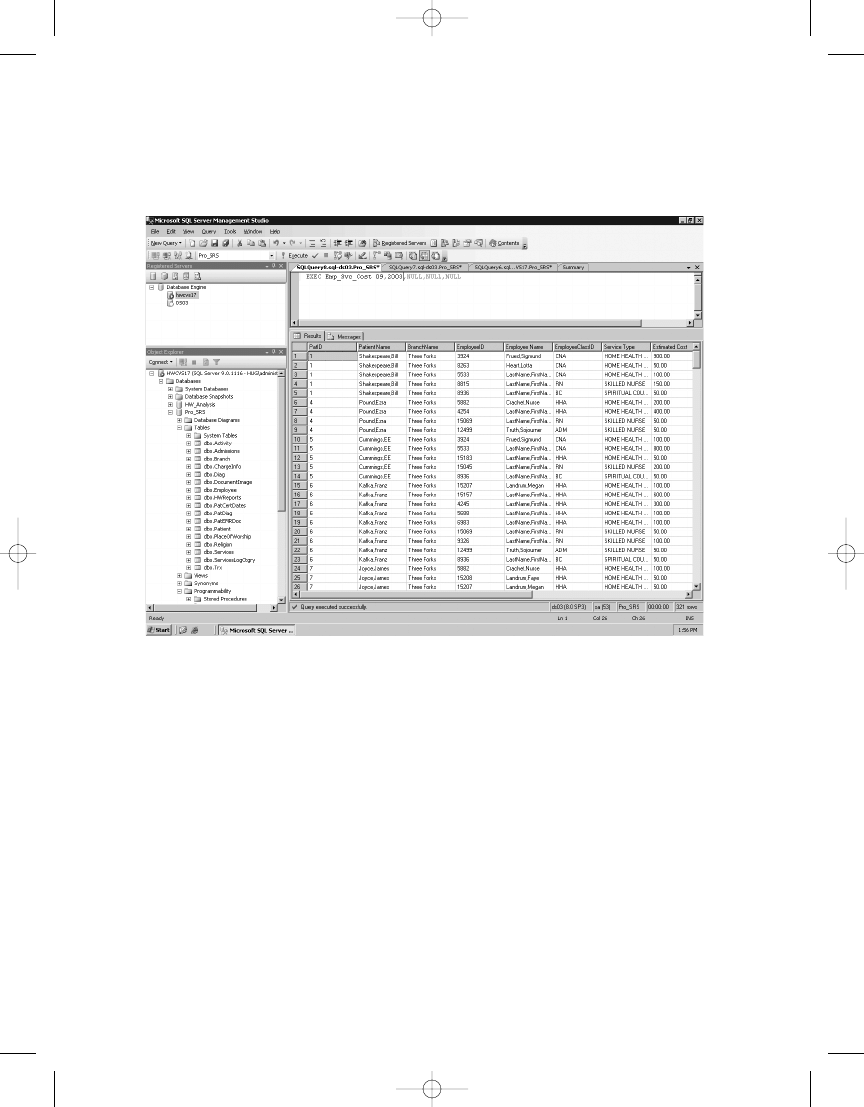
C H A P T E R 2
■
R E P O RT A U T H O R I N G : D E S I G N I N G E F F I C I E N T Q U E R I E S
34
Executing the procedure in this way returns 321 records, and the results verify that, indeed,
only services in September 2003 were returned in a fraction of a second (see Figure 2-7).
Summary
In this chapter, you began to design the essential part of a report: the query and stored proce-
dure. By using stored procedures, you gain the benefits of central administration and security
and also gain the ability to execute compiled code to return the dataset instead of a stand-alone
query. You can develop queries in conjunction with the report, using the built-in query tools
within SSRS. However, it’s best to deploy the report with a stored procedure.
A report request and the target audience are the deciding factors when determining the
layout and default rendering of the report. However, even though reports are often designed to
answer a specific need, if they’re based on the same tried-and-true stored procedures, with
similar parameters and groupings, the data will be accurate across all reports. You can then
focus the design time on the report itself and not on rewriting queries.
Figure 2-7.
Viewing the results of Emp_Svc_Cost with year and date parameters
4983ch02.qxd 10/7/05 10:01 AM Page 34

Using Report Designer
T
he professional lines between system administrators, DBAs, and developers are blurring.
Products often are extensible through code or at least have the potential to create functional-
ity that goes well beyond the out-of-the-box offerings. SSRS is such an application. The days of
the Microsoft Management Console (MMC) are numbered and will be overshadowed by the
new interface on the block, the IDE. Actually, the IDE isn’t new at all, as any developer will tell
you. However, system administrators, DBAs, and even report designers have to become famil-
iar with this new way of working. As you’re probably already well aware, you can create reports
in SSRS within Visual Studio 2005 or BIDS. This is a boon for developers, because now they
can use the same IDE, if they choose Visual Studio 2005 over BIDS, for report creation and
application development. For the rest of us, creating reports in Visual Studio 2005 presents
a learning curve. SQL Server 2005, with the delivery of BIDS and SSMS, has essentially the
same environment not only for report creation but also for Integration Services (formerly Data
Transformation Services) packages, query design, database design and management, and
almost all tasks currently associated with SQL Server and Analysis Services. So, now that you
have developed your queries and stored procedures, you can turn your attention to the tools
available to report designers when SSRS is installed.
In this chapter, we’ll show how to set up and explore the BIDS IDE using the embedded
elements of SSRS within that environment. To that end, we’ll walk you through the following
tasks to familiarize you with the tools of report design before showing how to create a full-blown
SSRS report in the next chapter:
• Introducing the elements of BIDS
• Describing the role of RDL in SSRS with sample code from the various report objects it
controls
• Creating a data source and dataset
• Defining query and report parameters
• Discussing report pagination
• Introducing and defining expressions and filters and explaining how you can use them
together to control report content and formatting
• Creating data region samples: the List, Table, Rectangle, Matrix, Chart, and Image
• Implementing two simple tips for creating report templates and printing labels
35
C H A P T E R 3
■ ■ ■
4983ch03.qxd 10/7/05 10:18 AM Page 35

C H A P T E R 3
■
U S I N G T H E R E P O RT D E S I G N E R
36
Everyone learns differently—some like to follow a step-by-step guide to a known conclusion,
and some like to view a completed report to see the specific components of its design. Because
of this, we will take both approaches in this and subsequent chapters. Specifically, we’ll show
you how to build each sample from the ground up, and we’ll also point you to the completed
sample in the Source Code area of the Apress site (http://www.apress.com) so that you can
analyze the report as you read through the steps to achieve the end result.
We provide all the data sources, reports, and projects you will work with in this chapter in
a solution called Pro_SSRS. You can open this solution in both BIDS and Visual Studio 2005.
You’ll find detailed instructions in the Source Code area on the Apress site for installing the
samples for each chapter. This chapter will focus primarily on the IDE of BIDS and for clarity
provide a step-by-step guide to familiarize you with BIDS, including how to use SSRS-specific
report objects such as Lists, Tables, and Charts. At the point when you begin creating these
specific report examples, you will have two reports, a starting-point report and a completed
report sample for each object (which we will point out at the beginning and end of each main
section). This way, you can step through the procedure to produce the output in the starting-
point report and then open and compare the end result to the completed report.
Exploring the Elements of BIDS
In BIDS, one or more projects contain all the reports and shared data sources. In addition to
physically and logically grouping reports together, a project also maintains properties that are
specific to that project. These properties allow the project to work independently of other projects.
All projects that you create are themselves contained within a solution.
We’ll now show how to create a project and a solution. Open BIDS, and select File ➤ New
➤ Project on the menu bar. This displays the New Project dialog box. Under Project Types,
select Report Server Project, which is in the Business Intelligence Projects folder. The project
name defaults to Report Project1 if this is the first project you’ve created. The location of the
project can be a local drive or a network location. In this case, make it C:\Pro_SSRS\Reports.
By default, the solution is named according to the project name, in this case Report Project1,
as shown in Figure 3-1. If you check the Create Directory for Solution box, you can append
a new directory to the base location. In this case, choose Solution1.
4983ch03.qxd 10/7/05 10:18 AM Page 36
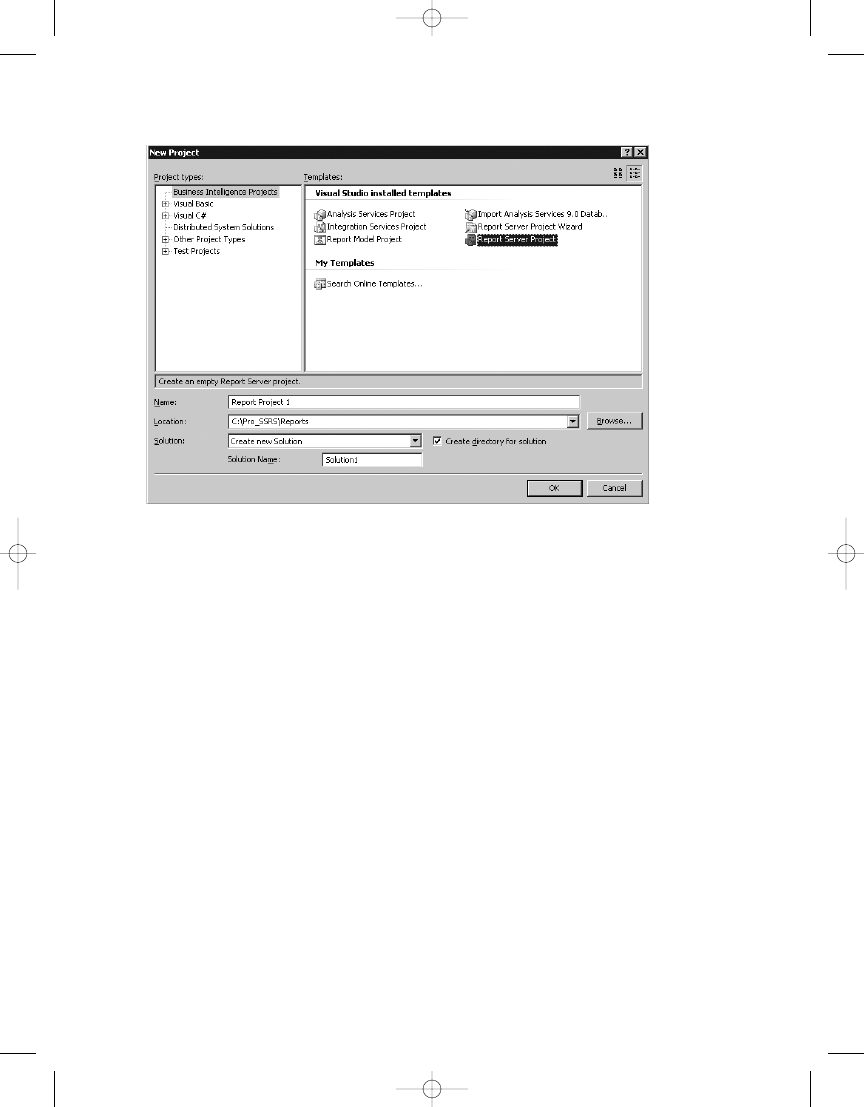
C H A P T E R 3
■
U S I N G T H E R E P O RT D E S I G N E R
37
Figure 3-1.
New Project dialog box
After you click OK, both the project and solution are created, and you can create report
items and data sources within the project.
However, first you should add two important property settings to the project: the target
folder in which to deploy the reports on the SSRS server and the SSRS server URL.
You can set these properties via the Solution Explorer, which displays the solution and the
projects it contains, as well as all the reports and other objects the individual projects might
contain. You can access the Solution Explorer by clicking View ➤ Solution Explorer on the
menu bar. In the Solution Explorer, highlight the project, and select Project ➤ Properties from
the menu; alternatively, right-click the project, and select Properties. The TargetReportFolder
property controls the folder that’s created to store the deployed reports and data sources on
the SSRS server. The TargetServerURL property is the URL to the SSRS Web server. As you can see
in Figure 3-2, the TargetServerURL property is in the form http://servername/ReportServer. In
this case, the SSRS Web server is localhost.
4983ch03.qxd 10/7/05 10:18 AM Page 37
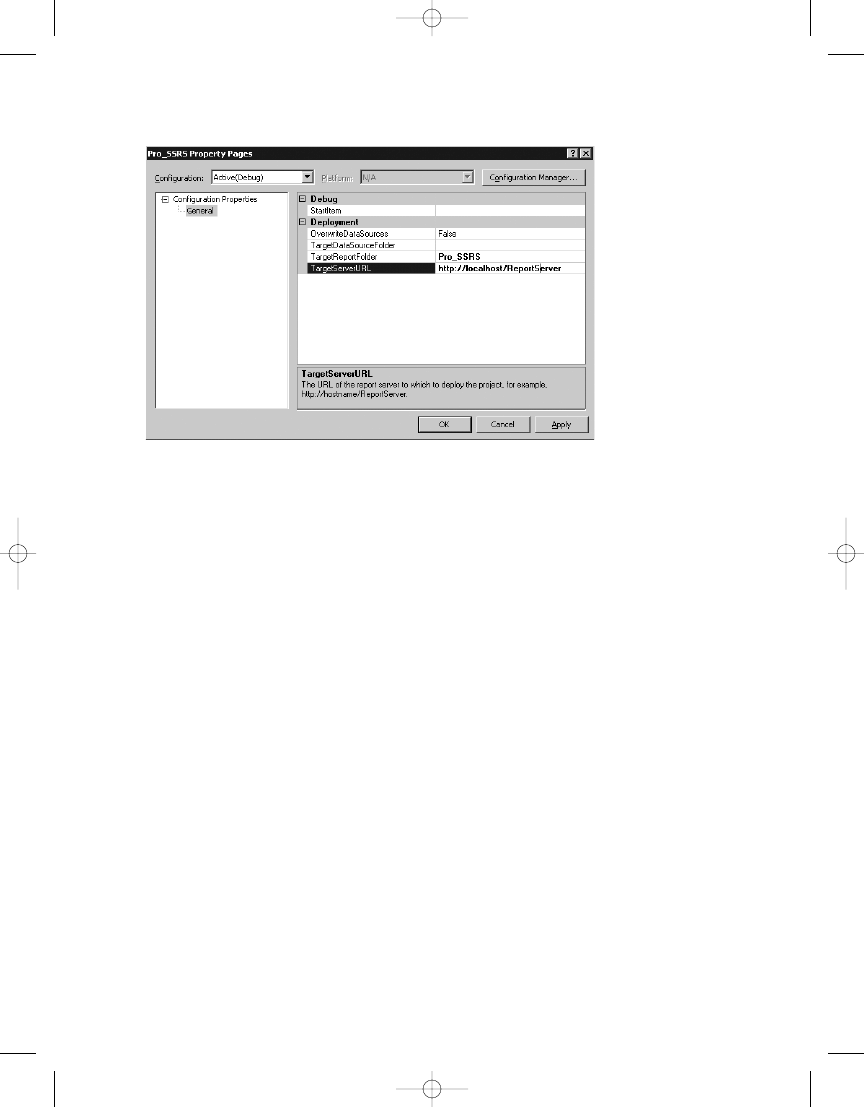
C H A P T E R 3
■
U S I N G T H E R E P O RT D E S I G N E R
38
Setting Up a Basic IDE
Now that you have a new solution and a new project to contain the reports you’ll build, it’s time
to get personal. As report designers, you’re going to spend many hours gazing at the pixels that
are your creations. Therefore, it’s important to set up the environment exactly the way you want
it. The ideal setup for designing reports is a personal choice. Some prefer high-resolution display
settings with every available design toolbar always in view within the environment. Others
prefer undocked toolbars and a dual monitor set up at a lower resolution. Whatever your pref-
erence, BIDS makes it easy to manipulate the design tools within the IDE to personalize your
configuration. In addition to the Solution Explorer, covered in the previous section, you can
use several common tools within the IDE to design reports:
• The Toolbox is where you find all the report objects covered in this chapter, such as the
Matrix and Table data regions. Data regions are the defined report objects within the
SSRS report design environment that contain the field values from the data source.
• In the Properties window, you set the values for the various formatting and grouping
properties for report items.
• The Error List window is important when troubleshooting report errors. Mismatched
data types and invalid use of functions are common issues that arise when designing
reports. The Error List window is the place to see the details of these errors.
• Finally, the Fields window holds the datasets and the field information you’ve defined
for the report.
Figure 3-3 shows a custom layout for designing reports in SSRS. All the toolbars are dock-
able anywhere within the IDE, or they can extend beyond the main IDE to their own location
on the desktop. Having this setup typically requires a high-resolution configuration—1152
×
864
x is undocked, and the Solution Explorer
Figure 3-2.
Project properties
4983ch03.qxd 10/7/05 10:18 AM Page 38
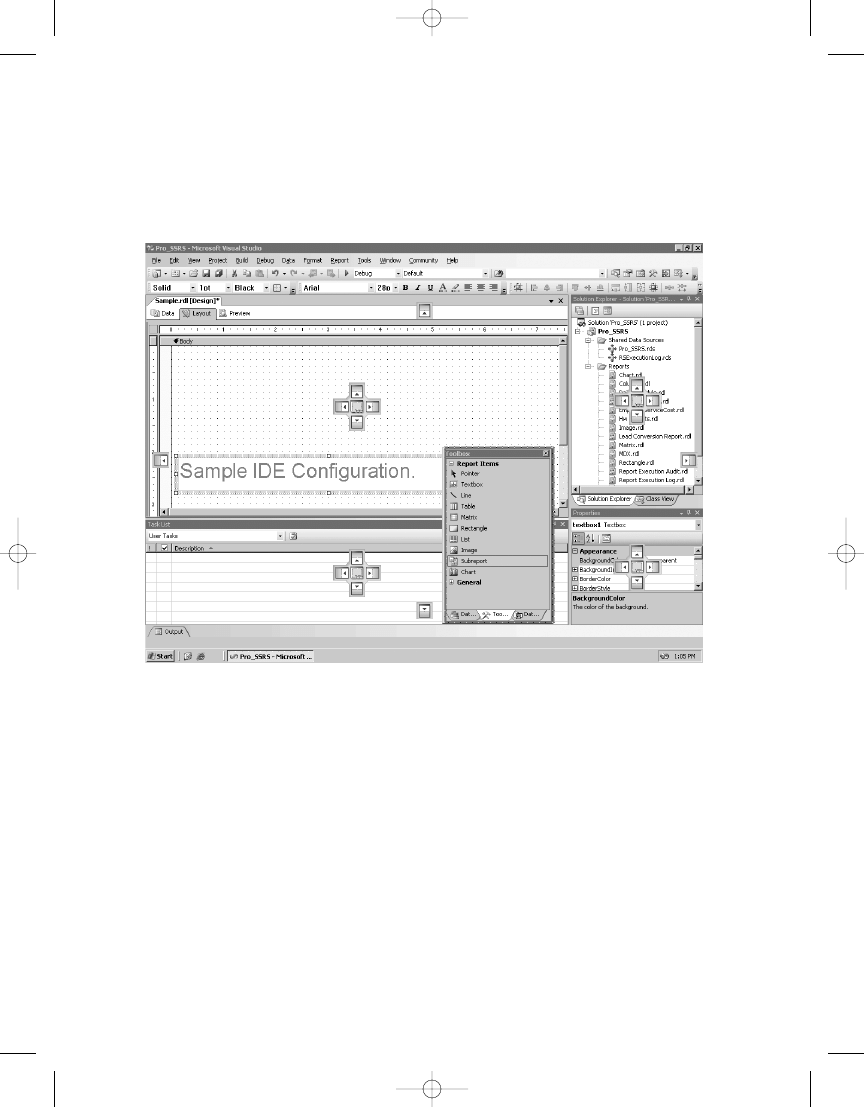
C H A P T E R 3
■
U S I N G T H E R E P O RT D E S I G N E R
39
and Properties toolbars are docked on the right side of the report design grid. The toolbars can
autohide when not in use, which again is a personal preference. BIDS, as well as the full Visual
Studio 2005 environment, now has a dock position map that assists in precisely placing the
dockable item.
Understanding Report Definition Language (RDL)
RDL is the standard to which all reports created with the embedded SSRS tools in Visual Studio
2005 adhere. SSRS uses the RDL file that’s stored in the ReportServer database to render the
report through the Web server. RDL is an XML-based schema that defines each element of
a report, such as formatting, dataset information, grouping and sorting, and parameters and
filters. As you add items to the report, the RDL code changes to include each addition.
In the IDE, this is typically invisible to the user, as it takes place in the background. However,
at times you might need to modify the RDL directly to make global changes using a find-and-
replace method. We’ve had to do this several times when a parameter or field name changed
in a source stored procedure. Within Visual Studio 2005, while working on a report, you can
view the RDL code directly at any time by pressing F7.
Because RDL is a standard, you can create it with any report designer that supports it.
Currently Visual Studio 2005 and BIDS are the main report designers for SSRS, but as more
and more companies embrace RDL, other report designers will become available. In fact, in
t Builder application that lets end users
Figure 3-3.
Sample IDE configuration
4983ch03.qxd 10/7/05 10:18 AM Page 39
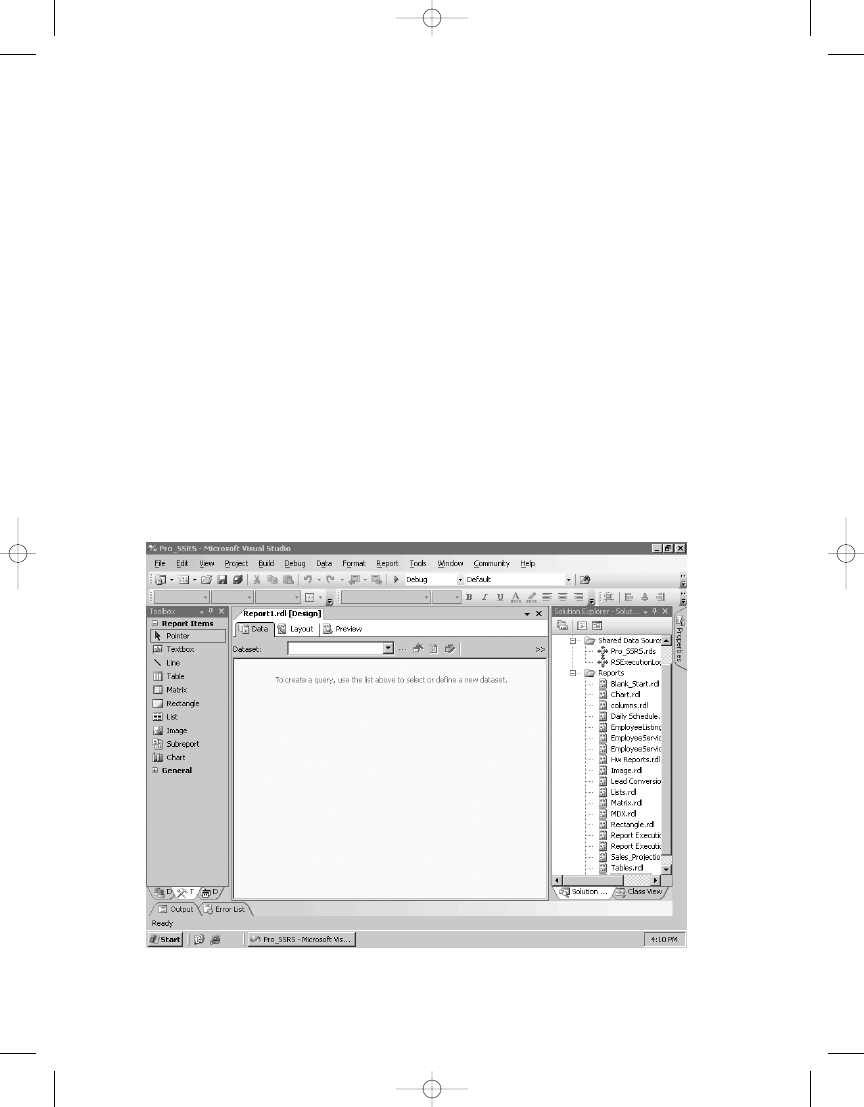
design and publish their own SSRS reports. Chapter 11 covers the Report Builder application
and its components.
Throughout this chapter, we’ll present the RDL sections of the report objects on which
you are working to show how the RDL is updated while designing a report. The complete RDL
schema is available at http://schemas.microsoft.com/sqlserver/reporting/2005/01/
reportdefinition
.
Adding a Report
To add a new report to your project, right-click the Reports folder in the Solution Explorer,
select Add, and then New Item. Notice that you have the option of adding an existing item as
well. This option is useful if you already have a report to add to a project or if you’ve built
a template report file as a base starting point. We’ll show you how to add a template in the
“Using a Report Template” section of this chapter.
For now, select Report in the Add New Item dialog box, and then click Add to add the
report named Report1.rdl to the project. Double-clicking the newly added, blank report
opens it in the design environment. By default the report is named Report##.rdl, where ## is
the next available report number in sequence. At this point, the report is a blank slate. As with
any report that contains data from a data source, the first step is to create one or more datasets.
Figure 3-4 shows the IDE, including the Solution Explorer and Toolbox with the report design
objects.
C H A P T E R 3
■
U S I N G T H E R E P O RT D E S I G N E R
40
Figure 3-4.
BIDS IDE with Report1.rdl loaded
4983ch03.qxd 10/7/05 10:18 AM Page 40

C H A P T E R 3
■
U S I N G T H E R E P O RT D E S I G N E R
41
Setting Up Data Sources and Datasets
Each report created in SSRS contains both a data source and a dataset. A data source not only
defines the type of connection that is established to the data, whether it’s SQL Server, Analysis
Services, or Oracle, but it also defines the specific connection properties, such as the server
and database name. A dataset, on the other hand, is the data, rows, columns, and fields that
are returned from the data source. The dataset is created by building a query that retrieves
information from the data source. This query, as in the case of a SQL Server data source, can
take the form of a text-based query embedded directly in the report, or it can be a stored
procedure.
In Chapter 2, you created a stored procedure called Emp_Svc_Cost that contains employee
and patient visit information. Because it includes detail records that can be aggregated in several
ways, enough information is in this stored procedure to demonstrate how you can use many of
the report objects. Therefore, you’ll use that procedure as your dataset as you work with most
of the report objects in this chapter. For other report objects, such as the image report object,
you will in fact use direct queries instead of the Emp_Svc_Cost stored procedure.
Creating a Data Source
Each report can use one or more data sources. Reports that use the same data source—for
example, one that connects to a specific SQL Server database—can use what is referred to in
SSRS as a shared data source. Shared data sources are published along with the report and can
be modified on the report server after deployment. In the report designer, shared data sources
contain several properties that you must configure before you can use them.
Let’s step through the process of creating the shared data source for the stored procedure
Emp_Svc_Cost
. First, right-click Shared Data Sources in the Solution Explorer, and select Add
New Data Source; the Shared Data Source dialog box will appear. Second, click the Edit button
in the dialog box to create the connection string. In this case, you know that the server that
contains your source database and stored procedure is located on the local SQL Server, so you
can type localhost as the server name. The data source property defaults to Microsoft SQL Server
(SqlClient). After you type localhost as the server, you can choose the Pro_SSRS database from
the database drop-down selection. In this case, because the database is configured to use both
Windows and SQL authentication, choose the Use Windows Authentication option. If you choose
to use SQL authentication, you can also choose to store the SQL username and password.
Generally, Windows authentication is the preferred method of authentication because it has
a single point of login for users. (Chapter 9 covers authentication for deployed reports.) Figure 3-5
shows the data source connection properties. If you choose, you can test the connection by
clicking the Test Connection button.
4983ch03.qxd 10/7/05 10:18 AM Page 41
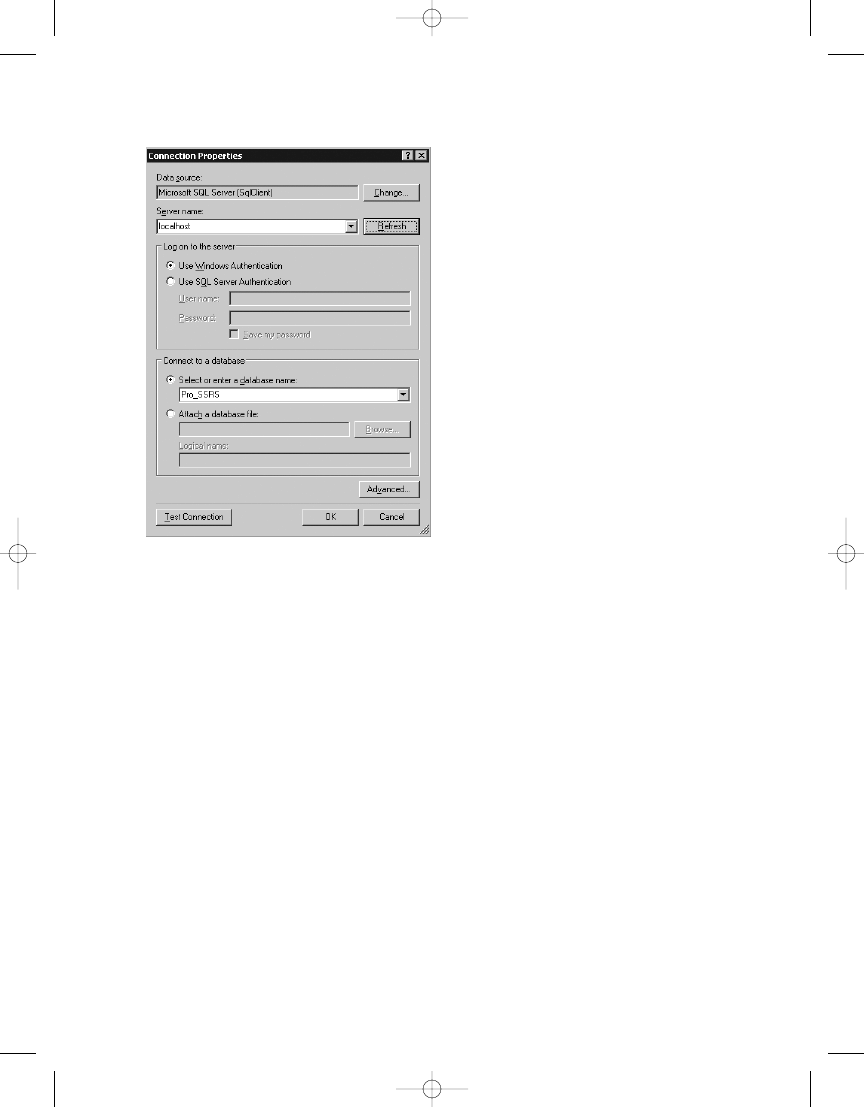
You now have a shared data source. Notice that the name of the shared data source has
defaulted to the name of the database, Pro_SSRS. You can rename this after creating it by right-
clicking it and selecting Rename.
In practice, we’ve developed all our reports using an identical data source name. However,
because each of our online customers had a database that uniquely identified them, we designed
an application that reset the database properties in the data source after it was published. In
this way, we could use the same reports against the same database schema, but we could deploy
the reports to multiple customers on the same report server.
In this example, the data source file you created has an .rds extension and is stored and
published separately from the report. You can open an .rds file in a text editor, because it’s an
XML file that defines the connection properties you just created graphically. Listing 3-1 shows
the Pro_SSRS.rds file.
Listing 3-1. Pro_SSRS.rds
File
<?xml version="1.0" encoding="utf-8"?>
<RptDataSource xmlns:xsd=http://www.w3.org/2001/
XMLSchema xmlns:xsi="http://www.w3.org/2001/XMLSchema-instance">
C H A P T E R 3
■
U S I N G T H E R E P O RT D E S I G N E R
42
Figure 3-5.
Data source connection properties
4983ch03.qxd 10/7/05 10:18 AM Page 42
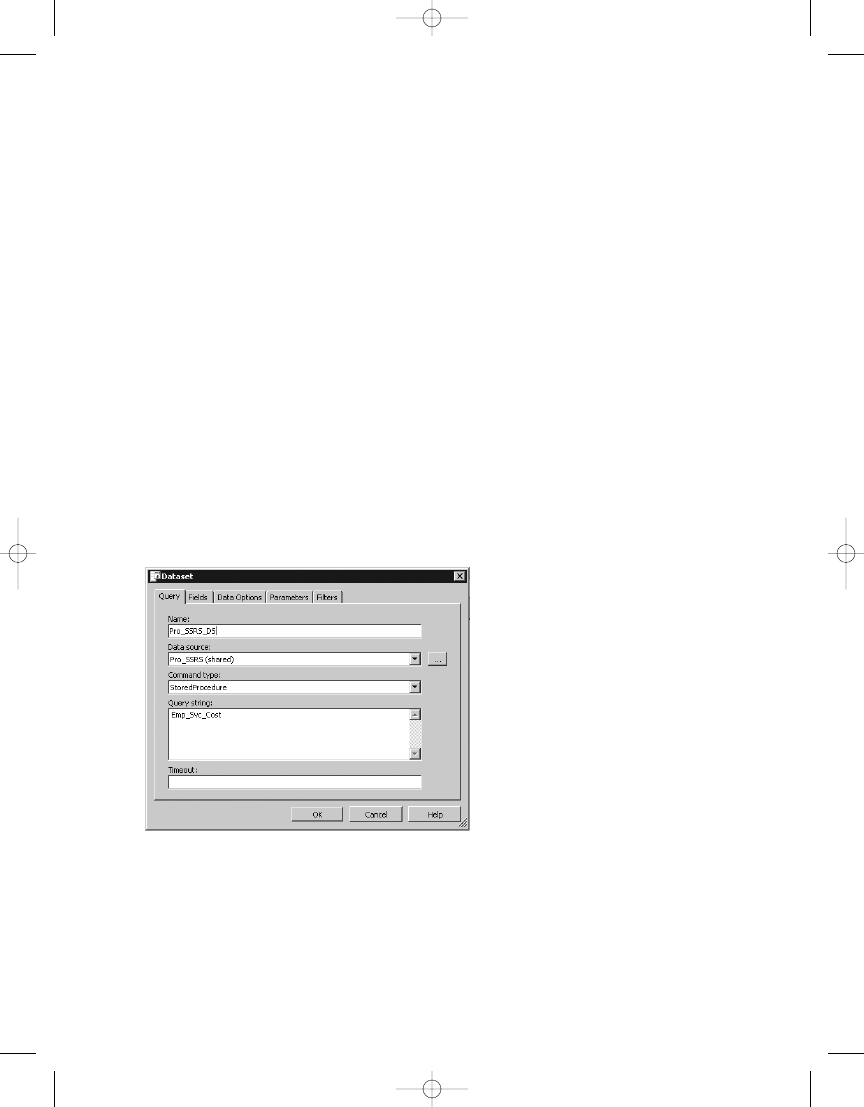
C H A P T E R 3
■
U S I N G T H E R E P O RT D E S I G N E R
43
<Name>Pro_SSRS</Name>
<DataSourceID>8665c4ac-17ca-436c-be19-334a1fa55274</DataSourceID>
<ConnectionProperties>
<Extension>SQL</Extension>
<ConnectString>data source=localhost;initial catalog=Pro_SSRS</ConnectString>
<IntegratedSecurity>true</IntegratedSecurity>
</ConnectionProperties>
</RptDataSource>
Creating a Dataset
Regardless of whether you’ve developed a query or stored procedure in an application other
than BIDS or whether you’re beginning it now within the report, your next step is to proceed
to the Data tab to create your first dataset. In this example, you’re using a stored procedure
that is already complete and tested, so half the battle is done.
On the Data tab, select <New Dataset...> in the Data Set list, which opens the Data Set
properties dialog box. Each dataset defaults to a name of the syntax, DataSet##, where ## is the
next unused number in sequence. You will then choose the data source you created in the pre-
vious step, Pro_SSRS. In the Command Type drop-down list, change the default, Text, to Stored
Procedure. In the Query string textbox, input the name of your stored procedure, Emp_Svc_Cost,
as shown in Figure 3-6. Finally, enter Pro_SSRS_DS for the name of the new dataset, and click
OK to complete the dataset configuration.
When you click OK, the generic query designer automatically opens to the Data tab. From
here you may execute the query and review the results by clicking the Run button on the Data
tab’s toolbar. When the stored procedure is executed, any parameters that have been defined
are created, and before data is returned, you must supply the parameter values. In the case of
this stored procedure, define five parameters: @ServiceYear, @ServiceMonth, @BranchID,
Figure 3-6.
Dataset properties
4983ch03.qxd 10/7/05 10:18 AM Page 43
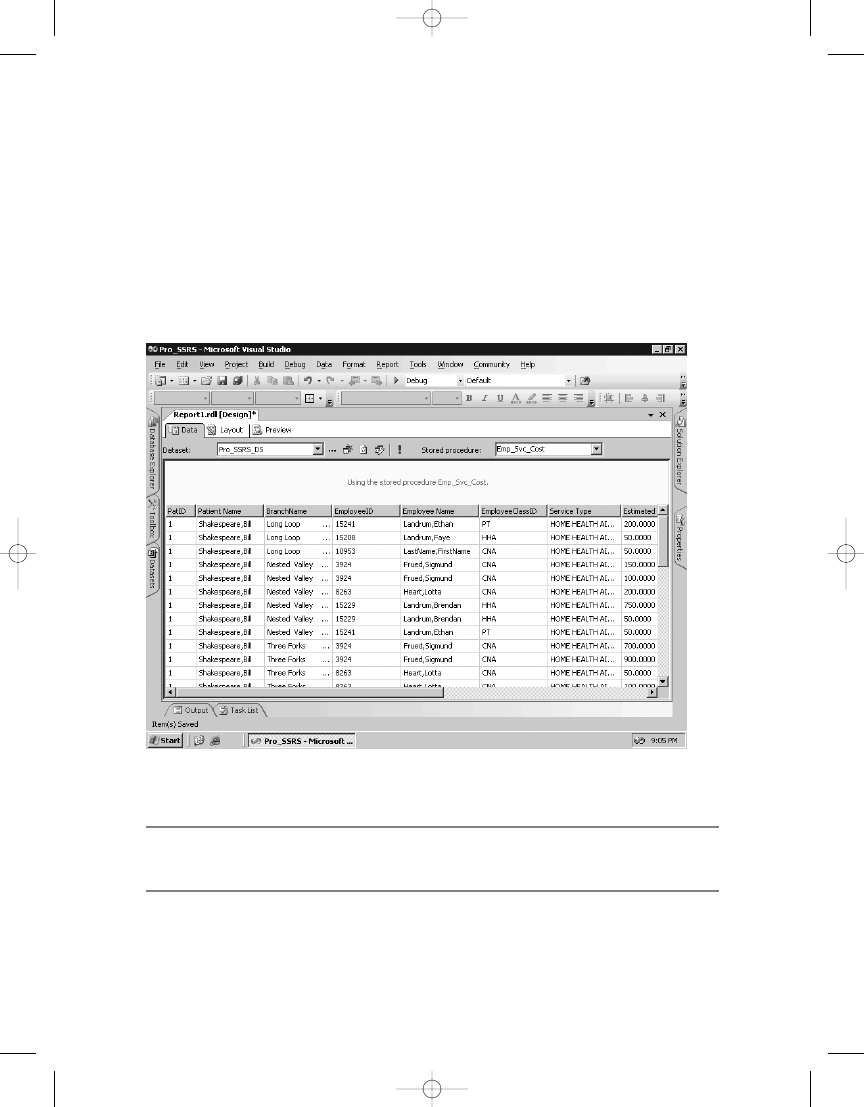
C H A P T E R 3
■
U S I N G T H E R E P O RT D E S I G N E R
44
@EmployeeTblID
, @ServicesLogCtgryID. The available default values for the parameters, when
the stored procedure is executed on the Data tab, are either NULL or Blank. A Blank value is dif-
ferent from a NULL value in that it can be an empty string. A NULL value indicates that the value
is nothing. NULL values can’t be evaluated with non-NULL values. In Chapter 2 you built logic
into the stored procedure to handle NULL parameter values so that when the user doesn’t sup-
ply a value, the query returns all records. If the user selects a specific value, only the records
that match that parameter value are returned. Execute the stored procedure with NULL values,
and make sure you’re getting the results you expect. You can see the results of the stored pro-
cedure execution in Figure 3-7.
■
Note
When prompted for the parameter values,
Blank
is the default value. To have the stored procedure
execute without a data type error, you must select the value of
NULL
.
An SSRS report can use multiple datasets at one time. This extends the flexibility of your
reporting, in that you can provide more data to the user in a single report. Multiple datasets
are also useful for populating parameter drop-down lists, which you will do in Chapter 4.
Figure 3-7.
Data returned from the stored procedure
4983ch03.qxd 10/7/05 10:18 AM Page 44

C H A P T E R 3
■
U S I N G T H E R E P O RT D E S I G N E R
45
However, having too many datasets could affect a report’s performance, so it’s important to
make sure the execution times for each result set are within acceptable ranges.
The RDL file for each report contains a section for each dataset defined for the report.
Listing 3-2 shows a sample of the RDL for the dataset you’ve defined in this chapter.
Listing 3-2.
Dataset Section of RDL
<DataSet Name="Pro_SSRS_DS">
<Fields>
<Field Name="PatID">
<DataField>PatID</DataField>
<rd:TypeName>System.Int32</rd:TypeName>
</Field>
<Field Name="Patient_Name">
<DataField>Patient Name</DataField>
<rd:TypeName>System.String</rd:TypeName>
</Field>
<Field Name="BranchName">
<DataField>BranchName</DataField>
<rd:TypeName>System.String</rd:TypeName>
</Field>
<Field Name="EmployeeID">
<DataField>EmployeeID</DataField>
<rd:TypeName>System.String</rd:TypeName>
</Field>
When creating a dataset, several additional tabs contain other configuration properties:
• Fields: Defines additional fields such as calculated fields or fields that aren’t automati-
cally defined with the data source. You derive calculated fields from an expression.
• Data Options: Sets several options specific to the data as it’s retrieved from the data
provider, such as case sensitivity and collation.
• Parameters: Defines the query parameter values for the dataset and the order in which
they’re evaluated. Stored procedures with declared parameters automatically generate
the query parameters in SSRS.
• Filters: Defines filter values for the dataset that you can use when the report is executed.
Creating Other Data Sources
One exciting aspect of SSRS is its ability to query multiple data source types in addition to SQL
Server. Any ODBC or OLE DB provider can be a potential data source for SSRS as well as XML,
SSIS, and SAP. For a simple example of using a data source other than a SQL Server database,
let’s look at the OLE DB Provider for Microsoft Directory Services. Creating the data source to
Analysis Services is similar to the SQL Server one you created earlier, with the difference being
selecting OLE DB as the data source and selecting OLE DB Provider for Microsoft Directory
Services for the OLE DB provider in the data source properties.
4983ch03.qxd 10/7/05 10:18 AM Page 45

C H A P T E R 3
■
U S I N G T H E R E P O RT D E S I G N E R
46
By using a direct LDAP query, you can generate field information for use in SSRS like so:
SELECT cn,sn,objectcategory,department
FROM 'LDAP://DirectoryServerName/OU=OuName,DC=Company,DC=Com'
The query uses a standard SQL dialect that returns the common name, surname, object
category (computer or person), and department from Active Directory. The field names are
automatically created and can be used like any other data field for a report.
You must take a couple caveats into consideration when querying Active Directory, as well
as other data sources that don’t support the graphical query designer in SSRS:
• Query parameters aren’t supported directly in the query. However, you can define and
use report parameters in the query—referred to as a dynamic query—and also to filter
data.
• Because a graphical query designer isn’t available, you need to develop the query in the
generic query designer by typing the query directly and testing. This requires knowledge
of Active Directory objects and names.
■
Tip
Several tools are available to assist in managing Active Directory, such as Active Directory Application
Mode (ADAM); LDP, an Active Directory tool included with the Windows Support Tools; and ADSIEdit, a graphi-
cal Active Directory browser included with the Windows Support Tools.
Setting Parameters
Parameters in SSRS come in two flavors, query parameters and report parameters, and the two
are often tied together closely.
You use a parameter that’s based on a SQL query or stored procedure to limit the record
set returned to the report, typically in the WHERE clause of a query. In the source query, you define
parameters by prefacing the parameter’s name with an @ symbol, such as @MyParameter. Within
SSRS’s query design tools, this does two things. First, it forces the query to prompt for the value
of the parameter when it’s executed. Second, it automatically creates the other parameter: the
report parameter by the same name. With stored procedures, such as Emp_Svc_Cost, which you
created in the previous chapter and have used here, any parameters that have been defined are
also automatically created for the report.
It is also possible to have report parameters that are disassociated from a query or stored
procedure. For example, you could have a report parameter that controls a report’s behavior
or layout properties. When you use a report parameter in this way, it’s often linked to a report
filter or is used in an expression that controls a property value of a report item. In Figure 3-8,
you can see the Report Parameters property dialog box with the automatically generated
parameters from the Emp_Svc_Cost stored procedure that you just set up for your report. To get
to the Report Parameters dialog box, with the Data or Layout tab in focus, select Report ➤
Report Parameters from the menu. Report parameters are used within a report, both for set-
ting criteria for datasets and for controlling report design layout elements, which you will do
in detail in Chapter 4.
4983ch03.qxd 10/7/05 10:18 AM Page 46
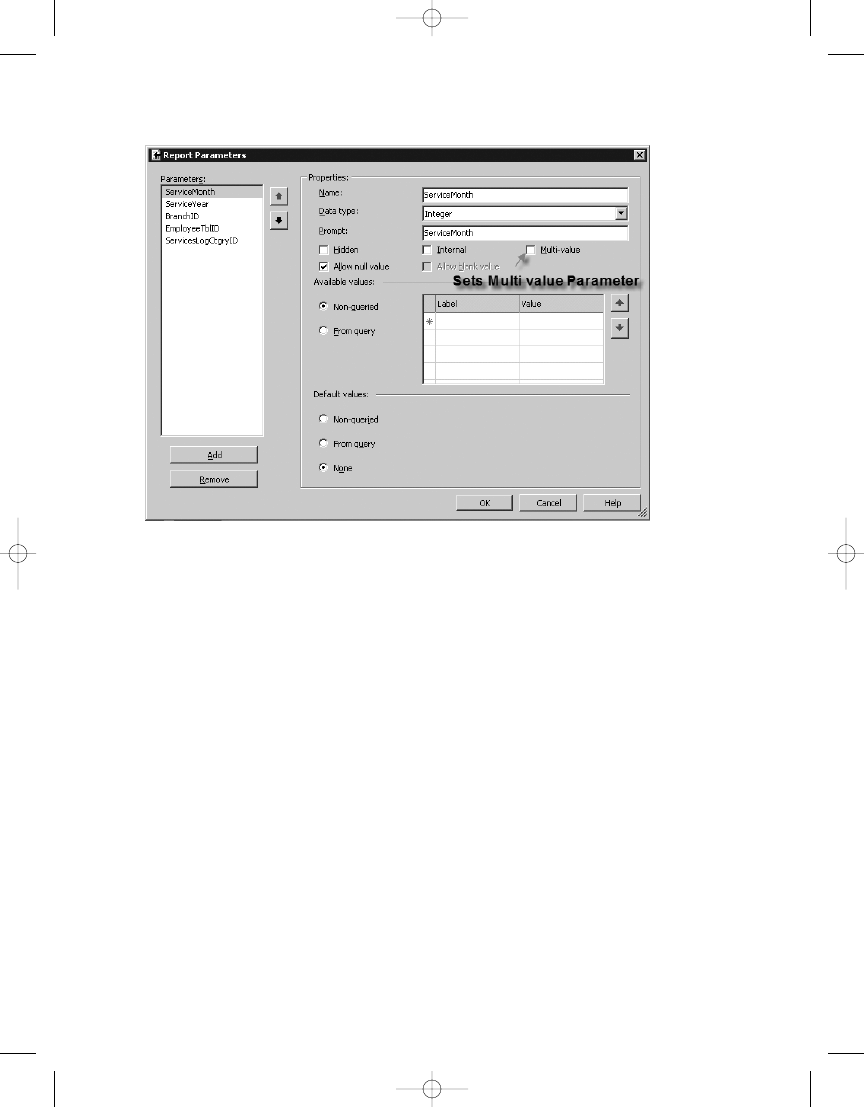
C H A P T E R 3
■
U S I N G T H E R E P O RT D E S I G N E R
47
Figure 3-8 also shows the Multi-value checkbox. This is a new feature in SSRS for SQL
Server 2005. In the previous version, SSRS for SQL Server 2000, multivalue parameters were
not available. Multivalue parameters allow users to select all values or combinations of values
to be used within the report to limit the data that is displayed. When multiple values are cho-
sen, these are passed to the query or stored procedure as a string array. It is important to note
that multivalue parameters require the following special considerations when implementing
in your reports:
Does not accept NULL values: This is important when deciding which parameters to make
multivalued, as it will influence the design of the underlying query or stored procedure. In
this case, you built logic into the Emp_Svc_Cost stored procedure to accept NULL values and
return all data when NULL was passed in from a parameter. You will have to modify this
stored procedure to work with multivalue parameters.
Will be evaluated as a String: Since a multivalue parameter returns a comma-separated
string, you will need to also consider the data type assignment for the stored procedure
parameters since the report parameter and the query or stored procedure parameter need
to be the same data type to work properly.
Affects performance: Multivalue parameters are best utilized when there is a relatively
small list of values. Choosing to allow users to select a range of years—for example,
“2003,2004,2005”—is much better than allowing them to select 1,000 patients based on
their IDs, as these will all be passed into the stored procedure as a comma-separated
string value to be evaluated with the In clause.
Figure 3-8.
Report Parameters dialog box
4983ch03.qxd 10/7/05 10:18 AM Page 47

C H A P T E R 3
■
U S I N G T H E R E P O RT D E S I G N E R
48
Cannot be used in filters: Unlike single-value or nullable parameters in SSRS, multivalue
parameters can be used only to pass back to the query or stored procedure, so using them
to limit with report filters is not possible.
Requires string manipulation logic in stored procedures: Stored procedures do not evalu-
ate multivalue parameters correctly, so using IN (@MyReportParameterArray) in a stored
procedure, for example, will not return the expected result. This has been an issue with
SQL for a long time, and numerous ways, both good and bad, exist to work with multi-
value string arrays with stored procedures. User-defined functions (UDFs) or dynamic
SQL are two possible choices. In Chapter 4, when we show how to build a deployable
report, we will discuss how to use a special UDF that parses the multivalue report param-
eter into a table that will work effectively to limit the result set to exactly what is expected.
Setting Up Filters
Like parameters, report filters can limit the results of data on a report; however, you don’t nec-
essarily have to use them in conjunction with a parameter. In fact, filters, which can be
defined at many points in the report, evaluate an expression and filter the results based on
that evaluation. Filters take this form:
<Filter Expression> <Operator><Filter Value>
An example of a filter is one that limits the data on a report to a specific user or that is
based on user input from a parameter value.
Chapter 9 demonstrates how to use a filter that limits the report based on a built-in
Global collection, which includes the username of the person executing the report. Filters are
beneficial in that once the report is rendered, you can use them in conjunction with parame-
ters to limit the data in the report without requerying the data source. In Figure 3-9, you can
see a filter that limits the data displayed based on a parameter called User. The logic is this: if
the parameter value for User is equal to a field value of User, then include only those records
where they match and otherwise include all records. Parameters and filters are included as
elements of an RDL report file.
4983ch03.qxd 10/7/05 10:18 AM Page 48
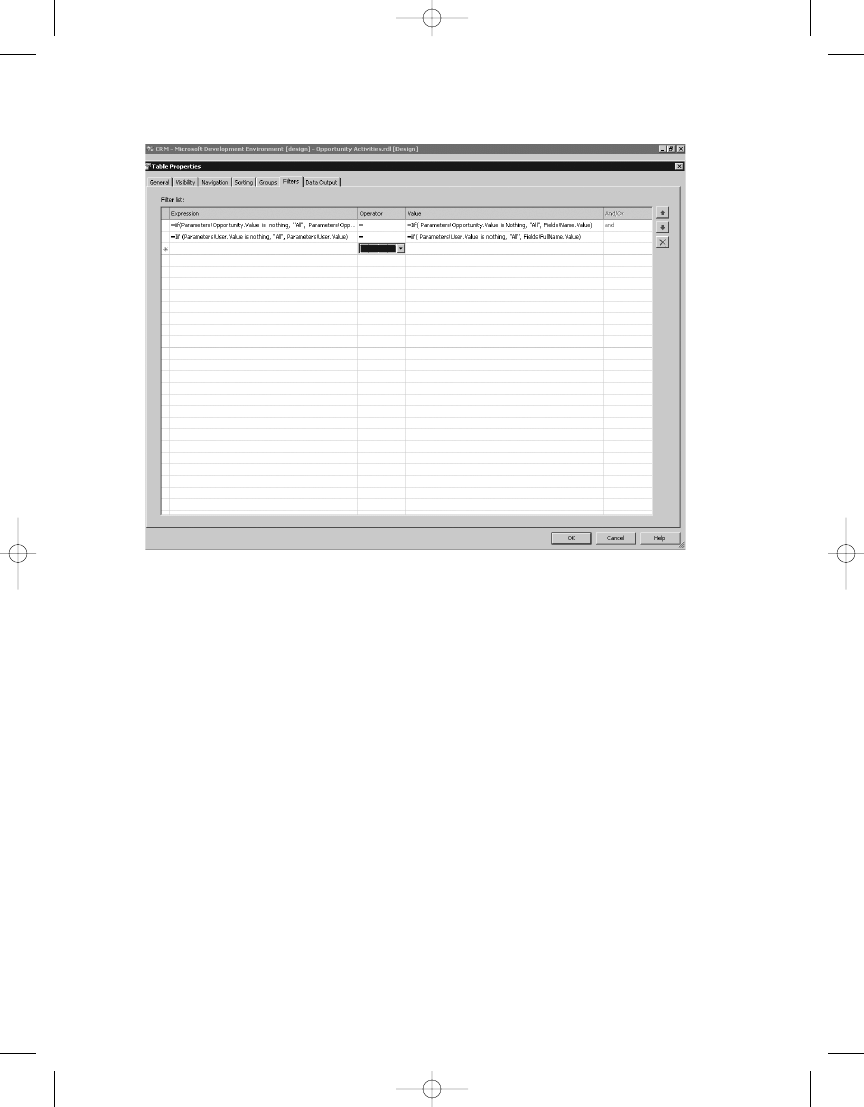
C H A P T E R 3
■
U S I N G T H E R E P O RT D E S I G N E R
49
Listing 3-3 shows the sample RDL elements.
Listing 3-3.
Parameter and Filter RDL Elements
<ReportParameter Name="User">
<DataType>String</DataType>
<Nullable>true</Nullable>
<DefaultValue>
<Values>
<Value>= nothing</Value>
</Values>
</DefaultValue>
<AllowBlank>true</AllowBlank>
<Prompt>User</Prompt>
<ValidValues>
<DataSetReference>
<DataSetName>User</DataSetName>
<ValueField>fullname</ValueField>
<LabelField>fullname</LabelField>
</DataSetReference>
</ValidValues>
Figure 3-9.
Sample filter on a table data region
4983ch03.qxd 10/7/05 10:18 AM Page 49

C H A P T E R 3
■
U S I N G T H E R E P O RT D E S I G N E R
50
<Filter>
<FilterExpression>=Iif (Parameters!User.Value is nothing, "All",
Parameters!User.Value)</FilterExpression>
<Operator>Equal</Operator>
<FilterValues>
<FilterValue>=iif( Parameters!User.Value is nothing, "All",
Fields!FullName.Value)</FilterValue>
</FilterValues>
</Filter>
Expressions
Throughout this section, you’ll use fields from the dataset to create sample report segments.
Because the values from the fields are derived from expressions that are essentially VB .NET
code, we will cover them now because they play a crucial role in the report design process.
You can use expressions to produce a value for any report item that uses them. In SSRS,
you can assign expressions to almost any report property, from formatting such as color or
padding to the value of a textbox. A simple expression such as that of a field assignment is
commonly used while designing reports. In fact, every time you add a field to an area of
a report, it’s automatically converted to an expression, like so:
=Fields!FieldName.Value
An expression is signified by prefacing its content, typically a VB .NET function, with the
equal sign (=). You can also concatenate expressions with other functions and literals. We will
show several examples of expressions throughout the book. We will list several sample expres-
sions here and show how to assign them to report items:
• =Parameters!ParameterName.Value: Used to assign the value of a parameter to a report
item such as a textbox or cell in a table.
• =IIF(Fields!FieldName.Value > 10, Red, Black): You use the IIF function for condi-
tional expressions. In this case, it would set the color for a property, such as the text
color to red, if the value of FieldName was greater than ten.
• =Fields!FieldName1.Value & " " & Fields!FieldName2 .Value: Used to concatenate
the value of two fields.
• =Avg(Fields!FieldName.Value): Aggregate functions such as Sum, Avg, Min, and Max that
return the average value of the fields.
• =RowNumber(Nothing): Used to maintain a running total for the row numbers in a report.
Nothing in this case is a scope parameter passed to the function indicating a grouping
or dataset. The scope parameter could be a group name or dataset, in which case a new
row count would begin at the end of each group or dataset.
In SSRS for SQL Server 2005, the expression builder application that is used inside the report
development environment was rebuilt to give it the type of functionality that is required to
assist users in easily creating useful expressions. The former incarnation of the expression
builder, released with SSRS for SQL Server 2000, was little more than a text-entry box, with
limited report object selections. Report designers needed to be intimately familiar with VB
4983ch03.qxd 10/7/05 10:18 AM Page 50
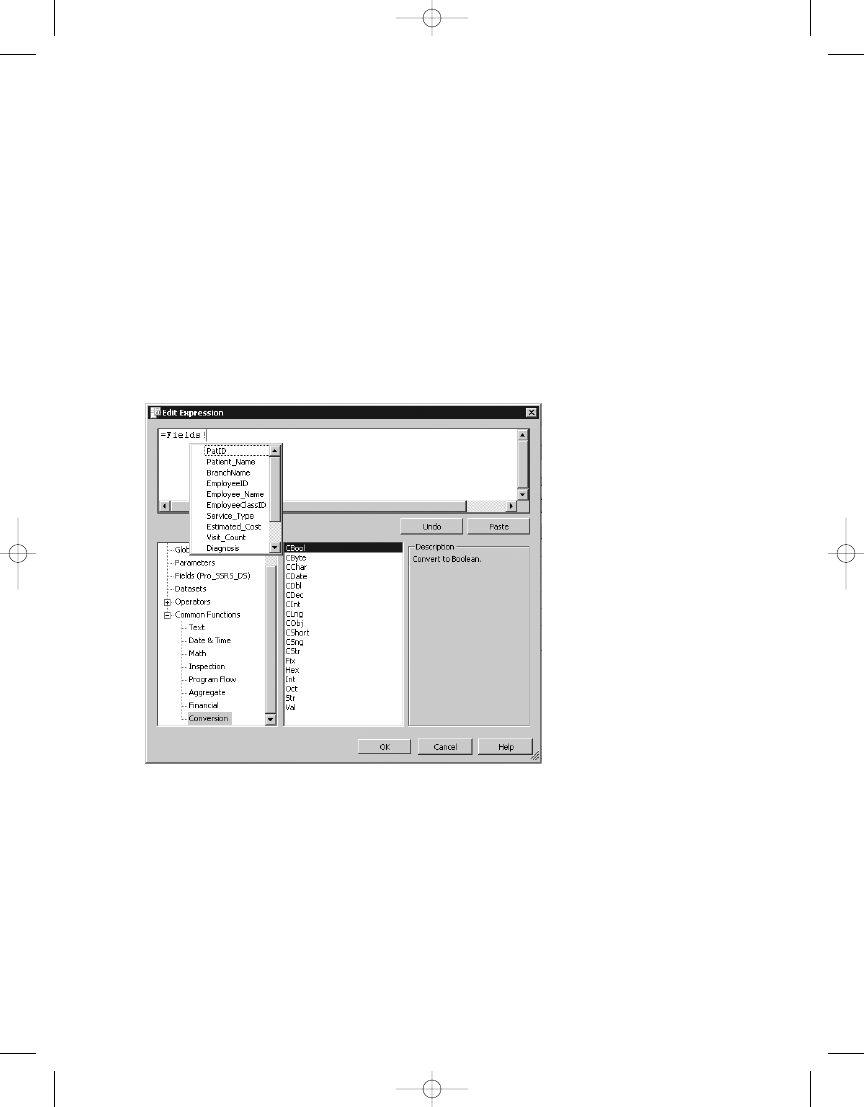
C H A P T E R 3
■
U S I N G T H E R E P O RT D E S I G N E R
51
.NET functions or spend time muddling through help files to find the appropriate syntax. With
the new expression builder, most of the common functions are listed, along with their syntax;
in addition, they are categorized based on their type, that is, Text, Conversion, and Date & Time.
This makes it much quicker to find the right function and place it as part of the expression you
are building. Another great feature that developers have become accustomed to, and frankly
should not have to live without, is IntelliSense, which is a contextual, in-line command com-
pletion feature. As you can see in Figure 3-10, as you are typing the expression (in this case
a field value expression from your stored procedure), you are prompted with all the possible
selections based on that expression. Once the expression is complete and syntactically correct,
you can click OK, and the expression will become a part of the report object where you have
associated it. If any syntax errors exist, these will be evidenced by a standard red underline
that indicates a problem. Hovering the mouse over the red underline will display the type of
error; in most cases “Invalid Syntax.”
Laying Out a Report
Now it is time to delve into the area in the IDE in which you’ll probably spend the most time:
the Layout tab. The real creative magic begins here, and we don’t mean because a wizard or
two might be involved.
Based on the report request and target audience, the look and feel of each report might be
entirely different. One user might expect drill-down functionality, and other users might need
full, detailed listings of data for printing. Whatever the case, SSRS provides many tools in the
Toolbox for building high-quality reports quickly and efficiently that can be immediately
Figure 3-10.
Assigning an expression
4983ch03.qxd 10/7/05 10:18 AM Page 51
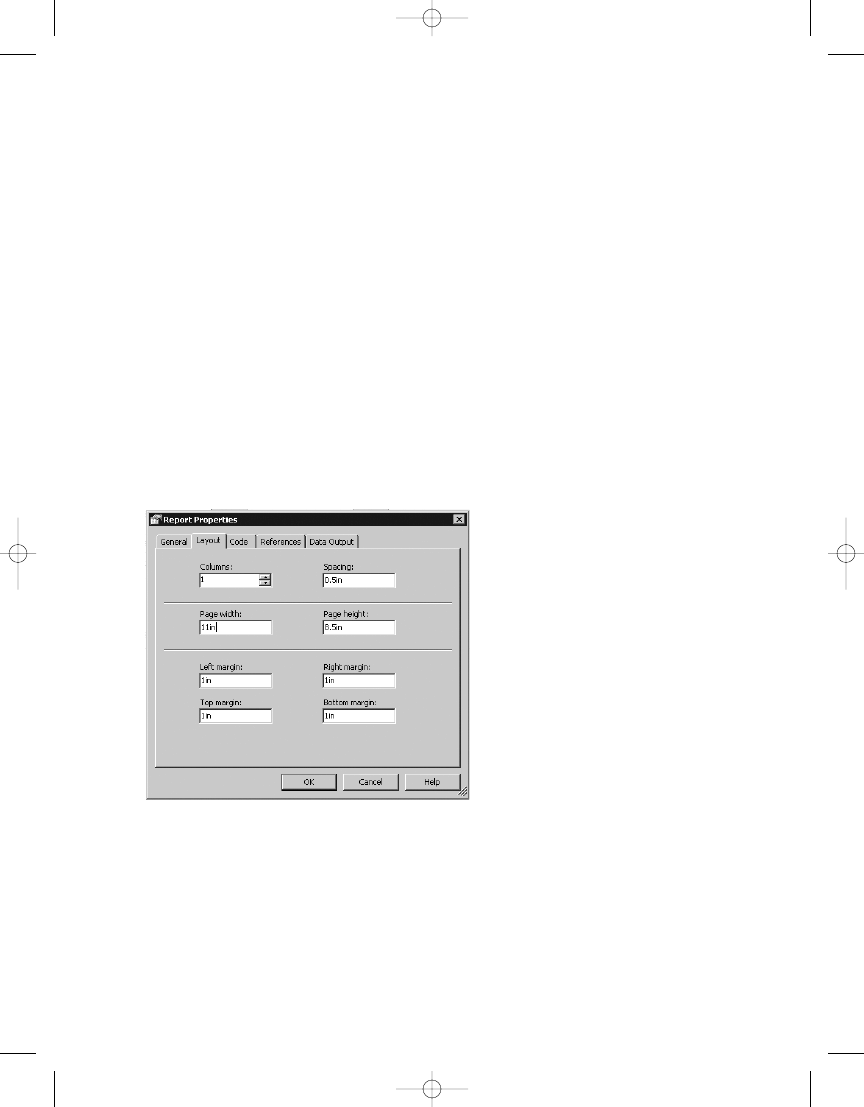
C H A P T E R 3
■
U S I N G T H E R E P O RT D E S I G N E R
52
deployed from within the report designer. In the following sections, you’ll take the sample
data and put it to use as you explore the functionality of each of the available tools and data
regions.
For each object we demonstrate, we’ll give the graphical representation of the design
environment as well as its RDL counterpart. Note that defined sections of the RDL file contain
every aspect of a report, from the general layout to pagination. This is important because often
it’s easier to work directly within the RDL file to make alterations to a report. As we show how
to adding functionality to the sample report projects, we’ll point out sections of the RDL files
where the graphical report design is converted to code.
Setting Up Pagination
To begin, look at the general report properties for the new report. While on the Layout tab,
select Report and then Report Properties from the drop-down menu on the toolbar.
Five tabs are in the Report Properties dialog box; for now you’re concerned with the Layout
tab. As you can see in Figure 3-11, the Layout tab contains property settings for pagination,
such as number of columns, page width, and margins. Because a number of reports will be
printed in landscape format, set the page width to 11 inches and the page height to 8.5 inches.
Leave all the margins at 1 inch.
The margins play an important role in printing. We can say with some embarrassment
that we had some initial issues when configuring reports to print on a single sheet, even though
we thought we had set the margins and the page width and height correctly. The issue turned
out to be a combination of these settings and the size of the design grid. The general formula
for calculating the correct pagination settings is as follows: the right side of the design grid
needs to be equal to or less than the page width, minus both the right and left margin sizes.
So, in this case, for a width of 11 inches with margins of 1 inch each for right and left, the
ou ever have any issues with printing blank
Figure 3-11.
Report Properties Layout tab
4983ch03.qxd 10/7/05 10:18 AM Page 52

C H A P T E R 3
■
U S I N G T H E R E P O RT D E S I G N E R
53
pages, or with data going to a second page, the issue is most likely caused by the design area.
Because the design area expands automatically as you add report objects such as data regions,
you might exceed the width without realizing it until you print the report.
The Layout tab also contains a Columns setting, where you can specify the number of
columns. We use multicolumn reports frequently in our industry, primarily for printing labels.
Later in the “Creating a Multicolumn Report for Printing Labels” section, you’ll create a multi-
column report to do just that.
Using Report Objects
In this section, you will look at the report objects to see their basic functionality and also learn
how you can tap into each one’s unique versatility when developing reports. At this point, if
you have not already done so, open the Pro_SSRS solution that we have provided with starting
points and completed samples as you read through the individual object sections. We will
cover the following report objects:
• List: This is a free-form container object for a single data grouping.
• Table: This is used for tabular reports with rows and columns but provides single or
multiple date groups.
• Rectangle: Like the List, the Rectangle is a container; however, it does not provide any
data groupings.
• Matrix: This report object, like the Table, provides multiple grouping levels; however,
data is laid out in a cross-tab or pivot-style report.
• Chart: SSRS provides many chart styles that can be incorporated with other report
objects such as the Table or Matrix or used as a stand-alone report.
• Image: This report object can embed standard format images, such as JPEG or TIFF,
directly in a report. You can embed images directly in report, say for a company logo, or
pull them directly from a database table.
Implementing a List
The List data region is one of the two free-form container objects that allow a single grouping
of data. The other free-form data region is the Rectangle, and the two are similar in that they
can contain other report objects and data regions. Free-form data regions don’t constrain the
layout of fields to a fixed format; the person creating the report is responsible for aligning the
objects.
Because the list contains a grouping level, you can use the List data region only with a sin-
gle dataset. Note that the List data region displays one record at a time from the dataset based
on this grouping. By default, no grouping is assigned to a list.
To learn how you can use the List data region with the Emp_Svc_Cost stored procedure,
which returns detail records for the number of visits for patients, you add a list to the design
area and drag fields from the dataset into it. You use Employee_Name, Patient_Name, Visit_Count,
and Estimated_Cost to show total visits and cost for each patient/employee combination.
In the Pro_SSRS solution, the list sample’s starting-point report is called List Start. The List
Start report has a data source and dataset, called emp_svc_cost, already defined for the localhost
server, which should match your environment if you are using BIDS to connect to your local
4983ch03.qxd 10/7/05 10:18 AM Page 53
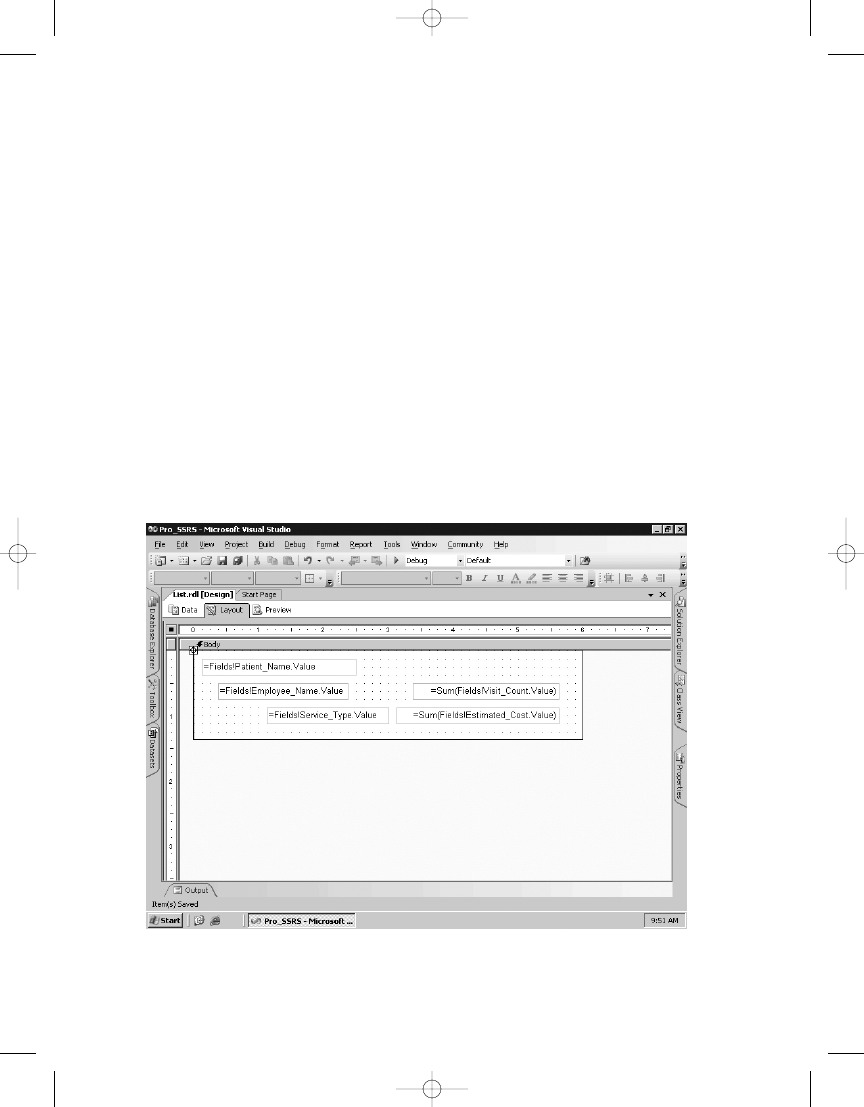
C H A P T E R 3
■
U S I N G T H E R E P O RT D E S I G N E R
54
To begin, open the List Start report, and click the Layout tab. To add the List report object
to the report, double-click List in the Toolbox. The List control is automatically added to the
upper-left area of the design grid. Grab the lower-right corner of the list and drag it down until
it is approximately 7 inches by 2 inches.
Next, select the Datasets toolbar, expand the emp_svc_cost dataset, drag these fields to
the design area, and place them in the List data region:
• Patient_Name
• Employee_Name
• Service_Type
• Estimated_Cost
• Visit_Count
You will next add the Sum function to the Visit_Count and Estimate_Cost fields so that
each field will be of the syntax =Sum(Fields!fieldname.Value). If you added a grouping level to
the list, which you will do shortly, the Sum function would have been automatically added to
these fields. Next, you will size the fields so that when you’re finished, the report looks like
Figure 3-12. As is obvious, you aren’t concerned with beauty at this point but functionality.
Figure 3-12.
List data region with ungrouped fields
4983ch03.qxd 10/7/05 10:18 AM Page 54
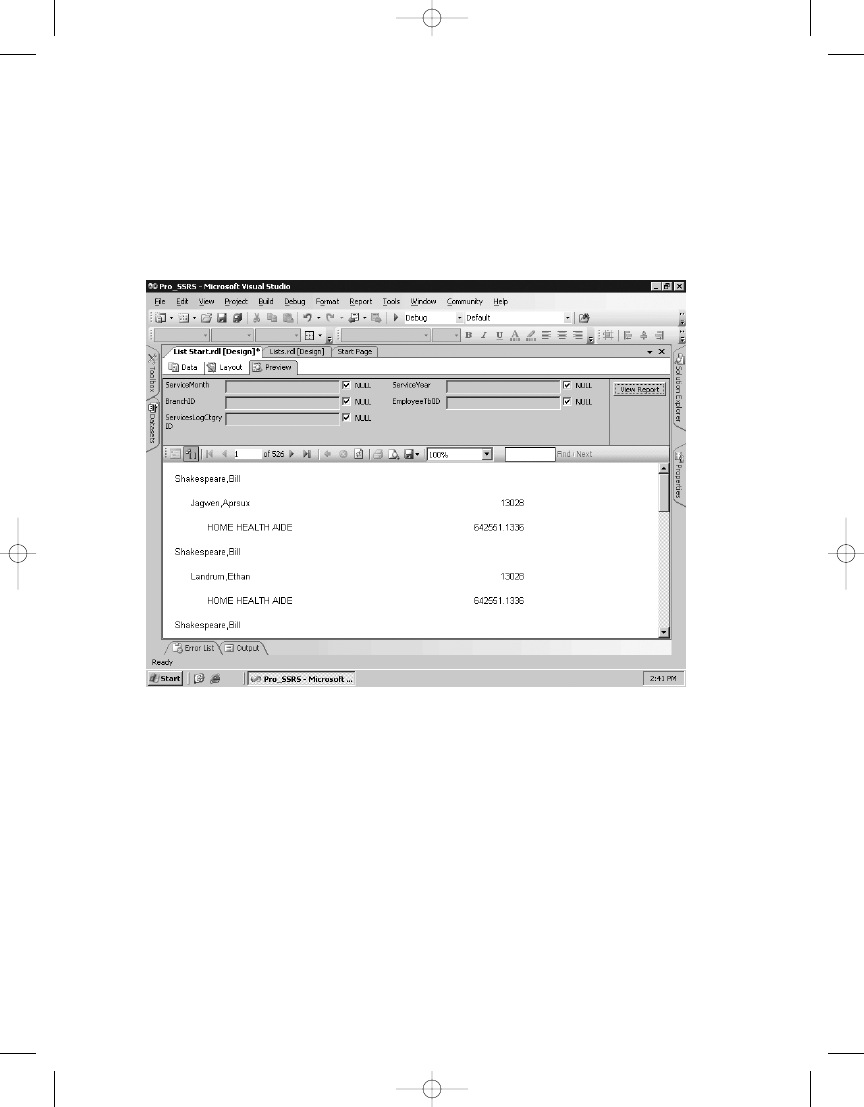
C H A P T E R 3
■
U S I N G T H E R E P O RT D E S I G N E R
55
When you click the preview button, the report will generate and display visit information
for each patient and employee (see Figure 3-13). Notice that the sum of the fields Visit_Count
and Estimated_Cost is the same for each record, which is reflective of the values for the entire
record set. In other words, the stored procedure returned 13,028 total visits for all the patients
at a total cost of $642,551.1336. Each sum amount is the same for all patients and employees
because you have not as yet defined any grouping for the list itself. You will do that next.
Figure 3-13.
Preview of the List data region
To add the grouping, click the Layout tab, right-click inside the List data region, and select
Properties. This opens the List Properties dialog box. Next, click the Edit Details Group button,
and add two fields in the Group On area—Patient_Name and then Employee_Name—as group
expressions. The preview of the new list with grouping levels now shows the correct number of
visits for each patient and employee combination. However, notice that in Figure 3-14 the now
familiar Bill Shakespeare is showing up multiple times with 37 visits for the employee Sigmund
Freud and eight visits for employee Lotta Heart, for example. What you really want to see is Bill
Shakespeare once with all the employee and visit information grouped in the figure. You could
remove the grouping for the employee from the list, but that would cause the report to group
all the patient’s visits under a single employee and reflect the data inaccurately. In this case,
you need to use a nested list that contains its own grouping level for employees. You do this by
adding another List data region to the existing data region. This should force each detail record
for the employee to show yet have it still be contained within the individual patient group.
4983ch03.qxd 10/7/05 10:18 AM Page 55
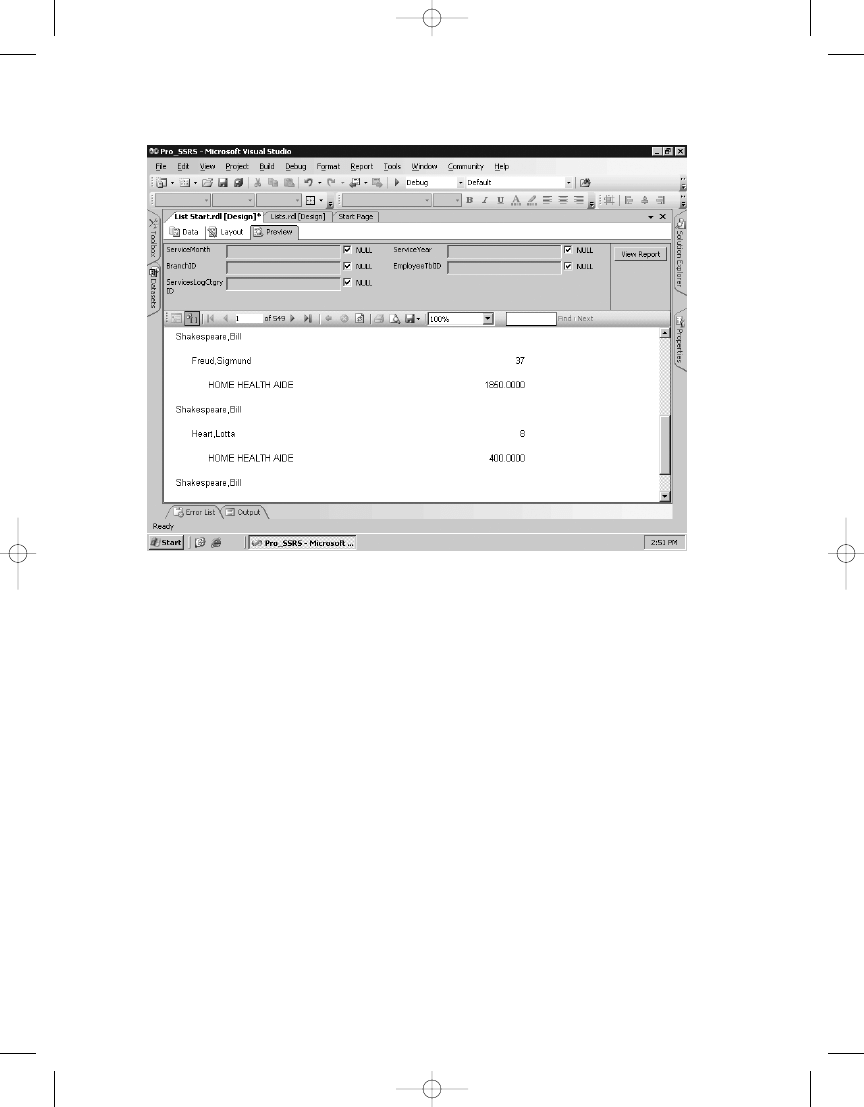
C H A P T E R 3
■
U S I N G T H E R E P O RT D E S I G N E R
56
To add a nested list, you need to rearrange the layout somewhat. The first step is to add
another list to the initial list by clicking the List data region in the Toolbox as you did previously
and sizing the new list into the existing list, which you will refer to as list1. Next, move all the
fields from list1, except for the Patient_Name field, into the new nested list, which you will call
list2. The report layout looks like Figure 3-15. Also notice that we have added a Line object
from the Toolbox at the bottom of list1 to distinguish where the groups will break in the report.
Next, go to the properties of the new list2, assign the same dataset, and add the grouping for
Employee_Name
as you did in the previous step by clicking the Edit Details Group button. Finally,
it is important that you remove the Employee_Name grouping from list1, which will force the
nested grouping levels that you desire, namely, Patient_Name in list1 and Employee_Name in
list2.
Figure 3-14.
Previewed report with duplicate patient
4983ch03.qxd 10/7/05 10:18 AM Page 56
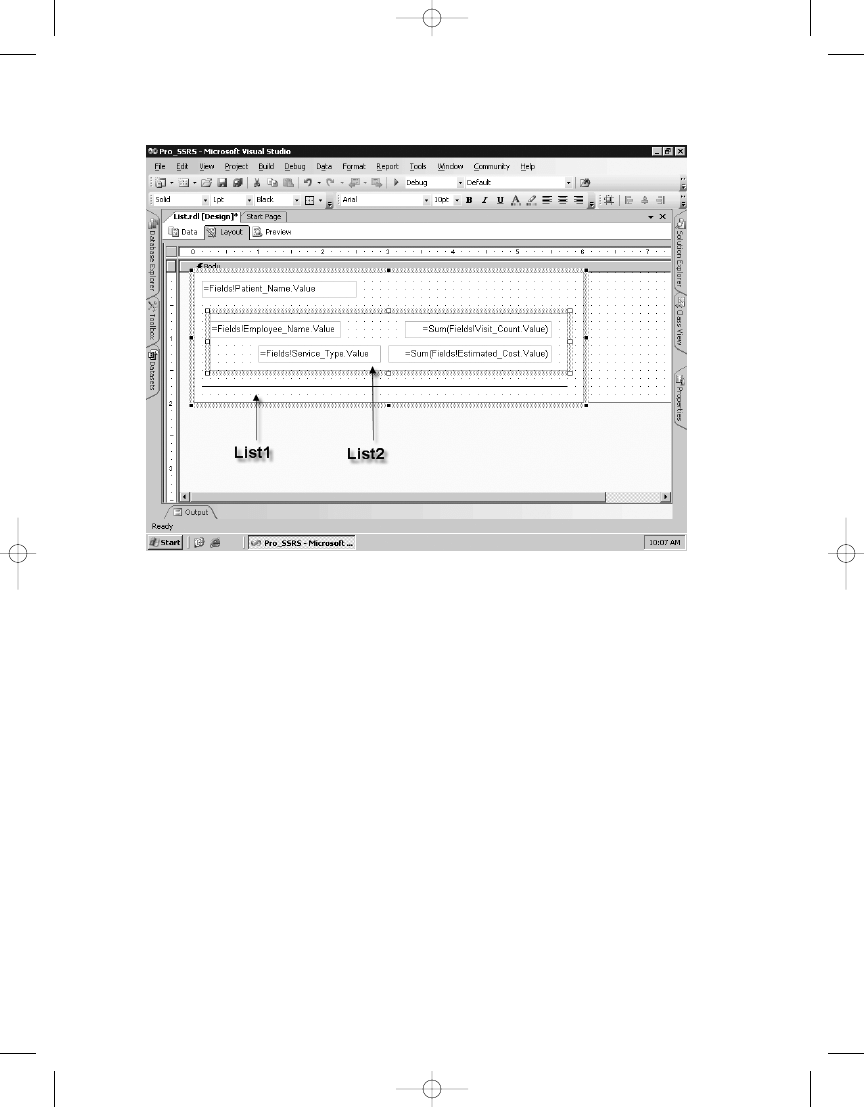
C H A P T E R 3
■
U S I N G T H E R E P O RT D E S I G N E R
57
Figure 3-15.
Report layout with two lists
Now, when you preview the report with the two lists—list1 grouped by Patient_Name and
the nested list2 grouped by Employee_Name—you can see that multiple employees are associ-
ated with a single patient, with each employee displaying the correct total number of visits
and estimated cost (see Figure 3-16). The line will separate the grouped results, showing where
the main List data region is repeating.
4983ch03.qxd 10/7/05 10:18 AM Page 57
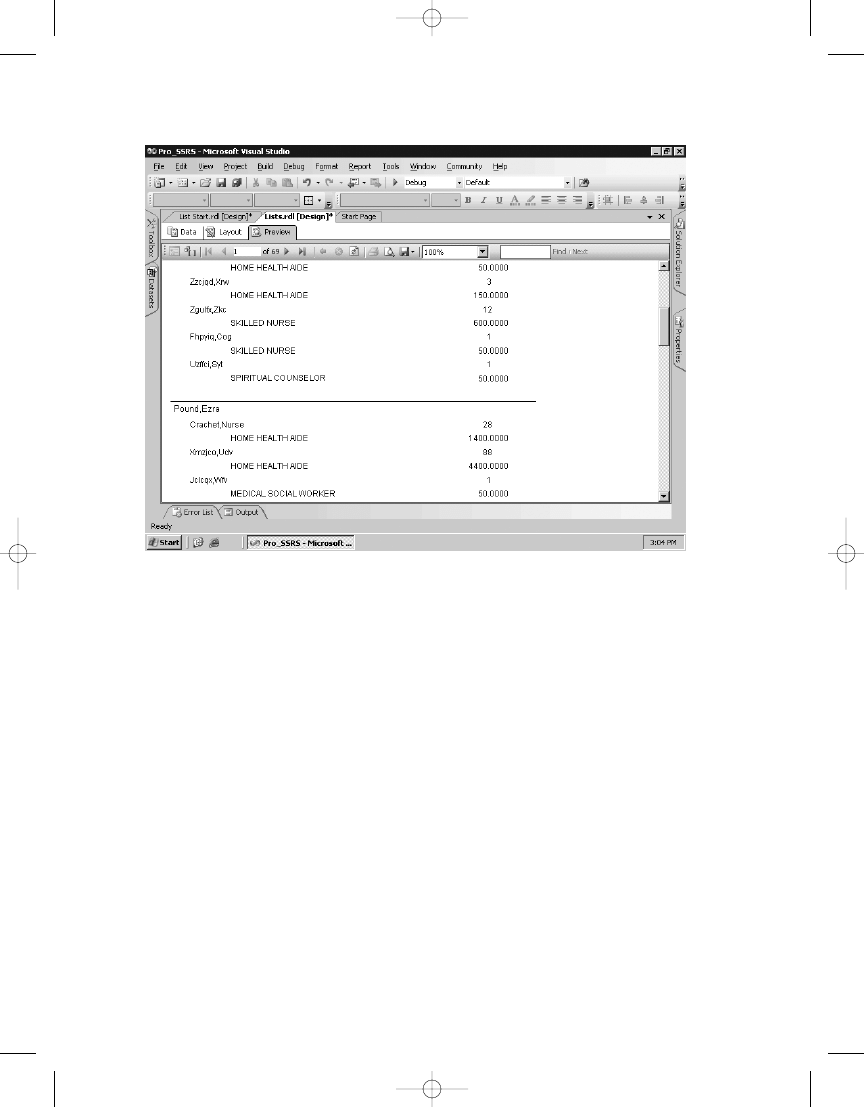
C H A P T E R 3
■
U S I N G T H E R E P O RT D E S I G N E R
58
You can see the section of the RDL file that shows a sampling of the List data region you
just created in Listing 3-4. Notice in the XML schema that the <List> element encapsulates
everything that has been graphically added to the List data region, including all formatting,
grouping, and the nested list.
Listing 3-4.
RDL List Section
<List Name="list1">
<Style>
<BorderStyle>
<Bottom>None</Bottom>
</BorderStyle>
</Style>
<Height>1.625in</Height>
<Top>0.25in</Top>
<Grouping Name="list1_Details_Group">
<GroupExpressions>
<GroupExpression>=Fields!Patient_Name.Value</GroupExpression>
</GroupExpressions>
Figure 3-16.
Previewed report with two lists
4983ch03.qxd 10/7/05 10:18 AM Page 58

C H A P T E R 3
■
U S I N G T H E R E P O RT D E S I G N E R
59
</Grouping>
<Width>6.875in</Width>
<DataSetName>Pro_SSRS_DS</DataSetName>
<ReportItems>
<List Name="list2">
■
Note
To access the full RDL file from within BIDS, while on the Layout tab, select View and then Code on
the drop-down menu. If you are working in Visual Studio 2005, press F7 and use Shift+F7 to toggle between
Code and Designer modes.
The completed report for the List object is called Lists.rdl in the Pro_SSRS project.
Implementing a Table
The Table data region provides a means of organizing data into tabular rows and columns with
possible multiple grouping levels. Every Table data region has, by default, a row that contains
detail records as well as table headers and footers. You can group tables on individual fields
from a single dataset or with expressions that might combine multiple fields. Tables make it
easy to make a report uniform because of the structured nature of the table. Fields from the
dataset are simply added to a cell within the table, and when the report is rendered, it’s auto-
matically formatted. This is in contrast to the List data region that provides much of the same
functionality as tables but requires manually positioning and aligning fields. As you’ll see in
this example, it’s often useful to combine data regions such as a Table, Rectangle, or List to get
both free-form control and structure simultaneously.
The starting-point report for the Table report object that we will demonstrate in this sec-
tion is available in the Pro_SSRS project in the Source Code area for the book on the Apress
site. It is called Table Start.rdl. Open the Tables Start.rdl file in BIDS to begin.
As you did with the list, you will begin on the Layout tab and double-click the Table in the
Toolbox. This adds a table that’s the exact width of the design area, with each of the three
columns equally divided in width. You could have sized the table by dragging it into position
in the design area if you didn’t want the table to encompass the entire design area.
Next, drag the same fields you used for the list example to the detail row of the table. In
the list example, you used the fields Employee_Name, Service_Type, Estimated_Cost, and
Visit_Count
as detail information and Patient_Name for the group. To add the four fields to the
detail row, you need to add a fourth column to the table. You accomplish this by right-clicking
the bar at the top of the middle column and selecting Insert Column to the Right. You now
have four equally sized columns to which you can drag the four fields so that the report
appears as it does in Figure 3-17, with the fields placed in the detail row of the table. You will
wait to add the Patient_Name field until you add a grouping level. Notice that the column
headings for each of the fields are added automatically when the fields are dropped into the
individual cells.
4983ch03.qxd 10/7/05 10:18 AM Page 59
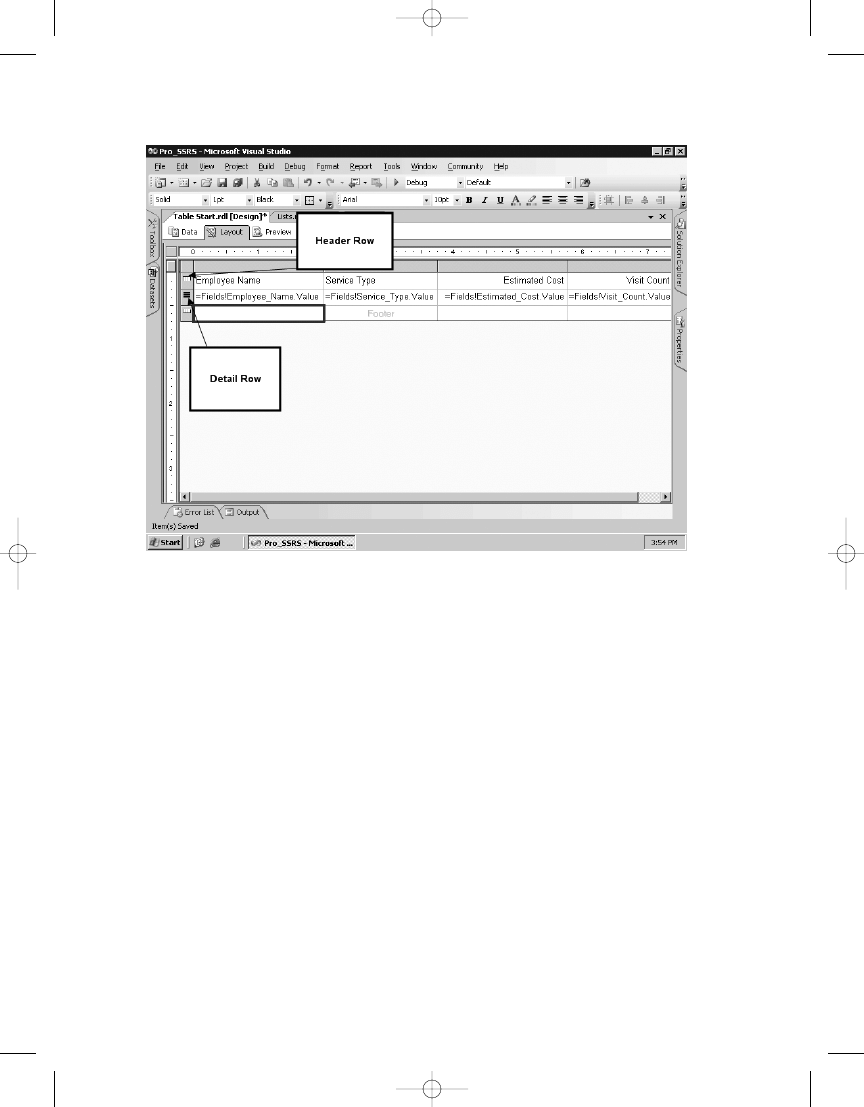
Figure 3-17.
Table data region with detail rows
C H A P T E R 3
■
U S I N G T H E R E P O RT D E S I G N E R
60
To add the Patient_Name field to the table so that the report has the same functionality as
the list you created previously, you need to insert a group in the table. To do this, right-click
the Detail button to the left of the detail row and select Insert Group. This opens the Grouping
and Sorting Properties dialog box (see Figure 3-18). In the Group On section of the General
tab, select =Fields!Patient_Name.Value in the drop-down list, which forces the grouping on
the patient, and then click OK.
4983ch03.qxd 10/7/05 10:18 AM Page 60
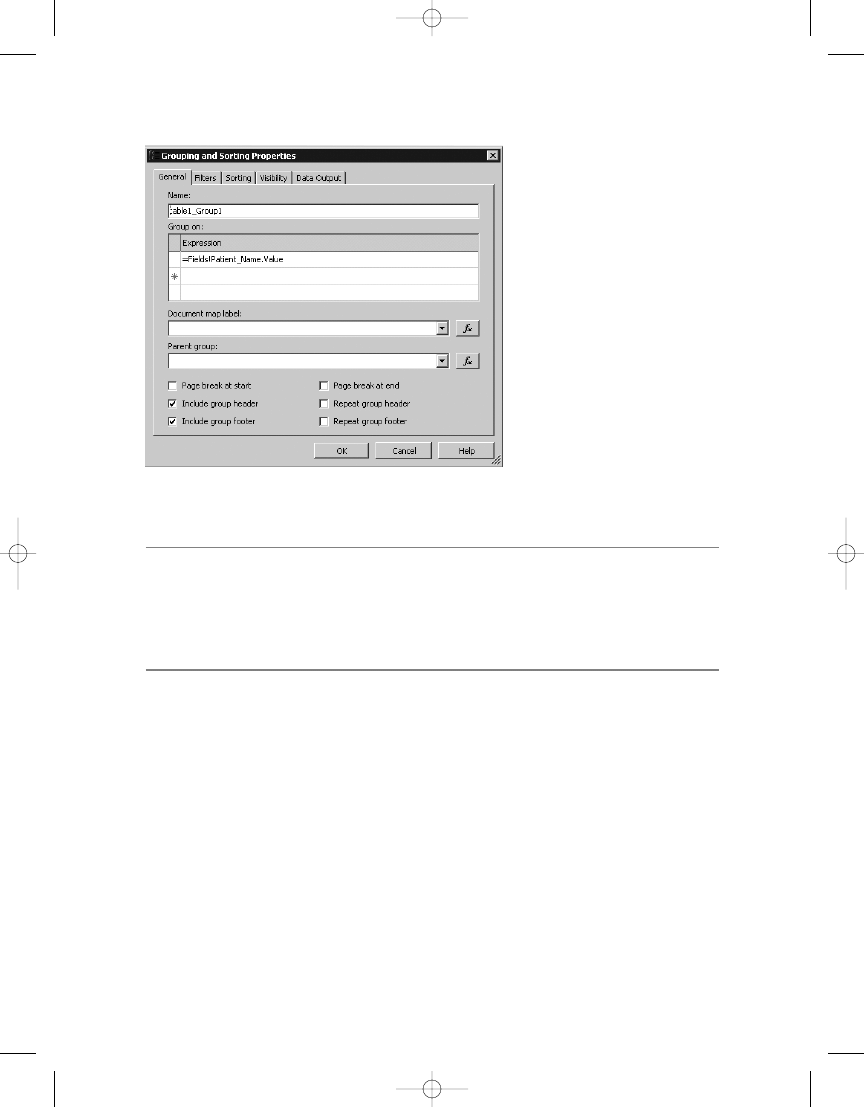
C H A P T E R 3
■
U S I N G T H E R E P O RT D E S I G N E R
61
■
Tip
Though you don’t use it here, notice in Figure 3-18 that the group can contain a parent group. Parent
groups are based on hierarchical data, such as an organizational chart. By assigning a parent group, you can
use the
Level
function to create an expression that automatically recognizes the data’s hierarchical rela-
tionships. The
Level
function is useful for formatting a report—for example, for indenting the lower levels to
display that relationship correctly.
After you click OK in the Grouping and Sorting Properties dialog box, you need to add the
Patient_Name
field to the new grouping row that was created in the previous steps. To do this,
drag the Patient_Name field to the header cell in the group, directly above the Employee_Name
detail field. To distinguish the patient from the employee, make the Patient_Name cell bold. For
clarity, delete each of the headers that were originally added when you added the detail row
fields—click the cells of the header, and press the Delete key. Next, resize the columns so that
the data is closer together. You can accomplish this either by dragging the right edge of each
column to the left or by selecting the entire column and entering the desired width in inches
in the Properties window.
Finally, you need to set an additional grouping level for the detail row, as you did for the
header row that contains the Patient_Name field. Right-click the detail row button, select Edit
Group, add =Fields!Employee_Name.Value to the Group On expression, and click OK. You also
need to make sure the Estimated_Cost and Visit_Count fields have the Sum function applied to
them—=Sum(Fields!Estimated_Cost.Value), for example—and then you can preview the
report. When the report is rendered, it performs similarly to the list you created previously, as
shown in Figure 3-19.
Figure 3-18.
Grouping and Sorting Properties dialog box
4983ch03.qxd 10/7/05 10:18 AM Page 61
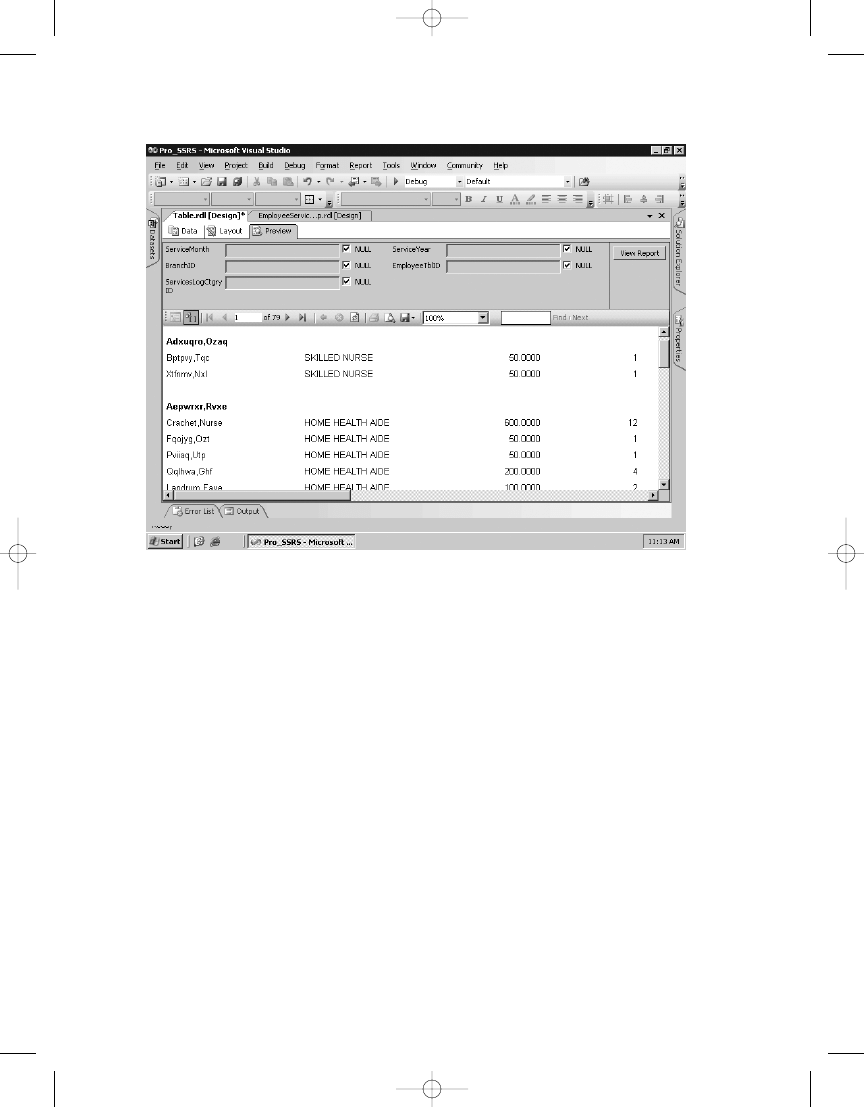
Figure 3-19.
Preview of table
C H A P T E R 3
■
U S I N G T H E R E P O RT D E S I G N E R
62
You could add more grouping levels to the table at this point if you need to, but for now
you’ll learn how to combine the table with the free-form rectangle to show how it’s possible to
extend beyond the structured nature of the table while maintaining multiple grouping levels.
The RDL listing for the table you’ve created will span many pages, so we have chosen,
where appropriate, to include a section of the RDL output for each of the data regions. In List-
ing 3-5, you can see a complete <TableCell> section that would be a child node to the
<TableCell>
, <TableRow>, and ultimately the <Table> elements. The particular cell from the
table that the RDL is referencing is the Patient_Name field that you added to its own grouping
in the table. Notice also that the Patient_Name field has a section of RDL that defines CanGrow.
By assigning the CanGrow property to a cell within the Table data region, it automatically
expands to fit the length of the data that it contains. The opposite is true as well by assigning
the CanShrink property.
Listing 3-5.
RDL Section for Table Data Region
<TableCell>
<ReportItems>
<Textbox Name="Patient_Name">
<Style>
4983ch03.qxd 10/7/05 10:18 AM Page 62

C H A P T E R 3
■
U S I N G T H E R E P O RT D E S I G N E R
63
<PaddingLeft>2pt</PaddingLeft>
<PaddingBottom>2pt</PaddingBottom>
<PaddingTop>2pt</PaddingTop>
<PaddingRight>2pt</PaddingRight>
<FontWeight>700</FontWeight>
</Style>
<ZIndex>15</ZIndex>
<rd:DefaultName>Patient_Name</rd:DefaultName>
<CanGrow>true</CanGrow>
<Value>=Fields!Patient_Name.Value</Value>
</Textbox>
</ReportItems>
</TableCell>
The completed report for the Table object is called Table.rdl and is in the Pro_SSRS project.
Implementing a Rectangle
The Rectangle data region, as discussed earlier, is similar to the List data region in that it’s
a free-form container object for report items. Like the list, it encapsulates all the objects into
one defined area. So, when it’s repositioned or deleted, the objects inside are also repositioned
or deleted. Also, like all the other report objects and data regions we’ll cover, you can position
and scope the rectangle inside other data regions.
The Rectangle data region is more limited than the List data region, as it contains no
grouping levels. You can group the objects or data regions that are placed inside a rectangle.
You can use rectangles in several creative ways in an SSRS report. You will pick up where you
left off on the previous sample, using the Table data region, and add a rectangle as a place-
holder inside the table. This way, you can add a level of free-form design to the report while
maintaining the structure afforded by the Table data region. In this example, we will also intro-
duce the Textbox report object. A Textbox can contain literal string values such as a report title;
it might also contain an expression. You use a Textbox object to add titles to the free-form
objects that you place inside the rectangle.
The starting-point report for this section is called Rectangle Start.rdl and is available in
the Pro_SSRS project in the Source Code area for the book on the Apress site.
To begin, open the Rectangle Start report, and follow these steps to add a rectangle to the
entire detail row:
1.
The first step is to drag a Rectangle data region from the Toolbox into the detail row
that is extended in size in the Rectangle Start report. Notice that when the rectangle is
added, it appears inside the table as a grid.
2.
Next drag the two fields, Visit_Count and Estimated_Cost, from the emp_svc_cost
dataset into the detail area. Place them vertically so that the Visit_Count field is above
the Estimated_Cost field. Notice that SSRS automatically assigns the Sum aggregate
function to the fields.
4983ch03.qxd 10/7/05 10:18 AM Page 63
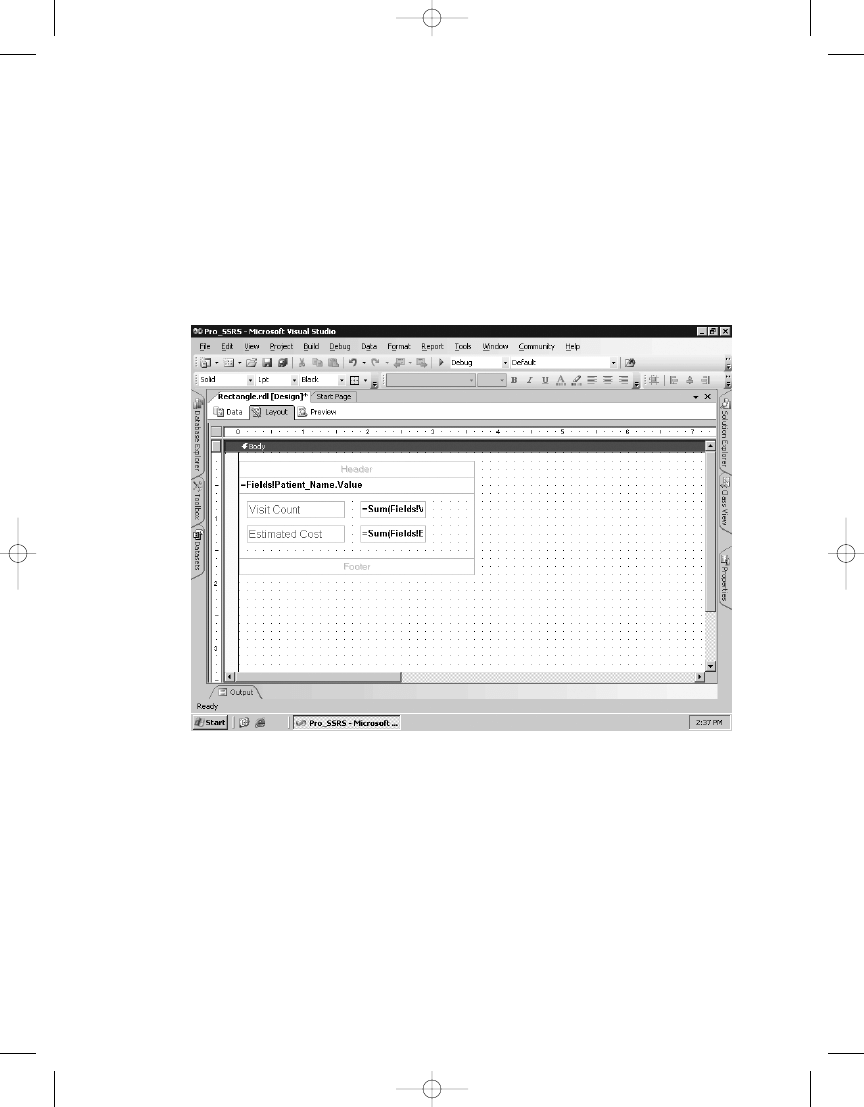
Figure 3-20.
Rectangle in table with formatting
3.
Next, drag two textboxes from the Toolbox into the rectangle to the left of the two fields
you just added. The textboxes, which can contain expressions or literal strings, serve as
labels. Inside the textboxes, type Visit Count and Estimated Cost, respectively.
4.
Next, add formatting to the textboxes by selecting each textbox using the Shift key and
then setting the color property to Firebrick and the font size to 12 point. You will also
make the Estimated_Cost and Visit Count fields bold. You can find these settings on
the standard formatting toolbar or in the Properties window. When complete, the
report layout will look like it does in Figure 3-20.
C H A P T E R 3
■
U S I N G T H E R E P O RT D E S I G N E R
64
When you preview the report, the Estimated_Cost field doesn’t appear to be in the correct
format. The format should be currency. Each textbox contains formatting properties that you
can set in several ways. While on the Layout tab, right-click the textbox that contains the sum
of the Estimated_Cost data field, and select Properties. You can set the format for the textbox
value on the Format tab of the Textbox Properties dialog box. By clicking the ellipsis button
beside the Format Code field, you are presented with several available formats, with Currency
being the one you will choose (see Figure 3-21). The default currency format with a code of “C”
contains two decimal places. If you chose to do so, you can override this by choosing Custom
and entering C0 or C1, which would give you no decimal places or one decimal place, respec-
tively. For this example, leave the default two decimal places.
4983ch03.qxd 10/7/05 10:18 AM Page 64
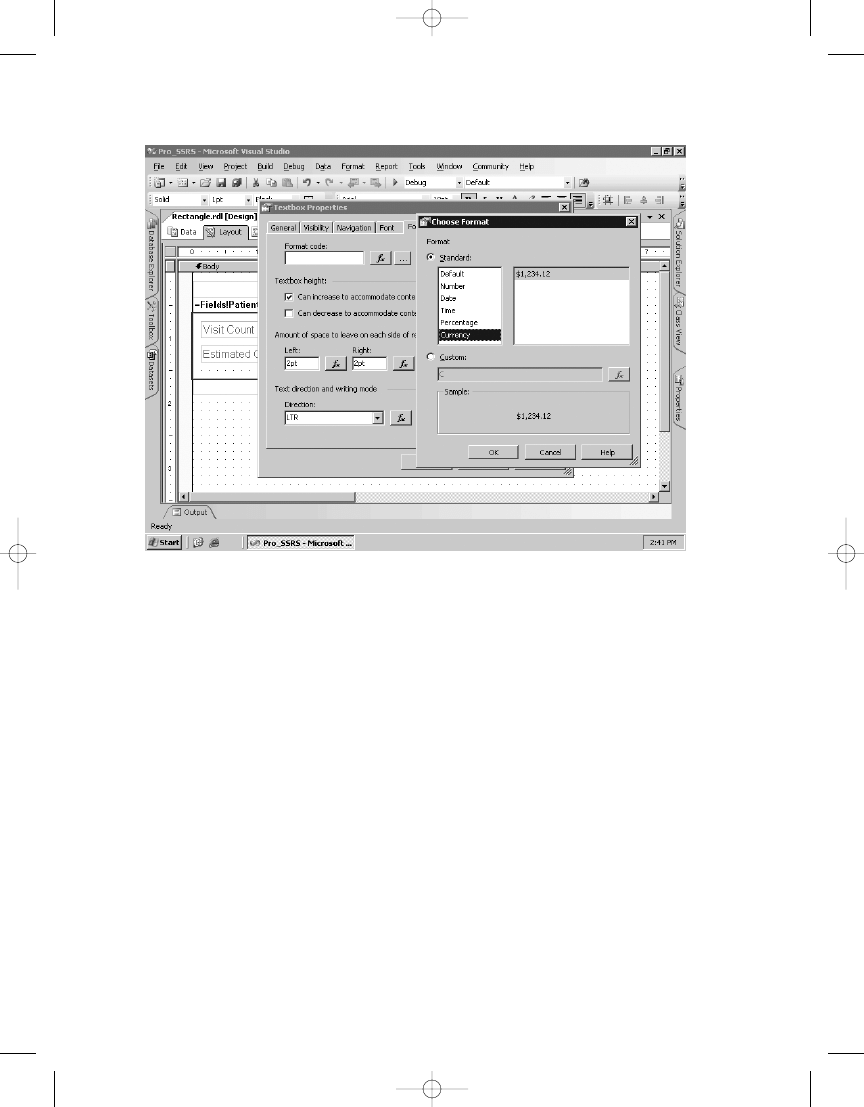
C H A P T E R 3
■
U S I N G T H E R E P O RT D E S I G N E R
65
When you click OK and preview the report, you can see that you now have a single detail
row that’s formatted with vertically aligned textboxes with appropriate formatting, as shown
in Figure 3-22. Using a rectangle in this manner allows more flexibility when adding several
free-form elements to a report while still providing the multiple grouping levels of the table.
Figure 3-21.
Choose Format dialog box
4983ch03.qxd 10/7/05 10:18 AM Page 65
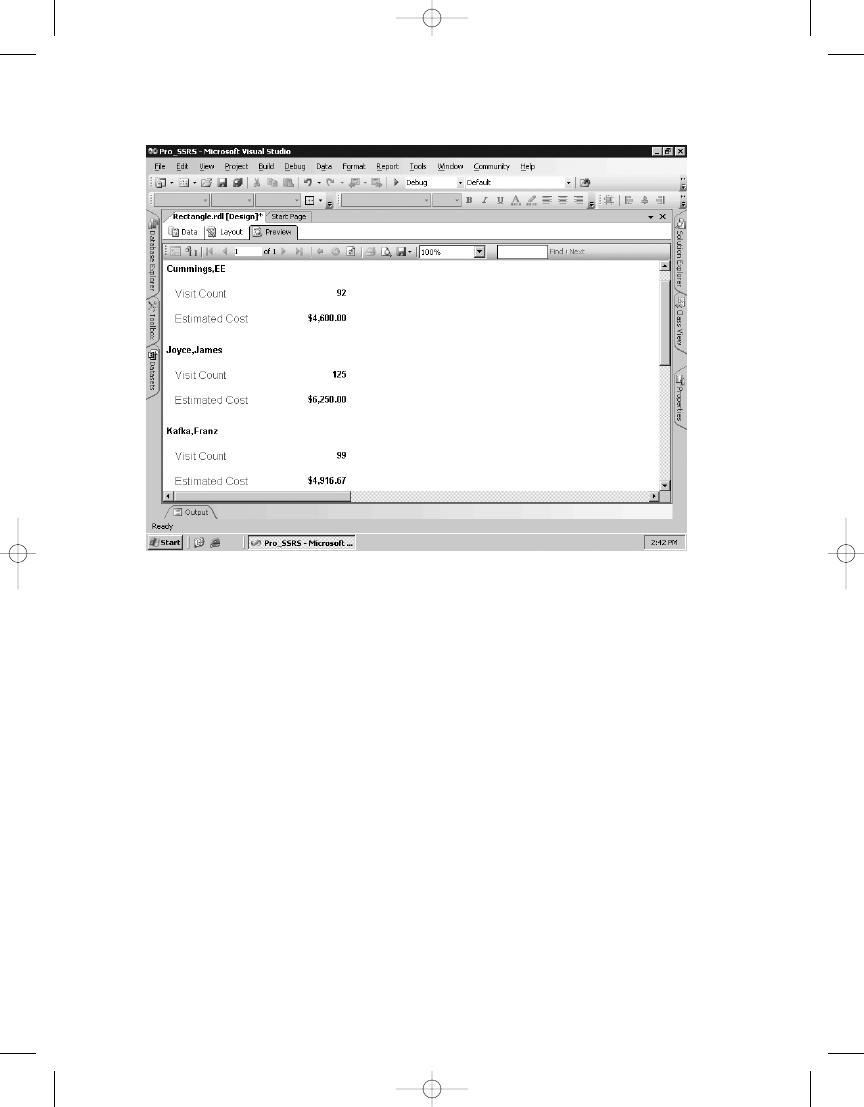
Figure 3-22.
Preview of table with formatting
C H A P T E R 3
■
U S I N G T H E R E P O RT D E S I G N E R
66
You can see the RDL output of the rectangle that you added to the table in Listing 3-6.
Listing 3-6.
RDL Output for Rectangle
<Rectangle Name="rectangle1">
<ReportItems>
<Textbox Name="textbox2">
<Style>
<PaddingLeft>2pt</PaddingLeft>
<FontSize>12pt</FontSize>
<Color>Firebrick</Color>
<PaddingBottom>2pt</PaddingBottom>
<PaddingTop>2pt</PaddingTop>
<PaddingRight>2pt</PaddingRight>
</Style>
The completed report for the Rectangle object is called Rectangle.rdl and is located in
the Pro_SSRS project.
4983ch03.qxd 10/7/05 10:18 AM Page 66
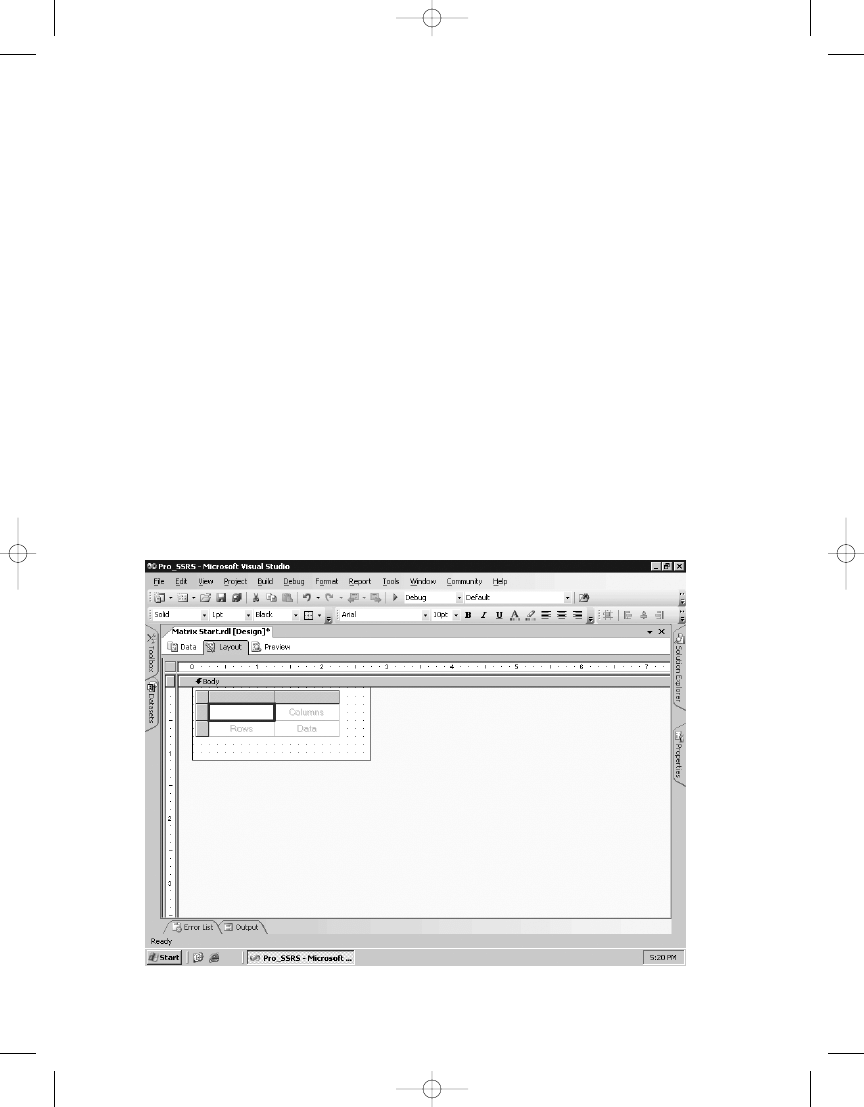
C H A P T E R 3
■
U S I N G T H E R E P O RT D E S I G N E R
67
Implementing a Matrix
You can use the Matrix data region to produce output formatted in rows and columns around
aggregated measures. A matrix in SSRS is similar to a pivot table or a cross-tab report. You can
group data fields in a matrix together with other fields, producing a natural summary and
detail relationship. Simple single-level Matrix data regions with one column and one row pro-
vide valuable BI that you can deploy for quick analysis. However, to tap into the true benefit of
a matrix, SSRS provides the ability to render the output in the interactive OWC format so that
users can manipulate the matrix report for in-depth analysis. This is true for data derived from
standard SQL queries or from data derived from an MDX query used with Analysis Services (cov-
ered in Chapter 10). For now, we’ll introduce some of the properties of the Matrix data region
and use the stored procedure, Emp_Svc_Cost, to populate it with the Estimated_Cost value for
each patient over a period of time. You concatenate the field values for Year and Month to use
for the column grouping section of the matrix and Patient_Name for the row grouping.
The starting point report for the Matrix object demonstrated in this section is available in
the Pro_SSRS project in the Source Code area for the book on the Apress site. This report is
called Matrix Start.rdl.
By default, only three cells are in a Matrix data region that defines Columns, Rows, and
Data cells, as shown in Figure 3-23. You can use the fourth blank cell at the top left for a label
or for an expression-and-parameter combination that can control the layout of the matrix
itself. Chapter 9 discusses how to change the default static grouping of a matrix report by
using a parameter value, where you use a matrix report to analyze SSRS execution statistics.
Figure 3-23.
Matrix data region
4983ch03.qxd 10/7/05 10:18 AM Page 67
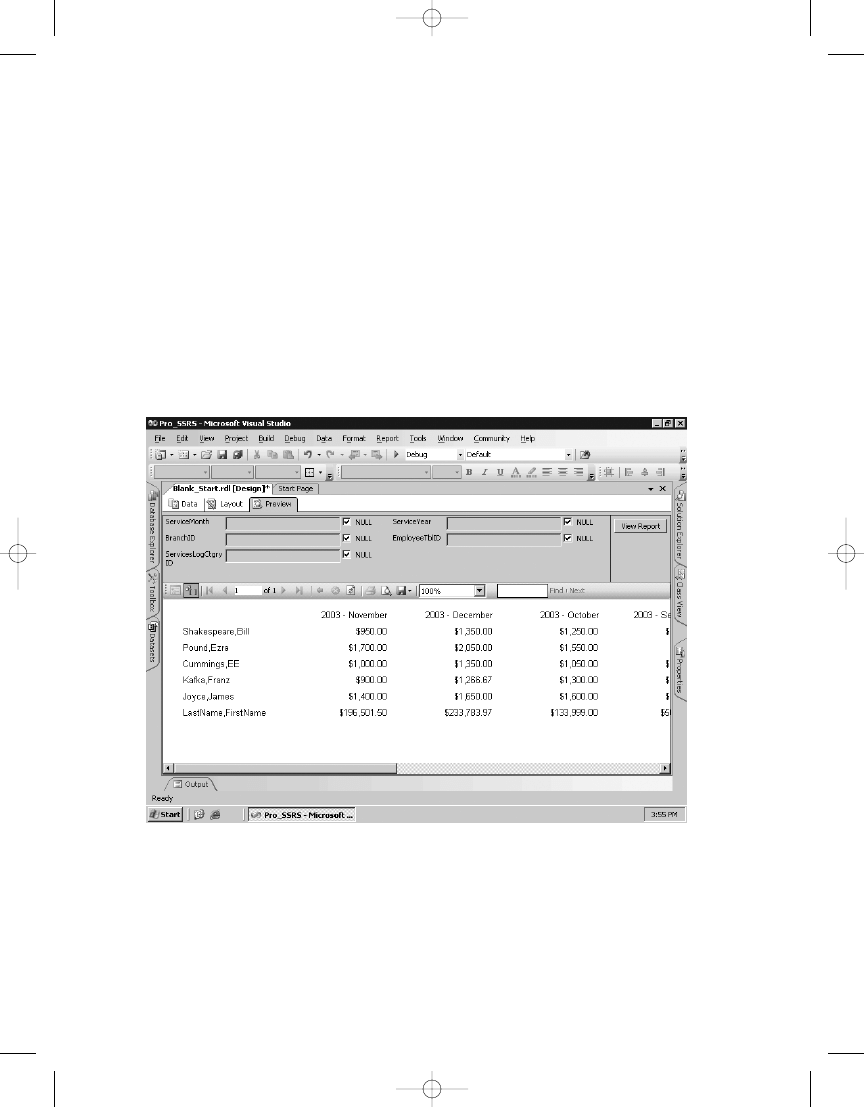
C H A P T E R 3
■
U S I N G T H E R E P O RT D E S I G N E R
68
Figure 3-24.
Matrix data region preview
With the Matrix Start.rdl report open, double-click the Matrix object in the Toolbox, which
will automatically add a matrix to the design area of the report. Next, drag two fields onto the
matrix, Patient_Name and Estimated_Cost from the emp_svc_cost dataset, which go in the Rows
and Data areas, respectively. For the Columns area, define an expression that concatenates the
Service_Year
and Service_Month fields. The expression is as follows:
=Fields!Year.Value & " - " & Fields!Month.Value
You also use this expression to create a custom grouping with the combined fields. To group
the Columns area on the expression, right-click the column field, select Edit Group, place the
expression in the Group On section, and select OK. Next, left-align the Estimated_Cost field,
and set the formatting to Currency, as demonstrated in the previous section. When you pre-
view the report, you can see in Figure 3-24 that the matrix shows the estimated cost of care for
the familiar patients for each month they had service.
4983ch03.qxd 10/7/05 10:18 AM Page 68

C H A P T E R 3
■
U S I N G T H E R E P O RT D E S I G N E R
69
You can see the RDL output of the matrix in Listing 3-7.
Listing 3-7.
Matrix RDL Listing
<Matrix Name="matrix1">
<Corner>
<ReportItems>
<Textbox Name="textbox1">
<Style>
<PaddingLeft>2pt</PaddingLeft>
<PaddingBottom>2pt</PaddingBottom>
<PaddingTop>2pt</PaddingTop>
<PaddingRight>2pt</PaddingRight>
</Style>
<ZIndex>3</ZIndex>
<rd:DefaultName>textbox1</rd:DefaultName>
<CanGrow>true</CanGrow>
The completed report for the Matrix object is called Matrix.rdl and is available in the
Pro_SSRS
project.
Implementing a Chart
The Chart data region of SSRS, like the Matrix data region, allows multiple grouping levels
from a single dataset. Instead of the column- and row-level groupings that the Matrix data
region provides, the Chart data region uses Series, Categories, and Values. You can set many
properties for a chart, and as with all other data regions, a chart can use expressions to define
its properties. Also, like other data regions, you can place charts by themselves or scope them
within another region such as a List or Table data region. For example, you could use a simple
chart to show the overall visits by type of clinician, which in your stored procedure is deter-
mined by the Service_Type field. You could also add the chart to a cell in a table that’s grouped
by patient and time frame, such as Month and Year. The chart would show for each grouping
a visit count for that patient over time. Let’s add a chart to the report that uses the
Emp_Svc_Cost
stored procedure. For the chart, you will add three familiar fields, one for each
chart area: Series, Categories, and Values will contain Patient_Name, Employee_Name, and
Visit_Count
, respectively.
The starting-point report for the Chart object demonstrated in this section is available in
the Pro_SSRS project in the Source Code area for the book on the Apress Web site (http://
www.apress.com
). This report is called, creatively enough, Chart Start.rdl.
1.
To begin, open the Chart Start.rdl report to the Layout tab, and click the Chart tool in
the Toolbox to add the Chart object to the design area. After you add the Chart object,
you can see each of the three areas of the chart that hold the fields you add.
2.
Drag the Visit_Count field to the Drop Data Fields Here area.
3.
Next, drag the Patient_Name field to the Drop Series Fields Here area.
4.
Finally, drag Employee_Name to the Drop Category Fields Here area (see Figure 3-25).
4983ch03.qxd 10/7/05 10:18 AM Page 69
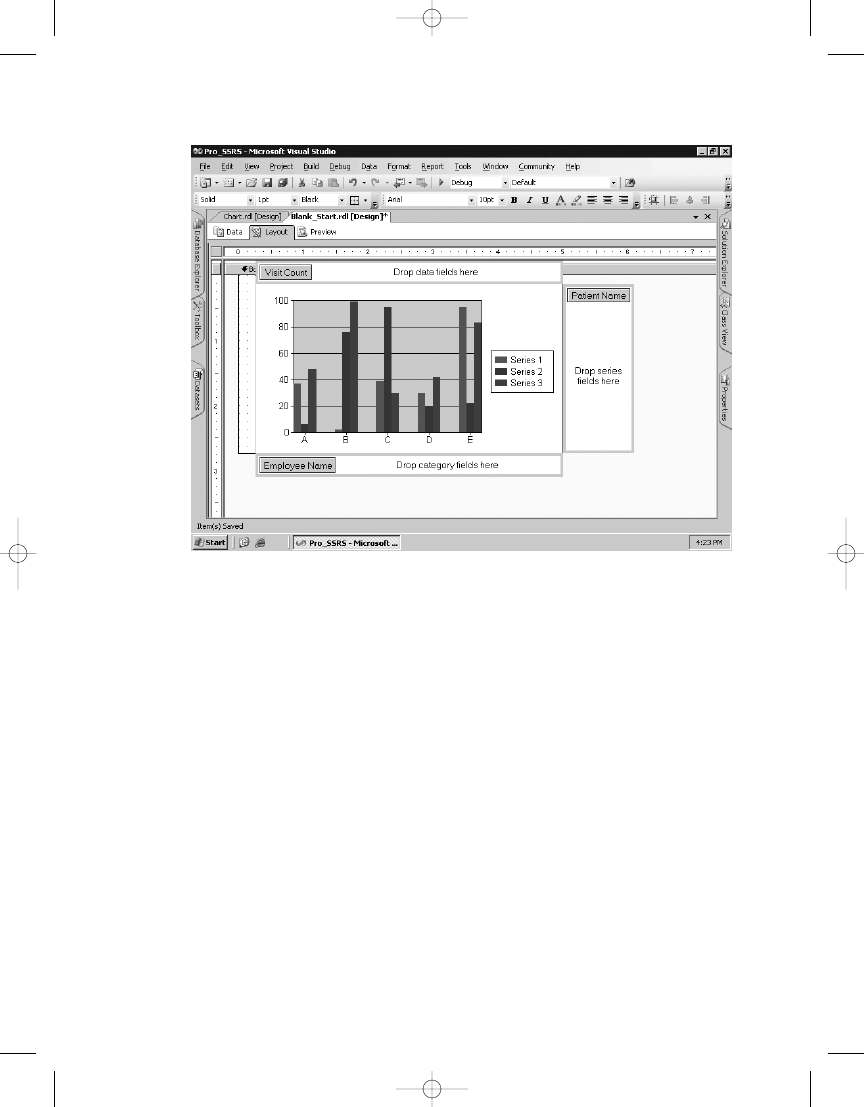
Figure 3-25.
Chart with three fields
C H A P T E R 3
■
U S I N G T H E R E P O RT D E S I G N E R
70
Before you preview the chart, let’s look at its properties. By default, the chart is a column
type. You’ll modify several properties of the chart to add functionality and visual appeal.
Right-click in the chart area on the Layout tab, and select Properties. On the General tab,
change the Chart Type option to Bar, and set the Chart Sub-Type option to Stacked. Next,
change the Palette option to Light. The properties should look like Figure 3-26.
4983ch03.qxd 10/7/05 10:18 AM Page 70
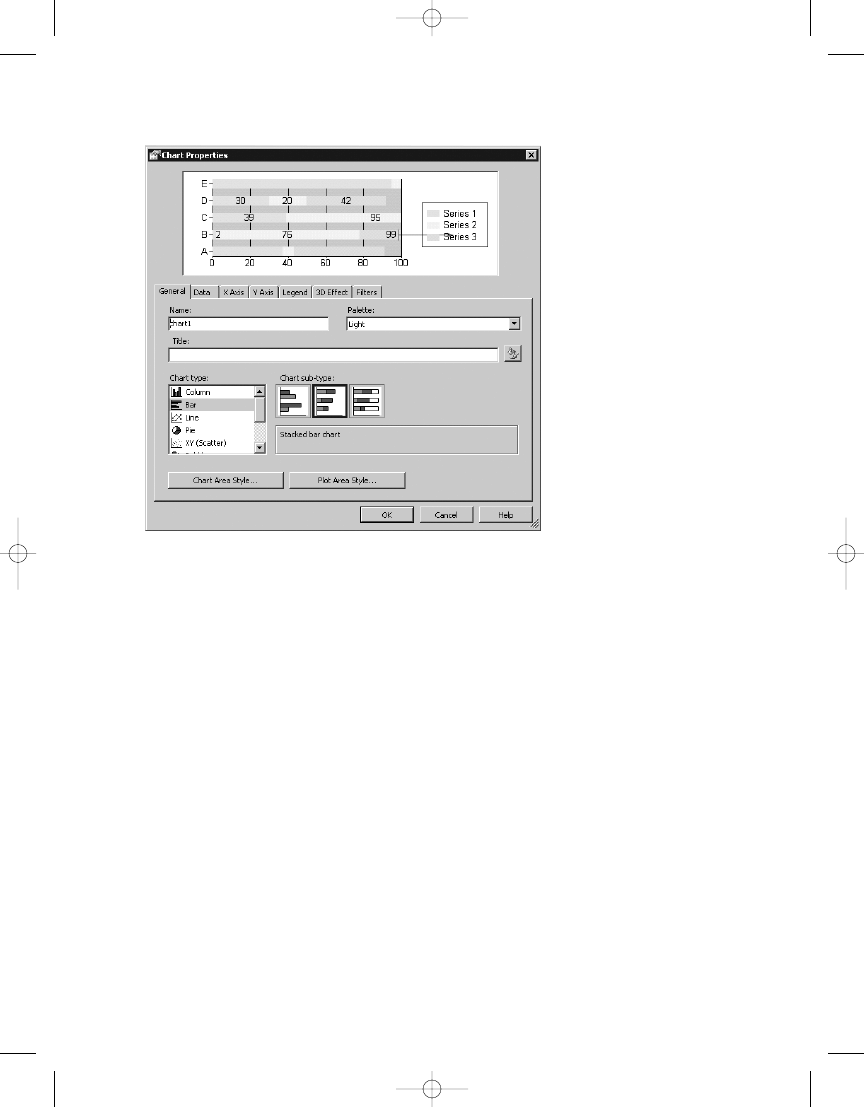
C H A P T E R 3
■
U S I N G T H E R E P O RT D E S I G N E R
71
You might notice in Figure 3-26 that black numbers are in the chart. These don’t appear by
default. These are called point labels and can be set from the Data tab of the Chart Properties
dialog box. On the Data tab, select the Edit button for the Values section of the chart. From
the dialog box that displays, click the Point Labels tab, select the Show Point Labels checkbox,
and set the label expression to be the same as the data itself, as follows:
=Sum(Fields!Visit_Count.Value)
Adding this expression puts data labels, or pointers, on the report so that users can easily
discern what values are set for the data series. Finally, click the 3D Effect tab, and check the
Display Chart with 3D Visual Effect box. You also choose Cylinder on the same tab and set the
Horizontal Rotation to 20 degrees. You can now click OK and preview the chart, as displayed in
Figure 3-27.
Figure 3-26.
Chart properties
4983ch03.qxd 10/7/05 10:18 AM Page 71
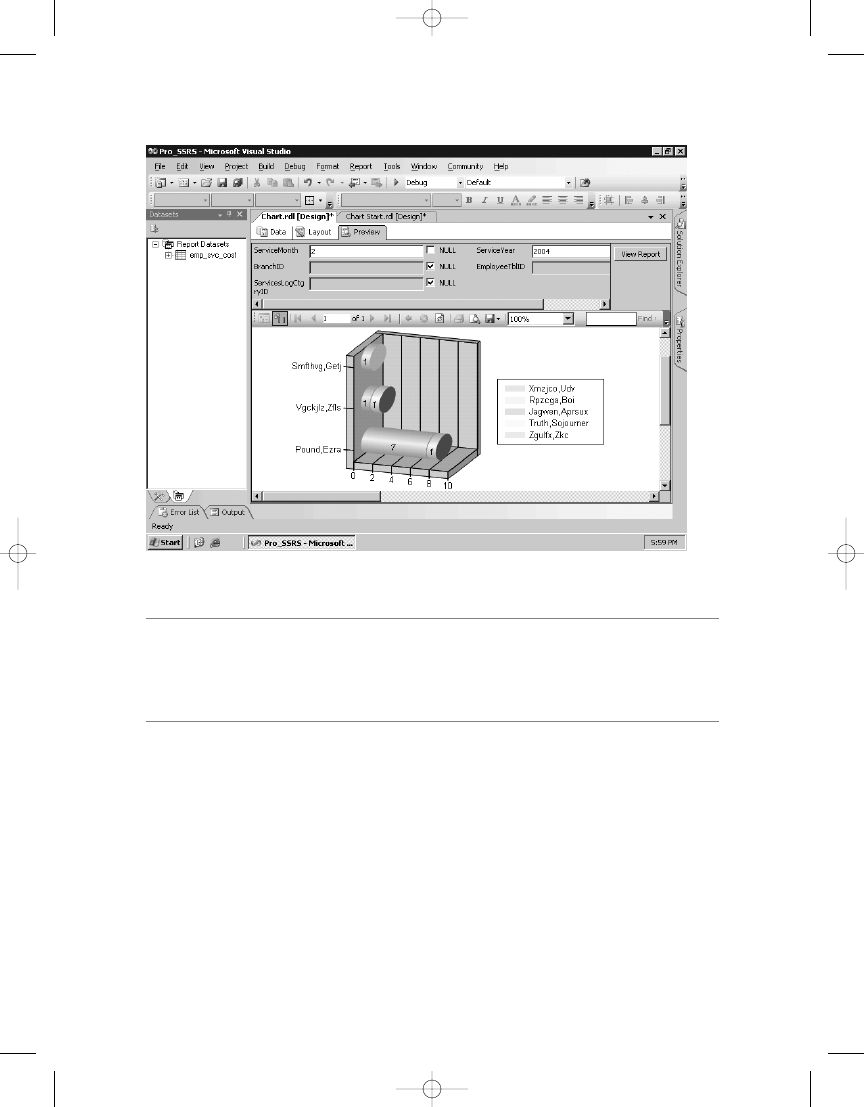
C H A P T E R 3
■
U S I N G T H E R E P O RT D E S I G N E R
72
Figure 3-27.
Chart with custom properties
■
Note
We chose to narrow down the list for visits that happened in 2004. This was intentional, as it lim-
ited the data to an easily viewable amount; otherwise, the chart would have been populated with too many
patients and would appear jumbled. The
Chart Start.rdl
report has a default parameter value of 2004 as
well, so your results will match.
You can see the RDL output for the chart you just created in Listing 3-8.
Listing 3-8.
Chart RDL Sample
<Chart Name="chart1">
<ThreeDProperties>
<Enabled>true</Enabled>
<Rotation>30</Rotation>
<Inclination>20</Inclination>
<Shading>Simple</Shading>
<WallThickness>50</WallThickness>
<DrawingStyle>Cylinder</DrawingStyle>
</ThreeDProperties>
4983ch03.qxd 10/7/05 10:18 AM Page 72

C H A P T E R 3
■
U S I N G T H E R E P O RT D E S I G N E R
73
<Style>
<BackgroundColor>White</BackgroundColor>
</Style>
The completed report for the Chart object is in the Pro_SSRS project and is called
Chart.rdl
.
Implementing a Image
Having images in a report can give it a polished look while extending its value as a resource.
Fortunately, SSRS includes an image tool that can add images from a variety of locations and
supports many standard image formats. Our health-care application stores many images in
a SQL Server database as Binary Large Objects (BLOBs), as part of a patient electronic medical
record (EMR). You can load any type of image into the database and associate it with the patient
using a front-end image retrieval application. Once the image is in the database and tagged to
a patient’s identification number, which is a field in the database, you can use SSRS to display
that image in a report. For this sample, you will continue with the theme of famous author patients
and add their images to a simple report. The starting-point report for the Image report object
is called Image Start.rdl. Since much of the report is constructed using objects you have already
used, the starting point is already laid out with these object included. The dataset that is used
for this report includes demographic information for patients who have their photographs stored
in a database table called DocumentImage in the Pro_SSRS database. You can use the predefined
dataset, called Get_Image, for the Image Start.rdl report, which simply returns patient demo-
graphic information for three patients along with their photos.
Begin by opening the Image Start.rdl report in the Pro_SSRS project and clicking the
Layout tab. Next, select the Image tool from the Toolbox, and click into a blank area of the List
data region that is already set up in this report. As you can see in Figure 3-28, you’re presented
with the Image Wizard when you add the Image tool to the list. You can choose several ways to
retrieve images. For example, you could use an image that you’ve added to the project, or you
could embed the image directly into the report. This option would serve you well if the report
contained a single image that wouldn’t be used again and was intended to be distributed to
a variety of sources that might not have access to the image at any other location. Choose
Database for the source image, and click Next.
4983ch03.qxd 10/7/05 10:18 AM Page 73
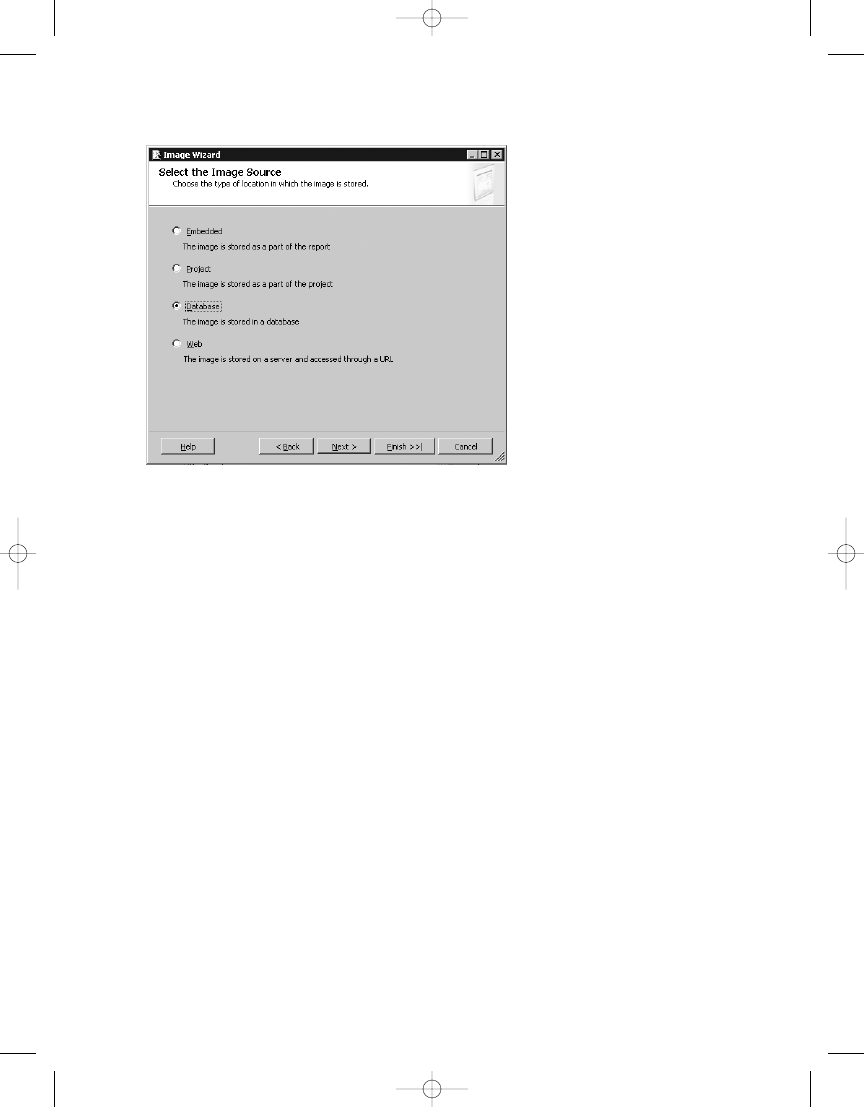
Figure 3-28.
Image Wizard source selection
C H A P T E R 3
■
U S I N G T H E R E P O RT D E S I G N E R
74
The next step of the Image Wizard is to select the dataset from where the image will be
returned. The Get_Image dataset returns images that are associated with each patient. It con-
tains limited fields for the sample, and you’re retrieving only a patient photo to add to the list.
However, if this were a real report, you could use other images that would be standard to
a patient record, such as X-ray images or photos of a patient’s wounds. Even scanned images
of paper documentation or faxes could be stored in the database and effectively added to a full
report. Figure 3-29 shows the selection of the image field and Multipurpose Internet Mail
Extensions (MIME) type, such as BMP or JPEG. The images in this example are stored in JPEG
format.
4983ch03.qxd 10/7/05 10:18 AM Page 74
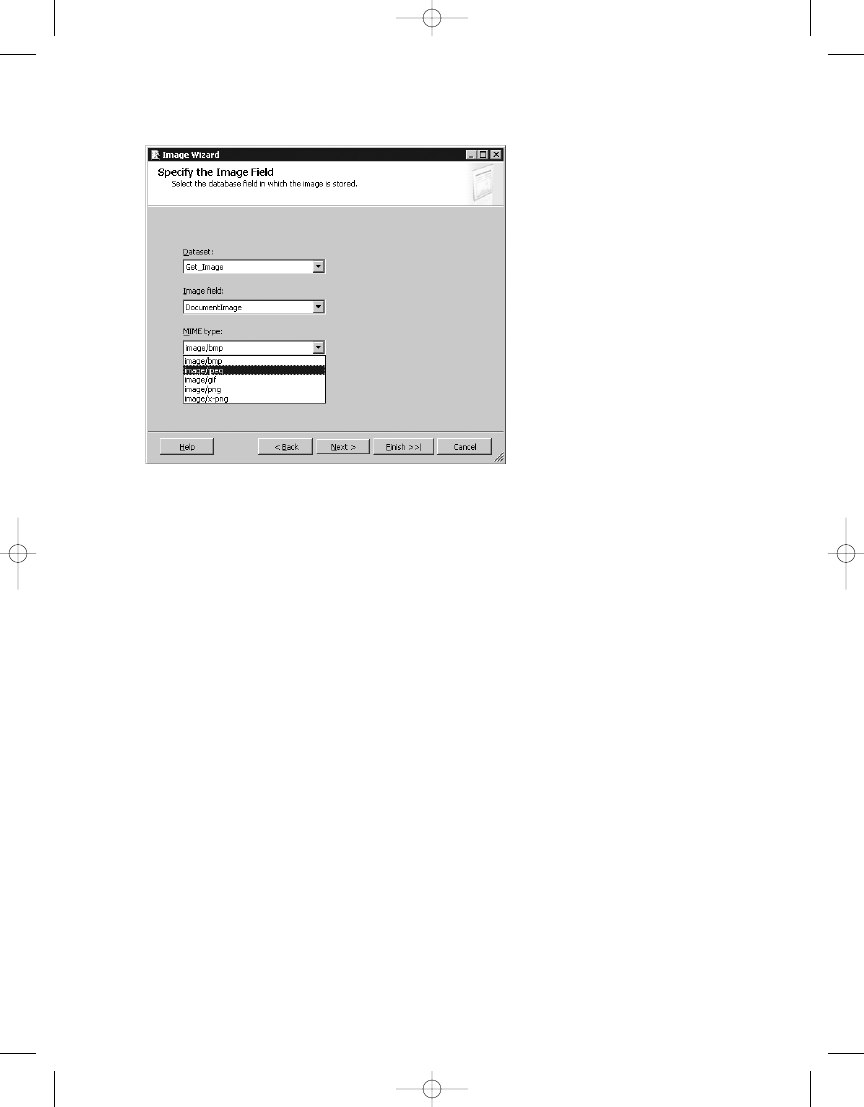
C H A P T E R 3
■
U S I N G T H E R E P O RT D E S I G N E R
75
When you click Finish in the Image Wizard and preview the report, the two photo images
are correctly associated to the patient, as shown in Figure 3-30.
Figure 3-29.
Image field selection
4983ch03.qxd 10/7/05 10:18 AM Page 75
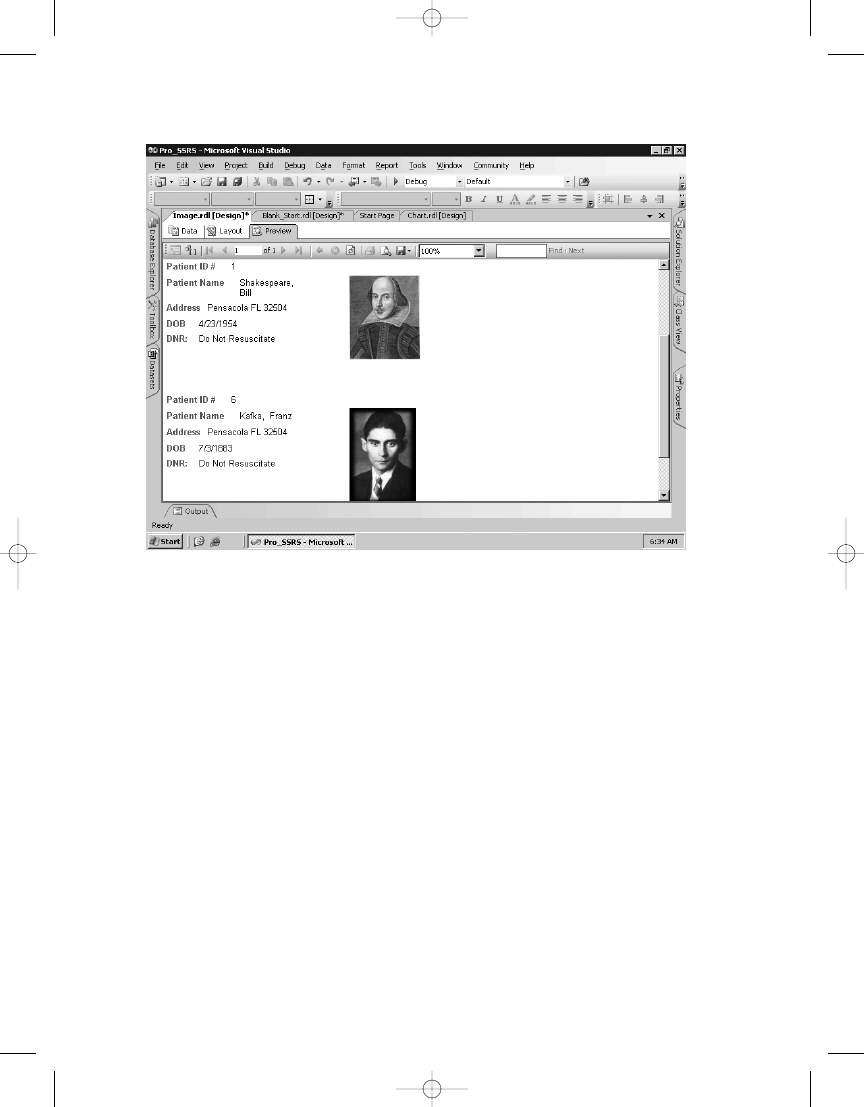
C H A P T E R 3
■
U S I N G T H E R E P O RT D E S I G N E R
76
Figure 3-30.
Preview of report with images
Listing 3-9 shows sample RDL elements for images.
Listing 3-9.
RDL Output for Image
<Image Name="image1">
<ZIndex>10</ZIndex>
<Top>0.375in</Top>
<MIMEType>image/jpeg</MIMEType>
<Height>0.75in</Height>
<Width>0.75in</Width>
<Source>Database</Source>
<Style />
<Value>=Fields!DocumentImage.Value</Value>
<Left>2.875in</Left>
<Sizing>AutoSize</Sizing>
</Image>
The completed Image object report is called Images.rdl and is located in the Pro_SSRS
project.
4983ch03.qxd 10/7/05 10:18 AM Page 76
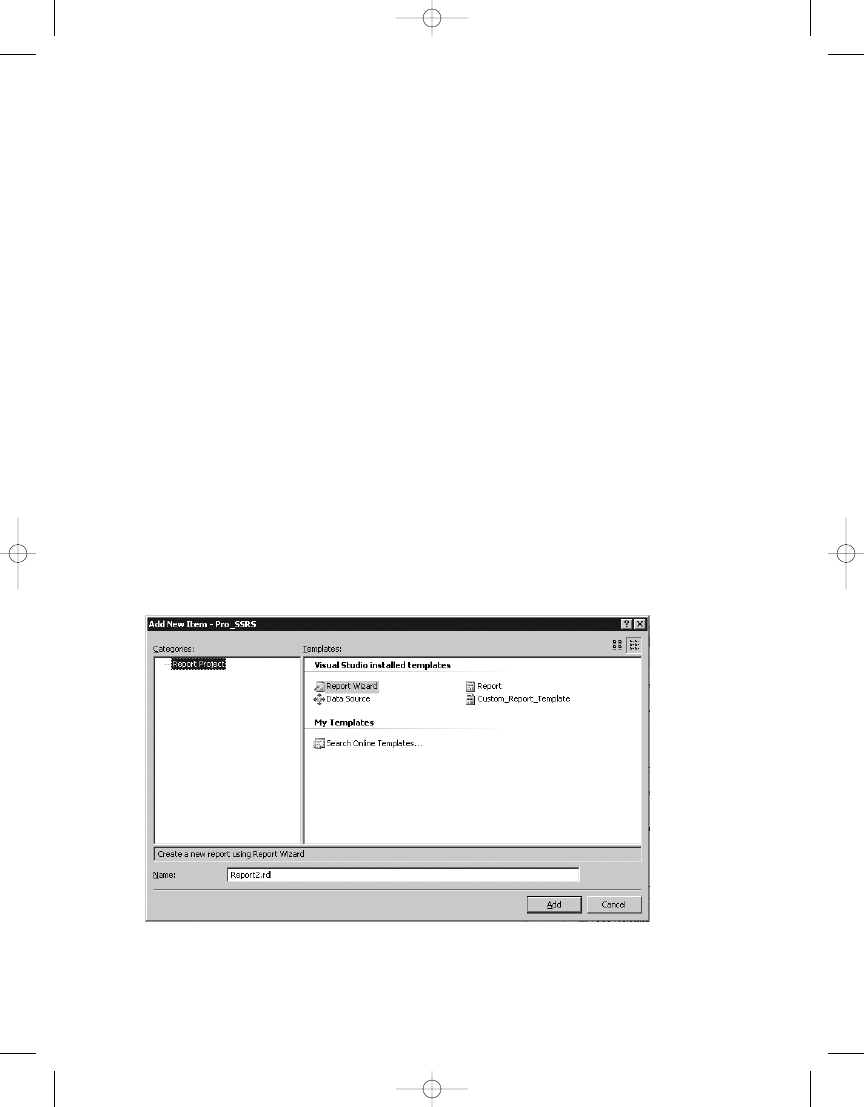
C H A P T E R 3
■
U S I N G T H E R E P O RT D E S I G N E R
77
Implementing Two Simple Report Design Tips
For a version 2 product, SSRS provides invaluable tools that cover most of the bases when
designing distinctive, interactive, and flexible reports. However, a few—we’ll call them desir-
able—features weren’t included in the available versions of SSRS. In this case, we’re referring
to the lack of support for report styles or templates. Though SSRS does include some templates
in the Report Wizard, which we cover in the next chapter, you have no way to select a template
for a blank report. In other words, you need to create every report from scratch from a blank
design, and you need to apply the styles as you build the report. For reports that have a similar
look and feel, this can be repetitive and time-consuming. You can use the following two tips to
add some level of the desired functionality.
Using a Report Template
To address this lack of support, we’ve created our own template reports. These reports are built
to the point of having predefined parameters—which are standard across all the reports—as
well as predefined groupings. Also, you can add any formatting such as standard color patterns
and report titles, defined by a global collection value ReportName, to the template file or files.
Once you create the template files, you can copy or paste them into the project as starting
points for new reports. Or, if you place them in the correct folder, they’re available when the
designer opts to add a new report. Simply by placing the template RDL file into the location
Drive:\Program Files\Microsoft Visual Studio 8\Common7\IDE\PrivateAssemblies\
ProjectItems\ReportProject
when you add a new report to the project, the template file is
available like any other report or wizard. You can see this in Figure 3-31, where the template
file is called Custom_Report_Template.
Figure 3-31.
Report template file selection
4983ch03.qxd 10/7/05 10:18 AM Page 77
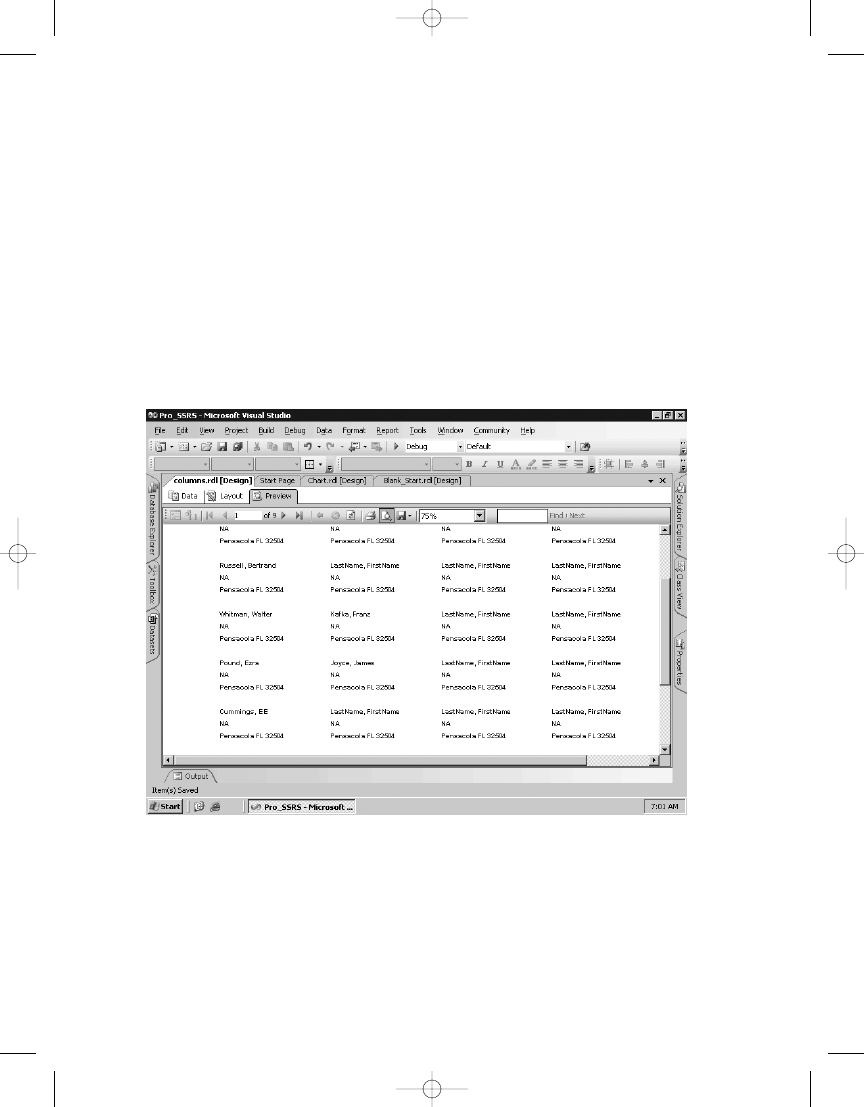
C H A P T E R 3
■
U S I N G T H E R E P O RT D E S I G N E R
78
Figure 3-32.
Multicolumn output for labels
Creating a Multicolumn Report for Printing Labels
The second tip deals with a need that’s similar to styles and templates. Our company has many
reports that produce labels using standard label forms. We noticed that when we began look-
ing at SSRS to deliver this functionality, we happened upon the best way to produce data-driven
labels: using multiple columns. We discussed multiple columns previously when looking at
the Report Properties dialog box. Setting multiple columns for a report forces the data to be
placed on a single multicolumn page. This “snaking” effect is perfect for labels. Figure 3-32
shows the output of a report we created using four columns with a single List data region that
contains patient address labels. The list was sized to be 2 inches by 1 inch, with appropriate
spacing set between the columns. The data shows the familiar author patients with other
patients represented by LastName, FirstName. We’ve modified these name field values in the
database for security reasons; however, these are legitimate individual database fields.
4983ch03.qxd 10/7/05 10:18 AM Page 78

C H A P T E R 3
■
U S I N G T H E R E P O RT D E S I G N E R
79
Summary
In this chapter, we covered a big chunk of the BIDS IDE and the tools you’ll use to build
a reporting solution. You learned that each report consists of defined elements that are based
on a defined schema in the RDL, which gives SSRS the advantage of standardization. We covered
the report objects that make up reports and viewed their properties and functionality. You also
saw for each object how the graphical design components are directly translated to RDL through
the design process. Now that you’re more comfortable with the design environment, you’ll
learn how to use it to design and deploy some real reports. In the next chapter, we’ll show how
to take a step-by-step approach to adding these report items to a report that was designed as
part of an SSRS migration for our health-care application.
4983ch03.qxd 10/7/05 10:18 AM Page 79

4983ch03.qxd 10/7/05 10:18 AM Page 80

Building Reports
I
n the previous chapter, you laid the foundation for your first report by creating a query and
subsequent stored procedure. You also learned about the fundamental elements used to build
reports and are now familiar with the design environment. So, it is time to put all the pieces
together and begin building reports. You can easily apply the concepts in this chapter to any
company that uses SQL Server and relational database systems. This chapter will focus prima-
rily on creating a reporting solution based on data from a SQL Server health-care database; it
will use many of the available report elements in SSRS.
The report you will be creating in this chapter is called the Employee Service Cost report.
This report will utilize the same query and stored procedure, Emp_Svc_Cost, that you have been
working with since Chapter 2 to provide the report data. As a reminder, the query returns detail
records that represent services, such as a skilled nurse or home health aide visit, performed for
patients. Each type of service has an associated cost for the health-care company. This report,
when complete, will show important cost points based on associated data provided by the
query, such as the patient’s diagnosis, the employees who performed the services, the date of
each service, and the branch location of the patient. By grouping and sorting the report at
these cost points, the user will be able to see the cost of services from the individual patient all
the way up to the branch location, which might serve hundreds of patients. You will group and
calculate the cost amount at each level.
Specifically, in the following sections, you will create the Employee Service Cost report
initially with the Report Wizard, which produces a report based on predefined selections, and
then from scratch. We will show the process of using the wizard for demonstration purposes
only and therefore will not continue with the report that it produces. For the report you build
from scratch, you will add all the features that the Report Wizard can add plus much more. The
following list highlights the design goals for the Employee Service Cost report:
• Step through adding a base report that uses the Table data region based on the dataset
you defined for the Emp_Svc_Cost query.
• Add several basic formatting elements to the report.
• Add interactivity to the report with document mapping, visibility, hyperlink actions, and
interactive sorting, which is a new feature of SSRS for SQL Server 2005. Both document
mapping and hyperlink actions allow the user to navigate to defined locations either
within the report or outside the report, such as a Web site. In this chapter, you will use
visibility properties within your report to expand and collapse report items from sum-
mary to detail. Interactive sorting gives an SSRS report versatility by allowing it to be sorted,
in much the same way Microsoft Outlook allows sorting by clicking column headers.
81
C H A P T E R 4
■ ■ ■
4983ch04.qxd 10/7/05 11:06 AM Page 81

C H A P T E R 4
■
B U I L D I N G R E P O RT S
82
• Add parameters to the report automatically by changing the dataset from a query to
a parameterized stored procedure. You will also add other datasets to populate the
parameters defined by the stored procedure.
• Learn how to use multivalued parameters using a modified stored procedure and UDF.
• Add a filter to the Table data region to show only service types that are visits.
• Add a Chart data region for the top ten diagnoses to the report.
• Add the final touches to the report, such as a page header and footer, title, and page
numbers.
In addition, as you begin to work more closely with report and query parameters, you
will learn how to use a new feature of SSRS for SQL Server 2005: multivalued parameters. As
mentioned in previous chapters, multivalued parameters require special consideration when
designing the underlying query, so in this chapter you will use a modified version of your stored
procedure that takes advantage of a UDF; this will teach you how to best utilize this new and
much anticipated feature.
In the preceding chapters, we covered the steps for creating the solution, project, and data
source that your report will use, so we will not cover these steps again here. We will, however,
show how to use the same data source properties to connect to the health-care database where
the data for your report resides. The same database also contains the stored procedure you
created in Chapter 2, Emp_Svc_Cost, that you will use later in this chapter.
Creating a Report with the Report Wizard
In many scenarios, the Report Wizard is a fast method for creating a basic report that can be
further enhanced before deployment. The Report Wizard is suitable for reports that are pri-
marily data listings that do not require much special formatting. In this section, you will step
through the Report Wizard to create the Employee Service Cost report before designing the
same report manually.
To open the Report Wizard in your report project, right-click the Reports folder in the
Solution Explorer and select Add New Report. The first wizard screen defines the data source.
For this example, check New Data Source; however, you also have the choice to use a shared
data source that has already been defined as part of the project. Supply the same data source
information as you did in the previous chapter to connect to the health-care database. The
connection string should look similar to the following:
Data Source=localhost;Initial Catalog=Pro_SSRS
The next screen in the wizard defines the query. Paste the query you created in Chapter 2
into the Query String area (see Figure 4-1). You can open this query from the Query folder in the
code download for the book. The file is called Report_Wizard_Query.sql. Clicking the Query
Builder button launches the graphical query designer.
4983ch04.qxd 10/7/05 11:06 AM Page 82
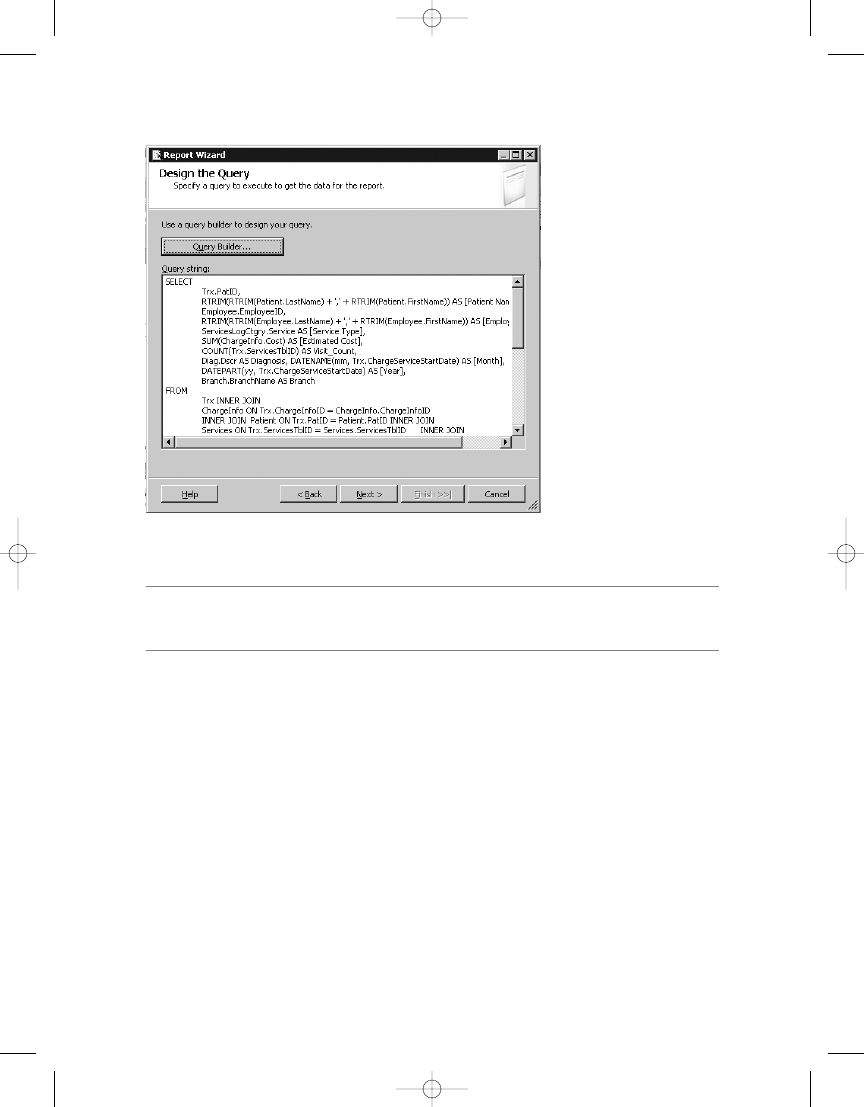
C H A P T E R 4
■
B U I L D I N G R E P O RT S
83
Figure 4-1.
Pasting the query in the Query String area
■
Note
The query designer in the Report Wizard does not support stored procedures or other nonstandard
SQL queries, such as LDAP, which you will use later in this chapter.
The next screen of the Report Wizard asks whether the report should be in tabular or
matrix form. Selecting Tabular will trigger the wizard to provide grouping information on the
next screen; selecting Matrix will provide a similar screen for rows and columns instead of
groups. For this example, select Tabular then click Next and choose the grouping and detail
layout to show Year as the primary group, with Month, EmployeeClassID, and Employee_Name
next. For details, you want to see the patient-specific information—Diagnosis, Visit_Count,
Estimated_Cost
, and Service_Type—as shown in Figure 4-2.
4983ch04.qxd 10/7/05 11:06 AM Page 83
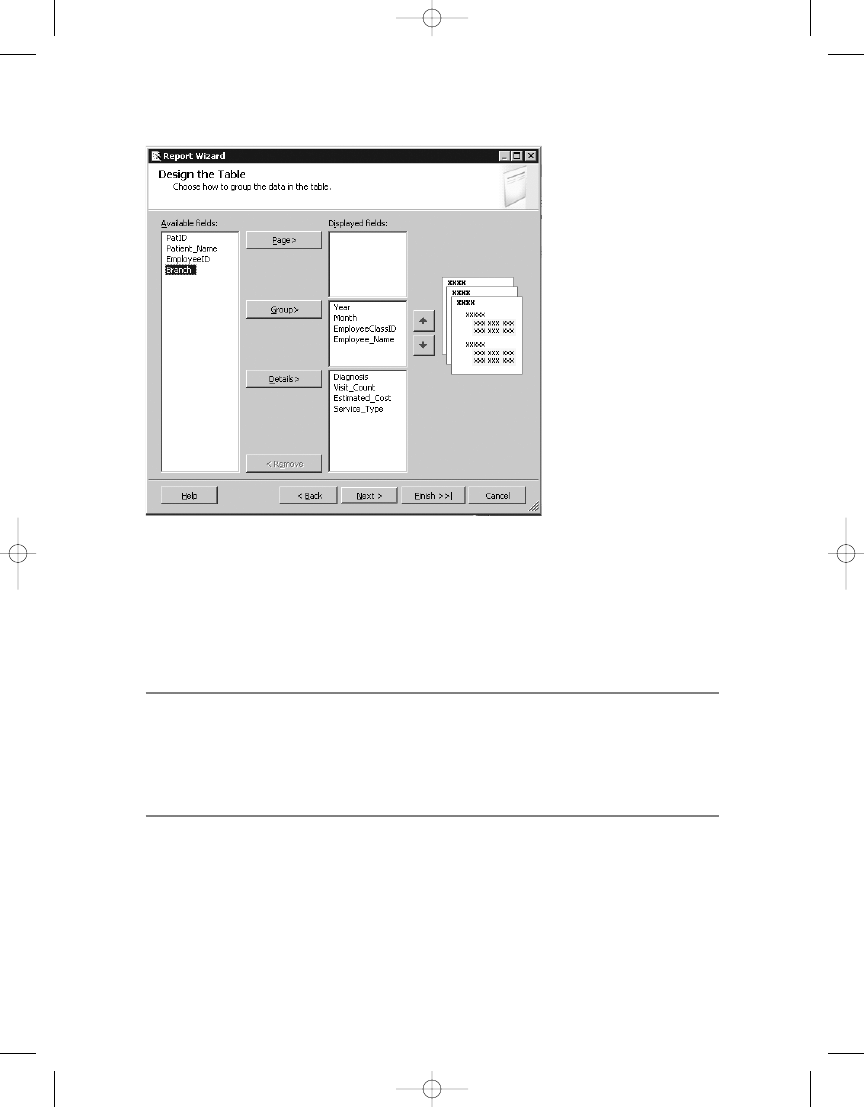
C H A P T E R 4
■
B U I L D I N G R E P O RT S
84
Once you have grouped the data that will be in the report, the next two screens are primarily
for formatting. Here you can specify whether you want the report to have a stepped or block
layout, as well as whether the report will include subtotals and provide drill-down functionality.
You can also choose a custom style for the report.
■
Tip
You might notice that the wizard is similar in appearance to the one provided for Microsoft Access.
Access and SSRS share many of the same features, and the Access report format is currently the only sup-
ported format that can be automatically converted to RDL. A caveat exists, though, when converting: any
Visual Basic for Applications (VBA) code you have written in Access will not migrate to SSRS. You will have to
rewrite that functionality.
For now, choose Stepped with No Drill-Down Functionality, apply the Corporate style to
the report, click Next in the wizard, and change the name from the default, ReportX, where
X is the next number in sequence of created reports, to Employee Cost Report. Next, check the
Preview Report box, and then click Finish. After a few moments, the resultant report appears.
Though at first glance it appears to need many cosmetic changes, such as extending the size
of the several columns such as Employee Name and Diagnosis and formatting the Estimated
Cost column for currency, the report is at least functional. It would need a good deal of work
to get it the way you want, and assuming you accepted one of the default styles, this would be
igure 4-3.
Figure 4-2.
Report Wizard group and details selections
4983ch04.qxd 10/7/05 11:06 AM Page 84
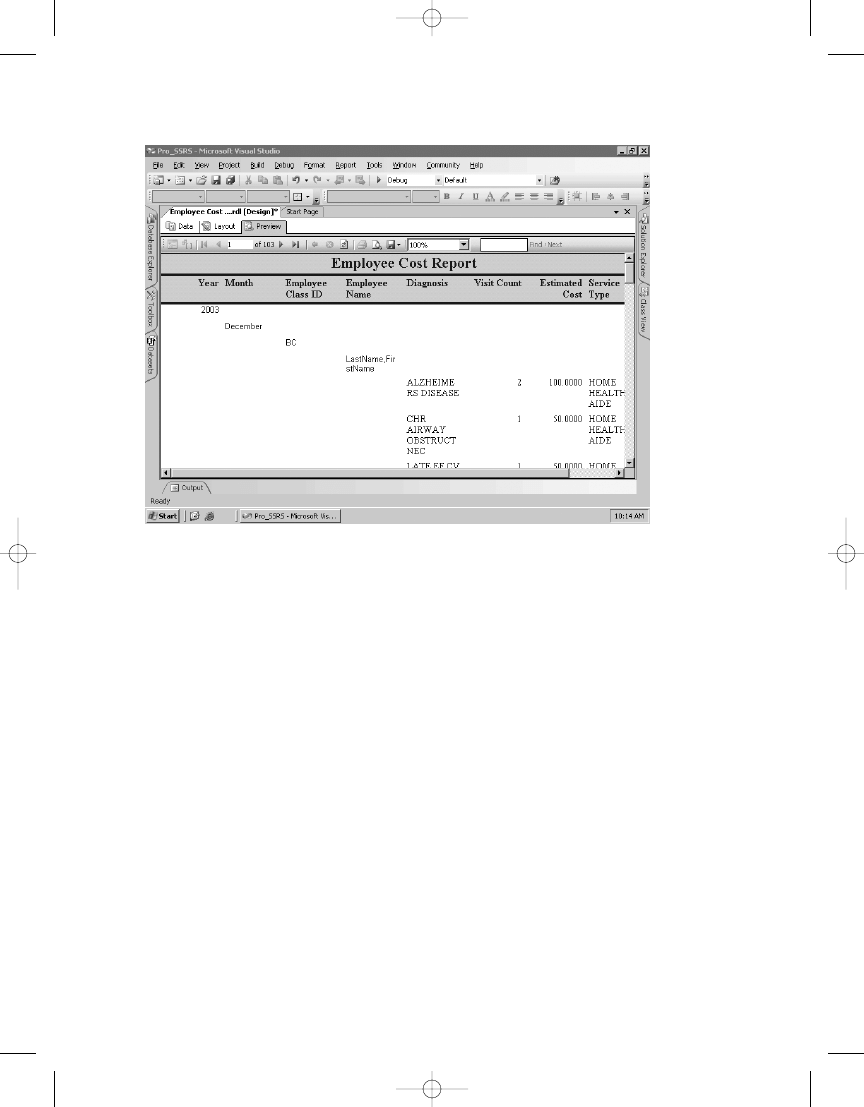
C H A P T E R 4
■
B U I L D I N G R E P O RT S
85
To fully take advantage of the flexibility of SSRS and the report design environment of
BIDS, let’s create the same report from scratch.
Building Reports from Scratch
When working with a blank report, the first decision will be to choose which data regions to
use in the body of the report. This decision is driven mostly by the type of data you are work-
ing with and by the report audience. For example, a chief executive officer (CEO) might not be
concerned with details, preferring to see summary information about the status of the business
products and services, and therefore would be more inclined to view a matrix report with
column and row totals. However, in the initial report, you will be working with the Table data
region because you want to show the interrelationships between patients and employees with
multiple groupings in tabular rows, not columns.
In this section, you will follow specific steps to get your report to a basic starting point by
adding a Table data region, and then you will continue to add formatting and functionality.
When you are finished, the report will contain many SSRS features, including interactive drill-
down and navigation links, custom formatting, interactive sorting, populated drop-down
parameters, and a chart that displays the top ten diagnoses by cost. You will finish the report
by adding several design touches, such as page numbers and execution times. You will also
examine how to modify the report to work with multivalue parameters.
Figure 4-3.
Report generated from the Report Wizard
4983ch04.qxd 10/7/05 11:06 AM Page 85

For this project, you will add a new report from the Solution Explorer and create
a dataset that uses the same query from the previous section of this chapter for the Report
Wizard. For ease, we have included the starting-point report in the Pro_SSRS project. The
EmployeeServiceCost_Start
report already has the datasets and initial query defined for the
localhost
SQL Server, which should match your environment. You will begin by using just
the basic query and not the stored procedure. The dataset you will use to begin with in the
EmployeeServiceCost_Start
report is called Emp_Svc_Cost. Later in the “Setting Report Parameters
with Stored Procedures” section, you will modify the dataset to use the stored procedure and
see how the parameters defined in the stored procedure will automatically create the report
parameters.
In the following sections, you will go through several steps to add functionality to a single
report. The steps are provided so that you can walk through the process of building the report,
starting with the EmployeeServiceCost_Start report; however, at several intervals, you may
choose to open one of the several sample reports that reflect the completed steps. If a report is
available, we will point it out in the text.
With the EmployeeServiceCost_Start report open in BIDS, move to the Layout tab. The
following steps get you to your starting point in the report, where you will begin to apply more
advanced formatting and logic:
1.
Drag the Table report element to a blank section of the design grid.
2.
Right-click the center table column, and select Insert Column to the Right.
3.
Drag the last three fields—Employee_Name, Estimated_Cost, and Visit_Count—to the
three last three columns on the detail row in the order listed. Notice that the column
headings—Employee Name, Estimated Cost, and Visit Count—were automatically
created for you for each field dragged to the detail row. You will leave these here for
now and add formatting in the following sections.
4.
Edit the Visit_Count and Estimated_Cost field expressions to be sums, as in
=Sum(Fields!Estimated_Cost.Value)
.
5.
Right-click the detail row, and select Insert Group.
6.
In the Group On ➤ Expression drop-down list, select =Fields!Diagnosis.Value. Uncheck
the Group Footer checkbox for the Diagnosis group. Enter Diagnosis for the group
name, and select OK. Drag the field Diagnosis into the first column of the new Diagnosis
group header.
7.
Perform steps 5 and 6 for ServiceType and PatientName, replacing the Group On
expression with their respective field values for step 6, =Fields!Service_Type.Value
and =Fields!Patient_Name.Value. Enter ServiceType and PatientName for the respec-
tive group names, uncheck Group Footer, and click OK. Drag the respective fields
Service_Type
and Patient_Name into the first column of each of the groups you just created.
8.
Right-click the detail row, and select Edit Group. In the Group On drop-down list,
select =Fields!Employee_Name.Value.
After these eight steps, the report is starting to take form, as you can see in the preview.
Though not yet aesthetically appealing, it displays the data in the appropriate, hard-fixed
groupings and is tabulated so that it is easy to discern the detailed service information, such
igure 4-4).
C H A P T E R 4
■
B U I L D I N G R E P O RT S
86
4983ch04.qxd 10/7/05 11:06 AM Page 86
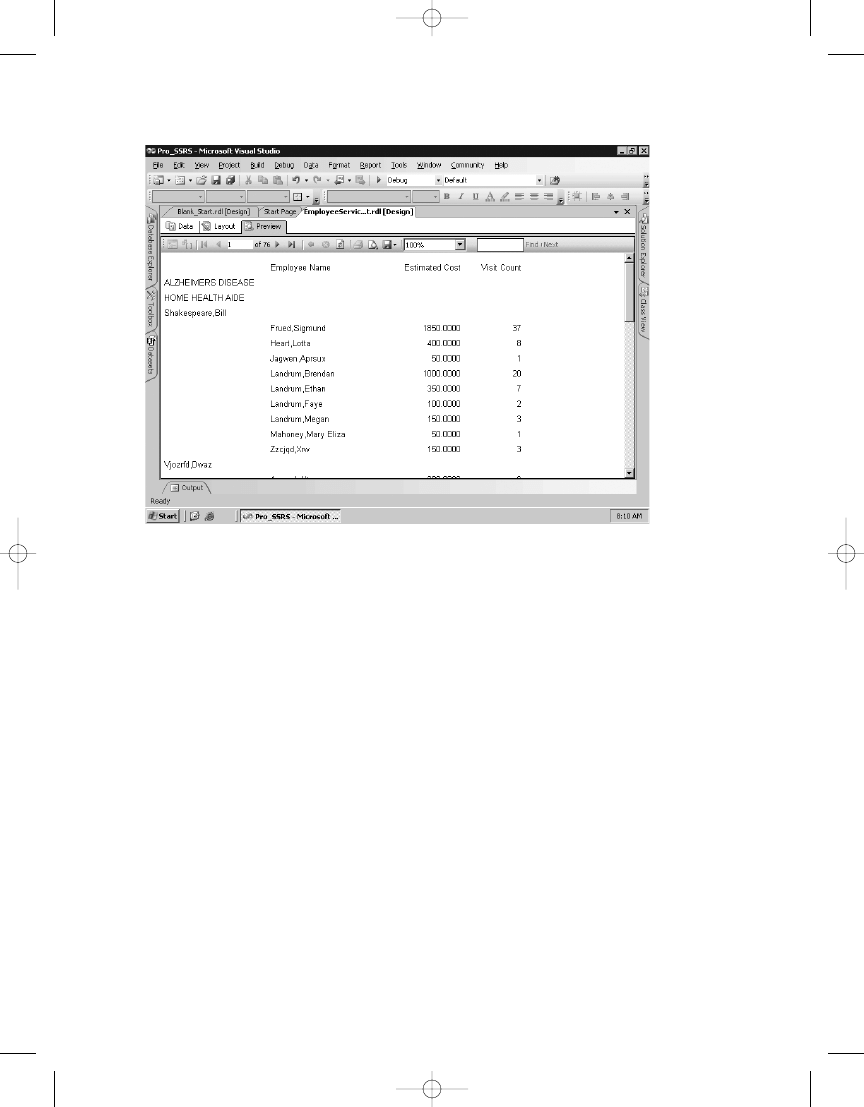
C H A P T E R 4
■
B U I L D I N G R E P O RT S
87
Formatting the Output
You can modify several quick and easy report properties to add a more professional look and
feel to the report:
• Border Style
• Format
• Padding
By using the Shift or Control key, or by clicking and dragging the mouse, it is easy to apply
report properties to many cells simultaneously. For the Employee Name, Estimated Cost, and
Service Count header cells, you will add a border to the bottom, separating the record header
from the actual data. First, highlight the three header column cells by holding down the Control
key and clicking each cell. Next, open or expand the Properties window. The Properties window
contains a Border Style property for each area of the selected cells—top, bottom, left, and right.
For this example, select Solid for the bottom border.
With the Properties window still open, click the Estimated Cost detail row cell. Format the
cell in the Properties window to be currency by adding the formatting command C0 for the
Format
property.
Two of the groups inside the report, Service Type and Patient, would be more distinguish-
able if they were indented. You can select each group cell individually and in the Properties
window modify the Padding property from the default of 2 points to 10 points for Service Type
Figure 4-4.
Employee Service Cost report details and groups
4983ch04.qxd 10/7/05 11:06 AM Page 87
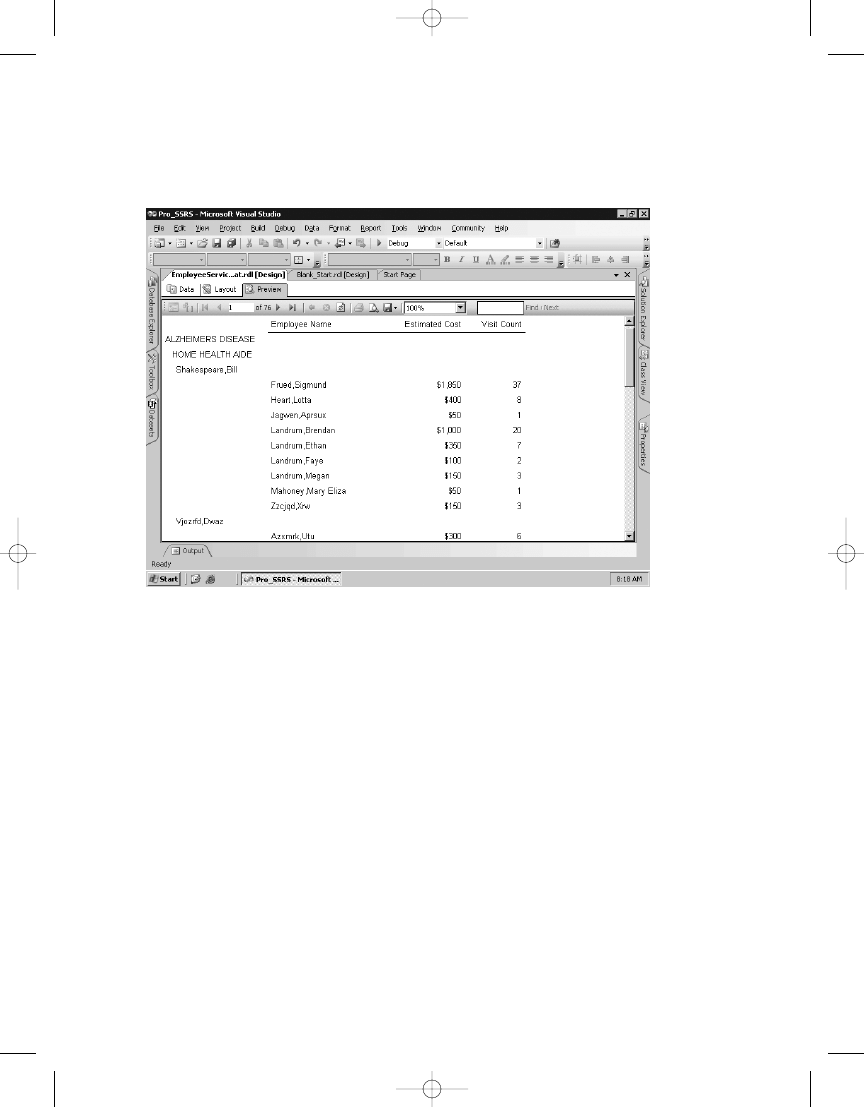
C H A P T E R 4
■
B U I L D I N G R E P O RT S
88
After you apply the formatting, you can immediately see how these changes affect the
output by clicking the Preview tab (see Figure 4-5).
The EmployeeServiceCost_Format.rdl report in the Pro_SSRS project has the three format-
ting elements applied.
Adding Subtotals
Having subtotals at each grouping level makes the report much easier to read for the user.
This is especially true if the report will have interactive drill-down features, as yours will have.
Adding subtotals to the groups is as easy as dragging the fields that will be summed to the
appropriate position in the table. When fields are dragged into a grouped row, the Sum function
is automatically applied to the field expression, as in =Sum(Fields!Diagnosis.Value). The same
applies to the detail row if any detail grouping is defined. For this report, you have defined
a group for the Employee_Name field in the detail row. This forces the report to calculate the
sums of the Estimated_Cost and Visit_Count fields for each employee. For this report, this is
all that is required, but for many other reports you will be creating, you will need to include
the detail records for a more granular analysis.
In preparation for adding interactivity to the report, you will sum the Estimated_Cost and
Visit_Count
fields at all grouping levels by dragging the two fields to the Estimated Cost and Visit
Count locations in each group heading row—in this case, for Diagnosis, Service Type, and
ouping, in this case the Diagnosis field, bold
Figure 4-5.
Report output with formatting
4983ch04.qxd 10/7/05 11:06 AM Page 88
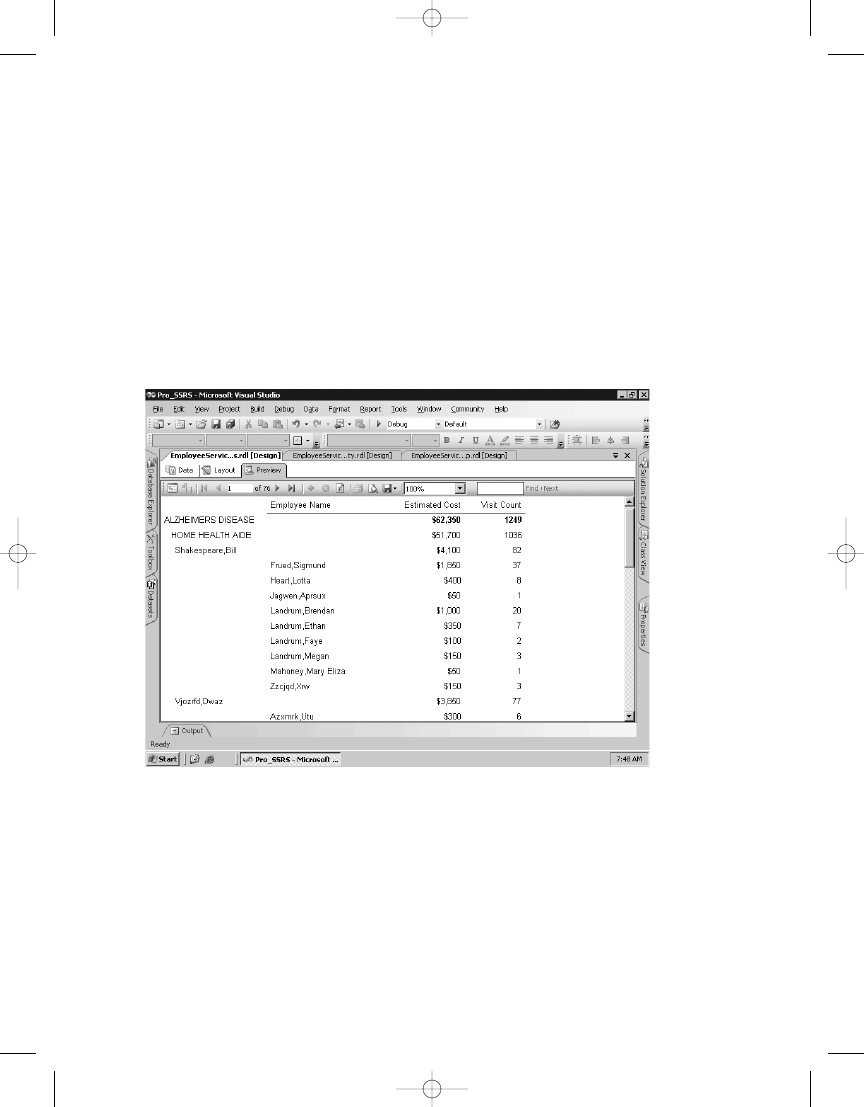
C H A P T E R 4
■
B U I L D I N G R E P O RT S
89
by holding the Control key and clicking to highlight each of the Estimated Cost and Visit Count
values in the Diagnosis group and then clicking the Bold button on the toolbar. With the bold
formatting applied, the summed values at the group level will be easy to distinguish from the
detail row values. You should also format the Estimated_Cost field to be currency as you did
previously for the detail row.
The output of the report, which you can see by selecting the Preview tab, has much more
valuable information now for each grouping. For Alzheimer’s disease, for example, you can now
see that there were 1,249 services for a total estimated cost of $62,350, and the bold formatting
helps visually separate the values. The patient Bill Shakespeare (whose name is indented because
of the padding you applied to the Patient group) is an Alzheimer’s patient and has had 82 of
the 1,036 home health aide visits. You can further see each employee’s visit count and the cost
for this patient in the detail rows (see Figure 4-6).
The EmployeeServiceCost_Subtotals.rdl report in the Pro_SSRS project includes subtotals.
Adding Interactivity
Regardless of the audience for a particular report—whether it is a decision maker interested in
on-screen summarized data or a knowledge worker who needs the ability to print reports—
interactivity within the report makes navigating to specific information easier and more efficient.
You can provide interactivity within an SSRS report in several ways. You will be working with
Figure 4-6.
Report with grouping level subtotals
4983ch04.qxd 10/7/05 11:06 AM Page 89

C H A P T E R 4
■
B U I L D I N G R E P O RT S
90
• Document mapping: Provides a navigation pane within the report with values based on
a field or grouping.
• Visibility: Adds interactivity to a report by hiding and showing report items based on
user input.
• Interactive sorting: This is a new feature of SSRS for SQL Server 2005 that allows users to
interactively select how the report data will be sorted.
• Hyperlink actions: Allows the user to click a report item that is linked to a location within
the same report or external to the report.
The different rendering formats provided with SSRS, which are covered in detail in Chapter 5,
accommodate viewing and printing reports to meet the needs of different types of workers.
However, this produces a limitation in that some of the functionality of one rendering format
is not available in other formats. This is most evident when working with interactivity, as you
will see in the “Interactive Sorting” section.
Document Mapping
Creating a document map in an SSRS report will present users with an integrated navigation
pane when the report is rendered. The user can select an item in the navigation pane, which
will cause the report to jump to the position where that item is located. In the example report,
for instance, a user might be interested in viewing information about Alzheimer’s patients. You
can create a document map for the Diagnosis group in the report so that when the user selects
Alzheimer’s from the navigation pane, the report will automatically skip to that section; in other
words, the user will not have to manually search through the report to find the desired informa-
tion. You can also add document maps at multiple levels, creating a hierarchical selection in
the navigation pane. Keeping with the example, you can add a document map to the Service_Type
group in addition to the Diagnosis group; the user can then expand Alzheimer’s in the naviga-
tion pane to see all the types of services—home health aide, for example—that have been
performed for each diagnosis.
You create document maps by adding an expression to the Document Map Label property
available for individual report items or for groups. By following these steps, you will add a doc-
ument map label to the Service_Type and Diagnosis groups:
1.
On the Layout tab, right-click the entire row for the second-level grouping, which is the
Service_Type group, and select Edit Group.
2.
On the General tab of the Grouping and Sorting properties dialog box, select
=Fields!Service_Type.Value
in the Document Map Label drop-down list and click OK.
3.
Complete steps 1 and 2 for the Diagnosis group, which is the first-level grouping above
Service_Type. Select =Fields!Diagnosis.Value for the Document Map Label option.
Now when you preview the report, the navigation pane will automatically be displayed on
the left side of the report. The preview, which is in HTML by default, displays in one of the ren-
dering formats that supports document mapping, such as PDF (see Figure 4-7).
4983ch04.qxd 10/7/05 11:06 AM Page 90
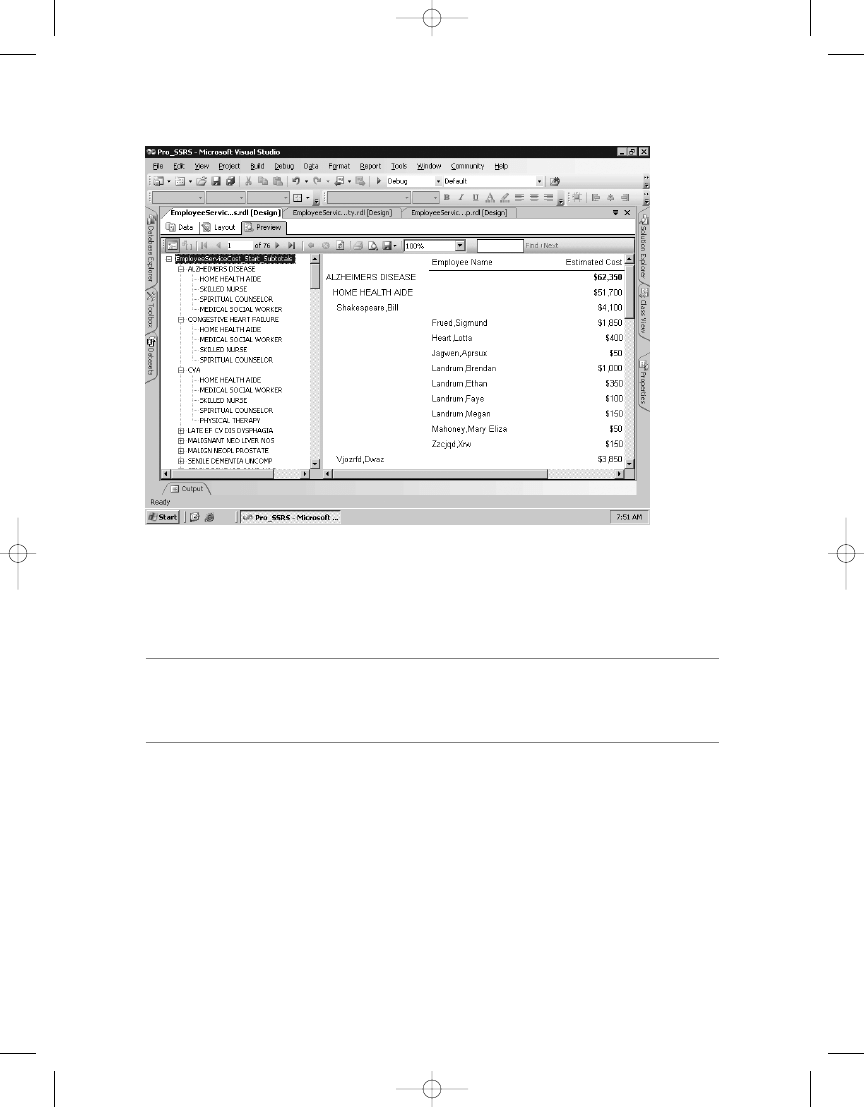
C H A P T E R 4
■
B U I L D I N G R E P O RT S
91
The EmployeeServiceCost_DocumentMap.rdl report in the Pro_SSRS project includes
a document map.
■
Note
Adobe Acrobat views document mapping as bookmarks when the report is rendered in PDF. Bookmarks
in SSRS perform a different function altogether. They are embedded within the report, and report items are
assigned bookmark links.
Visibility
Another feature of SSRS is the ability to show or hide areas of the rendered report based on
user input. Often users want to see only summary information on a report but be able to drill
into the summary data to see the detail information if necessary. Report designers might make
two reports, a summary and a detail report, which have to be updated and maintained sepa-
rately. The reports are often based on the same query. Fortunately, SSRS’s ability to show or
hide report data does away with the need to create separate reports. The visibility properties
for report items control showing and hiding report items.
Let’s assume you have distributed your report to your intended audience, and they have
come back with “suggestions” for how to improve the report—this is real-world reporting, after
all. They indicate they would like to see the following:
Figure 4-7.
Report with navigation pane from document map
4983ch04.qxd 10/7/05 11:06 AM Page 91

C H A P T E R 4
■
B U I L D I N G R E P O RT S
92
• Summary totals for the visit count and the estimated cost of each diagnosis when
the report is first rendered, but with the ability to drill to the detail of the patient and
employee if warranted
• The number of patients who have a specific diagnosis
• The number of individual employees who have provided care for these patients
With SSRS this is fairly straightforward, and you can knock out an improved report quickly.
You just need to follow these design steps before modifying the visibility properties:
1.
On the Layout tab, right-click the entire Employee Name column, and select Insert
Column to the Right.
2.
Highlight and delete the Employee Name column header text. With the drill-down feature
you will be adding with visibility properties, this column header will no longer be needed.
3.
Enter Employee Count and Patient Count as the new column header text in the second
and third columns, respectively.
4.
Resize the second and third columns in the table from right to left so that they are
approximately 1 inch each.
5.
Highlight every cell in the Service Type, Patient Name, and Details rows. You can
accomplish this by holding down the Control key and clicking the row marker to the
left of the first column in the table. Once all the rows are highlighted, select an 8-point
font size from the formatting toolbar.
You can control the visibility state of report items, hidden or visible, by setting visibility prop-
erty values. You can hide report items at any level in the report and toggle their visibility property
values when a user clicks the + or – icon to show or hide them. The toggle point of the hidden
items is another report level, such as a group. In this example, you would like to hide every
level except the Diagnosis and Service_Type fields but give the user the ability to show or hide
the details. To begin, hide every group except Diagnosis and Service_Type. The steps to
accomplish this are as follows:
1.
Right-click the detail row icon, and select Edit Group.
2.
On the Visibility tab, select Hidden.
3.
Check Visibility Can Be Toggled by Another Report Item.
4.
In the Report Item drop-down list, select Patient_Name. If Patient_Name is not displayed
in the drop-down list, you may have to type it in.
5.
Perform steps 1 through 4 for the Patient group, selecting or typing Service_Type as
the toggle report item.
The other two requests were to be able to see the patient and employee totals for each
diagnosis. You can add an expression, CountDistinct, to the report that will count each unique
patient and employee and calculate the amounts at the diagnosis level. The syntax used for the
patient count is as follows:
=CountDistinct(Fields!FieldName.Value)
4983ch04.qxd 10/7/05 11:06 AM Page 92
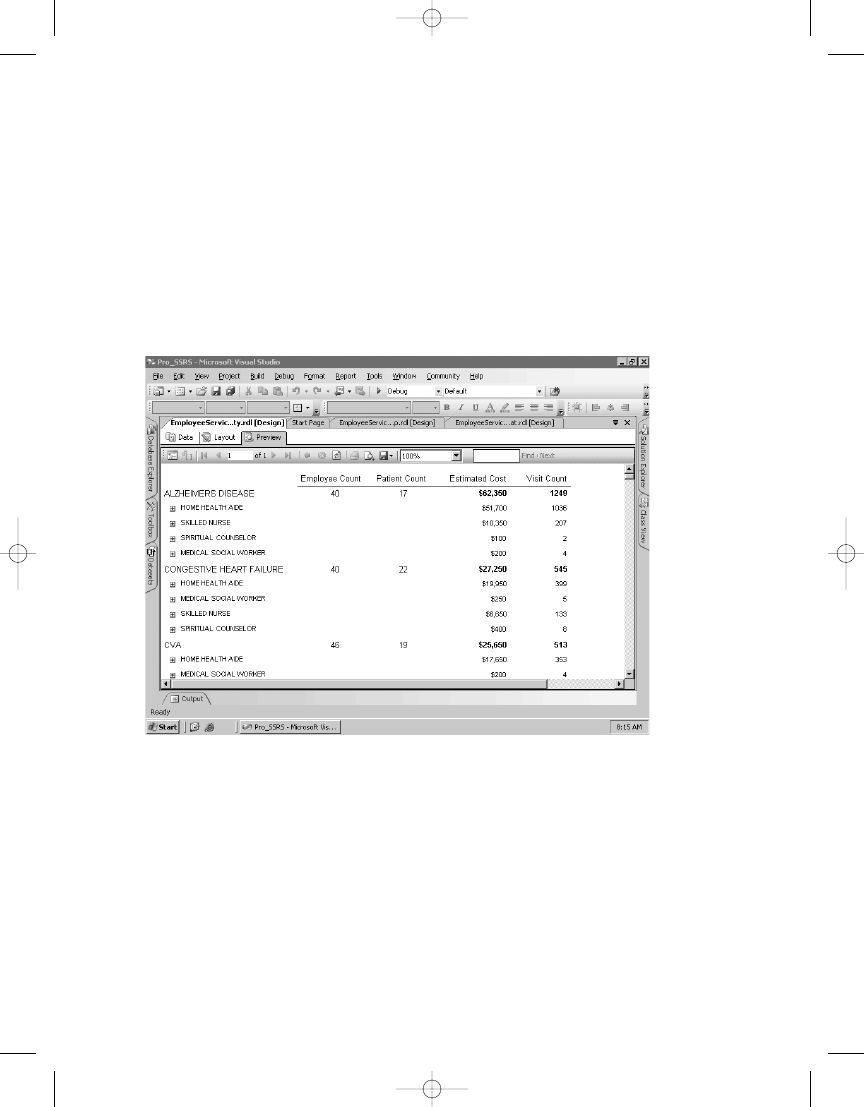
C H A P T E R 4
■
B U I L D I N G R E P O RT S
93
By adding the CountDistinct expression for the field PatID (which you know to be unique
per patient) as well as for the field EmployeeID, it will be much easier to see at a glance how
many patients with a specific diagnosis have been cared for.
Place the following two expressions for the Diagnosis group in the cells just below the
Employee Count and Patient Count header cells:
=CountDistinct(Fields!EmployeeID.Value)
=CountDistinct(Fields!PatID.Value)
Though the report is still similar to the noninteractive report, with the drill-down additions
it will look much different when previewed (see Figure 4-8).
The EmployeeServiceCost_Visibility.rdl report in the Pro_SSRS project includes the visi-
bility properties.
Interactive Sorting
It never fails when deploying a report to a large audience: someone will ask that the report
be sorted in a certain way that usually differs from the way it was originally designed. When
this scenario happens, typically the report designer is torn between creating a second, almost
identical report with custom sorting to appease the requestor and placing the request in queue
for a future enhancement to the report. A new feature of SSRS for SQL Server 2005, interactive
sorting, alleviates this need and allows users to sort the report at runtime on any number of
.
Figure 4-8.
Report with interactive drill-down
4983ch04.qxd 10/7/05 11:06 AM Page 93
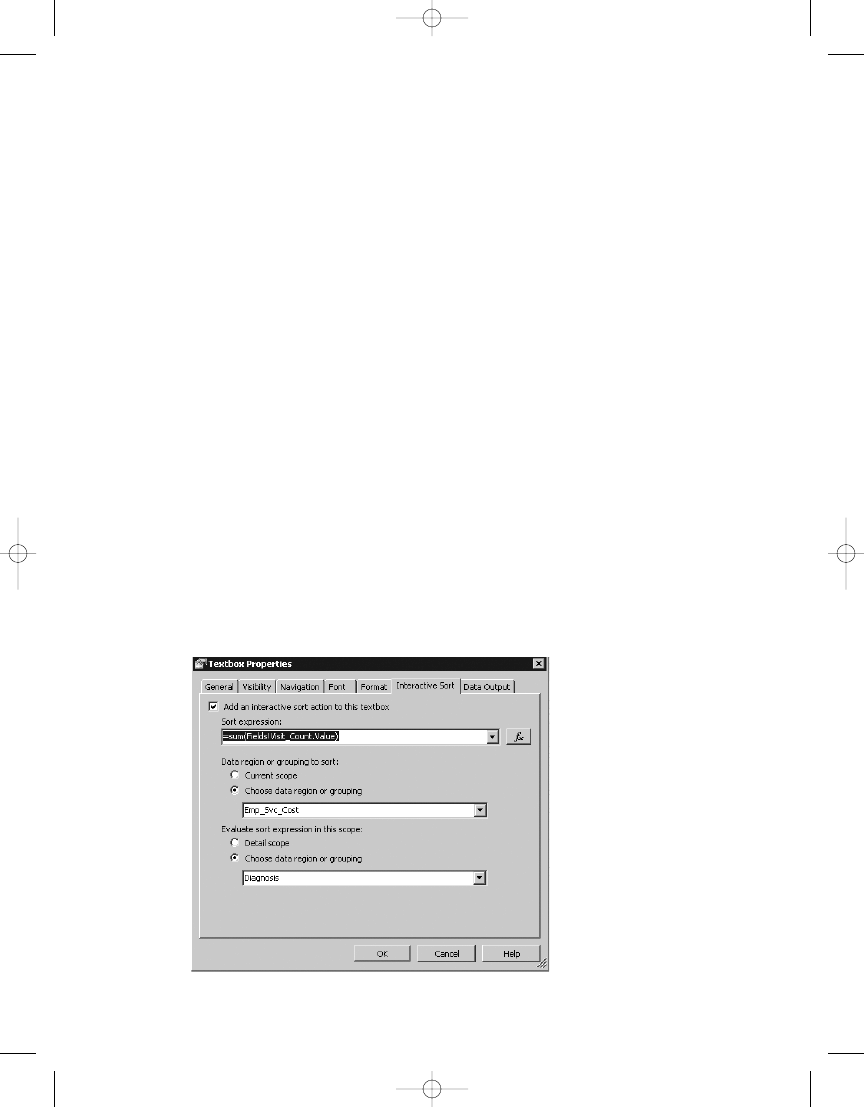
C H A P T E R 4
■
B U I L D I N G R E P O RT S
94
In the sample report, you know that you have a broad audience that may use this report
for different purposes. A chief financial officer (CFO), for example, may want to view the report
to see which diagnosis has the most number of visits, while another user may need to under-
stand how many patients have a certain diagnosis and would like the report sorted by patient
count and not visit count. In this section, you will add interactive sorting to the report to meet
these two needs, knowing that it is possible to sort the report in any other criteria if it is requested
without having to create additional reports based on a user subdivision.
Since you know that the interactive sorting you will apply to your report will be patient
count and not visit count, all you have to do is add this criteria to each of the textboxes where
the users will click to change the sorting based on their needs. Add the interactive sorting to
the Patient Count and Visit Count header cells by following these steps:
1.
On the Layout tab, right-click the Patient Count header textbox, and select Properties.
Click the Interactive Sort tab.
2.
Check the Add an Interactive Sort Action to This Textbox box.
3.
In the sort expression, type =CountDistinct(Fields!PatID.Value).
4.
For the Data Region or Grouping to Sort area, select Choose Data Region or Grouping,
and select Emp_Svc_Cost in the drop-down list.
5.
In the Evaluate Sort Expression in this Scope area, select Choose Data Region or Grouping
Diagnosis in the drop-down list, and click OK. This tells the sort to count all the distinct
patient IDs and sort this at the data level. The expression will be evaluated in the Diagnosis
group.
6.
Right-click the Visit Count header cell, and perform steps 1 through 5, replacing the
sort expression with =Sum(Fields!Visit_Count.Value), as shown in Figure 4-9.
4983ch04.qxd 10/7/05 11:06 AM Page 94
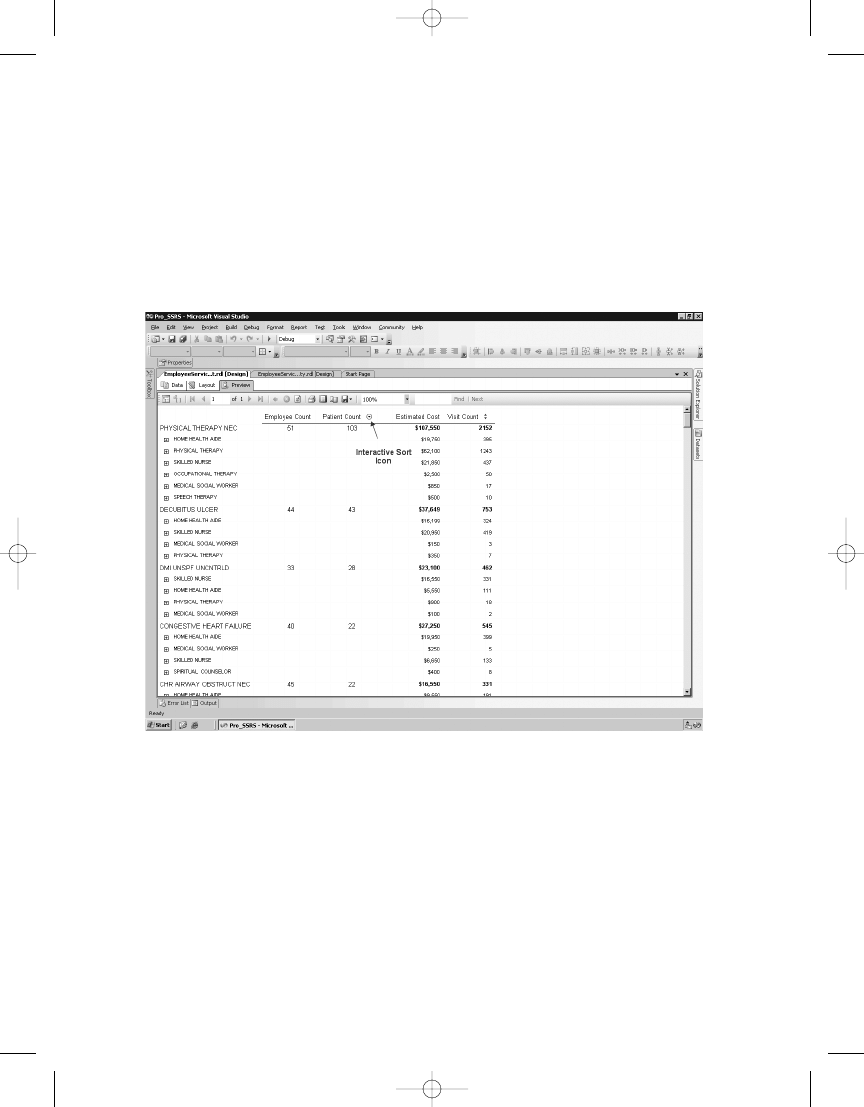
C H A P T E R 4
■
B U I L D I N G R E P O RT S
95
When you view the report with the new interactive sorting expressions in place, you can
see the automatic addition of a selectable sort icon in the Patient Count and Visit Count header
fields, as shown in Figure 4-10. When a user clicks this icon in the browser, the report will auto-
matically resort to showing either the most or least number of patients per diagnosis or the
most or least number of visits per diagnosis. Figure 4-10 is showing the diagnosis with the most
number of patients, which is Physical Therapy NEC with 103 unique patients diagnosed with
this illness. The user could also choose to sort the report in ascending or descending order by
the number of visits.
Interactive sorting is a textbox property and is typically used on column headings in a Table
or Matrix data region. A single textbox can control sorting for one or more data regions as long
as they are within the same scope or grouping. For example, it is possible to sort multiple tables
that are nested within a List data region.
The EmployeeServiceCost_InteractiveSort.rdl report in the Pro_SSRS project includes
interactive sorting.
Hyperlink Actions
Having the ability to link one report item, such as the contents of a textbox, to another report
or URL adds another valuable level of interactivity in SSRS. By adding hyperlinks to an SSRS
Web page, making their
Figure 4-10.
Report sorted interactively to show the number of patients
4983ch04.qxd 10/7/05 11:06 AM Page 95

C H A P T E R 4
■
B U I L D I N G R E P O RT S
96
tasks more efficient. In this section, you will learn how to add several links or actions to your
reports to aid users in linking to other reports and locations, such as a company intranet site.
You can associate three basic actions with values in a report:
• Jumping to a bookmark
• Jumping to a URL
• Jumping to a report
You can find these on the Navigation tab of the report items that support these actions,
such as textboxes and images.
To demonstrate each of these hyperlink actions, we will use a report that is more suited to
hyperlink actions than the one you have been designing thus far, which already contains one
level of interactivity in the drill-down functionality. The next report, Employee Listing, will
provide a simple list of employees, grouped according to their clinical specialty. Two reports
are available in the code download for the Employee Listing report. One is provided with
only the dataset created so that you can step through the following procedures to create the
report. It is called EmployeeListing_Start.rdl. The other report is a complete version called
EmployeeListing.rdl
.
You will add the three interactive hyperlink actions to the report to deliver the following
features:
Bookmark: When the employee name is selected, the report will jump to a bookmarked
location within the report that contains more details about the employee, such as the
number of patients they have seen.
URL: You will also set up a link to the employee’s department Web site, based on the
employee’s discipline or clinical specialty. You will also use a report parameter that you
will set up specifically for the purpose of selecting the employee’s branch location. When
users select a branch location from a drop-down list provided with the report parameter,
they will be taken to their own department’s intranet site.
Report: You will add a link to your Employee Service Cost report that will pass an EmployeeID
parameter to limit the results of the linked report.
The completed Employee Listing report will contain two Table data regions, one for sum-
mary information and one for detailed information about the employee’s visits. You will add
the hyperlink actions to the summary portion of the report, which will be the first page the
user sees. Listing 4-1 shows the query for the dataset that delivers employee information. For
this report, you will limit the employees to a known set, as shown in the WHERE clause, to keep
the report small. Also, you will add a date range with two parameters, @DateFrom and @DateTo,
that you will create and utilize later. The EmployeeListing_Start.rdl report contains default
values for a date range from January 1, 2003, to the current date using the Now() function.
4983ch04.qxd 10/7/05 11:06 AM Page 96

C H A P T E R 4
■
B U I L D I N G R E P O RT S
97
Listing 4-1.
Employee Listing Query
SELECT
Employee.EmployeeID, Employee.LastName,
Employee.FirstName,
Employee.EmployeeTblID,
Employee.EmploymentTypeID AS EmploymentType,
Employee.HireDate,
Discipline.Dscr AS Discipline, Patient.LastName AS
patLastname, Patient.FirstName AS patFirstname,
Trx.ChargeServiceStartDate,Discipline.DisciplineID
FROM
Employee INNER JOIN
Trx INNER JOIN
ChargeInfo ON Trx.ChargeInfoID = ChargeInfo.ChargeInfoID ON
Employee.EmployeeTblID = ChargeInfo.EmployeeTblID INNER JOIN
Discipline ON Employee.DisciplineTblID =
Discipline.DisciplineTblID INNER JOIN
Patient ON Trx.PatID = Patient.PatID
WHERE
(Trx.ChargeServiceStartDate BETWEEN @DateFrom AND @DateTo)
To begin, open the EmployeeListing_Start.rdl report. The steps to produce the initial
basic report as shown in Figure 4-11 are straightforward, with only a few pointers needed. First,
you will be using a Table data region again, so simply drag the table to the report area on the
Layout tab. Second, add a column to the default three columns of the table. Next, add the fol-
lowing fields onto the detail columns: EmployeeID, LastName, HireDate, and DisciplineID. The
employee DisciplineID field references an employee’s clinical specialty, such as Home Health
Aide or Skilled Nurse. For the employee name, because the fields have been padded with spaces,
you will want to use the rtrim function to concatenate the LastName and FirstName fields into
one field that will replace the LastName field that you added to the second column and then
change the header to Employee Name.
=rtrim(Fields!LastName.Value) & ", " & rtrim( Fields!FirstName.Value)
4983ch04.qxd 10/7/05 11:06 AM Page 97
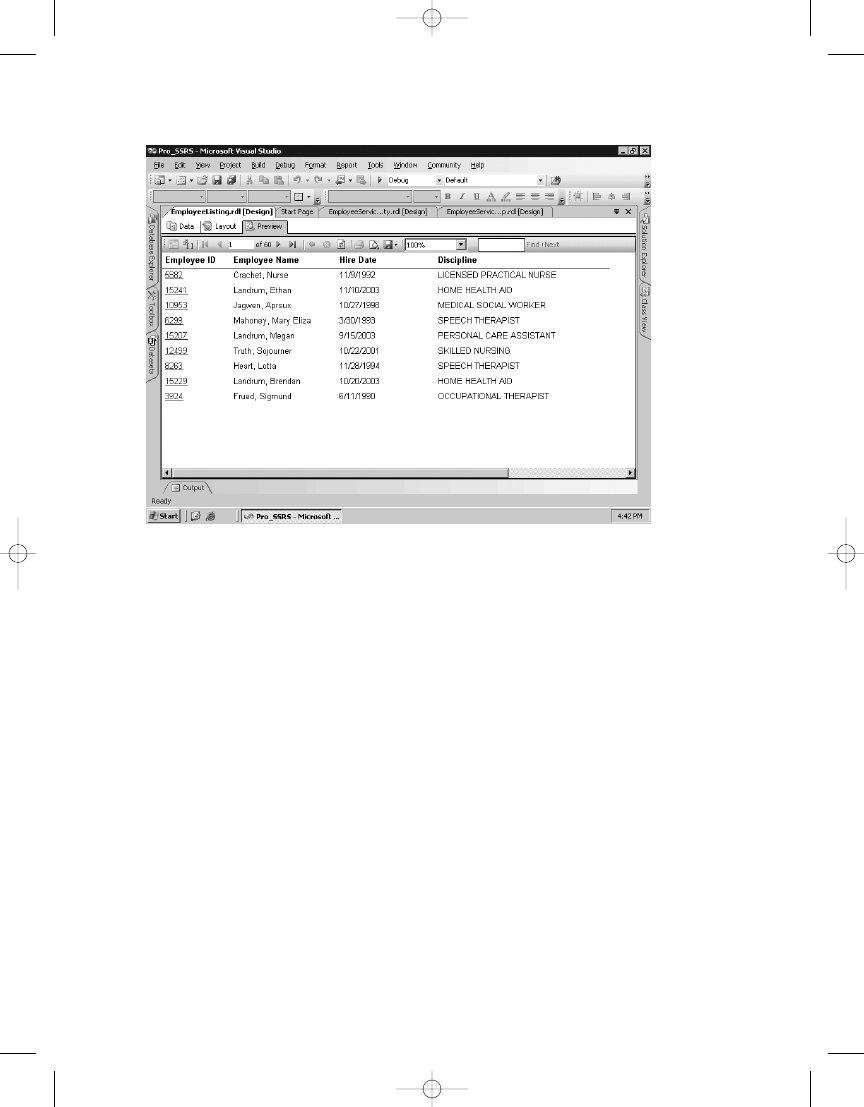
C H A P T E R 4
■
B U I L D I N G R E P O RT S
98
Figure 4-11.
Employee Listing report with hyperlink actions
Additionally, when using dates, the default format is to include the date and time values,
even if there is no time associated with the date. The hire date might look like this, for example:
10/20/2003 12:00:00 AM. By selecting the properties of the Hire Date cell, you can change the
format from the default to a more standard format, such as 10/20/2003, excluding any time
value. The format code for this date is d.
Next, because you are returning detail records, with more than one per employee, you
need to group the detail row itself using the value of the Employee_Name field. You can do this
by right-clicking the detail row and selecting Edit Group. In the Group On expression field,
add the same trimmed employee name as shown in the previous code line. Now when you
preview the report, you have your list of employees to which you can add hyperlink actions.
Finally, force a page break after this table so you can add a detailed table that will be used as
a bookmark link. To add a page break to a report, simply right-click to get to the table properties
in the upper left of the table. On the General tab, select Insert a Page Break After This Table.
4983ch04.qxd 10/7/05 11:06 AM Page 98

C H A P T E R 4
■
B U I L D I N G R E P O RT S
99
Adding a Bookmark Link
In this section, you will add a bookmark link to the Employee_Name field in the Employee Listing
report that, when clicked, will jump to a defined location within the report. In this case, you will
not add another Table data region to the report to contain detail information about employee
visits. Bookmarks ease the navigation burden on large reports when users are looking for
specific information. As discussed previously, summary and detail information can exist within
the same report; in the case of adding a bookmark, you are not hiding the data so much as moving
it to another location within the same report. The net effect for the user is the same, however,
in that they control when they see the detail information.
To add a bookmark to the Employee Listing report, first follow the procedure to drag a new
table element to the Layout tab. Next, add the patient name and the trimmed employee name.
For this table you will want to group by the employee name, so right-click your detail row and
select Insert Group. You will use the same trimmed expression as the group value expression,
as follows:
=rtrim(Fields!LastName.Value) & ", " & rtrim( Fields!FirstName.Value)
On the General tab for the grouping, select Page Break at End, which will force the detail
line for each employee to start on a new page. Next, add the date field that represents when
the service was performed, =Fields!ChargeServiceStartDate.Value, to the third column, and
format the date as you did earlier.
Now when you preview the report, the summary employee listing will appear on the first
page, and the detail records that show the employee visits will appear on each subsequent page.
Next, you will add a BookmarkID field to the Employee_Name field in the detail row in the table.
By right-clicking the field and selecting Properties ➤ Advanced, you can view the Navigation
tab that controls all three hyperlink actions. In the BookmarkID field, you will again add your
trimmed employee name expression. This will serve as the pointer record for the bookmark
link you will now create.
To create the bookmark link, you will perform the same steps to get to the Navigation tab
for the Employee_Name field in the first table. In the Hyperlink Action section of the tab, select Jump
to Bookmark and paste in the trimmed employee name expression you used for BookmarkID.
■
Tip
Hyperlink actions do not automatically change the formatting of the field to indicate an associated hyper-
link. You can manually change the color and add underline formatting so that the user knows to click the link.
When you preview the report, as shown in Figure 4-12, you see the detailed information
for the selected employee, in this case Sojourner Truth, presented on page 2; the first page of the
report is the Employee Listing table, where you clicked on the bookmark link in the Employee_Name
field.
4983ch04.qxd 10/7/05 11:06 AM Page 99
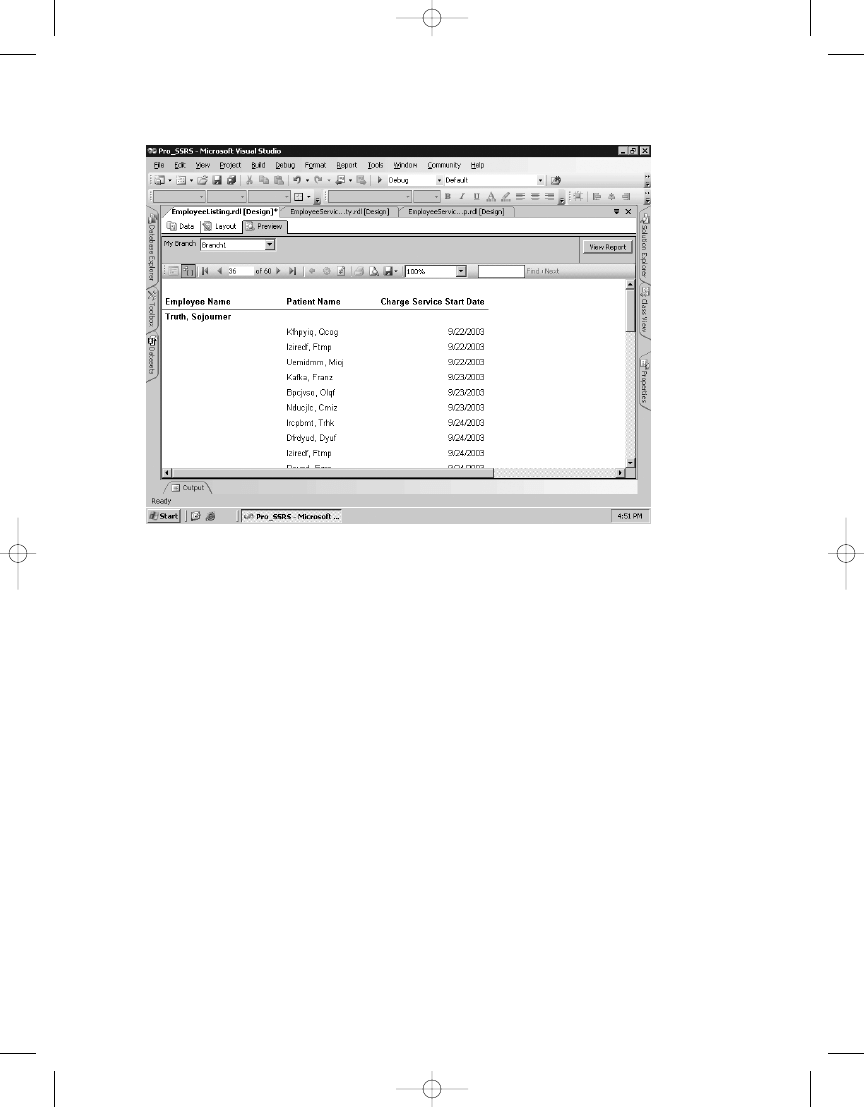
C H A P T E R 4
■
B U I L D I N G R E P O RT S
100
Figure 4-12.
Employee visit detail report called from a bookmark link
Adding a URL Link
URL links connect a report to information stored in other locations, such as a Microsoft
SharePoint site or the Internet. Like bookmark links, URL links are defined on the Navigation
tab and can be applied to many report items. As discussed in Chapter 3, in almost every value
field that is used in SSRS, expressions define the contents. In the case of the URL, you will build
an expression that will define the HTTP location, using a combination of the literal URL and
a field value from the dataset.
For example, let’s assume that for each employee discipline a home page on your intranet
site is designed specifically for that discipline. An employee who is a home health aide would
have a DisciplineID of HHA, and your Web site designed for home health aides would be at
http://webserver1/hha
. Assuming that the same is true for each discipline, it would be easy to
add a URL link for each discipline to your report.
Just as you did for the bookmark link for Employee_Name, let’s open the Navigation tab for
the Discipline field. Select Jump to URL, and add the following expression:
="http://webserver1/" & Fields!DisciplineID.Value
When the DisciplineID field is selected within the report, the browser will open and
connect to the site of the specific employee’s discipline—for example, HHA for the home health
aides site or RN for the registered nurses site.
4983ch04.qxd 10/7/05 11:06 AM Page 100
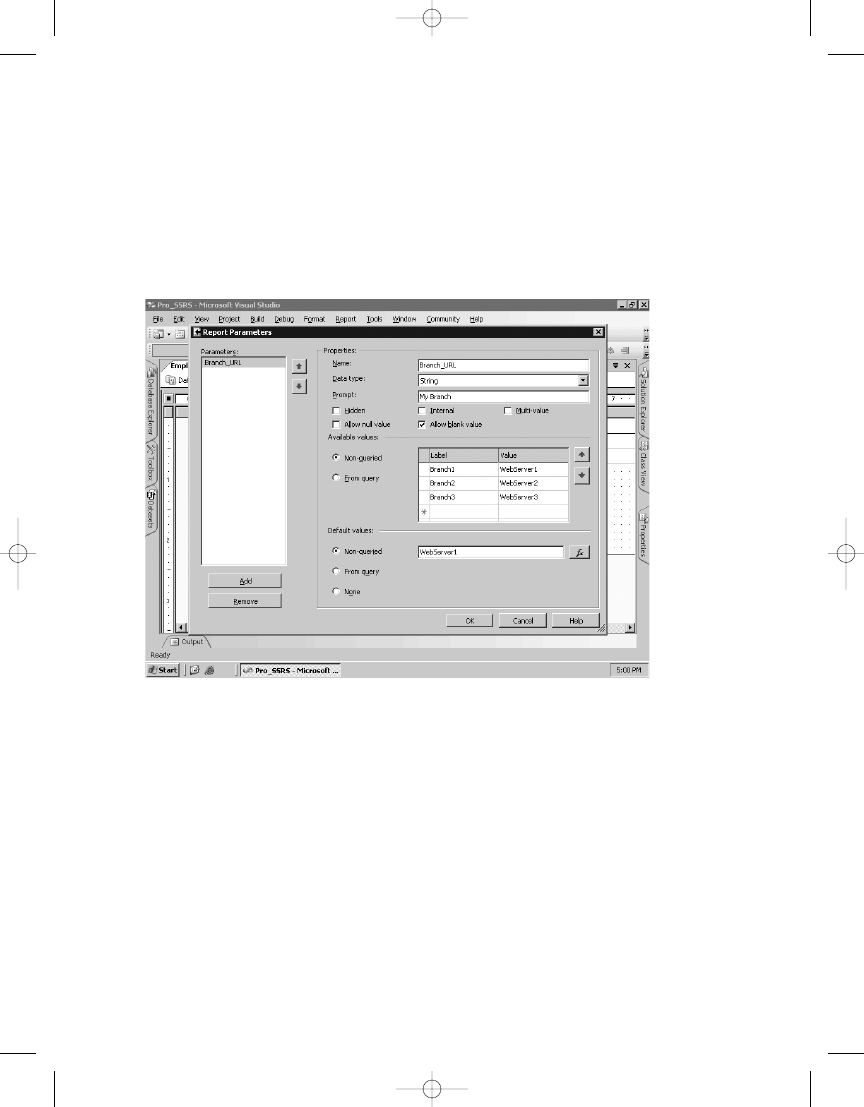
C H A P T E R 4
■
B U I L D I N G R E P O RT S
101
Figure 4-13.
Report Parameters dialog box
Building the URL Link with a Report Parameter
Taking the concept one step further, if you had multiple Web servers at different locations or
branches, you would not want to hard-fix the Web server name in the URL string. By using
a report parameter to select the server name based on the branch location, it would be possible
to control the Web server portion of the URL string that you created in the previous example.
Let’s step through this procedure. Figure 4-13 shows what the Report Parameters dialog box
should look like.
Follow these steps:
1.
While on the Layout tab, select Report ➤ Report Parameters from the menu bar.
2.
Click Add, and enter Branch_URL for the parameter name.
3.
Enter My Branch for the prompt.
4.
In the Available Values section, enter the following labels/values: Branch1 = Webserver1,
Branch2 = Webserver2, and Branch3 = Webserver3.
5.
Set the default value to be Webserver1.
6.
Return to the Navigation tab for the Discipline field, and apply the new expression
="http://" & Parameters!Branch_URL.Value & "/" & Fields!DisciplineID.Value
.
7.
Preview the report. Notice that you have a new parameter drop-down list called My
alue of Webserver1.
4983ch04.qxd 10/7/05 11:06 AM Page 101

C H A P T E R 4
■
B U I L D I N G R E P O RT S
102
■
Note
Many expressions and report items are case-sensitive inside the Visual Studio environment. Often,
if you receive an error indicating that a value is not valid, it will turn out to be that the case was incorrect.
With the URL location assigned to be that of the parameter Branch_URL, whenever a differ-
ent branch is selected from the drop-down list, the appropriate server for that branch will be
selected.
Jumping to a Report
Quite possibly the most useful hyperlink action in SSRS is the ability to link to another report,
called a drill-through report, from a specified location within the current report. You have
been working on two reports in this chapter, learning about many of the elements available.
Now let’s tie the two reports, Employee Listing and Employee Service Cost, together by creat-
ing a hyperlink from one to another. You will also pass a parameter value along with the hyperlink
to narrow the results of the Employee Service Cost report when it is called from the Employee
Listing report. The parameter value will be EmployeeID.
To add the hyperlink action that links to the Employee Service Cost report, return to the
Navigation tab, this time from the EmployeeID textbox within the Employee Listing report.
After clicking the Jump to Report button, a drop-down list appears with all the reports that are
available in the current solution. If the report has already been deployed to the report server
and is not in the current solution, you can use the relative path based on the target server that
is defined in the project. In this example, the target server is http://hwc04/reportserver.
You could add the relative path to any report on the report server. In this case, select the
EmployeeServiceCost.rdl
report, and then click the Parameters button. Choose the parameters
that are populated when the report is selected; later in the “Setting Report Parameters with
Stored Procedures” section, we will show how to add these parameters to the report. Choose
EmployeeTblID
as the parameter, and assign its value as =Fields!EmpTblID.Value, which is a field
in the Employee Listing report that has a corresponding value to the EmployeeTblID parameter.
After applying the new action, if the EmployeeID textbox is clicked when previewing the Employee
Listing report, the Employee Service Cost report will be called and the parameter passed, thus
narrowing the dataset for that report to only that selected employee.
In addition to interactive sorting, another feature in SSRS has been long-awaited: the
ability to have a Date control added as part of the report automatically when a datatype of
DateTime is added as a report parameter. In SQL Server 2005, this is an enhancement that,
though it was possible to easily code a Date control in a custom .NET form, many report design-
ers wanted a standard control for their users in the browser. To see this new Date control, add
a single line to your Employee Listing report query. This will be an addition to the WHERE clause
as follows:
Where ChargeServiceStartDate Between @DateFrom and @DateTo
4983ch04.qxd 10/7/05 11:06 AM Page 102
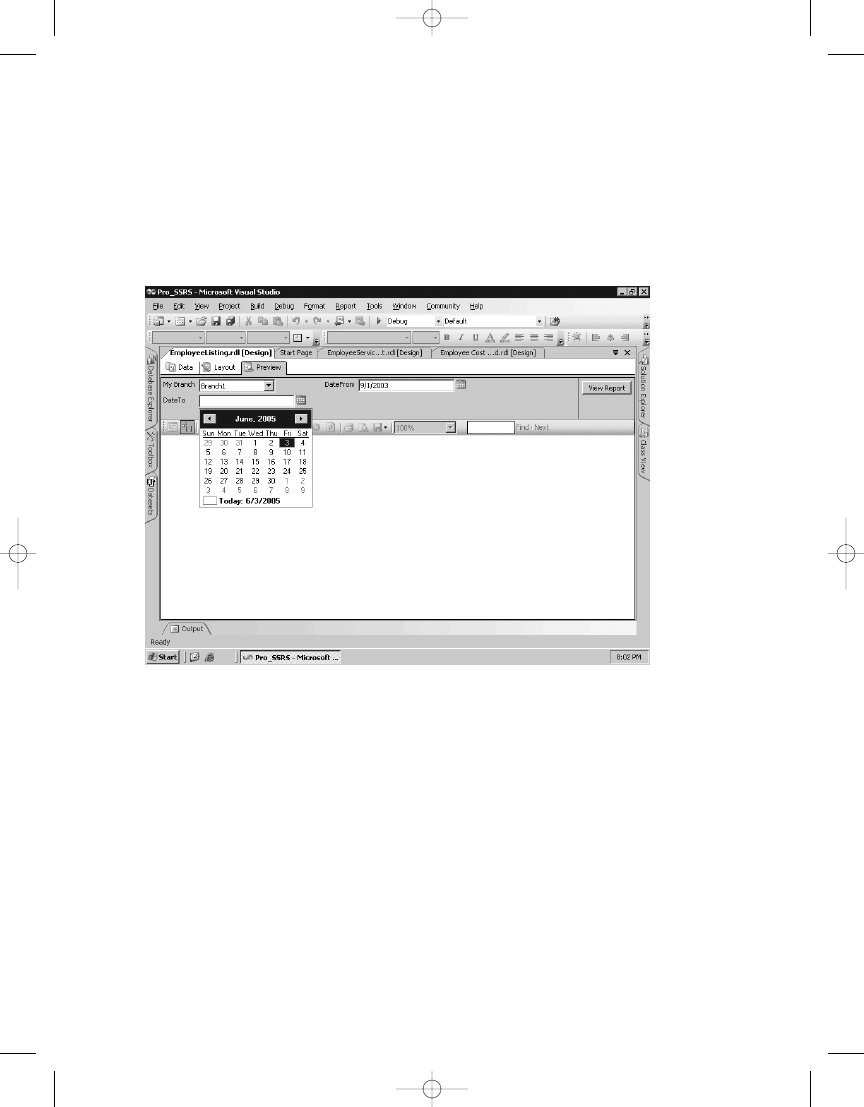
C H A P T E R 4
■
B U I L D I N G R E P O RT S
103
Figure 4-14.
Long-awaited date controls for report parameters
After you add this line to the query, two report parameters are created, DateFrom and DateTo.
If these parameters are set as string values, which by default they are, changing them to a datatype
of DateTime in the Report Parameters dialog box will force them to display a graphical date
picker control, as shown in Figure 4-14. Now when you run the report, you can actively select
the service dates that will automatically narrow down or expand your employees in the Employee
Listing report.
Adding Hyperlink Formatting and Tooltips
Before you save the new Employee Listing report, let’s add two formatting properties that will
make the link more obvious as well as provide feedback on what will happen when the link is
selected. The first task is to simply make the EmployeeID field resemble a hyperlink. Select the
field, and apply an underline and color format of blue (see Figure 4-15).
4983ch04.qxd 10/7/05 11:06 AM Page 103
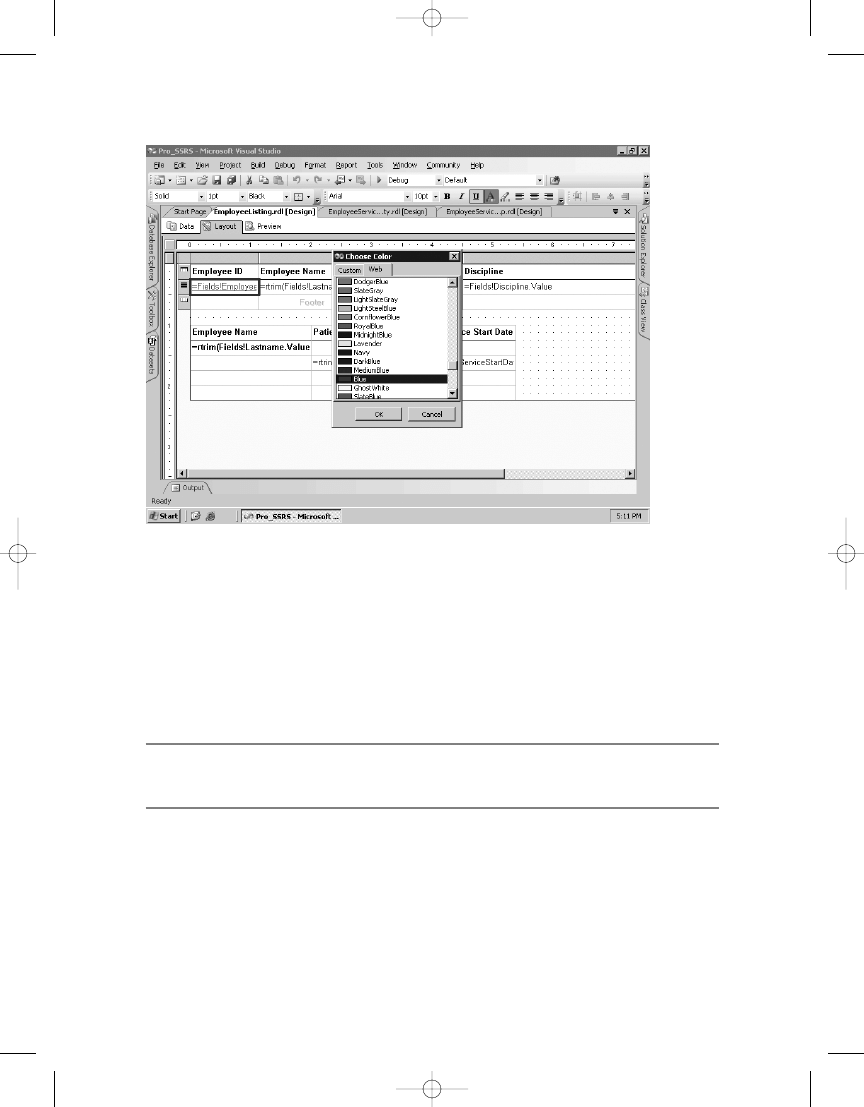
C H A P T E R 4
■
B U I L D I N G R E P O RT S
104
Figure 4-15.
Employee Listing report with visible hyperlinks
Next you will add a tooltip to the same field. Tooltips appear whenever a user hovers the
cursor over the field, and they provide additional information. In this case, you will use one
simply to show which report will be called when the EmployeeID box is clicked—the Employee
Service Cost report. The ToolTip property is located in the Misc section of the Properties win-
dow. After selecting the field, open the Properties box, and enter Employee Service Cost
as the tooltip. Notice that the tooltip, like most other values, can be an expression as well as
a literal string.
■
Note
Tooltips will not display in preview mode; the report must be deployed before they can be viewed in
the browser.
It is possible to assign multiple parameter selections as input for the drill-through report.
Now that you are linking to the Employee Service Cost report, which will have multiple parame-
ters, let’s take a closer look at how parameters and filters work together to deliver data to a report.
4983ch04.qxd 10/7/05 11:06 AM Page 104

C H A P T E R 4
■
B U I L D I N G R E P O RT S
105
Setting Report Parameters with Stored Procedures
In Chapter 3, we introduced parameters and explained how you can use them within reports
and queries to limit the results returned from the data source. To this point you have been work-
ing with a query instead of a stored procedure to build reports, but we have only touched the
surface of how you can use parameters within SSRS. Parameters get their values primarily from
user input and are most often associated with a dataset; they are used to limit the amount of
data returned. When a parameter is used in this way, it is called a query parameter. Query
parameters that are part of a dataset, such as a SQL query or stored procedure, automatically
generate report parameters within SSRS.
In this section, you will modify the dataset of your Employee Service Cost report to use
a parameterized stored procedure instead of a query. By default, report parameters generated
from stored procedures do not have populated drop-down lists of data for users to select, so in
this section you will also populate the report parameter lists with valid data for user-selectable
input. Finally, you will see how SSRS works with NULL parameter values and how to generate
a NULL value for the parameter. This will become especially important when retrieving data for
your SSRS report, as we will explain later in this section.
You will return to the stored procedure you have already created, called Emp_Svc_Cost, which,
as you might recall, will deliver the same dataset as the SQL query you have been using. The
stored procedure has the added benefit of accepting all the parameters you want to use in the
report. SSRS will automatically create the report parameters from the stored procedure. Let’s
quickly review the parameters that will be passed into the report from the stored procedure:
• BranchID
• EmployeeTblID
• ServiceMonth
• ServiceYear
• ServiceLogCtgryID
To create the parameters automatically for your Employee Service Cost report, which is
currently using a nonparameterized query, you will simply change the dataset for your report
to be the stored procedure.
Open the EmployeeServiceCost_SP report from the project included in the code download.
On the Data tab that has the dataset Emp_Svc_Cost, you can click the ellipsis button (...) next
to the Dataset field to open the Properties window. In the Command Type drop-down list,
change the value from Text to Stored Procedure. Next, type the name of the stored procedure,
Emp_Svc_Cost, in the Query String window. When you click OK and then execute the query in
the generic query designer, you are prompted to input parameters (see Figure 4-16). Since the
stored procedure is designed to accept NULL values, change the default input value in the Define
Query Parameters dialog box from Blank to NULL, and click OK to complete the execution. If you
do not select NULL instead of Blank, the query will fail with an error message, “Failed to convert
string to Int32.”
4983ch04.qxd 10/7/05 11:06 AM Page 105
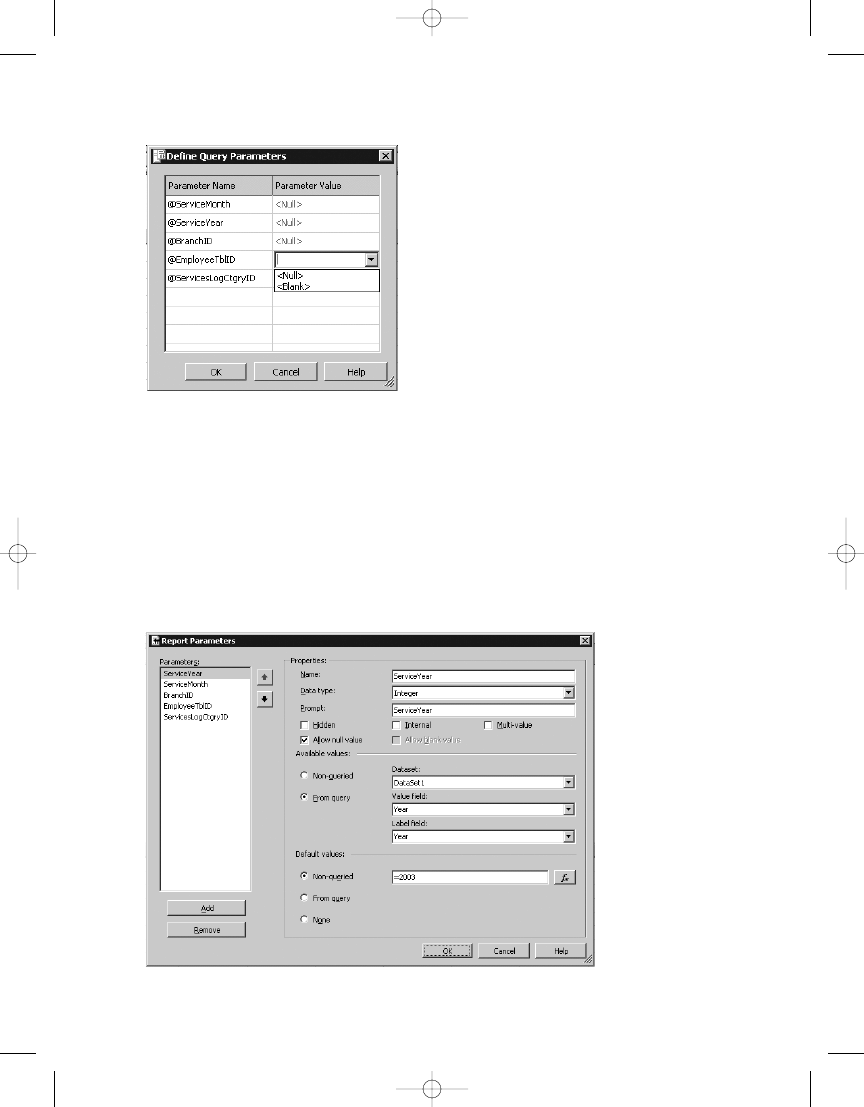
C H A P T E R 4
■
B U I L D I N G R E P O RT S
106
Figure 4-16.
Parameters required for the stored procedure Emp_Svc_Cost
Allow Null Value
field
In the Report Parameters Properties box, you can see that the report parameters were auto-
matically created from the stored procedure. Though SSRS did correctly assign the datatype for
each parameter, integer, and string, it did not automatically set the field to allow NULL values
(see Figure 4-17). For the purpose of this report, which expects NULL values as possible param-
eters, it is important that the Allow Null Value checkbox is selected for each parameter so that
when the report is previewed, NULL will be the default value, and the NULL checkbox will be
automatically checked so that the report executes without requiring user input.
4983ch04.qxd 10/7/05 11:06 AM Page 106
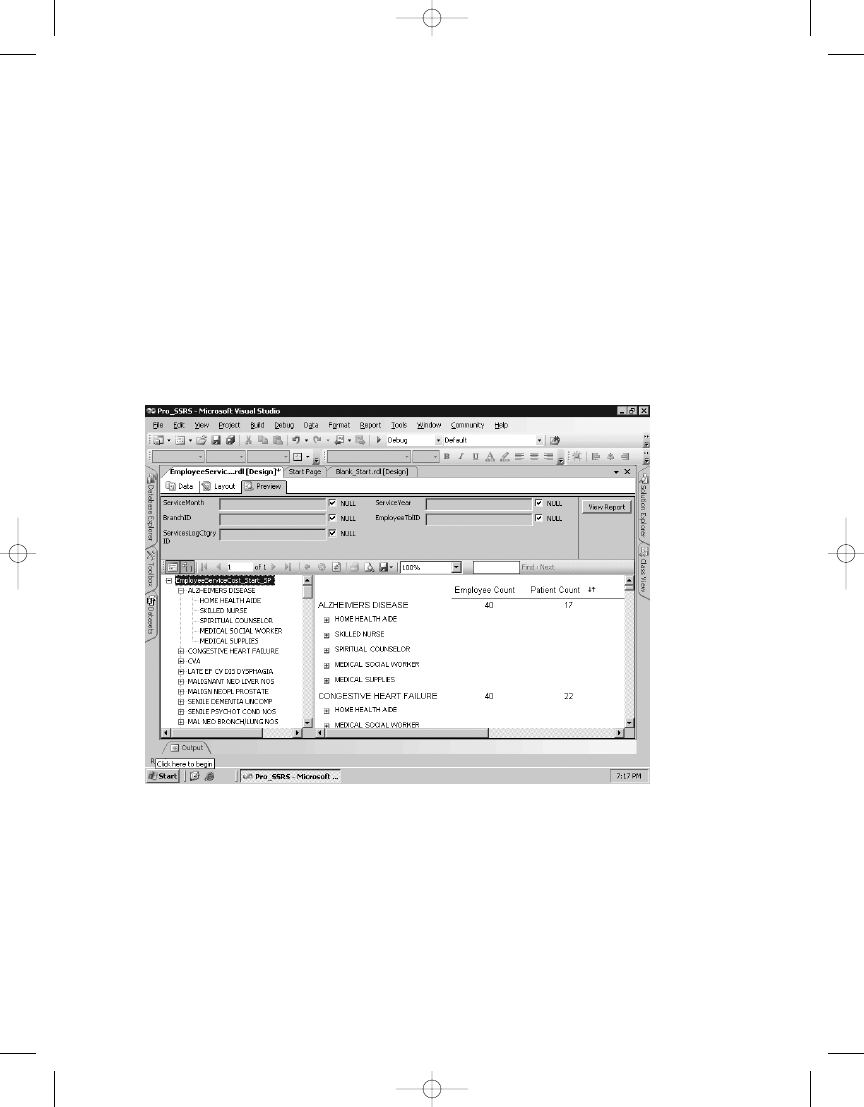
C H A P T E R 4
■
B U I L D I N G R E P O RT S
107
Figure 4-18.
No parameter values available via drop-down list
Default parameter values will also need to be manually configured. If no default parame-
ter value is assigned to an available parameter, the report, when rendered or previewed, will
not process the incoming data until a user supplies a value. Previewing the report without
modifying the parameter selection reveals that the user would need to enter a value for each
parameter that has no default value assigned. The user would not be able to choose from a list
of values but would have to enter them manually. This is unacceptable because the user will
not always know the correct values; good examples of this are the EmployeeTblID field that is
used to select a specific employee and the BranchID field used to retrieve the branch name.
The first step is to provide valid query-assigned values for the parameter drop-down lists.
It would be beneficial to provide a view of the report in preview mode prior to adding descriptive
parameter values from a new dataset (see Figure 4-18). Notice that there is a NULL checkbox
selected next to the parameter selections. The NULL checkboxes appear when the parameter
allows NULL values, as you set earlier, and there are no other available values.
The following list of procedures will add two datasets to populate the Branch and
Employee drop-down lists for the parameters:
1.
On the Data tab, create two new datasets, Employee_DS and Branch_DS, by dropping
down the Dataset list and selecting New Data Set. For both datasets you create, you
will add simple queries that will return the IDs and names for the employee and the
branch. Notice in the WHERE clause of the employee query that you are including only
a known set of employees for simplicity.
4983ch04.qxd 10/7/05 11:06 AM Page 107

C H A P T E R 4
■
B U I L D I N G R E P O RT S
108
--Query for Employee Parameter
SELECT
EmployeeTblID,rtrim(rtrim(employee.lastname) + ',' +
rtrim(employee.firstname)) as Employee_Name
FROM
Employee
WHERE (Employee.EmployeeTblID IN
(32, 15, 34, 44, 129, 146, 159, 155, 26))
--Query for Branch Parameter
SELECT
BranchID, BranchName
FROM
Branch
2.
After you have created the datasets with the previous queries and verified that they exe-
cute properly on the Data tab, go to the Layout tab, and from the menu select Report ➤
Report Parameters. Select the BranchID parameter, and enter Branch for the prompt for
clarity, as you will be selecting the branch name in the drop-down list. Do the same for
the EmployeeTblID parameter, entering Employee for the prompt.
3.
In the available values for the branch parameters, select From Query, and then select
the Branch_DS dataset. The Value field will be BranchID, and the Label field will be
BranchName
.
4.
Follow the same steps to modify the Employee parameters, assigning Employee_DS and
choosing the Value and Label fields as EmployeeTblID and Employee_Name, respectively.
When finished, select OK.
5.
Finally, on the Layout tab you will add a grouping for Branch Name to the table in the
report so that as the parameters are selected, you can see that the report is specific to
a branch. To do this, right-click on the button to the left of the Table Header row, above
Diagnosis, and select Insert Group. This will make the Diagnosis group, formerly the
first group, now the second group and will add a new group. Assign the expression
value of =Fields!BranchName.Value to the new group, and click OK in the Grouping
and Sorting dialog box. Next, drag the BranchName field from the Datasets window to
the new first column row for the Branch group you just created. Also, make the field
bold, and resize the font to 12 points.
The report will now have populated drop-down lists for the available parameter values, as
shown in Figure 4-19. Notice that for the two parameters where you have added available values,
the NULL checkbox has disappeared.
4983ch04.qxd 10/7/05 11:06 AM Page 108
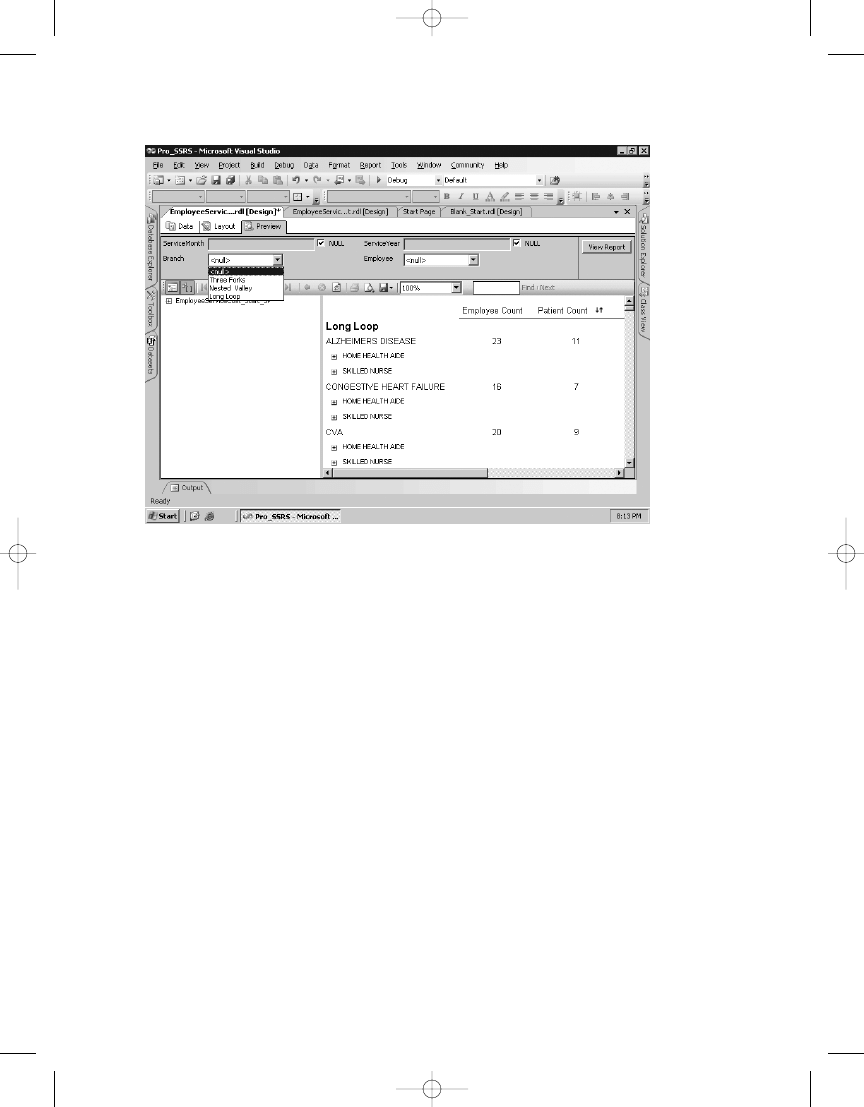
C H A P T E R 4
■
B U I L D I N G R E P O RT S
109
Figure 4-19.
Report with populated parameter selections
You could perform the same steps for the ServiceLog CtgryID parameter and provide
a valid drop-down list from the table values. However, since you may also be viewing the report in
a custom report viewer that will also accept parameter values, this particular parameter value
is of little use to you now for direct user input. That being the case, it will be beneficial to take
advantage of another new and much needed feature, the ability to hide parameters. This func-
tionality was added in Service Pack 2 for SSRS for SQL Server 2000 and is available in 2005 as
well. Sometimes a parameter can and should be populated by events other than user input. In
these instances, users will only be confused by seeing these additional parameters. In the Report
Parameters dialog box, select the ServicesLogCtgryID property, and check the Hidden box. It
will also be beneficial to modify the time-based parameters (Service Year and Service Month)
for this report. Time-based values are often tricky to deal with because of the special formatting
needs of the DateTime datatype, which can store years, months, and days as well as hours,
minutes, and seconds. The procedures for setting up the Service Year and Service Month
parameters with valid values is almost identical to the Branch and Employee procedures covered
earlier, with the exception that the Service Year needs to default to the current year and not NULL.
The first step is to create a dataset for the Service Year and Month parameters based on the
service date, which is the field ChargeServiceStartDate in the stored procedure. You will use
the DatePart and DateName functions in the two queries to derive valid values. The valid values
for the dates are contingent upon their existence in the table, so, for example, if your data con-
tained values for 2003 and 2004, only those two years would show up in the drop-down list.
Populating the date values in this way precludes the user from having to enter a date and also
prevents the report designer from having to hard-code year and month values into the report.
4983ch04.qxd 10/7/05 11:06 AM Page 109

C H A P T E R 4
■
B U I L D I N G R E P O RT S
110
Listing 4-2 shows the two queries that drive the parameter values. Unlike with SSRS for
SQL Server 2000, you don’t need to pass in a NULL value in the dataset, as SSRS for SQL Server
2005 supplies the NULL value by default when the parameter allows NULL values. This was
a limitation with the previous version that has been addressed.
Listing 4-2.
Parameter Value Queries
SELECT
DISTINCT DatePart(yy,ChargeServiceStartDate) as Year
FROM
TRX
--Query to Derive Month
SELECT
DISTINCT DatePart(mm,ChargeServiceStartDate) as DateNum,
DateName(mm,ChargeServiceStartDate) as Month
FROM
TRX
ORDER BY
DatePart(mm,chargeservicestartdate)
To finish the report, add the Service Year field to the report, formatting it with a distinct
color (in this case, dark salmon), and then resize the field to 12 points. Before you preview the
report, it is important to set the default value for the year so that a valid Service Month selec-
tion is not based on the default Service Year field of NULL. This could potentially have undesired
results; in other words, the user might select January and assume that it means January for the
current year, when in fact it would be all occurrences of January.
To make the Service Year parameter default to the current year, go to the Report Parameters
dialog box and set the Default Value option to the following expression:
=cint(DatePart("yyyy",Now()))
You can preview the report and provide parameter values (see Figure 4-20).
■
Note
Most of the data in the
Pro_SSRS
database is from 2003 and 2004. If the current year is defaulted
to a different year, the data you see may not be the same as that shown in Figure 4-20.
The EmployeeServiceCost_Parameters.rdl report in the Pro_SSRS project includes popu-
lated parameters.
4983ch04.qxd 10/7/05 11:06 AM Page 110
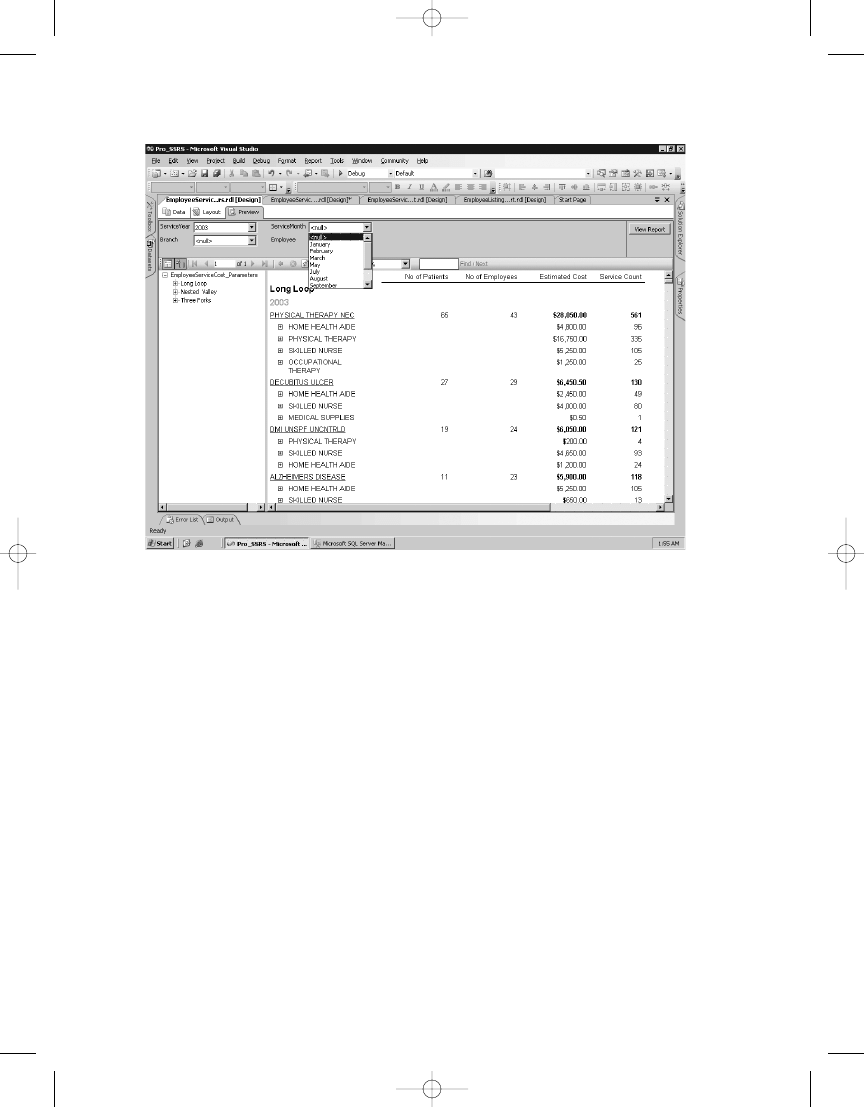
C H A P T E R 4
■
B U I L D I N G R E P O RT S
111
Figure 4-20.
Report with valid year and month values
Applying a Filter
You might recall from Chapter 2 that you enhanced the performance of your stored procedure,
Emp_Svc_Cost
, by removing the criteria that looked only at visits. You will now apply a filter to
the report to take the place of the original query criteria so that only visits will be displayed.
You can use filters to exclude values from a report after the results have been returned by
the query. Filters, in that sense, will prevent a requery; however, the full dataset will be returned
to the report. In the example in Chapter 2, you knew that a limited number of excess rows
would be returned. You should use filters when a query parameter is not supported by the
data provider or with report snapshots. You should also use filters in reports that address
a specific request or solution and that are based on the same stored procedure as other reports,
because you can use filters without modifying an existing stored procedure. Here is a simple
filter expression applied to the Table data region of your report that will exclude any rows that
are not visits:
=Fields!ServiceTypeID.Value = "V"
To add the filter expression, on the Layout tab right-click the upper-left section of the table,
and select Properties. On the Filter tab, enter the previous expression so that it looks like
Figure 4-21.
4983ch04.qxd 10/7/05 11:06 AM Page 111
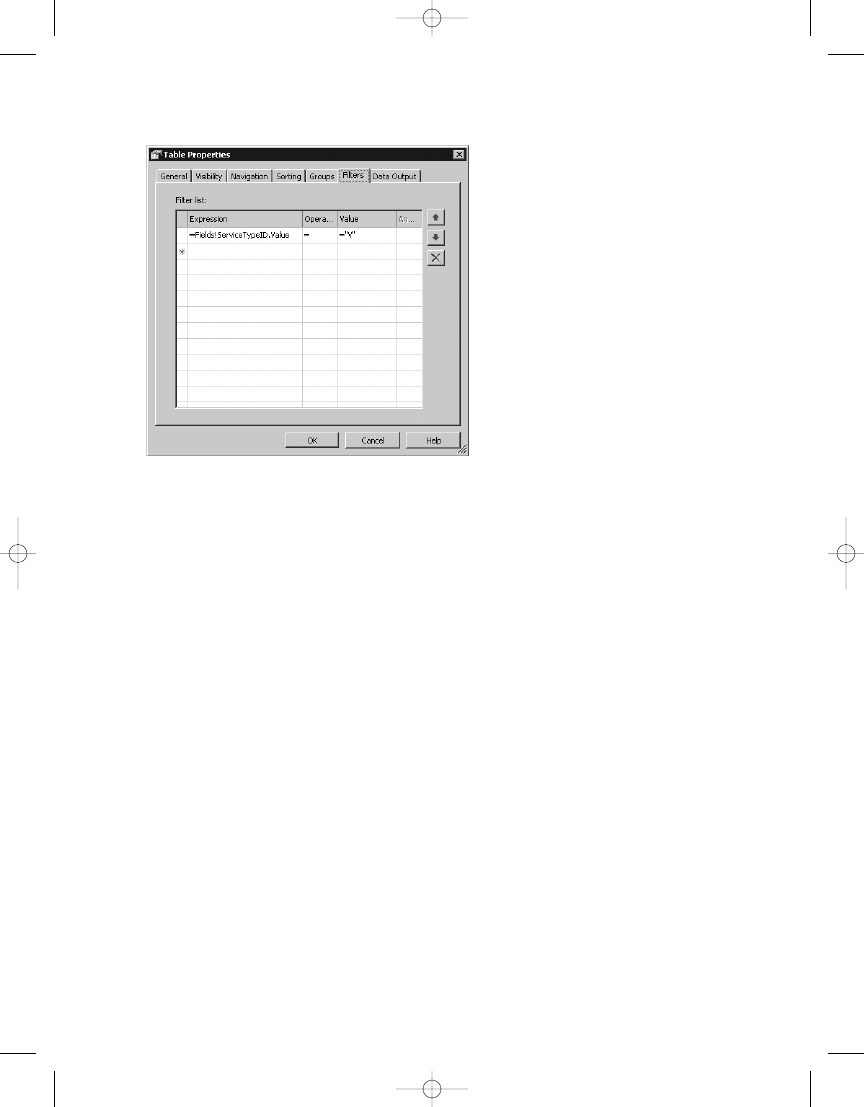
C H A P T E R 4
■
B U I L D I N G R E P O RT S
112
Figure 4-21.
Filter dialog box to exclude nonvisits
Adding a Chart
SSRS provides a Chart data region that has a style similar to Microsoft Excel. Charts can be
scoped within the current dataset or can use their own dataset. For this example, you will add
a stacked bar chart to the beginning of the report that will show the top ten diagnoses and
a count of the number of services for each diagnosis. This will essentially mirror the data pro-
vided in the report thus far. This report thus far is now also grouped by Branch, which will
automatically separate the values in the Branch group you have defined. You will want to emulate
this for your chart. You have only three branches in this particular dataset, so the result should
be in line with the details of the report. Follow these steps to add the chart to the report:
1.
On the Layout tab, click and drag the table you have already defined to make room for
the chart.
2.
Click and drag the Chart data region to an area above the table.
3.
Right-click anywhere on the chart, and select Chart Type ➤ Bar ➤ Stacked Bar.
4.
Using the same Emp_Svc_Cost dataset defined for your report already, drag the Visit_Count
to the Data area of the chart.
5.
Drag the Diagnosis field to the Category area of the chart.
4983ch04.qxd 10/7/05 11:06 AM Page 112
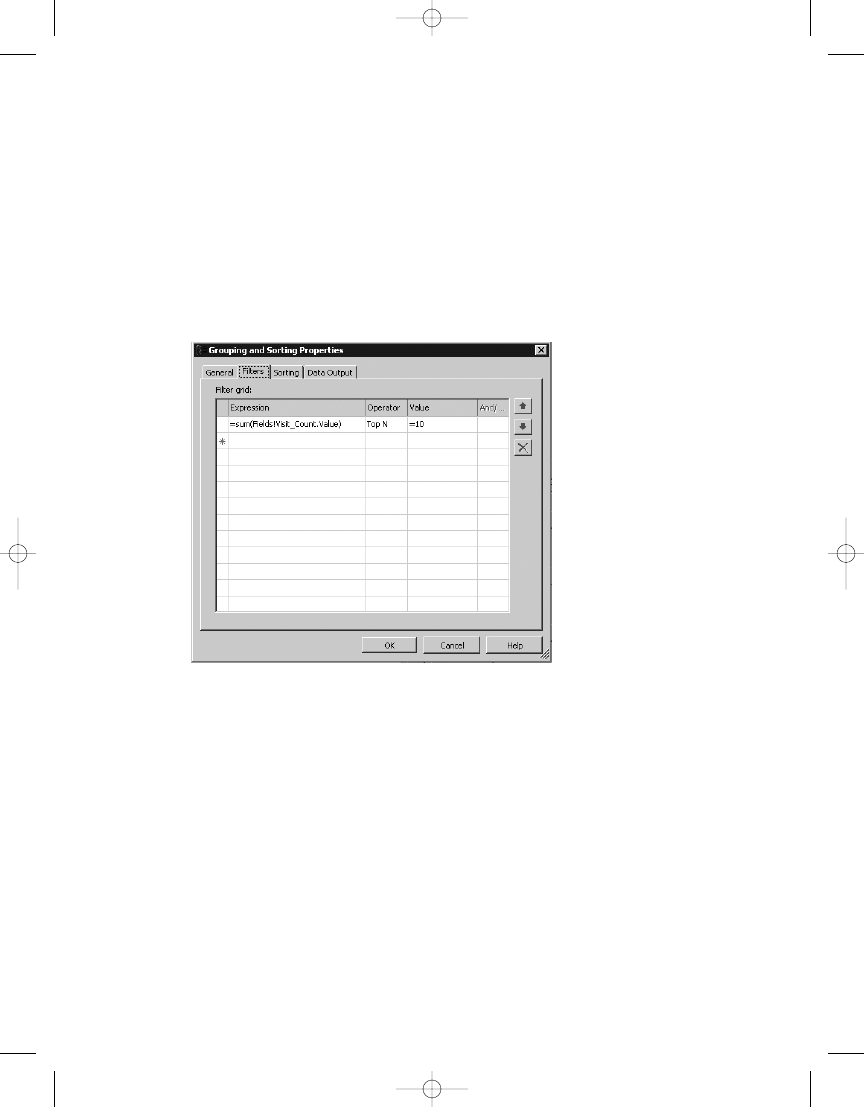
C H A P T E R 4
■
B U I L D I N G R E P O RT S
113
Figure 4-22.
Filter value for top ten diagnoses
6.
Drag the BranchName field to the Series area of the chart.
7.
Resize the chart so that it aligns with the table below it. You can select both report
elements, and on the toolbar select the Make Same Width icon.
8.
Right-click the chart, and select Properties. On the Data tab, select Edit in the Category
groups for chart1_CategoryGroup1. Because you want to make the report show only the
top ten diagnoses, you need to add a filter to this grouping. You will use the Top N operator
to make this happen, as shown in Figure 4-22, based on the top ten diagnoses by a sum
of the visit count.
Finally, you can preview the report. Sometimes a report needs a chart up front for a quick
view of the data prior to analyzing the details. Someone perusing this report might find it
interesting in the chart, for example, that the Physical Therapy NEC diagnosis seems to be
more prolific in the Nested Valley branch. This initial preview might warrant more investigation
that can be gleaned from the details in the report. In Chapter 10, when we discuss Analysis
Services and SSRS, we will go into more detail about analyzing and reporting on these data
trends.
When previewed, the report should look like Figure 4-23.
4983ch04.qxd 10/7/05 11:06 AM Page 113
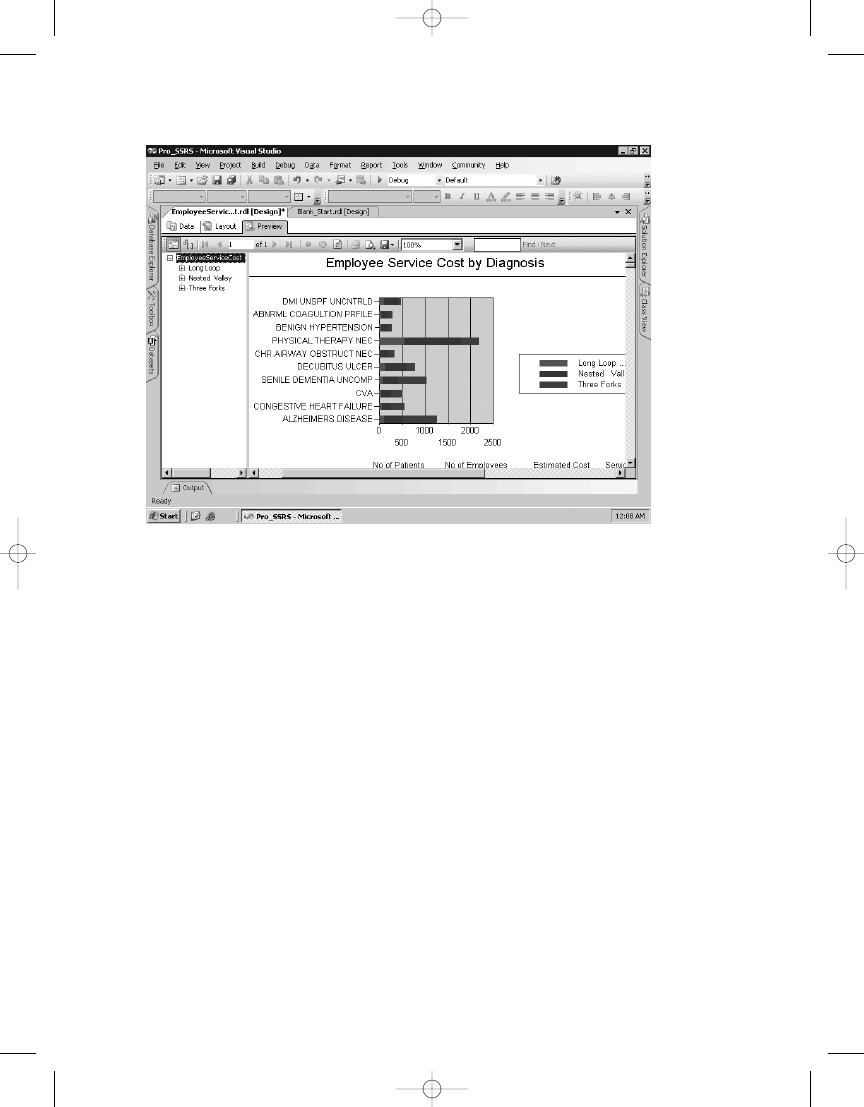
C H A P T E R 4
■
B U I L D I N G R E P O RT S
114
Figure 4-23.
Employee Service Cost report with a chart
The Chart data region has many properties that you can apply, as covered in Chapter 3;
however, the appearance of the stacked bar is suitable for your report and can be deployed as is.
Adding the Final Touches
In many projects, the final touches can be quite time-consuming. You now have the Employee
Service Cost report to the point where it is functioning the way you expect and has had format-
ting applied to some extent during development. You have only a few final elements to apply
before you call the report complete and before it’s ready to deploy to your SSRS Web server for
production:
• Adding a page header and footer
• Adding a report title
• Adding page numbers
• Adding the report execution time
To add a page header and footer to the report, select Report ➤ Page Header and Page
Footer. This will add the two new sections to the report where you will add the values that will
print on every page.
4983ch04.qxd 10/7/05 11:06 AM Page 114
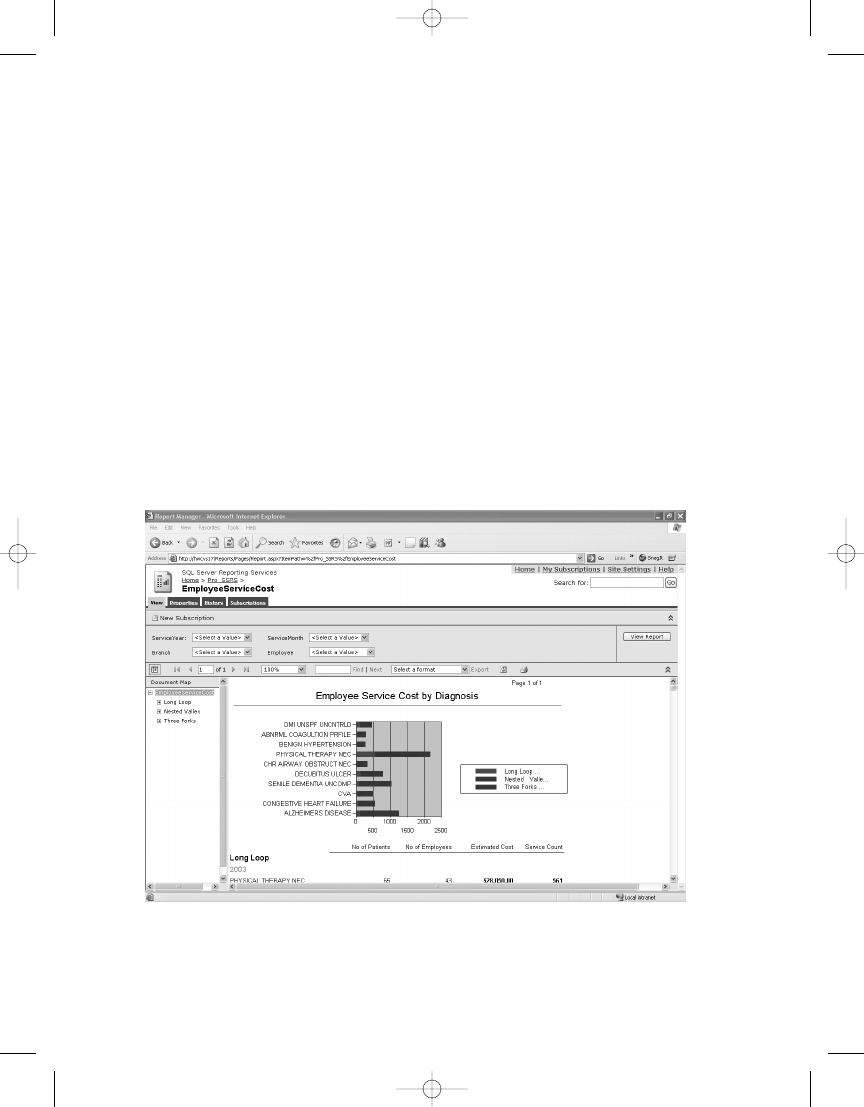
C H A P T E R 4
■
B U I L D I N G R E P O RT S
115
Figure 4-24.
Report rendered in the browser
In the Toolbox, you’ll see two report items, a textbox and a line, that you can use in the
page header and footer sections. First drag two textboxes to the header and one to the footer.
Then align one of the header textboxes to be the same width as the table, enter your report
title as Employee Service Cost by Diagnosis, change the font size to 16 points, and apply bold
formatting. Next, drag a line into the header section, and position it between the chart and the
report title textbox you just created.
In the second textbox in the header section, add the following expression based on global
parameters as defined in the Edit Expression window:
= "Page" & " " & Globals!PageNumber & " of " & Globals!TotalPages
Finally, in the textbox in the footer, add the following expression for the report execution
time:
=Globals!ExecutionTime
You are now ready to preview your report one last time before you deploy it to your users.
This time, let’s take a look at the final version in the browser (see Figure 4-24). This is what the
report will look like when it has been deployed to the Web server. (We will discuss methods for
deploying reports in Chapter 6.)
The completed report in the Pro_SSRS solution is called EmployeeServiceCost.rdl.
4983ch04.qxd 10/7/05 11:06 AM Page 115

C H A P T E R 4
■
B U I L D I N G R E P O RT S
116
Working with Multivalued Parameters
Multivalued parameters are an enhancement to SSRS for SQL Server 2005 that is probably one
of the most awaited features for an SSRS update. Having the ability to individually select values
to feed into the report is a powerful feature that most other reporting applications take for
granted and that was not available in SSRS for SQL Server 2000. Working with multivalued
parameters to achieve the most usefulness from them, however, requires special design con-
siderations, as mentioned in Chapter 3. The reason for this, especially when working with
stored procedures, is that the multivalued parameters are passed back to the stored procedure
as a string value. The only way to work effectively with multivalued parameters is to know that
the query or stored procedure will evaluate all, one, or multiple values returned to it based on
user selection. Because SQL Server does not evaluate a string in the same way it does a single
value in a stored procedure, which honestly has been the bane of SQL developers for years, you
have to go into multivalued parameters knowing that you will have to parse string values. For
writers/logicians like ourselves, this is a fun game. For others, who have to develop reports
with multivalued input parameters for a large audience, this can be a nightmare. Rest assured
that once you understand string manipulation techniques, multivalued parameters will be
a worthwhile time investment.
To accurately demonstrate how to work with multivalued parameters, which we will
affectionately refer to as MVPs henceforth, let’s take a copy of the Employee Service Cost report
with the assumption that you will redesign it to accept the Year and Month parameters as mul-
tivalue. To begin, you will have to first modify your base stored procedure. Previously it was
fine to evaluate the expression of your Year and Month parameters with the logic in Listing 4-3.
Listing 4-3.
Logic to Evaluate Year and Month Parameters Without MVP
1=Case
When ( @ServiceYear is NULL) then 1
When ( @ServiceYear is NOT NULL) AND @ServiceYear =
Cast(DatePart(YYYY,ChargeServiceStartDate) as int) then 1
else 0
End
AND
1=Case
When (@ServiceMonth is NULL) then 1
When (@ServiceMonth is NOT NULL) AND @ServiceMonth =
Cast(DatePart(MM,ChargeServiceStartDate) as int) then 1
else 0
END
However, now that you will be using MVPs, NULL values are not acceptable. The value of
NULL
in your logic was to select all values. This precluded you from accepting more than one
value. For example, if you had the years 2002, 2003, 2004, and 2005 as valid values, you could
either select all the values by selecting NULL or select only one value to narrow the data. You
could not have selected 2003 and 2004. Now you can. The only way to effectively use MVPs is
through the WHERE clause of the query or stored procedure, with parameters, that feeds the
report data. You will have to take advantage of the IN clause of T-SQL to make the best use of
MVPs. Unfortunately, though, it is not as simple as modifying the stored procedure to say
4983ch04.qxd 10/7/05 11:06 AM Page 116
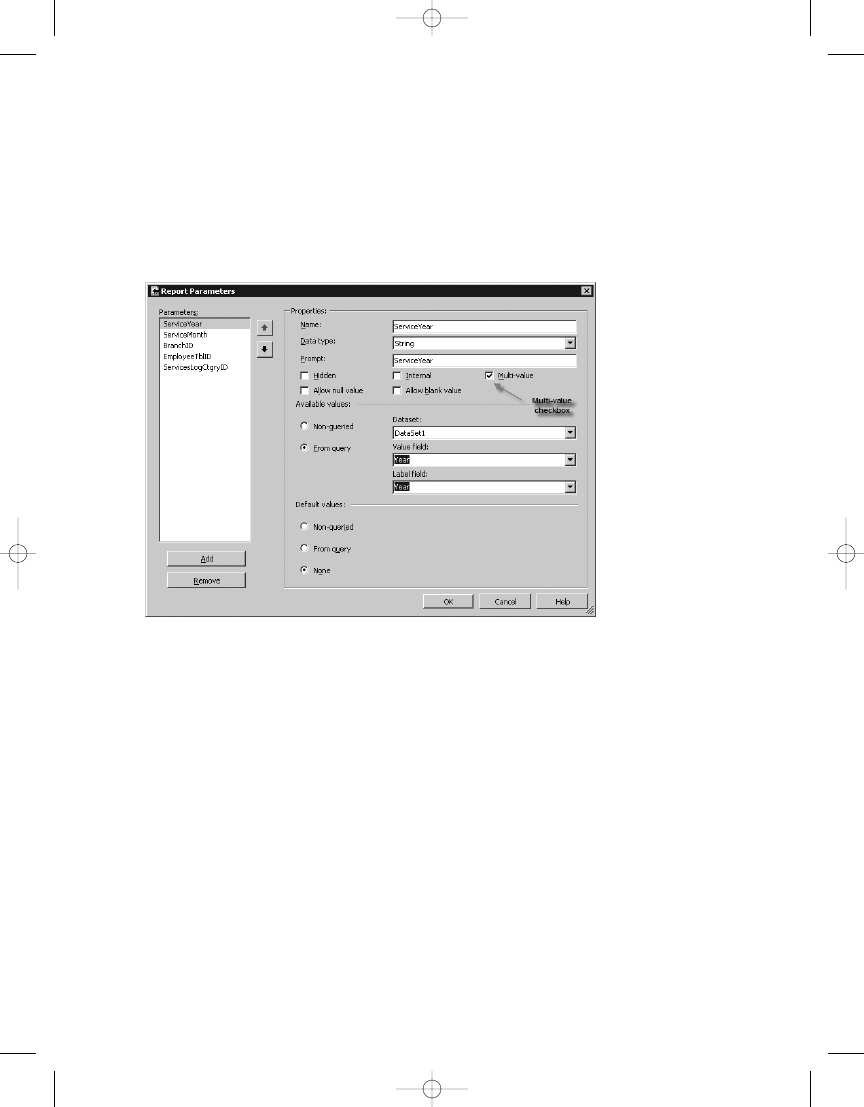
C H A P T E R 4
■
B U I L D I N G R E P O RT S
117
Figure 4-25.
Report rendered in the browser
Where value IN (@MyParameter)
, because SQL does not evaluate the IN clause as a string when
using a stored procedure parameter. We can best explain this with the following example.
Let’s say you make the Year and Month report parameters multivalued parameters. You can
do this quite simply by checking the Multi-value box in the Report Parameters dialog box, as
shown in Figure 4-25. Notice also that the Allow Null Value checkbox is unchecked. Allow Null
Values cannot be checked if you want MVPs to work.
If you were to execute the report now, you would see, as you did in the previous example
using a dataset to populate the available values, that you are able to select one or more or all
values for the year and month options, as shown in Figure 4-26.
4983ch04.qxd 10/7/05 11:06 AM Page 117
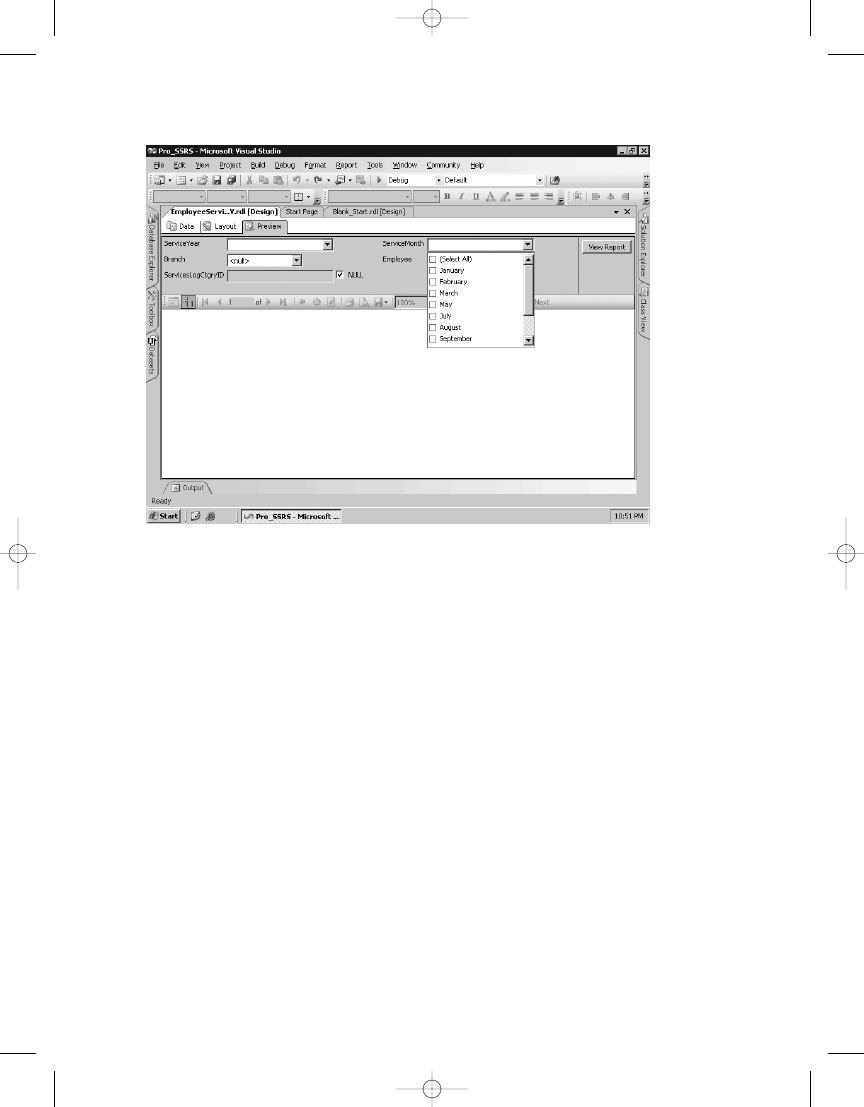
C H A P T E R 4
■
B U I L D I N G R E P O RT S
118
Figure 4-26.
Multiple parameter selection
Because the values for the MVP will be returned as a string—taking the year, for example,
as “2003,3004”—this will not work with the stored procedure logic that you have defined. You
will need to modify the stored procedure to use the IN clause so that the value will be equiva-
lent to the following expression:
WHERE
1=Case
When Cast(DatePart(YYYY,ChargeServiceStartDate) as varchar(20)) in (@Year)
End
The problem here is that the variable @Year will be evaluated as a string and not an
integer as it is defined in the stored procedure. If you were to select a single value—2003, for
example—this would be fine because SQL would correctly evaluate the single value within the
IN
clause. SSRS, however, when multiple values or Select All is chosen, passes a string such as
“2002,2003,2004,2005”. When evaluated within the stored procedure, the query will fail. You
need to first change the datatype of Year and Month to be a character or string value. So, you will
choose varchar(20) for your stored procedure and parse out the values as they are passed in.
Using varchar(20) will allow you to select a wide enough range to cover the Year and Month
value strings.
The best way to parse the string as it is returned from the report is another decision you
must make both for performance and versatility. You have two effective methods for doing this,
either dynamic SQL or a UDF. Creating dynamic SQL, which is essentially building a variable
leng-
4983ch04.qxd 10/7/05 11:06 AM Page 118

C H A P T E R 4
■
B U I L D I N G R E P O RT S
119
ing. Wrapping SQL statements within quotes and programmatically concatenating variables is
time-consuming and often frustrating, yielding unpredictable results. What is worse is that it
opens itself up to SQL injection hacks where users can interject values as strings that may exe-
cute statements that the developer did not intend. The best way to handle string values for MVPs
is through a UDF to parse the individual values and feed these into the IN clause of the query.
Knowing that the values will always be returned in a comma-separated string makes loading
the values into an accessible table much easier by using a function designed for this purpose.
This type of function is called a table-valued function, because the parsed rows of the input
string are loaded into a table that can then be referenced as a subquery in the calling stored
procedure. Let’s take a look at a parsing function that you will use in your stored procedure
while working with MVPs. Listing 4-4 defines the UDF called fn_MVParam. This function is in
the Pro_SSRS database that you have been using.
Listing 4-4. fn_MVParam
, String-Parsing Function
CREATE FUNCTION dbo.fn_MVParam(@RepParam nvarchar(4000), @Delim char(1)= ',')
RETURNS @Values TABLE (Param nvarchar(4000))AS
BEGIN
DECLARE @chrind INT
DECLARE @Piece nvarchar(4000)
SELECT @chrind = 1
WHILE @chrind > 0
BEGIN
SELECT @chrind = CHARINDEX(@Delim,@RepParam)
IF @chrind > 0
SELECT @Piece = LEFT(@RepParam,@chrind - 1)
ELSE
SELECT @Piece = @RepParam
INSERT @Values(Param) VALUES(@Piece)
SELECT @RepParam = RIGHT(@RepParam,LEN(@RepParam) - @chrind)
IF LEN(@RepParam) = 0 BREAK
END
RETURN
END
This function, when called from your Emp_Svc_Cost_MVP stored procedure, will return the
parsed values from SSRS’s multivalued parameter selection and allow you to use this as crite-
ria for selecting data to include in the report. The key point of this function is that it uses
several T-SQL functions itself, such as CHARINDEX, LEN, and LEFT, to populate the @Values table
with the individual items from your report parameter string. The following modification to
the base Emp_Svc_Cost stored procedure, as shown in Listing 4-5, will be required to make the
Emp_Svc_Cost_MVP
stored procedure effectively work with the MVPs.
Listing 4-5.
Modification to WHERE Clause for MVP
1=Case
When Cast(DatePart(YYYY,ChargeServiceStartDate)
4983ch04.qxd 10/7/05 11:06 AM Page 119
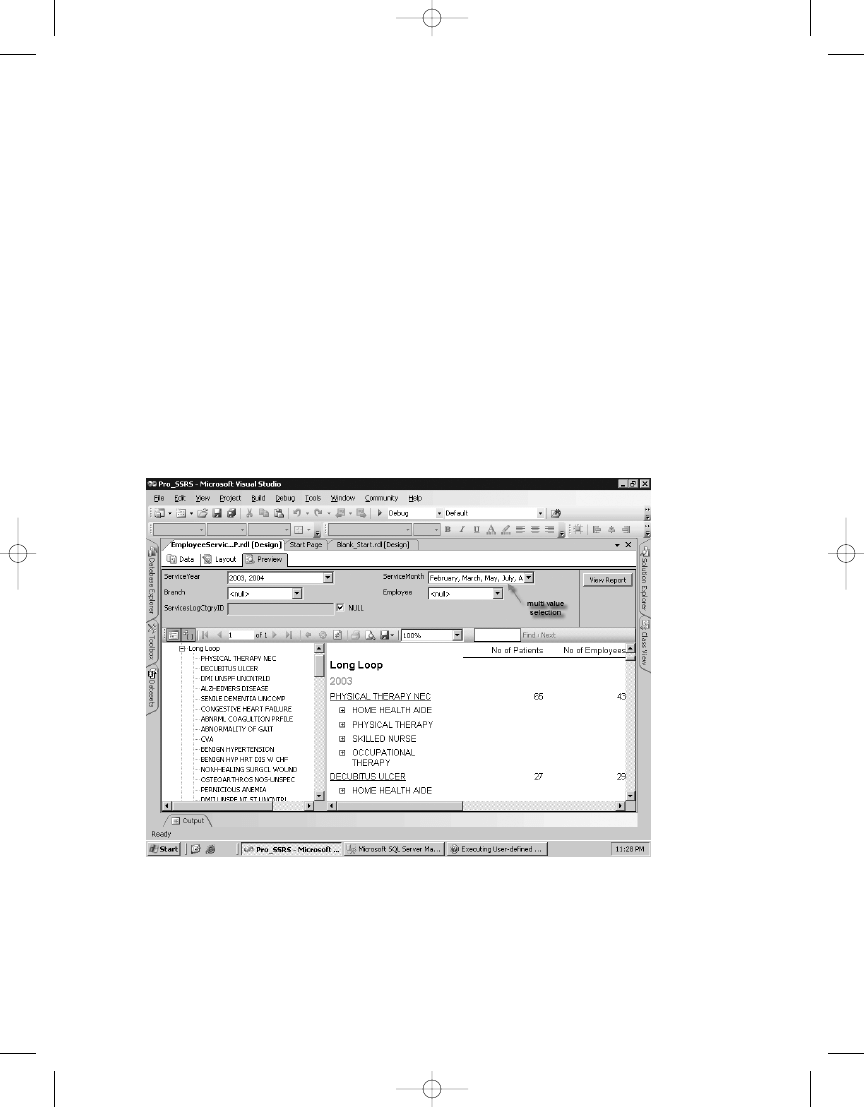
C H A P T E R 4
■
B U I L D I N G R E P O RT S
120
Figure 4-27.
Report generated with multiple selection criteria
else 0
End
AND
1=Case
When Cast(DatePart(MM,ChargeServiceStartDate)
as varchar(20)) IN (select Param from fn_MVParam(@ServiceMonth,',' )) then 1
else 0
END
Notice that instead of saying IN (@Year), for example, which will not work, you are calling
your function fn_MVParam. The function takes two values, the string and the delimiter. In this
case, you are using a comma as the delimiter.
When the report is run and the new function is called, you can see that you can select
one, two, any combination, or all values from the populated drop-down, and you know that
your stored procedure will effectively handle the parsing, evaluating, and criteria to deliver
only the data that you want to see in the report, as shown in Figure 4-27.
The completed report for multivalued parameters in the Pro_SSRS project is called
EmployeeServiceCost_MVP.rdl
.
4983ch04.qxd 10/7/05 11:06 AM Page 120

C H A P T E R 4
■
B U I L D I N G R E P O RT S
121
Summary
It seems as if we have covered much ground in the actual design of a reporting solution with
SSRS. However, at the same time, we have only scratched the surface of getting to the raw power
and flexibility of SSRS. We have yet to show how to interweave custom assemblies to perform
specific functions that go beyond basic expressions. You will also be working with other data
regions in other parts of the book that we have not touched on here. Additionally, you have
been working with only a small number of reports in this chapter; often in a business, espe-
cially when facing migrating existing reports to SSRS, you will be working with many reports
simultaneously. Deploying, administering, and securing these reports are going to become
critical next steps.
Luckily, a robust and flexible design environment is only one component of SSRS. In the
upcoming chapters, you will deploy, secure, and analyze the performance of the reports you
are designing here, using a variety of methods.
4983ch04.qxd 10/7/05 11:06 AM Page 121

4983ch04.qxd 10/7/05 11:06 AM Page 122

Using Custom .NET Code
with Reports
S
SRS 2005 offers software developers a variety of options when it comes to customizing
reports through code. These options give software developers the ability to write custom func-
tions using .NET code that can interact with report fields, parameters, and filters in much the
same way as any of the built-in functions. To give just two examples, you can create a custom
function that does the following:
Implements a business rule and returns true or false based on the logic: You can use such
a function as part of an expression to change the value or style of a field based on the fields
or parameters passed to the function.
Reads data from sources not otherwise available to SSRS 2005 directly: You can do this by
having your custom code read data directly from the source. In this chapter, you will
examine how to read data from an XML file. The sample code for this chapter also includes
an example of reading data from a Web service. Although we won’t cover it in this chapter,
with SSRS 2005 you can also create custom extensions that will allow you to view data in
the Report Designer as a data source.
In short, using custom .NET code gives developers the ability to extend the capabilities of
SSRS 2005 far beyond those that are available out of the box.
This chapter will cover the following:
Custom code for use within your report using code embedded in the report: This method is
the simplest way to add custom code to your report, and it deploys along with your report
since it is contained in the RDL. However, it limits what you can do, must be written in VB
.NET, and offers limited debugging support.
Custom code for use within your report using a custom assembly called by the report: This
method is more involved to implement and more difficult to deploy, but it offers you nearly
unlimited flexibility. Your custom code has the full power of the .NET Framework at its
disposal and has the added benefit that you can use the custom assembly across multiple
reports. You can also use the full debugging capabilities of Visual Studio while developing
your custom assembly.
123
C H A P T E R 5
■ ■ ■
4983ch05.qxd 10/7/05 11:08 AM Page 123

C H A P T E R 5
■
U S I N G C U S TO M . N E T C O D E W I T H R E P O RT S
124
Generally, you will add custom code to your report when you need to perform complex
functions and you need the capabilities of a full programming language to accomplish them.
However, before you embark on writing custom .NET code, you should first evaluate whether
using the built-in expression functionality can meet your needs.
Using Embedded Code in Your Report
Using embedded code is by far the easiest way to implement custom .NET code in your reports,
for two main reasons. First, you simply add the code directly to the report using the Report
Designer’s user interface (UI) in either BIDS or Visual Studio. Second, this code becomes a seg-
ment within the report’s RDL file, making its deployment simple because it is a part of your
report and will be deployed with it.
Although it is easier to use, embedded code does have a few considerations that you should
take into account:
Embedded code must be written in VB .NET: If you are a C# programmer or use some other
.NET-compatible language as your primary development language, this may force you to
use the custom assembly for all but the simplest of functions.
All methods must be instance based: This means the methods will belong to an instantiated
instance of the Code object and you cannot have static members.
Only basic operations are available: This is because, by default, code access security will
prevent your embedded code from calling external assemblies and protected resources.
You could change this through SSRS 2005 security policies, but this would require grant-
ing FullTrust to the report expression host, which would grant full access to the CLR and
is definitely not recommended. If you need these capabilities, use custom assemblies so
you can implement security policies to grant each assembly only the security it needs. You
will look at custom assemblies and how to set security for them in the “Deploying a Custom
Assembly” section.
Before you run the included examples, make sure to read the ReadMe.htm file included with
the sample code for this chapter. It is located in a file in the samples root folder. If you have the
code open in Visual Studio, it will be under the Solution Items folder. It contains setup and
configuration steps that are required before running the examples.
Let’s take a look at how this feature of SSRS 2005 works by adding some embedded code to
one of the reports you have already created. In this case, start with the sample Employee Service
Cost report included with this chapter. It is a slightly modified version of the Employee Service Cost
report you created in Chapter 4. We will show you how to use the embedded code feature to add
a function that will determine whether you have exceeded a certain number of visits for a patient
in a given time period. You will then use that function to determine the color of one of the
text fields in the report to help draw attention to those specific patients.
4983ch05.qxd 10/7/05 11:08 AM Page 124

C H A P T E R 5
■
U S I N G C U S TO M . N E T C O D E W I T H R E P O RT S
125
■
Note
In this chapter’s example, we’ll use a slightly modified version of the report created in Chapter 4 so
that the employee report parameter will include an employee with patients who have exceeded the maximum
number of visits. We’ve also set defaults for the report parameters to make sure the results included this
patient.
Using the ExceedMaxVisits Function
Listing 5-1 is the full listing of the custom code that you will add to the Employee Service Cost
report. It is a simple function, called ExceedMaxVisits, which determines whether a patient
has exceeded a certain number of visits over some period of time. This allows you to identify
cases for review to determine why they have such a high utilization of services.
Listing 5-1.
The ExceedMaxVisits Function
Function ExceedMaxVisits(ByVal visitCount As Integer, ➥
ByVal visitMonth As Integer, ➥
ByVal visitYear As Integer) As Boolean
' Our businesses logic dictates that we need to know whether
' we exceed 240 visits per patient per visitYear
' or 20 visits per patient per visitMonth
If (visitMonth = Nothing And visitYear <> Nothing) Then
If visitCount > 240 Then
Return True
End If
ElseIf (visitMonth <> Nothing) Then
If visitCount > 20 Then
Return True
End If
End If
Return False
End Function
If you are following along with the code in the book, you will need to create a new Visual
Studio 2005 BI project, as shown in Figure 5-1. If you don’t have Visual Studio 2005 installed,
you can create this first project in BIDS. For this example, call the solution Chapter 5 and the
project Reports.
4983ch05.qxd 10/7/05 11:08 AM Page 125
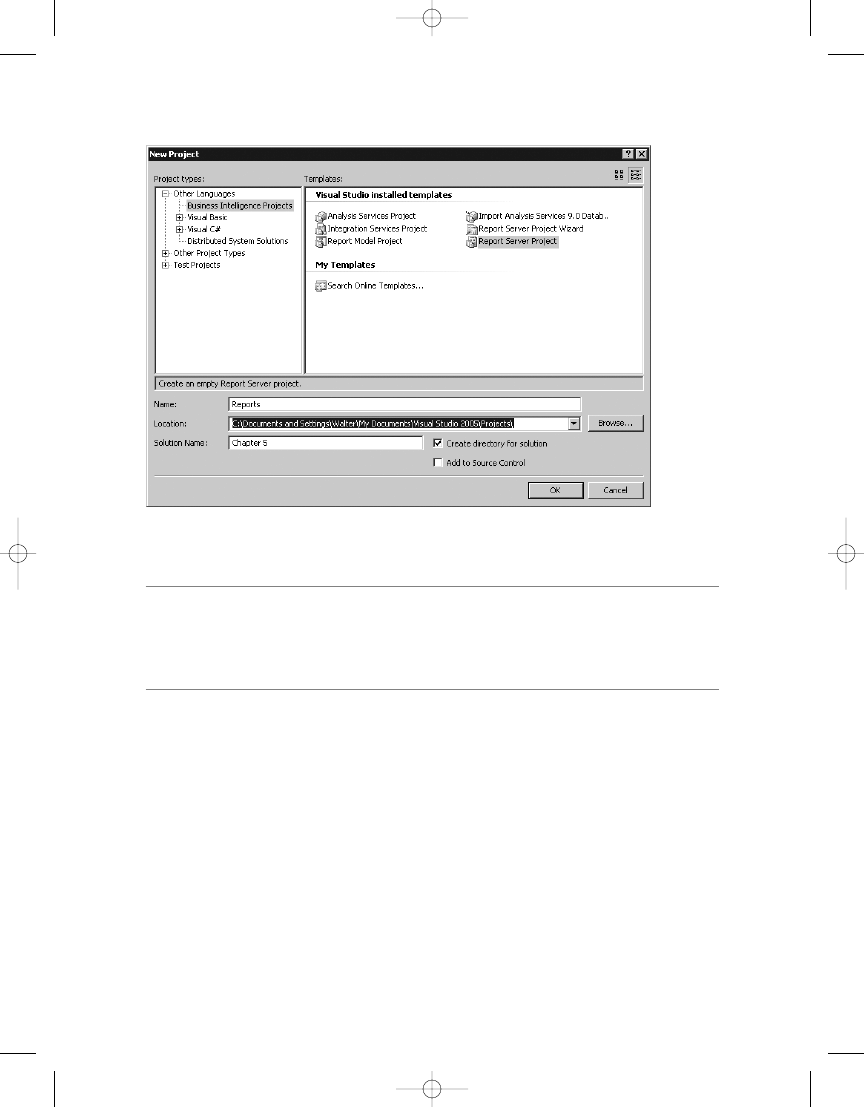
C H A P T E R 5
■
U S I N G C U S TO M . N E T C O D E W I T H R E P O RT S
126
■
Note
For those of you who are not familiar with Visual Studio 2005 and/or BIDS, they are essentially the
same IDE except Visual Studio 2005 adds full programming language support such as C# and VB .NET as
well as other software development tools. Also note that both organize individual projects into solutions so
you can keep related projects together.
To add the existing EmployeeServiceCost-NoCode.rdl file to your new project, right-click the
Reports project, and select Add ➤ Existing Item, as shown in Figure 5-2. Alternatively, with
the Reports project highlighted, select Project ➤ Add Existing Item from the menu. Next,
browse to the location where you installed the Chapter 5 samples, and select
EmployeeServiceCost-NoCode.rdl
. You will also need to add the shared data source by adding
an existing item and picking the Pro_SSRS.rds file.
Figure 5-1.
Creating a Visual Studio BI project
4983ch05.qxd 10/7/05 11:08 AM Page 126
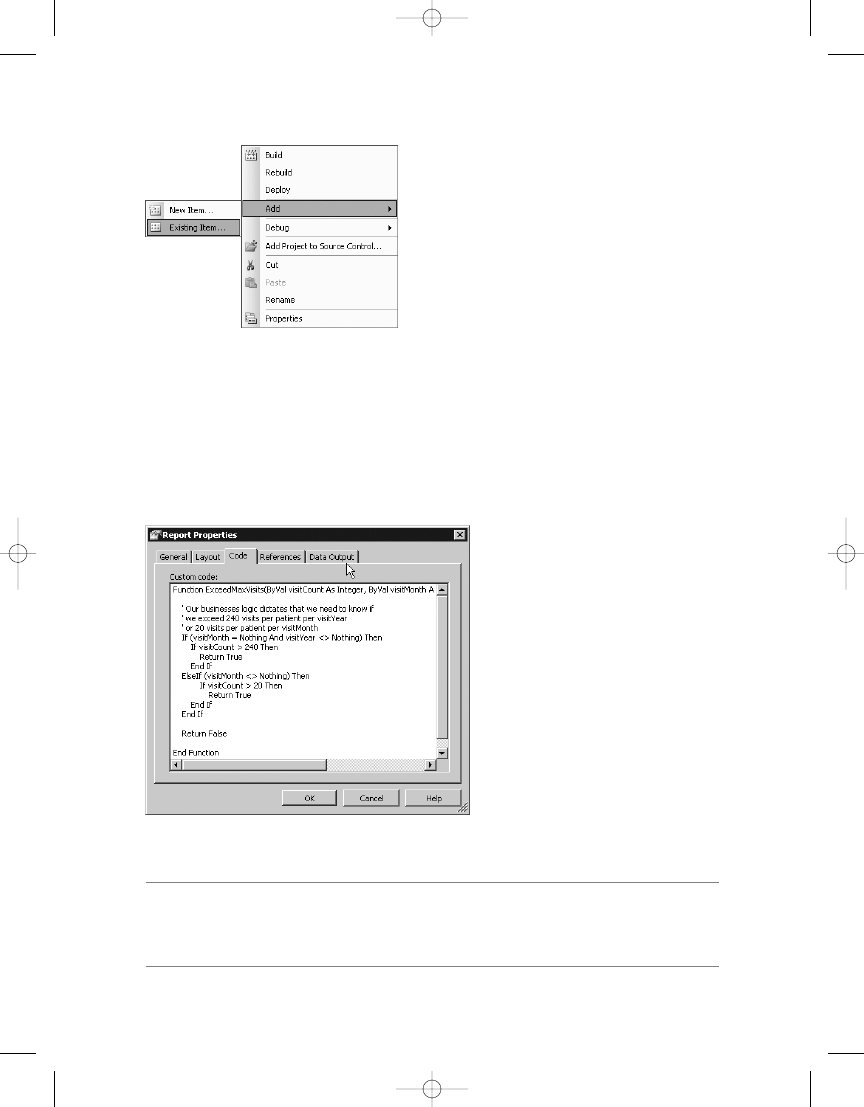
C H A P T E R 5
■
U S I N G C U S TO M . N E T C O D E W I T H R E P O RT S
127
Figure 5-2.
Adding EmployeeServiceCost-NoCode.rdl to your project
Figure 5-3.
Entering embedded code in the custom code editor
To add the code from Listing 5-1 to the Employee Service Cost report, first open the report
by double-clicking it or by right-clicking it and selecting Open in the Solution Explorer. Next,
with the report on the Layout tab, select Report Properties from the Visual Studio Report
menu; alternatively, right-click within the report design area, and select Properties. On the
Report Properties dialog box’s Code tab, add the code from Listing 5-1 to the Custom Code
box, as shown in Figure 5-3.
■
Note
You must enter the function declaration (the first line) as a single line in the embedded code editor,
or you will receive an error when you try to preview the report. In Listing 5-1, it is shown with returns but
should be entered into the embedded code editor without them.
4983ch05.qxd 10/7/05 11:08 AM Page 127

Now that you have defined your custom code, you’ll want to use it to highlight the
patients who have exceeded the maximum visit count. To do this, you need to access the
ExceedMaxVisits
method as part of an expression.
Methods in embedded code are available through a globally defined Code member. When
a report’s RDL file is compiled into a .NET assembly (at publish time), SSRS 2005 creates
a global member of the class called Code that you can access in any expression by referring to
the Code member and method name, such as Code.ExceedMaxVisits.
Listing 5-2 shows how to use a conditional expression in the Color property of a textbox to
set the color of the text depending on the return value of the function call.
Listing 5-2.
Using a Conditional Expression
=iif(Code.ExceedMaxVisits(Sum(Fields!Visit_Count.Value),
Parameters!ServiceMonth.Value,Parameters!ServiceYear.Value),
"Red", "Black")
The method ExceedMaxVisits determines whether the patient has had more visits in the
time span than allowed and returns true if so or false if not. Using a Boolean return value
makes it easy to use the method in formatting expressions, because the return value can be
tested directly instead of comparing the returned value to another value.
When a patient exceeds the maximum visits allowed, ExceedMaxVisits returns true,
which sets the value of the textbox Color property to Red, which in turn will cause the report to
display the text in red. If the patient has not exceeded the allowable number of visits, then
ExceedMaxVisits
returns false, and the Color property is set to Black.
Using the ExceedMaxVisits Function in a Report
Now we’ll walk you through how to actually add this expression to the report. First, select the
field in the report to which you want to apply the expression. In this case, select the patient
name textbox, as shown in Figure 5-4.
C H A P T E R 5
■
U S I N G C U S TO M . N E T C O D E W I T H R E P O RT S
128
4983ch05.qxd 10/7/05 11:08 AM Page 128
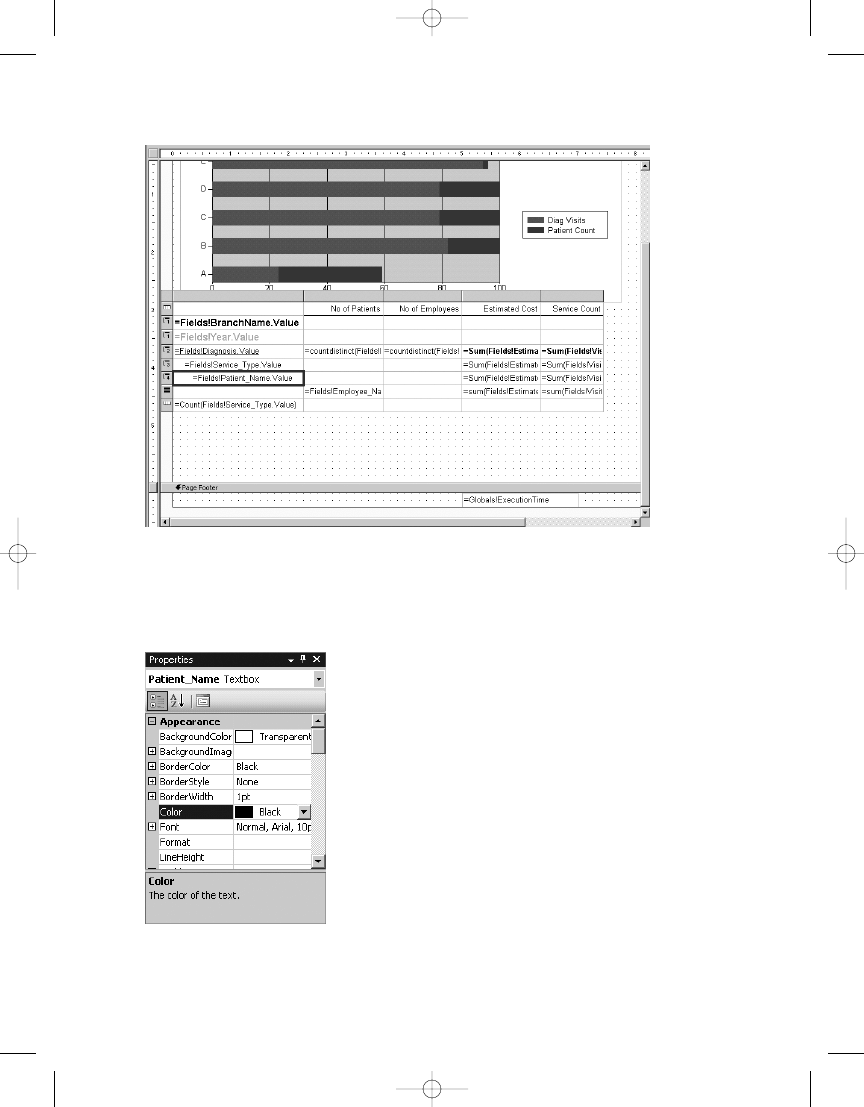
C H A P T E R 5
■
U S I N G C U S TO M . N E T C O D E W I T H R E P O RT S
129
Second, with the textbox selected, go to the Properties window, and select the Color prop-
erty (see Figure 5-5).
Figure 5-4.
Adding the expression to the report
Figure 5-5. Color
property in the Properties window
4983ch05.qxd 10/7/05 11:08 AM Page 129
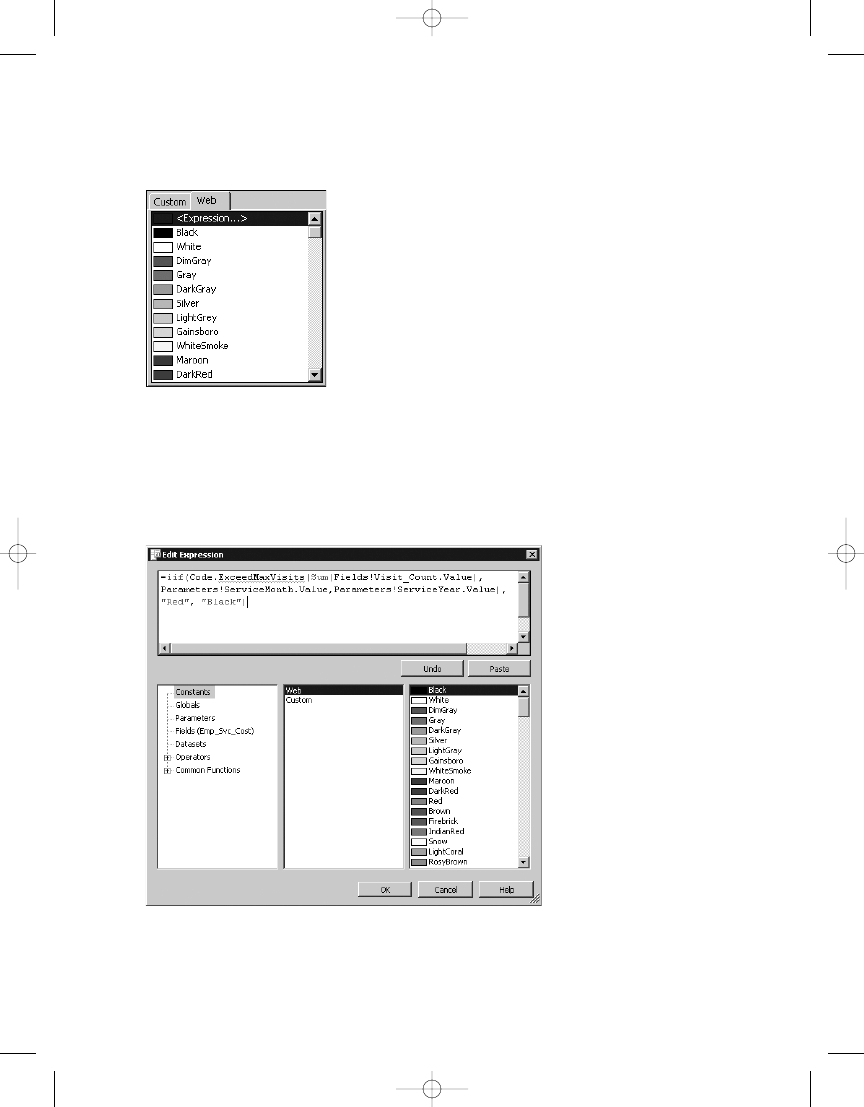
Next, click the down arrow, and from the list select Expression (see Figure 5-6).
C H A P T E R 5
■
U S I N G C U S TO M . N E T C O D E W I T H R E P O RT S
130
Now you will see the Edit Expression dialog box, as shown in Figure 5-7. Enter the expres-
sion using your custom code here. You can just type the expression in, or you can use the
expression editor to insert the parameters that you need into your expression.
You can now run your report, and the patient name will be displayed in red or black
eport.
Figure 5-6.
Color selection list
Figure 5-7.
Entering an expression in the expression editor
4983ch05.qxd 10/7/05 11:08 AM Page 130
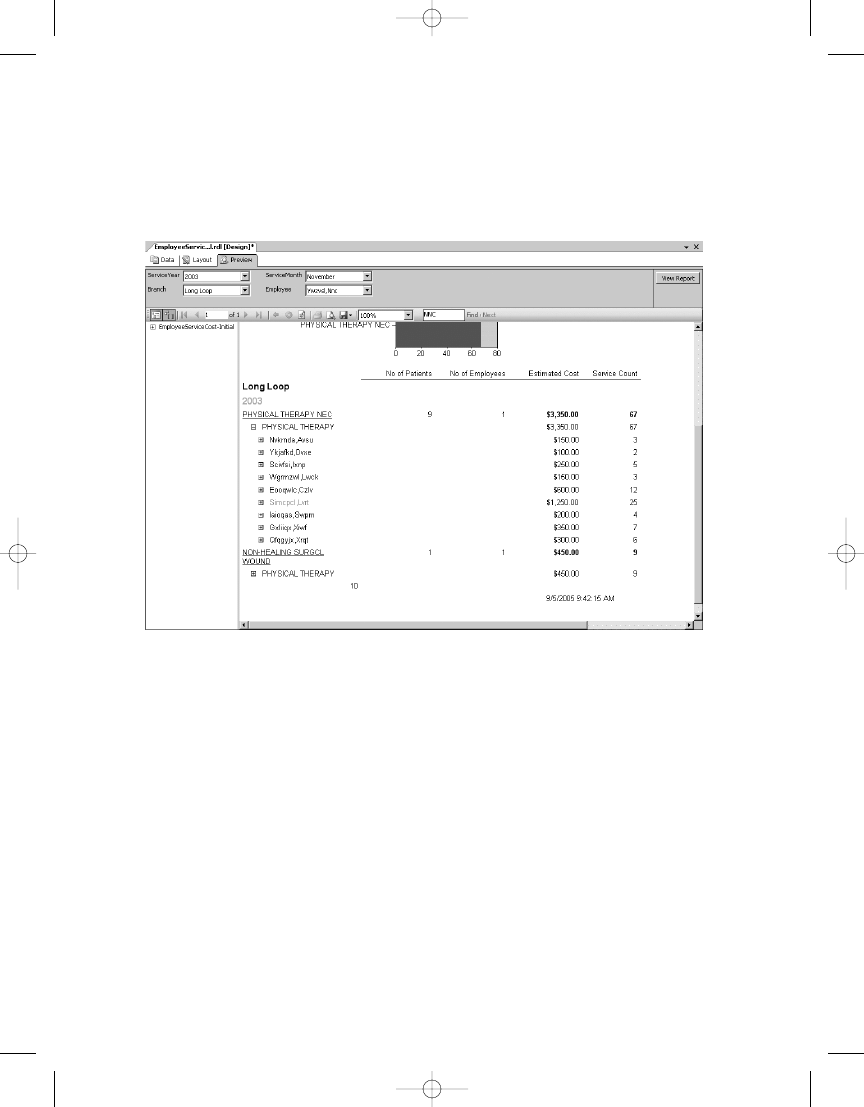
C H A P T E R 5
■
U S I N G C U S TO M . N E T C O D E W I T H R E P O RT S
131
Now that you have modified the report to use the ExceedMaxVisits function, you can pre-
view the report to see it in action. To do this, select the Preview tab, and select ServiceYear
2003, Branch Long Loop, Service Month November, and Employee Ywzvsl, Nnc. You should
now see a report that looks similar to Figure 5-8.
Accessing .NET Assemblies from Embedded Code
The Code element of the report was primarily designed for basic use of the .NET Framework
and VB .NET language syntax. Access to many of the framework namespaces is not included
by default in the Code element. Referencing many of the standard .NET assemblies in your
embedded custom code requires that you create a reference to it in the report. To do this, go to
the References tab of the Report Properties dialog box, click the ellipsis by the References:
Assembly name grid, and then select the appropriate assembly you want to reference. Note
that, by default, these referenced assemblies will have only Execution permission.
Although it is possible to use other .NET Framework assemblies and third-party assemblies
directly within the Code element of the report, as just described, it is highly recommended that
you consider using a custom assembly instead. One of the primary reasons for this is security.
By default, the Code element runs with Execution permission only, which means it can run but
cannot access protected resources. If you need to perform certain protected operations, such
as reading data from a file, you’ll have to set the security policy for the code group named
Report_Expressions_Default_Permissions
to FullTrust. This code group controls permissions
for the report expression host assembly, which is an assembly that is created from all the
t of the compiled report. To set the security
Figure 5-8.
Report with the embedded code
4983ch05.qxd 10/7/05 11:08 AM Page 131

C H A P T E R 5
■
U S I N G C U S TO M . N E T C O D E W I T H R E P O RT S
132
policy, you need to edit the policy configuration files of the report server and the Report
Designer. See the “Deploying a Custom Assembly” section later in this chapter for the stan-
dard location of these files.
But making this change to the security policy is not recommended. When you change the
permissions for the code that runs in the Code element, you also change the permissions for all
reports that run on that report server. By changing permissions to FullTrust, you enable all
expressions used in reports to make protected system calls. This will essentially give anyone
who can upload a report to your report server complete access to your system.
If you need to use features outside the VB .NET language syntax, need additional security
permissions, have complicated logic to implement, need to use more of the .NET Framework,
or want to use the same functionality within multiple reports, then you should move your code
into a custom assembly. You can then reference that assembly in your report and use the code
through methods and properties of your custom class. Not only does a custom assembly allow
you a lot more flexibility in the code itself, it also allows you to control security at a much more
granular level. With a custom assembly, you can add a permission set and code group for your
custom code just to that specific assembly without having to modify the permissions for all
code that runs in the Code element.
You’ll want to use custom assemblies for another reason. With embedded code, you do
not have the benefit of developing the Code section of your report using the full Visual Studio
IDE with features such as IntelliSense and debugging at your disposal. Writing code in the Code
section of your report is not much different from working in Notepad.
However, you can work around this. If the code you choose to place in the Code element is
more than just a few simple lines of code, it can be easier to create a separate project within
your report solution to write and test your code. A quick VB .NET Windows Forms or console
project can provide the ideal way to write the code you intend to embed in your report. You
get the full features of the IDE, and once you have the methods working the way you want, you
can just paste them into the code window of the report. Remember to use a VB .NET project,
since the Code element works only with code written in VB .NET.
Using Custom Assemblies with Your Report
Custom assemblies are harder to implement but offer you greater flexibility than embedded
code. The process of creating them is a bit more involved because they are not part of the
report’s RDL and must be created outside the Report Designer. This also makes them more
difficult to deploy because, unlike the embedded code, which becomes a part of the report’s
RDL, the custom assembly is a separate file.
However, your hard work is repaid in many ways:
Code reuse: You can reuse custom code across multiple reports without the need to copy
and paste code into each report. This allows you to centralize all the custom logic into
a single location, making code maintenance much simpler.
Task separation: Using assemblies allows you to more easily separate the tasks of writing
a report from creating the custom code. This is somewhat similar in concept to writing an
ASP.NET application using the code-behind feature. This allows ASP.NET developers to
separate the page markup, layout, and graphics from the code that will interact with it. If
you have several people involved, you can let those who specialize in report writing handle
the layout and creation of the report while others who may have more coding skills write
4983ch05.qxd 10/7/05 11:08 AM Page 132

C H A P T E R 5
■
U S I N G C U S TO M . N E T C O D E W I T H R E P O RT S
133
Language neutrality: You can use the .NET language of your choice. Choose from C#, VB,
J#, or any third-party language that is compatible with the .NET Framework.
Productive development environment: If you use Visual Studio 2005 to develop your cus-
tom assemblies, you get the full power of its editing and debugging features.
Security control: You can exercise fine-grained control over what your assembly can do
using security policies.
To use a custom assembly from within your report, you need to create a class library to
hold the code, add the methods and properties you want to use from the report to your class,
and then compile it into an assembly. To use it from within the Report Designer, you can add
a class library project to the solution in Visual Studio, allowing you easy access to both the
report and the code you will use in it. Note that you must be using Visual Studio 2005 and
not just BIDS for this project. Before you run the included examples, make sure to read the
ReadMe.htm
file in the solution’s Solution Items folder to see whether any steps are required
before running the examples for your particular configuration.
Adding a Class Library Project to Your Reporting Solution
To use a custom assembly with your report, you will first need to write your custom code in
the form of a .NET class. You can do this by adding a class library project to your existing solu-
tion so that you can work on the report and custom code at the same time.
For this example, you want to display the amount an employee is paid for a visit to
a patient. The class will get this information from an XML file that is periodically exported
from the human resources (HR) system.
■
Note
If possible, you would want to get this information directly from the HR system, possibly through
a Web service. The sample code included with this chapter includes a sample Web service and a method to
call it.
Using the XML file EmployeePay.xml (supplied as part of the code download for this chapter)
in this example allows you not only to write a custom assembly but also to see the steps neces-
sary to access a protected resource such as a local file. To get the information from the XML file
and make it available to your report, create a class with a method that takes EmployeeID and
a date as a parameter and that will read the employee pay per visit rates from the XML file and
then return the pay rate. Although we will not cover it step by step in this chapter, the sample
code included also contains an example of doing the same thing using a Web service. This
allows you to simulate being able to interact with the HR system via a Web service instead of an
exported file.
You can then reference the assembly from an expression in the report and use it to calcu-
late the total visiting costs per patient.
To start, select File ➤ Add Project ➤ New Project from the menu. Pick Visual Basic Projects
or Visual C# Projects, depending on your preference. Select Class Library, and enter Employee
for the name of the project. In this example, we will show you how to use a Visual C# class
library project, as shown in Figure 5-9.
4983ch05.qxd 10/7/05 11:08 AM Page 133
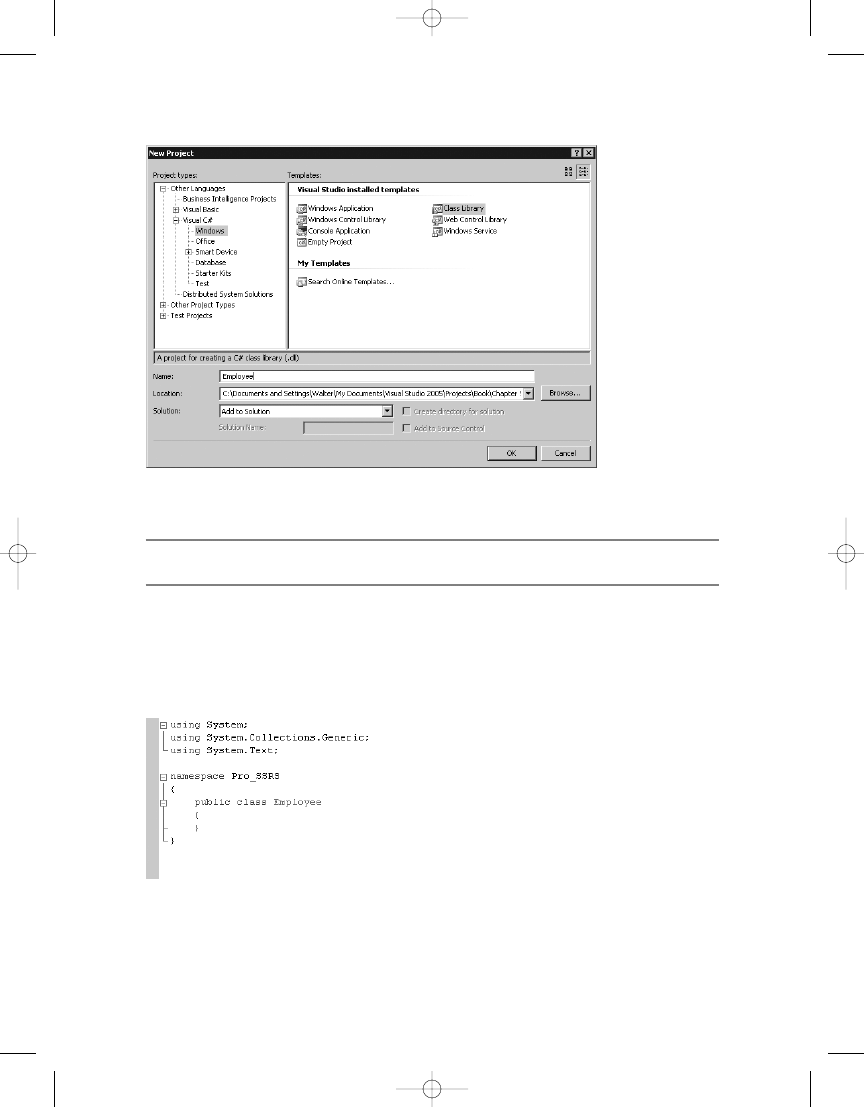
C H A P T E R 5
■
U S I N G C U S TO M . N E T C O D E W I T H R E P O RT S
134
■
Note
Make sure to select Add to Solution instead of Create New Solution in the Solution drop-down list.
Select Class1.cs, and rename it to something a bit more descriptive, such as Employee,
because you will use this class to calculate the cost of a visit provided by the employees. Open
the Employee.cs file in the Visual Studio 2005 IDE, change the namespace from Employee to
Pro_SSRS, and you will see the code editor, as shown in Figure 5-10.
Figure 5-9.
New Project dialog box
Figure 5-10.
The Visual Studio 2005 code editor
4983ch05.qxd 10/7/05 11:08 AM Page 134

C H A P T E R 5
■
U S I N G C U S TO M . N E T C O D E W I T H R E P O RT S
135
For this example, you’ll add a few using statements to import types defined in other
namespaces. Specifically, you’ll add the System.Data and System.Security.Permissions name-
spaces so you can reference the DataSet and SecurityAction methods without typing in the
full namespace in the Employee assembly, as shown in Listing 5-3.
Listing 5-3.
The Employee Assembly
using System;
using System.Collections.Generic;
using System.Text;
using System.Security.Permissions;
using System.Data;
namespace Pro_SSRS
{
public class Employee
{
public Employee()
{
}
[PermissionSetAttribute(SecurityAction.Assert, Unrestricted = true)]
public static decimal CostPerVisitXML(string employeeID, DateTime visitDate)
{
DataSet empDS = new DataSet();
empDS.ReadXmlSchema(@"C:\Temp\EmployeePay.xsd");
empDS.ReadXml(@"C:\Temp\EmployeePay.xml");
DataRow[] empRows =
empDS.Tables["EmployeePay"].Select("EmployeeID = '" +
employeeID + "'");
Decimal empAmt;
if (empRows.Length > 0)
{
empAmt = Convert.ToDecimal(empRows[0]["Amount"]);
return empAmt;
}
else
return 0M;
}
}
}
Any assemblies used by the custom assembly must be available both on the computer
being used to design the report and on the SSRS 2005 server itself. Since you are just using
common .NET Framework assemblies, this should not be a problem because the .NET Frame-
work is installed on your local computer as well as on the SSRS 2005 server. If you reference
other custom or third-party assemblies in your custom assembly, you need to make sure they
unning your report.
4983ch05.qxd 10/7/05 11:08 AM Page 135

C H A P T E R 5
■
U S I N G C U S TO M . N E T C O D E W I T H R E P O RT S
136
■
Note
Because this book’s focus is on SSRS 2005 and not on writing code, we won’t explain the code
samples line by line. If you are interested in programming, Apress offers many excellent books for the various pro-
gramming languages that can help you write custom code for SSRS 2005. Refer to
http://www.apress.com
.
To use the Employee assembly in your report, you need to deploy it to the appropriate
location first. In the next section, you will learn how to deploy custom assemblies and set up
the necessary permissions required. Once you have done that, you will return to the report and
use the custom assembly you have created and deployed in the Employee Service Cost report.
■
Note
Remember that each time you make a change to your custom assembly, you must redeploy the
assembly. Also, if you added code that requires additional permissions, you may have to grant them.
Deploying a Custom Assembly
Custom assemblies are more difficult to deploy than code embedded in your report through
the Code element. This is because of the following:
• Custom assemblies are not part of the report itself and must be deployed separately.
• Custom assemblies are not deployed to the same folder as the reports.
• The built-in project deployment method in Visual Studio 2005 will not automatically
deploy your custom assemblies.
• Custom assemblies are granted only Execution permissions by default. Execution
permission allows code to run but not to use protected resources.
To use your custom assemblies with SSRS 2005, you need to take the following steps to
place them in a location where SSRS 2005 can find them and to edit the files that control secu-
rity policy when necessary. The location of the files depends on whether you want to use them
in the Report Designer within BIDS, within Visual Studio, or on the report server.
1.
You need to deploy your custom assemblies to the Report Designer and/or SSRS 2005
applications folder.
• For the Report Designer, the default is C:\Program Files\Microsoft Visual Studio 8\
Common7\IDE\PrivateAssemblies
.
• For SSRS 2005, the default is C:\Program Files\Microsoft SQL Server\MSSQL.n\
Reporting Services\ReportServer\bin
.
4983ch05.qxd 10/7/05 11:08 AM Page 136

C H A P T E R 5
■
U S I N G C U S TO M . N E T C O D E W I T H R E P O RT S
137
■
Note
You need to have the necessary permissions to access these folders. By default, members of the
standard Users group won’t have the necessary write/modify permissions on these folders. Logged in as
a user with the appropriate security permissions, such as the administrator, you can set the permissions on
the folders to allow the necessary access to the folders when you are logged in under a less privileged account.
Alternately, you could move the files to the appropriate folders when logged in or running as a user who has
the necessary permissions.
2.
Next, you need to edit the SSRS 2005 security policy configuration files if your custom
assembly requires permissions in addition to the Execution permission. (For SSRS
2005, the default location is C:\Program Files\Microsoft SQL Server\MSSQL.n\
Reporting Services\ReportServer\rssrvpolicy.config
.)
■
Note
The Report Designer runs custom assemblies with
FullTrust
security, so you may not encounter
security-related issues when you are previewing the reports. However, should changes be required, the default
location of the preview security configuration file is
C:\Program Files\Microsoft Visual Studio 8\
Common7\IDE\PrivateAssemblies\RSPreviewPolicy.config
.
■
Note
The
MSSQL.n
folder will vary depending on the particular installation options you selected when
installing SQL Server 2005. It may be in a folder with a period and number appended to the end of
MSSQL.n
such as
MSSQL.3
. The
MSSQL
folder for the custom assembly and the security policy file will be the same.
For example, if you were writing a custom assembly to calculate an employee’s cost per
visit, you might need to read the pay rates from a file. To retrieve the rate information, you
would need to grant additional security permissions to your custom assembly. To give your
custom assembly FullTrust permission, you can add the XML text shown in Listing 5-4 to the
appropriate CodeGroup section of the rssrvpolicy.config file.
Listing 5-4.
Granting FullTrust Permission to the Custom Assembly
<CodeGroup class="UnionCodeGroup"
version="1"
PermissionSetName="FullTrust"
Name="EmployeePayCodeGroup"
Description="Employee Cost Per Visit">
<IMembershipCondition
class="UrlMembershipCondition"
version="1"
Url="C:\Program Files\Microsoft SQL Server\MSSQL.n\ ➥
4983ch05.qxd 10/7/05 11:08 AM Page 137

C H A P T E R 5
■
U S I N G C U S TO M . N E T C O D E W I T H R E P O RT S
138
Reporting Services\ReportServer\bin\Employee.dll"
/>
</CodeGroup>
■
Note
If you run your report and you see
#Error
text in a textbox instead of the expected result, it is more
than likely a permission problem of some kind.
Because it’s generally not a good idea to grant your assemblies FullTrust unless absolutely
necessary, you can use named permission sets to grant your custom assembly just the permis-
sions it needs rather than FullTrust.
To grant the custom assembly just enough permission to read the data files called
C:\Temp\EmployeePay.xml
and C:\Temp\EmployeePay.xsd, you first need to add a named per-
mission set in the policy configuration file rssrvpolicy.config that grants read permission to
the files. You can then apply the specific permission sets to the custom assembly, as shown in
Listing 5-5.
Listing 5-5.
Named Permission Sets for Reading Files
<PermissionSet
class="NamedPermissionSet"
version="1"
Name="EmployeePayFilePermissionSet"
Description="Permission set that grants read access to my employee cost file.">
<IPermission
class="FileIOPermission"
version="1"
Read="C:\Temp\EmployeePay.xml"
/>
<IPermission
class="FileIOPermission"
version="1"
Read="C:\Temp\EmployeePay.xsd"
/>
<IPermission
class="SecurityPermission"
version="1"
Flags="Execution, Assertion"
/>
</PermissionSet>
Next, as shown in Listing 5-6, you add a code group that grants the assembly the addi-
tional permissions to the CodeGroup section of the policy configuration file
rssrvpolicy.config
.
4983ch05.qxd 10/7/05 11:08 AM Page 138

C H A P T E R 5
■
U S I N G C U S TO M . N E T C O D E W I T H R E P O RT S
139
Listing 5-6.
Granting File I/O Permission on the Employee Assembly
<CodeGroup class="UnionCodeGroup"
version="1"
PermissionSetName=" EmployeePayFilePermissionSet "
Name="EmployeePayCodeGroup"
Description="Employee Cost Per Visit">
<IMembershipCondition class="UrlMembershipCondition"
version="1"
Url="C:\Program Files\Microsoft SQL Server\MSSQL.n\Reporting ➥
Services\ReportServer\bin\Employee.dll"/>
</CodeGroup>
■
Note
The name of the assembly that you add to the configuration file must match the name that is added
to the RDL under the
CodeModules
element. This is the name you set for the custom assembly under the
Report Properties ➤ References menu, which was introduced in the “Accessing .NET Assemblies from
Embedded Code” section; it is discussed in detail in the “Adding an Assembly Reference to a Report” section.
To apply custom permissions, you must also assert the permission within your code. For
example, if you want to add read-only access to the XML files C:\Temp\EmployeePay.xsd and
C:\Temp\EmployeePay.xml
, you must add code similar to that shown in Listing 5-7 to your
method.
Listing 5-7.
Asserting Permission with Code
// C#
FileIOPermission permissionXSD = new
FileIOPermission(FileIOPermissionAccess.Read,
@" C:\Temp\EmployeePay.xml");
permissionXSD.Assert();
// Load the schema file
empDS.ReadXmlSchema(@"C:\Temp\EmployeePay.xsd");
FileIOPermission permissionXML = new
FileIOPermission(FileIOPermissionAccess.Read,
@" C:\Temp\EmployeePay.xml");
permissionXML.Assert();
empDS.ReadXml(@"C:\Temp\EmployeePay.xml");
You can also add the assertion as a method attribute, as shown in Listing 5-8. This is the
method shown in this chapter’s examples.
4983ch05.qxd 10/7/05 11:08 AM Page 139
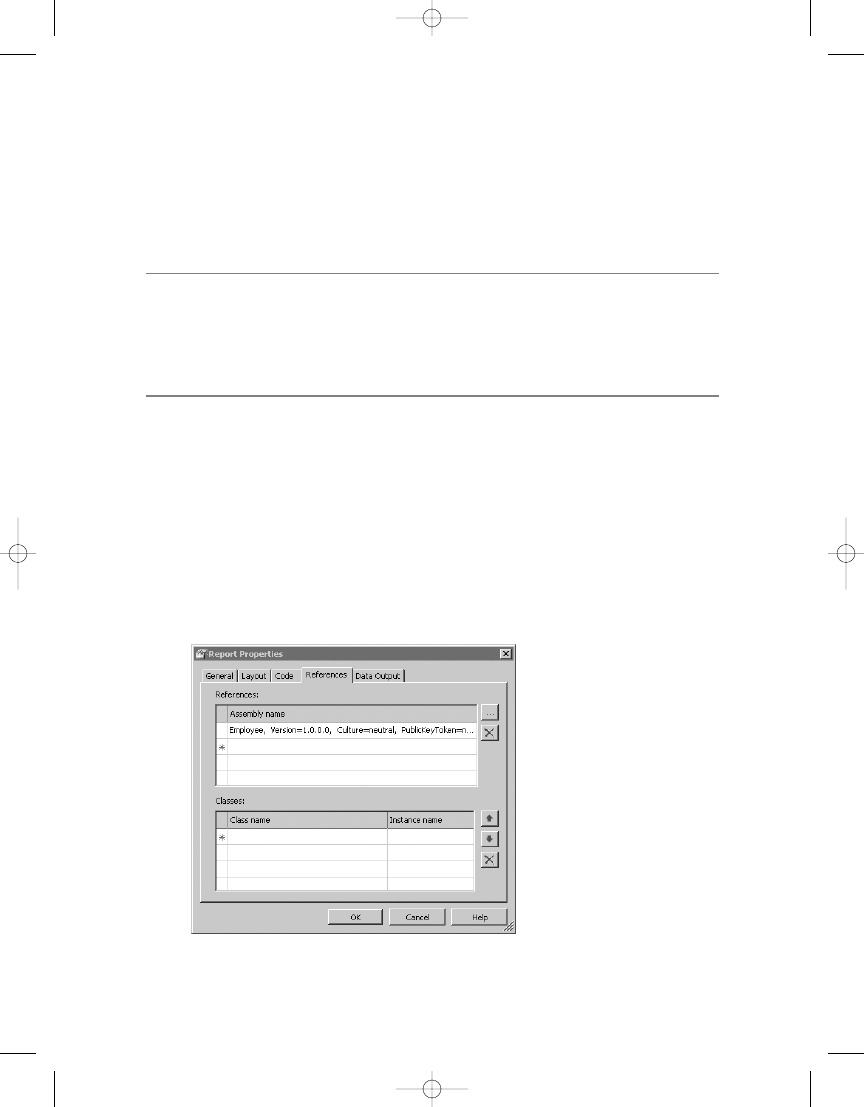
C H A P T E R 5
■
U S I N G C U S TO M . N E T C O D E W I T H R E P O RT S
140
Listing 5-8.
Asserting Permission with a Method Attribute
[FileIOPermissionAttribute(SecurityAction.Assert,
Read=@" C:\Temp\EmployeePay.xsd")]
[FileIOPermissionAttribute(SecurityAction.Assert,
Read=@" C:\Temp\EmployeePay.xml")]
■
Tip
For more information about code access security and reporting services, see “Understanding Code
Access Security in Reporting Services” in the SSRS 2005 Books Online (BOL). For more information about
security, see “.NET Framework Security” in the
.NET Framework Developer’s Guide, available on the Microsoft
Developer Network (MSDN) Web site at
http://msdn.microsoft.com
. You will also want to read about
using the Global Assembly Cache (GAC) to store your custom assembly.
Adding an Assembly Reference to a Report
With the EmployeeServiceCost-NoCode report selected and on the Layout tab, select Report ➤
Report Properties; alternatively, right-click within the report design area, and select Properties.
Then do the following:
1.
In References, click the ellipsis button.
2.
Select the Browse tab, and browse to the Employee.dll assembly from the Add Reference
dialog box. When you are done, the Report Properties dialog box should look like
Figure 5-11.
Figure 5-11.
References tab
4983ch05.qxd 10/7/05 11:08 AM Page 140
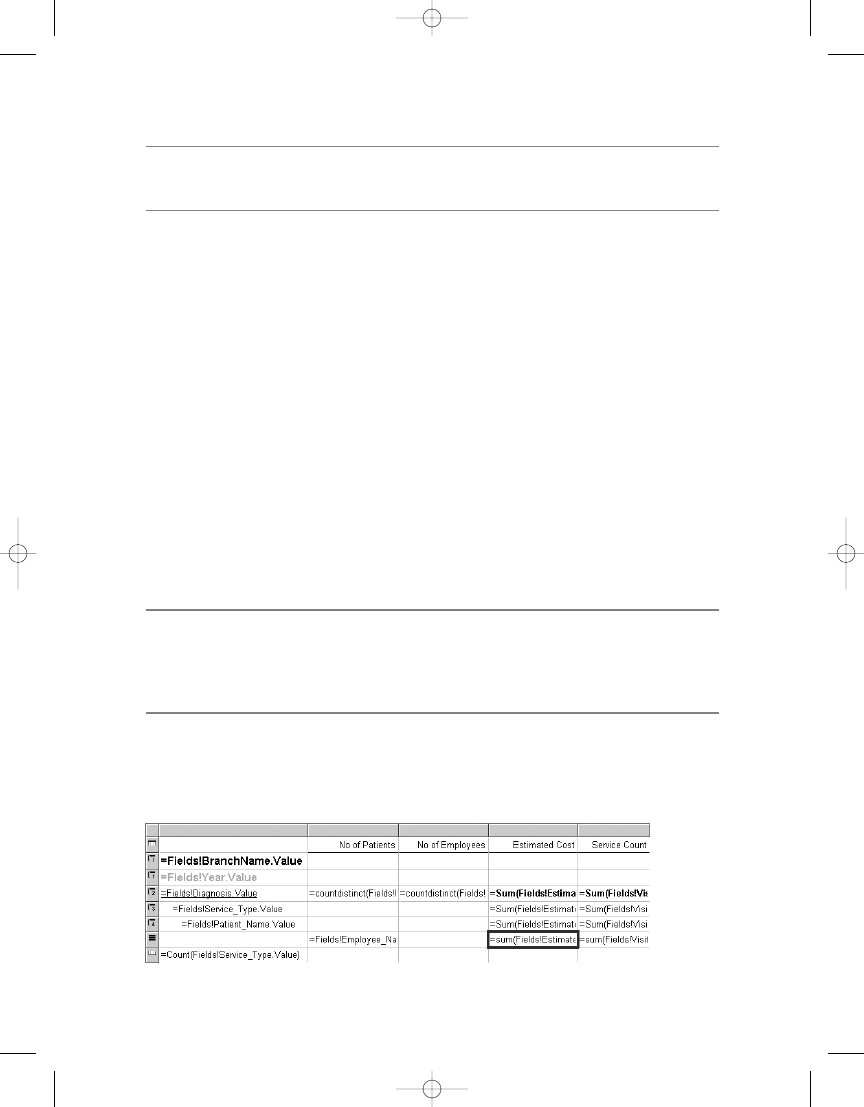
C H A P T E R 5
■
U S I N G C U S TO M . N E T C O D E W I T H R E P O RT S
141
■
Note
The class list on the References tab of the Report Properties dialog box is used only by instance-based
members, not static members.
To use the custom code in your assembly in a report expression, you must call a member
of a class within the assembly. You can do this in different ways depending on how you declared
the method.
If the method is defined as static, it is available globally within the report. You access it in
an expression by the namespace, class, and method name. The following example calls the
static CostPerVisit method in the Employee class, which is in the Pro_SSRS namespace, passing
in an EmployeeID value and the visit date. The method will return the cost per visit for the spec-
ified employee.
=Pro_SSRS.Employee.CostPerVisitXML(empID, visitDate)
If the custom assembly contains instance methods, you must add the class and instance
name information to the report references. You do not need to add this information for static
methods.
Instance-based methods are available through the globally defined Code member. You
access these methods by referring to the Code member and then the instance and method
name. The following shows how you would call the CostPerVisitXML method if it had been
declared as an instance method instead of a static method:
=Code.Employee.CostPerVisitXML(empID, visitDate)
■
Tip
Use static methods whenever possible because they offer higher performance than instance
methods. However, be careful if you use static fields and properties, because they expose their data to all
instances of the same report, making it possible that the data used by one user running a report is exposed
to another user running the same report.
After adding the reference to the Employee custom assembly, you will use it by calling the
CostPerVisitXML
method as a part of an expression in the report. Highlight the Employee_Cost
textbox in the report, as shown in Figure 5-12.
Figure 5-12. Employee_Cost
textbox
4983ch05.qxd 10/7/05 11:08 AM Page 141
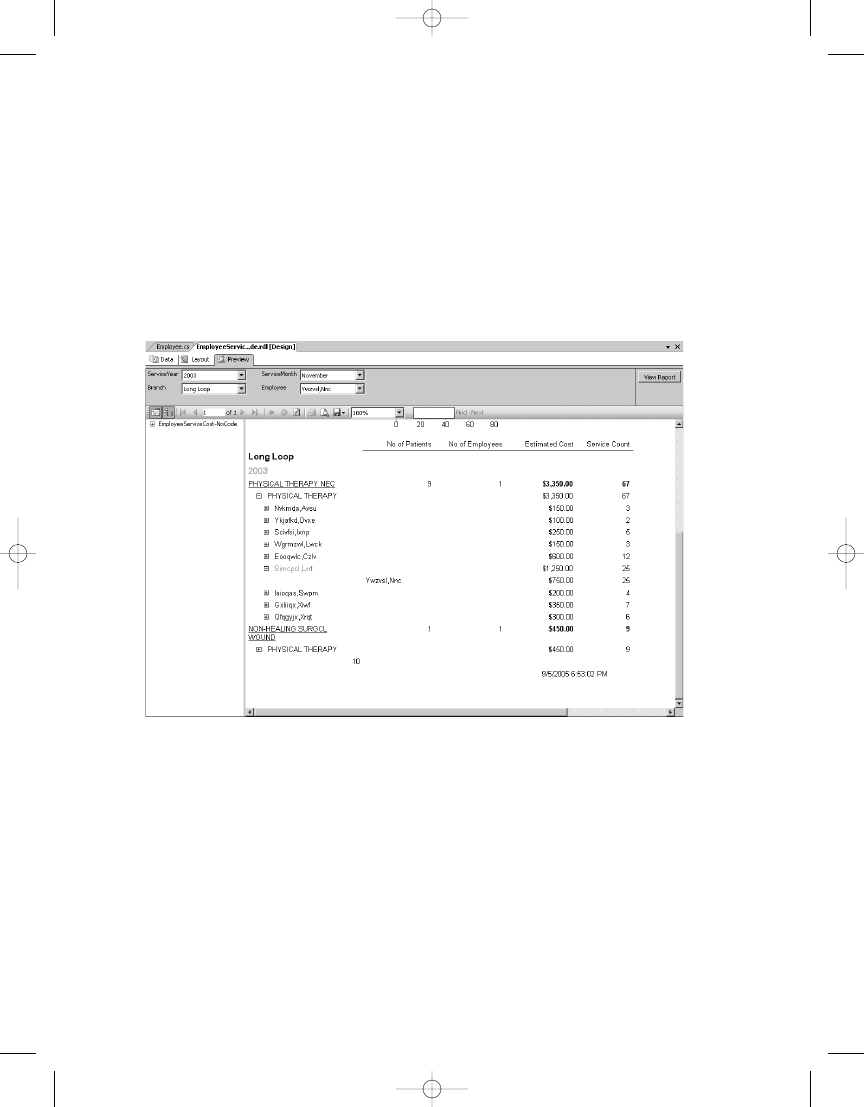
C H A P T E R 5
■
U S I N G C U S TO M . N E T C O D E W I T H R E P O RT S
142
Right-click, select Expression, and in the Edit Expression dialog box enter the code shown
in Listing 5-9.
Listing 5-9.
Using the CostPerVisitXML Method in an Expression
=Pro_SSRS.Employee.CostPerVisitXML(Fields!EmployeeID.Value,
"01/01/2004") * sum(Fields!Visit_Count.Value)
Now if you preview the report or build and deploy it, you should see a report similar to
Figure 5-13.
In the sample code included for Chapter 5, we have also included a Web service that can
be called from the custom code to access the employee pay information. This simulates access-
ing information from another system via a Web service and is designed to allow you to replace
the exported XML file with a call to a Web service. The Employee class included in the sample
code already contains a method called CostPerVisitWS that uses the Web service rather than
the XML file as its source of data. By simply changing the expression from this:
=Pro_SSRS.Employee.CostPerVisitXML(Fields!EmployeeID.Value,
"01/01/2004") * sum(Fields!Visit_Count.Value)
to the following:
=Pro_SSRS.Employee.CostPerVisitWS(Fields!EmployeeID.Value,
Figure 5-13.
Final report
4983ch05.qxd 10/7/05 11:08 AM Page 142

C H A P T E R 5
■
U S I N G C U S TO M . N E T C O D E W I T H R E P O RT S
143
you can make the report use the Web service instead of the XML file. To try this, just open the
sample solution for this chapter, and edit the expression in the Employee_Cost field in the
EmployeeServiceCost.rdl
file. To try the Employee Web Service, you also must publish the Web
site by selecting the Employee Web Service project, right-clicking, and then selecting Publish
Web Site.
We have also included a sample test application that allows you to call the CostPerVisitXML
and CostPerVisitWS methods of the Employee class using a Windows Forms application. This
allows you to exercise the class and step through the code in the Windows Forms environment,
which is easier to test and debug.
■
Tip
Writing a test application is a great way to make sure your custom code is properly performing the
expected functions prior to using the code within your SSRS 2005 report. Not only can you create a custom
Windows Forms application as we did, but with the proper version of Visual Studio 2005 you can create spe-
cialized test code and automated test routines.
Debugging Custom Assemblies
For ease of debugging, the recommended way to design, develop, and test custom assemblies
is to create a solution that contains both your test reports and your custom assembly. This will
allow you easy access to both the report and the code you will use in it at the same time from
within Visual Studio.
■
Note
The Report Preview that is used during debugging does not grant
FullTrust
security to your custom
assembly and may require that you set up appropriate permissions to run your custom assembly. In your
development environment, you may want to grant it
FullTrust
,
which you can do by editing the
RSPreviewPolicy.config
file. The default location of the preview security configuration file is
C:\
Program Files\Microsoft Visual Studio 8\Common7\IDE\PrivateAssemblies\RSPreviewPolicy.
config
. You can use the code shown in Listing 5-4 to grant
FullTrust
if you just change the URL ele-
ment to point to the
Employee.dll
in the
PrivateAssemblies
folder.
We’ll now show how to set up Visual Studio to allow you to debug the Employee assembly
you have just written:
1.
In the Solution Explorer, right-click the solution, and select Configuration Manager.
This will allow you to set the build and deploy options for debugging.
2.
Select DebugLocal as the Active Solution Configuration option.
3.
Make sure the report project in your solution is set to DebugLocal and that Deploy is
unchecked. DebugLocal debugs reports on your local system, rendering the report in
the Preview pane within Visual Studio. If Deploy is checked, it will publish the reports
to the report server instead of running them locally, and you will not be able to debug
4983ch05.qxd 10/7/05 11:08 AM Page 143
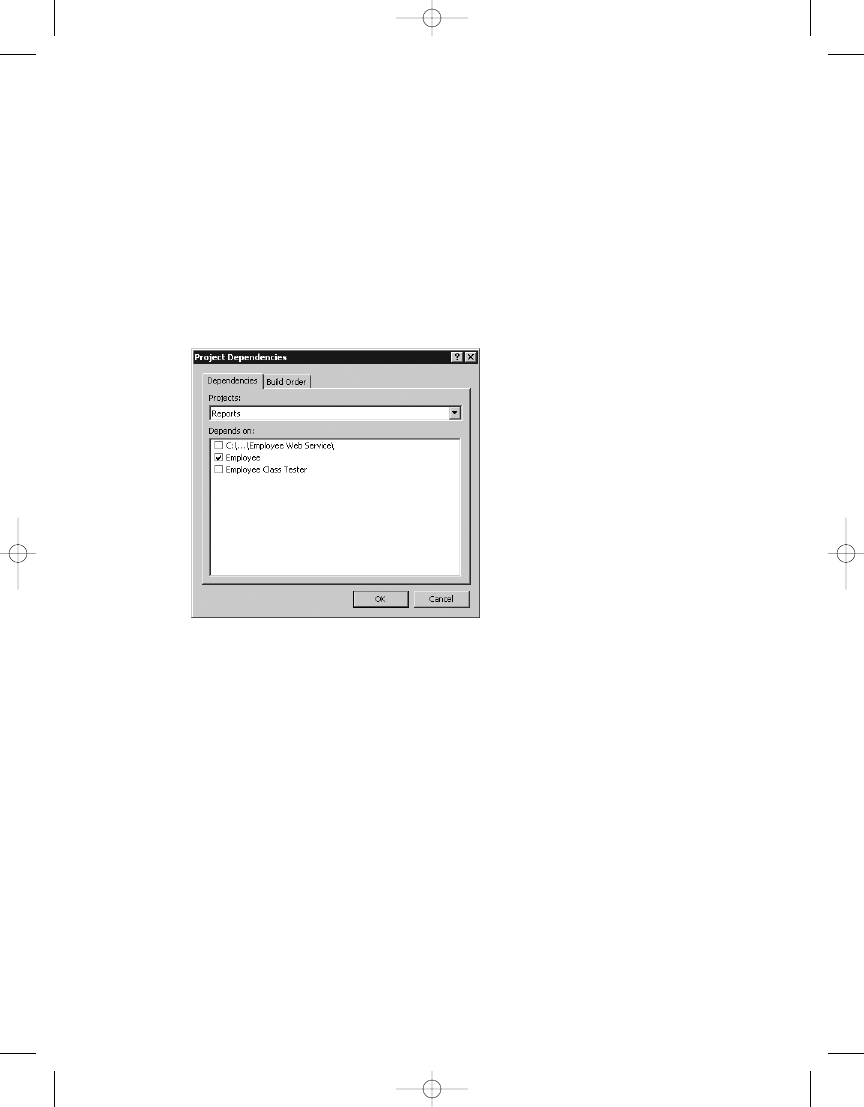
C H A P T E R 5
■
U S I N G C U S TO M . N E T C O D E W I T H R E P O RT S
144
4.
Right-click the project containing your reports.
5.
Set the Reports project as the startup project. This will make sure the report runs first
when you start debugging. You will set the specific report that will call the custom
assembly in a subsequent step.
6.
Right-click again, and select Project Dependencies.
7.
In the Project Dependencies dialog box, select the Employee project as the dependent
project, as shown in Figure 5-14. This will tell Visual Studio that your report depends
on the custom assembly you have written.
8.
Click OK to save the changes, and close the Project Dependencies dialog box.
9.
Right-click the Reports project again, and select Project Properties.
10.
Select StartItem, and set it to the report you want to debug. In this case, select
EmployeeServiceCost.rdl
. The StartItem option tells Visual Studio specifically which
report to run when you run with debugging.
11.
In Solution Explorer, select the Employee custom assembly project.
12.
Right-click, and select Properties.
13.
Expand Configuration Properties, and click Build.
14.
On the Build page, enter the path to the Report Designer folder in the Output Path
textbox. (By default, this path is C:\Program Files\Microsoft Visual Studio 8\Common7\
IDE\PrivateAssemblies
.)
Figure 5-14.
Project Dependencies dialog box
4983ch05.qxd 10/7/05 11:08 AM Page 144

C H A P T E R 5
■
U S I N G C U S TO M . N E T C O D E W I T H R E P O RT S
145
■
Note
You will need to have the necessary permissions to this folder in order to use it for the output path.
By default, members of the standard Users group won’t have the necessary write/modify permissions on this
folder. When you’re logged in as a user with appropriate security permissions, such as the administrator, make
sure to set the permissions on the
PrivateAssemblies
folder to allow the necessary access when you are
logged in under a less privileged account.
■
Note
Debugging requires that you set the permissions.
■
Tip
You could leave the default output path, but changing it saves you some work. With the default path,
you’d have to build and then manually copy your custom assembly in order for the Report Designer running
within Visual Studio to find it and run it. If you update the
Employee
class, you may find that Visual Studio
report preview has a copy of the old version in memory that will prevent your solution from being deployed.
If this occurs, exit Visual Studio and start it again.
15.
Now set breakpoints in your custom assembly code.
16.
Make sure to set Report as the startup project, and then press F5 to start the solution in
debug mode. When the report uses the custom code in your expression, the debugger
will stop at any breakpoints you have set when they are executed. Now you can use all
the powerful debugging features of Visual Studio to debug your code.
■
Note
It is also possible to use multiple copies of Visual Studio to debug your custom assembly. See the
SSRS 2005 BOL for details.
Troubleshooting Your Project
If you modify a custom assembly and rebuild it, you must redeploy it, because the Report
Designer looks for it only in the Report Designer application folder. If you followed our sugges-
tion in the “Debugging Custom Assemblies” section to change the output path, it should be in
the correct location each time you rebuild it while debugging. If not, you will need to follow the
instructions in the “Deploying a Custom Assembly” section to move it to the Report Designer
application folder. Remember, Visual Studio will not deploy your custom assembly to your SSRS
2005 server machine; you must copy it manually.
You may find that you have to exit the Visual Studio IDE in order to replace the files, as
they may otherwise be in use.
Finally, you may want to keep the version of any custom assembly the same, at least while
you are developing it. Every time you change the version of a custom assembly, the reference
to it must change on the References tab of the Report Properties dialog box, as discussed earlier
in this chapter. Once your reports are in production where you want to keep track of version
4983ch05.qxd 10/7/05 11:08 AM Page 145

C H A P T E R 5
■
U S I N G C U S TO M . N E T C O D E W I T H R E P O RT S
146
information, you can use the GAC, which can hold multiple versions; this means you have to
redeploy only those reports that use the new features of the new version. If you want all the
reports to use the new version, you can set the binding redirect so that all requests for the old
assembly are sent to the new assembly. You would need to modify the report server’s Web.
config
file and ReportService.exe.config file.
If you are using a custom assembly and the output on your report shows #Error, you likely
have encountered a permissions issue. See the “Deploying a Custom Assembly” section in this
chapter for information on how to properly set up the permissions.
Summary
In this chapter, you learned how to use custom code with your reports, and we discussed
some of the other programmatic aspects of dealing with SSRS 2005. Chapters 6, 7, and 8 will
build on this as we show you how to write custom applications to render reports, deploy
them to the report server, and schedule them to run using subscriptions.
4983ch05.qxd 10/7/05 11:08 AM Page 146

Rendering Reports from .NET
Applications
R
eport rendering is the process of outputting the results of a report into a specific format. You
pass the appropriate parameters to SSRS 2005, telling it what report you want to run and option-
ally what format you want the output in, any user credentials, and the actual report parameters.
SSRS 2005 then renders the report and returns the results.
The manner in which you pass these parameters and how the results are returned depends
on the SSRS 2005 method you’re using to render the report. Once SSRS 2005 has the informa-
tion it needs, based on the particular report you’re running, it queries the appropriate data
sources. SSRS 2005 uses the passed credentials and parameters if appropriate, renders the
report into an intermediate format, and then renders and filters this intermediate format into
the final display format requested.
With SSRS 2005, you can render reports in three ways from a .NET application:
Using a URL: You can build a URL that allows the client to access the report on the report
server and supply any appropriate parameters, including rendering format, login informa-
tion, report criteria, and report filters. This method is one of the most flexible because it
will work with almost any language and platform that can host or use a Web browser or
a Web browser control. In fact, it works with any language that can create a properly for-
matted URL and that can launch a Web browser using that URL. This method was used
a lot with Visual Studio 2003, but it gets a lot simpler with Visual Studio 2005 because you
can now use the built-in WebBrowser control rather than using COM Interop with the
Internet Explorer Web browser control.
Using the SOAP API: You can use the SOAP API, also known as the Report Server Web service,
to render the report. This returns the rendered data as a stream that you then display. This
is a more difficult method of rendering. That’s because the information you get back from
the server is essentially a binary stream of data, and you don’t have the benefit of having
the server-browser combination to do the actual work of displaying the data. However, you
can use the Report Server Web service for more than just rendering; you can use it to access
the report server’s complete functionality. We’ll show how you can use the Report Server
Web service in your solution to provide information about the reports you’re rendering,
such as the report parameters the reports use.
147
C H A P T E R 6
■ ■ ■
4983ch06.qxd 10/7/05 11:09 AM Page 147

C H A P T E R 6
■
R E N D E R I N G R E P O RT S F R O M . N E T A P P L I C AT I O N S
148
Using a ReportViewer control: You can use the ReportViewer control. This is a new option
for SSRS 2005 that provides a simple-to-use Windows Forms application or ASP.NET user
control that allows you to simply drag and drop the control onto a Windows or Web Form,
set some properties, and render a report. One of the main benefits of the ReportViewer
control is that it allows you to render reports that are on an SSRS 2005 report server as well
as render reports locally, without the need for a report server.
■
Note
The ReportViewer controls are included with all versions of SQL Server and Visual Studio 2005. You
must install SQL Server 2005 Workgroup, Standard, Enterprise or Developer Edition to access the BI projects
that create server-side reports.
While the ReportViewer controls are the method that most Visual Studio 2005 users will
probably employ to render reports, the most universally usable rendering method is via URL
access. In this case, SSRS 2005 provides some defaults for most reporting options. For exam-
ple, SSRS 2005 provides a default user interface for entering parameter and filter information.
It prompts you for login information if necessary, and it defaults to rendering in HTML format.
You get all this simply by passing the URL of the report from the browser. This is most useful if
you’re rendering your reports using just your Web browser, with no other controlling application.
You can optionally pass parameters along with the URL to change these default behaviors,
provide login information, change the default rendering, hide the parameter toolbar, and so
on. This is useful if you have a custom application and want to control these options yourself
rather than provide the default user interface.
You can perform many of the same actions using the Report Server Web service, but there
are no real defaults and the actual display of the returned data to the user is left up to the
application developer. By using the Web browser in an ASP.NET application, or embedded in
a Windows Forms application, you get the benefits of the URL rendering method, but you can
exercise control over it. This provides users with a more integrated experience. The methods
covered in this chapter apply largely to both Windows Forms and Web Forms applications. The
project we’ll show how to build is a Windows Forms–based report viewer that allows you to use
SSRS 2005 as the reporting solution for your application.
In this chapter, you’ll do the following:
URL rendering access: Learn how to build a URL through which a client application can
access a report on the report server. You’ll use the Employee Service Cost report in the
example (available with the code download for this chapter in the Source Code section of
the Apress Web site at http://www.apress.com).
URL reporting parameters: Explore the reporting parameters that, when specified in the
URL, control how the report is rendered. You can specify the actual format (for example,
HTML or PDF). You can specify that a specific page in a report be rendered, or you can
search for a particular word and start rendering on that page.
URL viewer application: Build a simple .NET Windows Forms application that accesses
and renders a report, via a WebBrowser control that you’ll embed in a form.
Report Server Web service calls: Use calls to the Report Server Web service to query for the
ws you to display them on your Windows
4983ch06.qxd 10/7/05 11:09 AM Page 148

C H A P T E R 6
■
R E N D E R I N G R E P O RT S F R O M . N E T A P P L I C AT I O N S
149
Forms application. You’ll then use the SOAP API again to see whether the parameters have
a list of values from which the user can select. If so, you’ll use those values to populate
combo boxes for each parameter. You’ll also give the user a combo box to select a render-
ing format. You’ll then display all the selections to the users and use their selected values
to create a URL that contains all the information necessary to run the report. Finally, you’ll
use this URL with the embedded Web browser to render the report with user-entered report
parameters and rendering commands.
Report viewer control, server-side mode: Use the new ReportViewer control to render the
same report using the control’s server-side mode.
Report viewer control, local rendering: Use the new ReportViewer control and a locally
populated dataset to render a report locally without an SSRS 2005 report server.
Before you run the included examples, make sure to read the ReadMe.htm. It is located in a
file in the samples root folder. If you have the code open in Visual Studio, it will be under the
Solution Items
folder. It contains setup and configuration steps that are required before running
the examples.
Implementing URL Access
In this section, we’ll show you how to build a URL that accesses the desired reports on the report
server and passes the appropriate parameters to the report.
The syntax for the entire URL breaks down into two parts. The first part specifies the path
to the report file, and the second specifies the parameters. The full URL syntax is as follows:
http://server/virtualroot?[/pathinfo]&prefix:param=value [&prefix:param=value]...n]
Table 6-1 describes each component of the URL.
Table 6-1.
URL Access Parameters
Supported
Parameter
Description
Values
server
Specifies the name of the SSRS 2005 Web server
None
virtualroot
Specifies the virtual root of the SSRS 2005 Web service
None
?
Separates the application virtual root from the parameters
None
[/pathinfo]
Specifies the optional path to a folder containing the report
None
&
Separates individual parameters
None
Prefix
When used, indicates that the following parameter is
rc
: Rendering
a command to the server itself versus a report parameter
control
rs
: Report server
command
dsu
: User
dsp
: Password
Param
Specifies the command parameter name when used with
None
a prefix; otherwise, specifies a report parameter name
Value
Specifies the value of the parameter
None
4983ch06.qxd 10/7/05 11:09 AM Page 149

C H A P T E R 6
■
R E N D E R I N G R E P O RT S F R O M . N E T A P P L I C AT I O N S
150
We’ll now walk you through the steps of building a URL to access the Employee Service
Cost report.
URL Report Access Path Format
As indicated in the previous section, the path to access the appropriate report starts with the
name of the report server itself, in this case http://localhost. Following that is the name of
the SSRS 2005 virtual root folder, such as /reportserver (which is the default folder during
installation).
■
Note
The
/reports
virtual root folder is mapped to the Report Manager application that ships with SSRS
2005. If you navigate to this URL, you’ll find that it lists the folders and the reports within the folders that are
on your report server through Report Manager.
You then add ? to the path to let SSRS 2005 know that everything following the URL is
a parameter. Next is the optional path information where you can specify any subfolder within
the base folder that you use to organize your reports, such as /Pro_SSRS/Chapter_6. Finally, you
have the name of the actual report, such as EmployeeServiceCost.
So, in this example, the full path to access the Employee Service Cost report is as follows:
http://localhost/reportserver?/Pro_SSRS/Chapter_6/EmployeeServiceCost
We’ll now cover the section of the URL where you specify any necessary parameters.
URL Parameters and Prefixes
You now need to pass the appropriate parameters to the report. You’re interested in several
categories of parameters:
Report parameters (no prefix): These parameters are supplied to the report’s underlying
queries and are used as filters for the information as it’s rendered. Thus, they control
exactly what data the report displays.
HTML viewer parameters (rc:): These parameters control which features of the Web-based
report viewer are active and at which page the report viewer starts displaying the report.
For example, you can use the FindString parameter to have the viewer start displaying
a report on the first page on which a specific word is found.
Report server command parameters (rs:): These parameters control the type of request
being made and the format of the returned report. For example, we’ll show how to use the
rs:Command=Render&rs:Format=HTML4.0
parameter to render your report in HTML format
in your report viewer.
Credential parameters: You use these parameters to pass in data source credentials such
as User (dsu:) and Password (dsp:). You use them to provide credentials when a data source
connection is set to prompt. If you plan to pass credentials in the URL, you will want to
make sure to use an SSL connection to your SSRS 2005 server to protect the username
and password information.
4983ch06.qxd 10/7/05 11:09 AM Page 150

C H A P T E R 6
■
R E N D E R I N G R E P O RT S F R O M . N E T A P P L I C AT I O N S
151
Report Parameters
Report parameters are the actual parameters passed to the underlying report, instead of instruc-
tions being sent to the report server. That is, you use them to pass criteria to your report such as
start and end dates, employee IDs, and so on. You can pass these parameters to the report’s
query, and they’re created when you specify parameters for the data source. You can also use
parameters as variables in the report and as values for filters.
HTML Viewer Commands
You use HTML Viewer commands to tell SSRS 2005 how to render the report. You can use the
commands in Table 6-2 to control how the viewer appears to the user, as well as to control cer-
tain aspects of how the report appears in the viewer.
Table 6-2.
HTML Viewer Commands
Parameter
Description
Default
Toolbar
Shows or hides the toolbar.
true
Parameters
Shows or hides the parameters area of the toolbar.
true
DocMap
Shows or hides the report document map. For information
true
on what a document map is, see Chapter 4.
DocMapID
Specifies the document map ID to which to scroll.
Not applicable
Zoom
Sets the zoom value. You can use a number representing
100
a percentage or a string with standard values such as
Page Width
and
Whole Page
.
Section
Specifies the page number of the report to display.
1
FindString
Specifies the text to search for in the report.
Not applicable
StartFind
Specifies the page number to start the search on,
Last page of the
specified by
FindString
.
report
EndFind
Specifies the page number to end the search on,
Current page
specified by
FindString
.
FallbackPage
Specifies the page number to display if a
FindString
Not applicable
or
DocMapID
fails.
GetImage
Gets a particular icon for the HTML Viewer interface.
Not applicable
Icon
Gets the icon for a rendering extension.
Not applicable
Stylesheet
Specifies a style sheet to be applied to the HTML Viewer.
Not applicable
Report Server Command Parameters
Report server command parameters, which are prefixed with rs:, tell the report server the
type of request being made (see Table 6-3). You use them to retrieve report and data source
information in XML and HTML format and to retrieve child elements such as the current
folder’s report names. You also use command parameters to tell the server you want to render
a report and in what format and whether you want to render that report based on a preexisting
snapshot.
4983ch06.qxd 10/7/05 11:09 AM Page 151

C H A P T E R 6
■
R E N D E R I N G R E P O RT S F R O M . N E T A P P L I C AT I O N S
152
Table 6-3.
URL Command Parameters
Parameter
Description
Supported Values
Command
Specifies the type of request being made
GetDataSourceContents
GetResourceContents
ListChildren
Render
Format
Specifies the format to render the report in
HTML4.0
MHTML
IMAGE
EXCEL
CSV
PDF
XML
NULL
Snapshot
Renders a report based on a snapshot
Valid ID of a snapshot
Credential Parameters
You can use the credential parameters in Table 6-4 to supply the username and password that
the report server uses in order to connect to the data source to retrieve data for the report. SSRS
2005 uses credential parameters only if the credential settings for the data source in the report
are set to prompt; otherwise, they’re ignored. If the report has multiple data sources, you can
use the credential parameters to supply credentials for each one.
Table 6-4.
URL Credential Parameters
Parameter
Description
Example
dsu
Username to access the data source
dsu:employee=walter
dsp
Password to access the data source
dsp:employee=password
Example URLs
Now that you’ve examined every component part of the URL, it’s useful to look at a few com-
plete sample URLs. The following URL renders the report in HTML 4 and hides the HTML
Viewer toolbar by setting the rc:Toolbar parameter value to false:
http://localhost/reportserver?/Pro_SSRS/Chapter_6/EmployeeServiceCost&rs:Command=➥
Render&rs:Format=HTML4.0&rc:Toolbar=false
The next example passes a report parameter for ServiceYear and hides the input display
of user-supplied parameters:
http://localhost/reportserver?/Pro_SSRS/Chapter_6/EmployeeServiceCost&rs:Command=➥
Render&rs:Format=HTML4.0&rc:Parameters=false&ServiceYear=2003
The next one uses the rs:Format parameter to set the default output format to PDF:
http://localhost/reportserver?/Pro_SSRS/Chapter_6/EmployeeServiceCost&rs:Command=➥
Render&rs:Format=PDF
4983ch06.qxd 10/7/05 11:09 AM Page 152

C H A P T E R 6
■
R E N D E R I N G R E P O RT S F R O M . N E T A P P L I C AT I O N S
153
The final example hides the report document map:
http://localhost/reportserver?/Pro_SSRS/Chapter_6/EmployeeServiceCost&rs:Command=➥
Render&rc:DocMap=false
You’ve taken a brief look at the commands you need to render a report through a URL. In
the remainder of this chapter, we’ll show how to create your own report viewer. The viewer will
use URL commands to integrate an SSRS 2005 report into a .NET Windows Forms–based
application.
Integrating SSRS 2005 with .NET Applications
Now that you have some understanding of how URL access works, you’ll learn how you can
render reports. You’ll start by looking at how to render a report by building a Windows Forms
SSRS 2005 viewer application that uses the new .NET 2.0 WebBrowser control and URL access
to render reports for your application.
Building the Report Viewer Using a WebBrowser Control
We’ll show how to create a simple Windows Forms application that contains the embedded
browser, which you’ll use to view a report.
Creating the Viewer Form
In this example, you will use C# to create the viewer application. Follow these steps:
1.
Open Visual Studio 2005.
2.
Create a new project.
3.
On the New Project dialog box, select Visual C# ➤ Windows ➤ Windows Application.
Name it SSRS Viewer WBC. Under Solution, select Create New Solution, and name it
Chapter 6
. Click OK to create your project.
Now that you have created the project, you’ll work with the form you will use to create the
report viewer:
1.
Visual Studio 2005 will add a single form to the project called Form1.cs. Rename the
form to ViewerWBC.cs.
2.
Resize the blank form to 800
×
600.
3.
Add the WebBrowser control from the Toolbox’s Common Controls section to the form.
Name it webBrowser, and anchor the control to the form’s top, bottom, left, and right.
The WebBrowser control is new to Visual Studio 2005 and simplifies working with the
Web browser in your Windows Forms application. You no longer have to add or use
COM Interop with the Internet Explorer COM browser control.
4.
Now add a textbox, and name it reportURL. Just after the textbox, add a button named
reportRun
, and set the button text to Run.
You should now have a form that looks like Figure 6-1.
4983ch06.qxd 10/7/05 11:09 AM Page 153
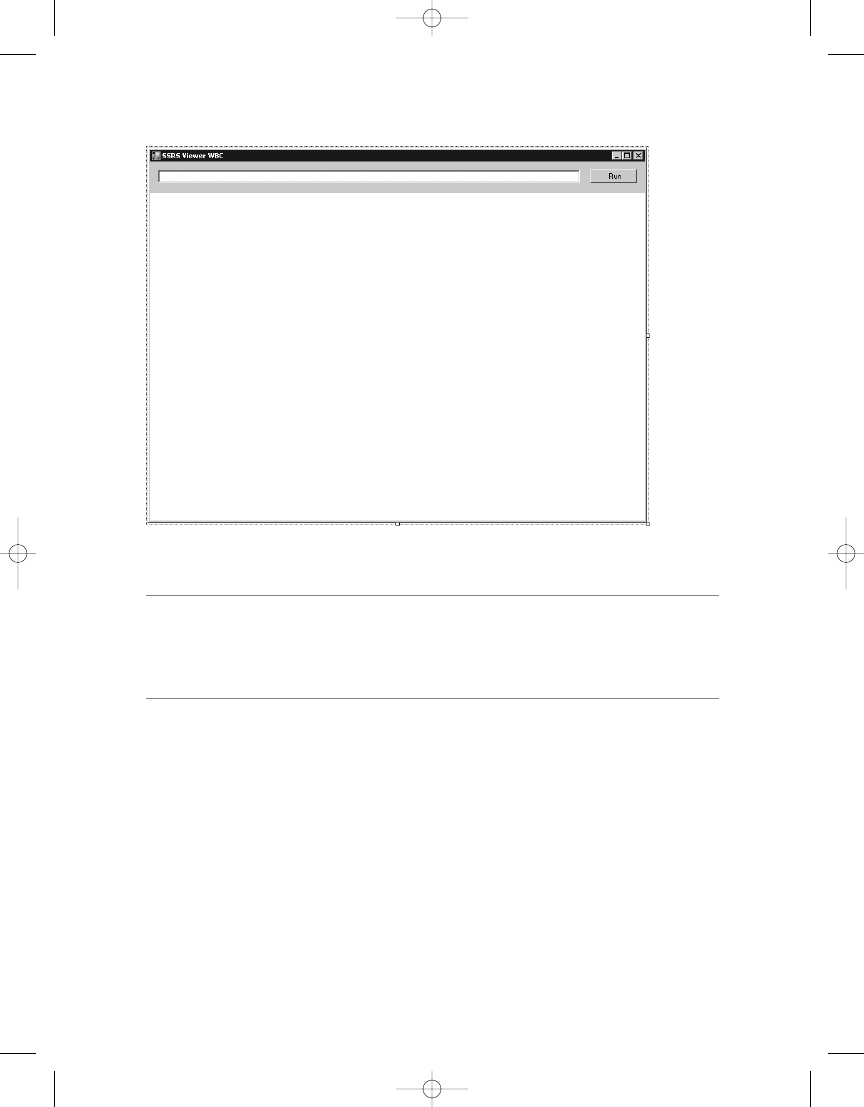
C H A P T E R 6
■
R E N D E R I N G R E P O RT S F R O M . N E T A P P L I C AT I O N S
154
Figure 6-1.
The ViewerWBC.cs form
■
Note
One of the great things about using the new WebBrowser control versus the old COM Interop method
is that you no longer have to initialize the browser before you can use it. With the COM-based control, you had
to navigate to a page before accessing the control. This was often done by adding code to the
Form_Load
event to navigate to
about:blank
when the form containing the control was loaded.
Coding the Viewer Form
To code the viewer form, you’ll add the code necessary to use this custom report viewer to
render the SSRS 2005 reports. You need to add some code to the button’s click event to make
sure you can browse to and view an existing report. Make sure the ViewerWBC.cs form is open
in design view, and double-click the Run button. This will create an empty method to handle
the button’s click event. Add the code in Listing 6-1 to the method.
Listing 6-1. reportRun click
Event: Browsing to URL
private void reportRun_Click(object sender, EventArgs e)
{
webBrowser.Navigate(reportURL.Text);
}
Now run the project in debug mode. When the form displays, enter the following URL into
4983ch06.qxd 10/7/05 11:09 AM Page 154
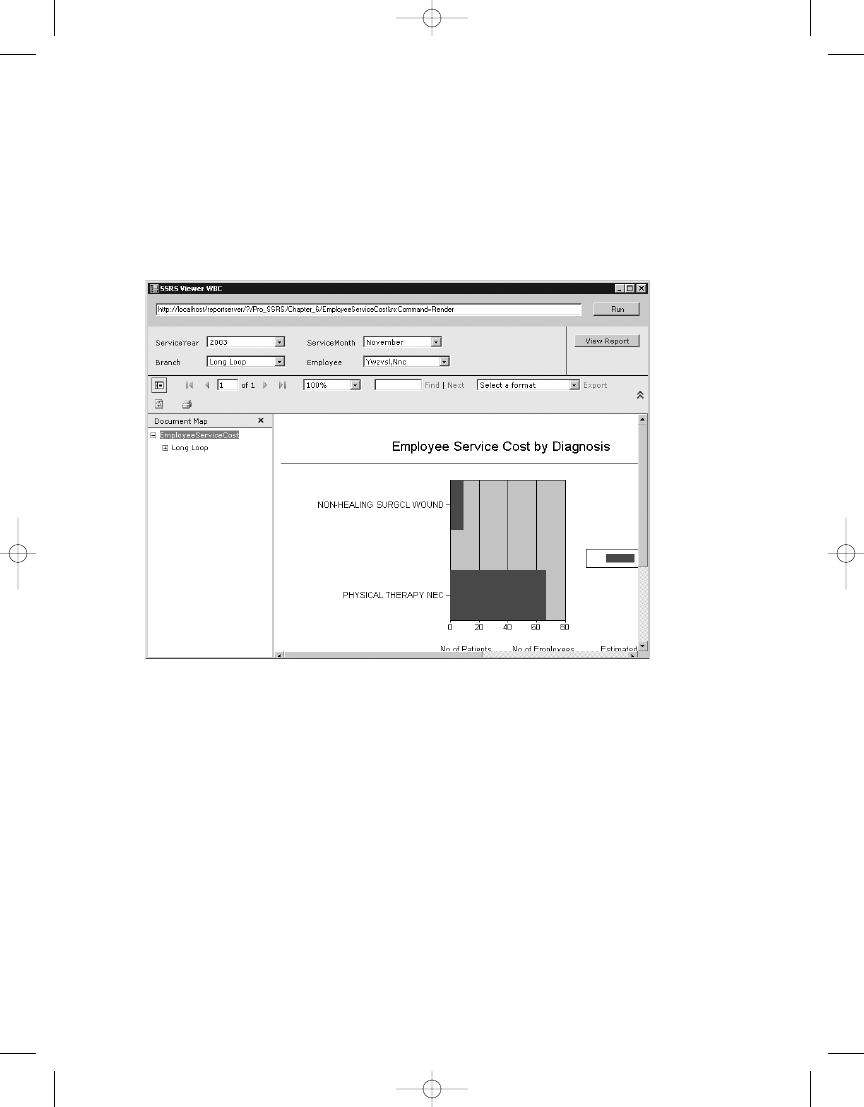
C H A P T E R 6
■
R E N D E R I N G R E P O RT S F R O M . N E T A P P L I C AT I O N S
155
http://localhost/reportserver/?➥
/Pro_SSRS/Chapter_6/EmployeeServiceCost&rs:Command=Render
Now click Run. This renders the Employee Service Cost report. Of course, you need to use
the name of your report server where you see localhost in the preceding URL. At this point,
you should see something like Figure 6-2.
Next, change the constructor to set up a default report so you don’t have to type it in each
time. For example:
public ViewerWBC()
{
InitializeComponent();
// Setting the initial URL for convenience in the example
reportURL.Text = "http://localhost/reportserver/?➥
/Pro_SSRS/Chapter_6/EmployeeServiceCost&rs:Command=Render";
}
Building the Report Viewer Using a Report Viewer Control
Now you’ll learn how you can use the new ReportViewer control to render the same Employee
Service Cost report. The ReportViewer control is new to Visual Studio 2005 and simplifies
Visual Studio 2005 and SSRS 2005.
Figure 6-2.
SSRS Viewer WBC application running the Employee Service Cost report
4983ch06.qxd 10/7/05 11:09 AM Page 155

Not only is it likely to be the most popular method for rendering server-based reports, but it
also includes the ability to render reports based on the RDL locally without a report server.
This was something that was not possible before.
You can use two new ReportViewer controls, one for Windows Forms applications and
one for ASP.NET applications. These new controls allow you to add rich reporting features to
your Windows or ASP.NET applications more easily than is possible using any other method.
The controls offer the power of the URL rendering method but make it easier to implement in
your code because most options are now set as properties on the ReportViewer control. In other
words, you don’t need to include them in the string that you pass in as the URL. Another main
advantage of working with the controls is that you get full IntelliSense support for all the
options within the Visual Studio 2005 IDE.
Table 6-5 lists some of the key properties and methods of the ReportViewer controls.
Table 6-5.
Sample ReportViewer Properties and Methods
Property/Method
Description
ProcessingMode
Determines whether the report is processed locally
or by an SSRS 2005 server.
ServerReport.ReportServerUrl
Specifies the URL of the reporting server it will use to
render a report when in remote mode.
ServerReport.ReportPath
Specifies the path to the specific report you want to
render. Do not include the report server URL as part
of the path since it is defined by
ReportServerUrl
.
LocalReport.ReportEmbeddedResource
Specifies the name of the report to use. By default
when you add a local report (
rdlc
) to a project, Visual
Studio 2005 sets the report as an embedded resource.
Other properties allow you to point to a path on disk
or even a stream for the report definition.
LocalReport.DataSources.Add
Specifies the method used to add a data source to the
report.
RefreshReport
Causes the report to be rendered.
■
Note
See the Visual Studio 2005 help for more information about the members of the ReportViewer con-
trol as well as for information about a number of other properties, methods, and events that come with the
new ReportViewer controls.
In this example, we will cover how to use the Windows Forms version of the ReportViewer
controls.
■
Note
In the “Using the Report Server Web Service” section, we will show how to extend the application
so that it uses Report Server Web service calls to query the report server for the parameters the report can
accept and the values that are possible for each. We’ll show how to use these parameters to create drop-down
lists for the users of the Windows Forms application.
C H A P T E R 6
■
R E N D E R I N G R E P O RT S F R O M . N E T A P P L I C AT I O N S
156
4983ch06.qxd 10/7/05 11:09 AM Page 156
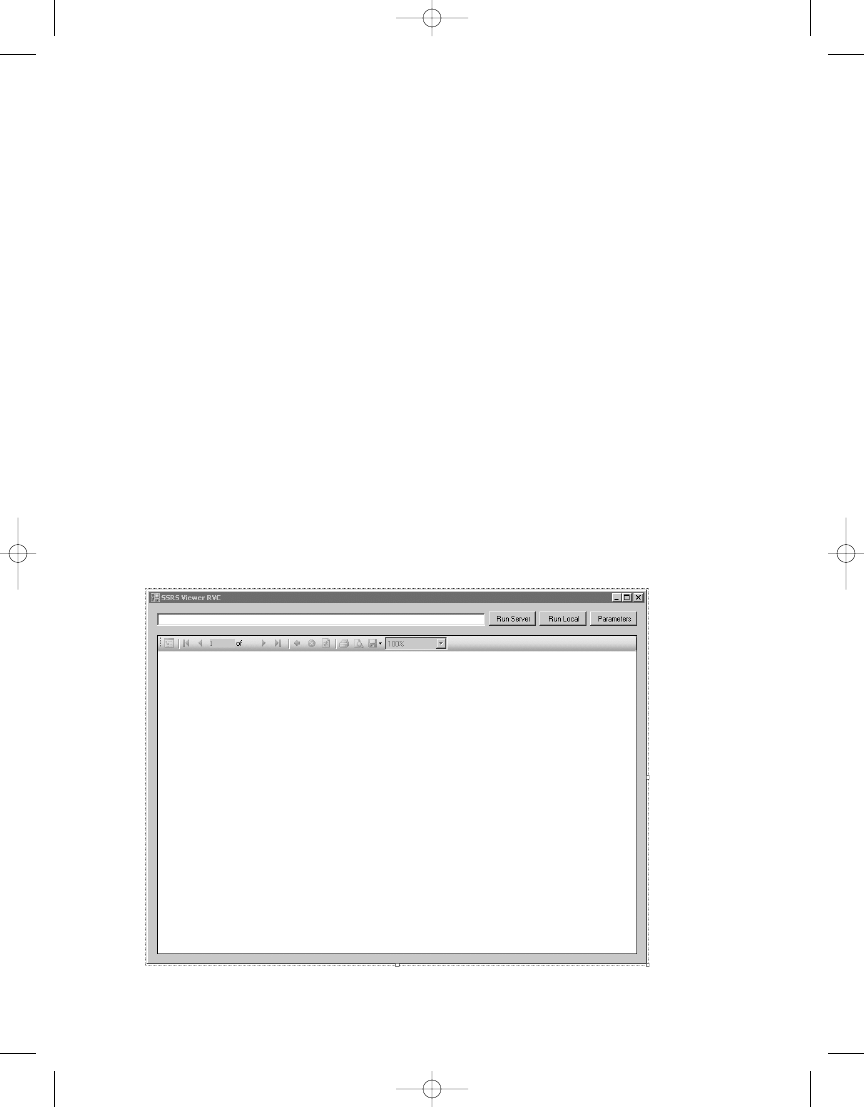
C H A P T E R 6
■
R E N D E R I N G R E P O RT S F R O M . N E T A P P L I C AT I O N S
157
Creating the Viewer Form
To create the viewer form in C#, you’ll start by adding a new project to your solution by taking
the following steps:
1.
Select File ➤ Add Project ➤ New Project from the menu.
2.
In the New Project dialog box, select Visual C# ➤ Windows ➤ Windows Application.
Name it SSRS Viewer RVC.
Now that you have created the project, you’ll work with the form that will create your
report viewer:
1.
Name the form ViewerRVC.cs.
2.
Resize the blank form to around 800
×
600.
3.
Add the ReportViewer control from the Toolbox’s Data section to the form. Name
the control reportViewer, and anchor it to the form’s top, bottom, left, and right. The
ReportViewer control is new to Visual Studio and SSRS 2005; it is not available in ear-
lier versions of Visual Studio or SSRS.
4.
Now add a textbox, name it reportURL, and just after the textbox add three buttons
named runServer, runLocal, and getParameters. Set their Text properties to Run Server,
Run Local
, and Parameters, respectively.
You should now have a form that looks like Figure 6-3.
4983ch06.qxd 10/7/05 11:09 AM Page 157

You’ll now start adding the code necessary to use the new ReportViewer control to render
the SSRS 2005 reports.
Coding the Viewer Form
First, add a using statement for the new namespace, Microsoft.Reporting.WinForms, to the
top of the class with the other namespace declarations. Doing this will allow you to access the
members of the namespace without typing the full namespace each time you use a method or
property from that namespace.
using Microsoft.Reporting.WinForms;
Second, add the code shown in Listing 6-2 to the Run Server button’s click event. Make
sure the ViewerRVC.cs form is open in design view, and double-click the Run Server button.
This will create an empty method to handle the button’s click event.
Listing 6-2. runServer click
Event: Running Report in Remote Mode
private void runServer_Click(object sender, EventArgs e)
{
reportURL.Text = "/Pro_SSRS/Chapter_6/EmployeeServiceCost";
reportViewer.ProcessingMode =
Microsoft.Reporting.WinForms.ProcessingMode.Remote;
reportViewer.ServerReport.ReportServerUrl =
new Uri(@"http://localhost/reportserver/");
reportViewer.ServerReport.ReportPath = reportURL.Text;
reportViewer.RefreshReport();
}
Now run the project in debug mode. Then click Run Server. This renders the Employee
Service Cost report. Of course, you need to use the name of your report server where you see
localhost
in Listing 6-2. At this point, you should see something that looks like Figure 6-4.
C H A P T E R 6
■
R E N D E R I N G R E P O RT S F R O M . N E T A P P L I C AT I O N S
158
4983ch06.qxd 10/7/05 11:09 AM Page 158
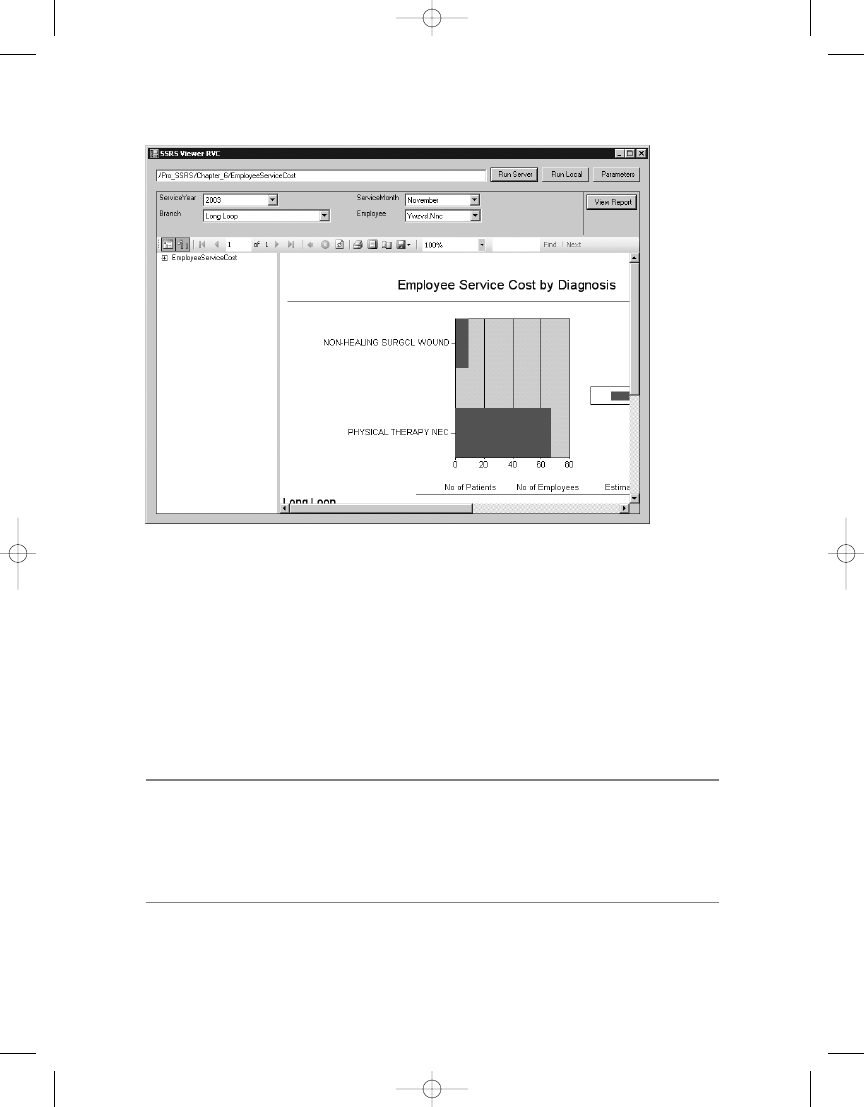
Figure 6-4.
SSRS Viewer RVC running a server report
C H A P T E R 6
■
R E N D E R I N G R E P O RT S F R O M . N E T A P P L I C AT I O N S
159
That’s all there is to rendering a report on an SSRS 2005 server using the new
ReportViewer control.
Rendering the Report Locally
We’ll now cover how to render the report locally without using an SSRS 2005 server. It is a bit
more complicated because you’re responsible for filling the data sources with the data that
your reports require. However, it does provide tremendous flexibility to the developer because
you can use SSRS 2005 reporting features without a server.
■
Caution
The server and local report definition files are not 100 percent compatible. This means it is not
possible to use the same RDL source file for both local and remote use. In fact, you will note that by default
reports for server-side or remote processing are created with the
.rdl
extension and reports for client-side
or local processing are created with the
.rdlc
extension. While they are not 100 percent interchangeable,
you can use one for the other with some changes to the underlying RDL.
4983ch06.qxd 10/7/05 11:09 AM Page 159

Creating the Report’s Data Source
First you will add a data source to your project by adding the dataset you created previously.
To add the data source, follow these steps:
1.
In the Project Explorer, right-click the project name SSRS Viewer RVC, point to Add,
and select Existing Item.
2.
Navigate to the folder containing the Chapter 6 examples, and select EmployeePay.xsd
in the SRSS Viewer RVC folder. This is the XML schema file you’ll use to define your
data source for the report. When you add the .xsd file to your project, it will also appear
under the Data Sources window. If you don’t see the Data Sources window, select Data
➤ Show Data Sources from the menu.
■
Note
Alternatively, you could have used the Data Source Configuration Wizard found by selecting Data ➤
Add New Data Source. With it you can create several types of data sources including those sourcing from
a database, a Web service, or even an object. Just remember that much like this example, it is up to you to
retrieve the data and populate the data source with it.
Next you’ll create a local RDL (.rdlc) that you’ll render using the ReportViewer control in
local processing mode.
Designing the Report
To design the report, follow these steps:
1.
To add a report to the project, right-click the project name—SSRS Viewer RVC—in the
Solution Explorer.
2.
On the shortcut menu, select Add ➤ New Item. This opens the Add New Item dialog box.
3.
Click the Report icon, enter EmployeePay.rdlc for the file name, and then click Add.
This launches the Report Designer. The .rdlc extension signifies that it is a report for
client or local rendering.
4.
Make sure the report is selected. Open the Toolbox. From the Toolbox, drag a Table
report item onto the report.
5.
From the Data Sources window, drag the EmployeeID field onto the middle row of the
first column in the table. The middle row is the Detail row. Notice that the Header row
automatically fills in for you when you specify the Detail row.
6.
Drag the StartDate field onto the Detail row of the second column so that it is next to
the EmployeeID field.
7.
Drag the Amount field onto the Detail row of the third column so that it is next to the
StartDate
field.
You should now have a report that looks like Figure 6-5.
C H A P T E R 6
■
R E N D E R I N G R E P O RT S F R O M . N E T A P P L I C AT I O N S
160
4983ch06.qxd 10/7/05 11:09 AM Page 160
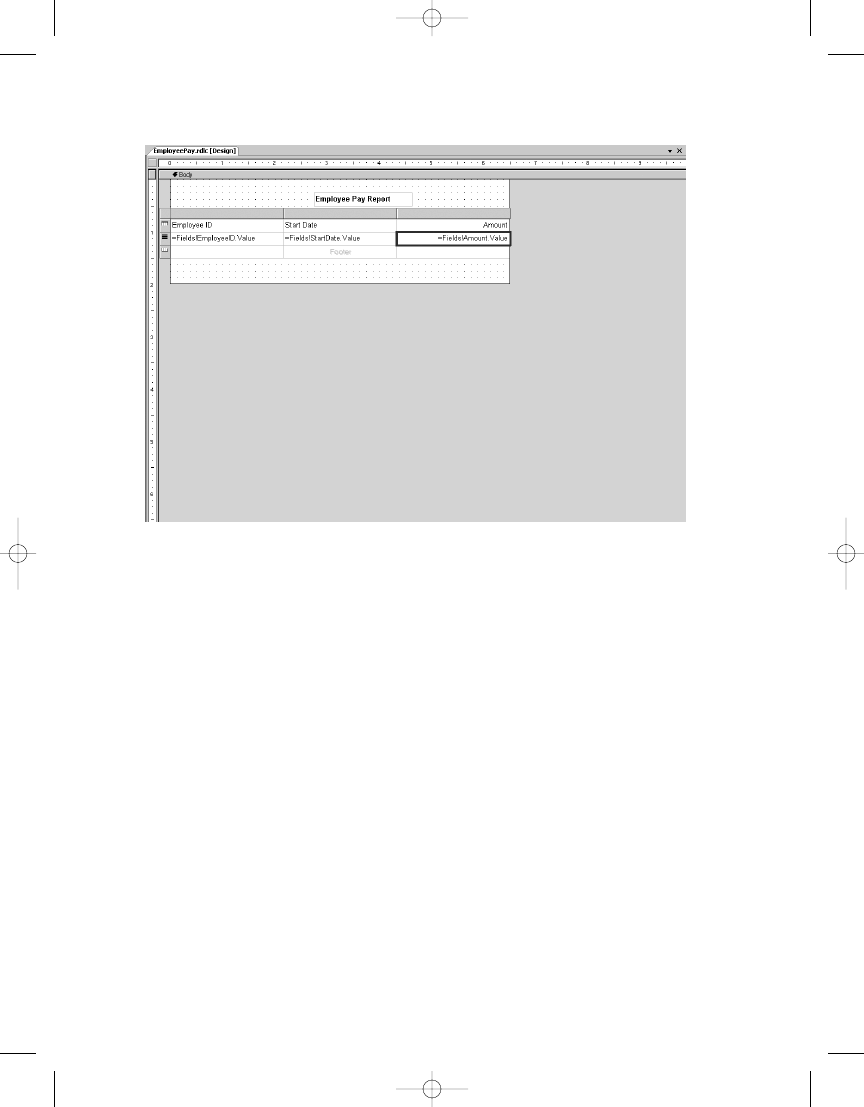
Figure 6-5.
Local report in the designer
C H A P T E R 6
■
R E N D E R I N G R E P O RT S F R O M . N E T A P P L I C AT I O N S
161
Now you have a report that uses the dataset you created as a data source. Now add the code
shown in Listing 6-3 to the runLocal button’s click event to populate the dataset and display
the values in the ReportViewer control using the .rdlc file you have created. Make sure the
ViewerRVC.cs
form is open in design view, and double-click the Run Local button. This will
create an empty method to handle the button’s click event.
Listing 6-3. runLocal click
Event: Running Report in Local Mode
private void runLocal_Click(object sender, EventArgs e)
{
Employees empDS = new Employees();
empDS.ReadXml(@"C:\Temp\EmployeePay.xml");
reportViewer.ProcessingMode =
Microsoft.Reporting.WinForms.ProcessingMode.Local;
reportViewer.LocalReport.ReportEmbeddedResource =
"SSRS_Viewer_RVC.EmployeePay.rdlc";
reportViewer.LocalReport.DataSources.Add(
new Microsoft.Reporting.WinForms.ReportDataSource(
"Employees_EmployeePay", empDS.Tables["EmployeePay"]));
reportViewer.RefreshReport();
}
4983ch06.qxd 10/7/05 11:09 AM Page 161
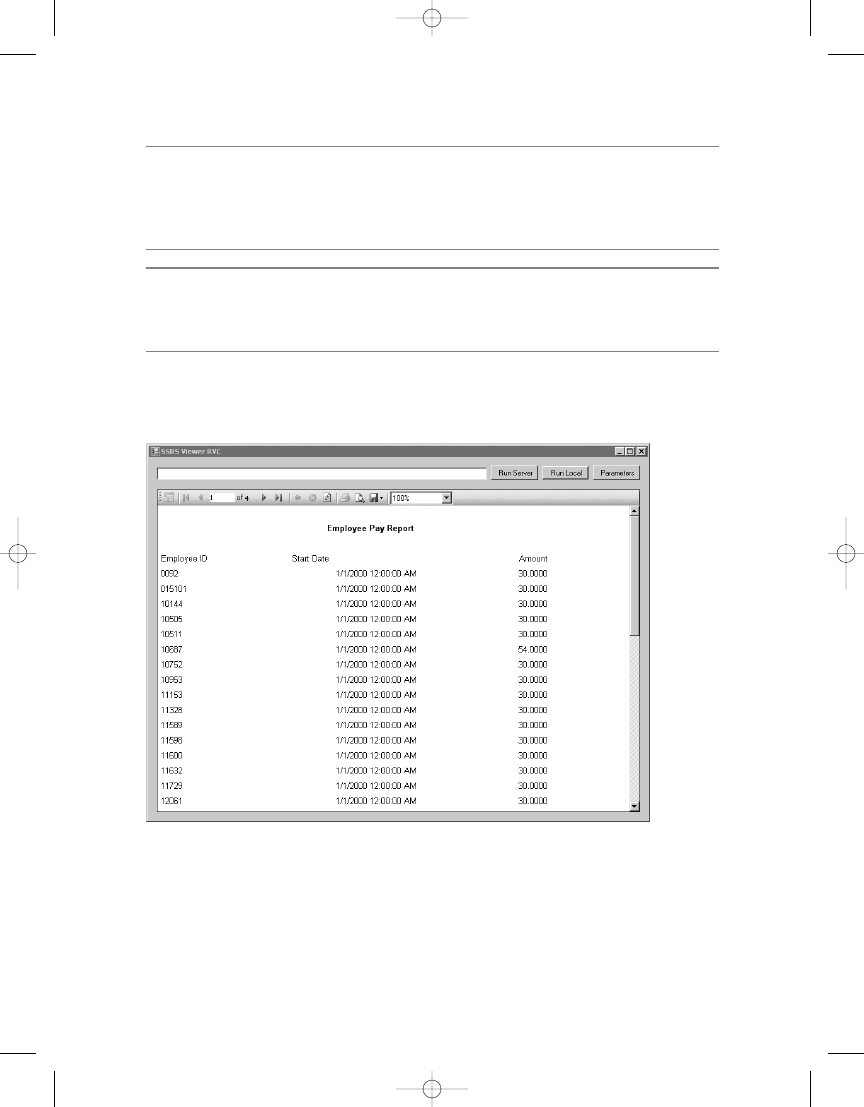
C H A P T E R 6
■
R E N D E R I N G R E P O RT S F R O M . N E T A P P L I C AT I O N S
162
■
Note
Make sure the name in the data source code matches the name expected by the report, or you will
receive an error message when the report runs. You can determine the exact name by opening the
.rdlc
file using Report Designer and selecting Report ➤ Report Data Sources. The dialog box that opens will tell
you the name you should use.
■
Note
The
ReportEmbeddedResource
value must include the namespace of your project. If you entered
spaces for the name of your project when you created it, the namespace will use underscores in place of
each space.
Now run the project in debug mode. When the form displays, click Run Local. This ren-
ders the local Employee Pay report. At this point, you should see something like Figure 6-6.
You’ve now created a report viewer in a Windows Forms application by using the Web-
Browser control and URL rendering and by using the new ReportViewer control. You could
stop at this point and just use these methods to render the reports and to display the report
parameters, toolbar, and report. However, in this example, you want to use the SSRS 2005
Report Server Web service to get a list of parameters for the selected report and to display
them to the user in a Windows Forms application. To get this list of parameters, you need to
eport Server Web service.
Figure 6-6.
SSRS Viewer RVC running a locally rendered report
4983ch06.qxd 10/7/05 11:09 AM Page 162

C H A P T E R 6
■
R E N D E R I N G R E P O RT S F R O M . N E T A P P L I C AT I O N S
163
Using the Report Server Web Service
The SSRS 2005 Web service is an XML-based Web service. It uses the SOAP API to allow you to
call a variety of methods on the report server and interact with them using a rich set of objects
provided by the service.
Web Services Method Categories
The Report Server Web service can control every aspect of the report server and consists of
several categories of methods, as listed in Table 6-6.
Table 6-6.
Categories of the Report Server Web Services Methods
Category
Manages
Namespace management
Folders and items on the server and their properties
Authorization
Tasks, roles, and policies
Data source connections
Data source connections and credentials
Report parameters
Setting the retrieval parameters for reports
Rendering and execution
Report execution, rendering, and caching
Report history
Snapshot creation and history
Scheduling
Shared schedule creation and modification
Subscription and delivery
Subscription creation and modification
Linked reports
Linked report creation and management
The Report Server Web service uses many of these methods to control aspects of SSRS 2005
that aren’t directly related to rendering reports, so we won’t cover them in this chapter. How-
ever, you should be aware of the level of control your custom application can have over SSRS
2005 and the types of functions that can be performed, because you might want to provide
a user interface to them from your application. Keep in mind that Microsoft built the main
SSRS 2005 report server application using ASP.NET and these Web services.
For the SSRS Viewer RVC, you are using the ReportViewer control to render the report,
but you want to provide a custom Windows Forms–based user interface to allow users to enter
their report parameters. The rest of this chapter concentrates on using methods from the report
parameters category listed in Table 6-6. You’ll use these methods to obtain a list of the param-
eters that the report expects and also to find the possible values for those parameters. You’ll
use this information to create and populate combo boxes that allow the users to enter their
choices from a Windows Forms dialog box.
Creating the GetParameters Form
You already have a form (ViewerRVC.cs) to render and display the report in the embedded
ReportViewer control. You’ll now add a second form to the project that you’ll use to display the
report and rendering parameters and to allow the users to make their selections.
So, add a GetParameters form to your project by selecting Project ➤ Add Windows Form.
Name the form GetParameters.cs. Onto this form, add two controls from the Toolbox; add
a FlowLayoutPanel control named parameterPanel, and add one button control named buttonOK.
Then set the text for the button to OK. When you’re done, the form should look like Figure 6-7.
4983ch06.qxd 10/7/05 11:09 AM Page 163
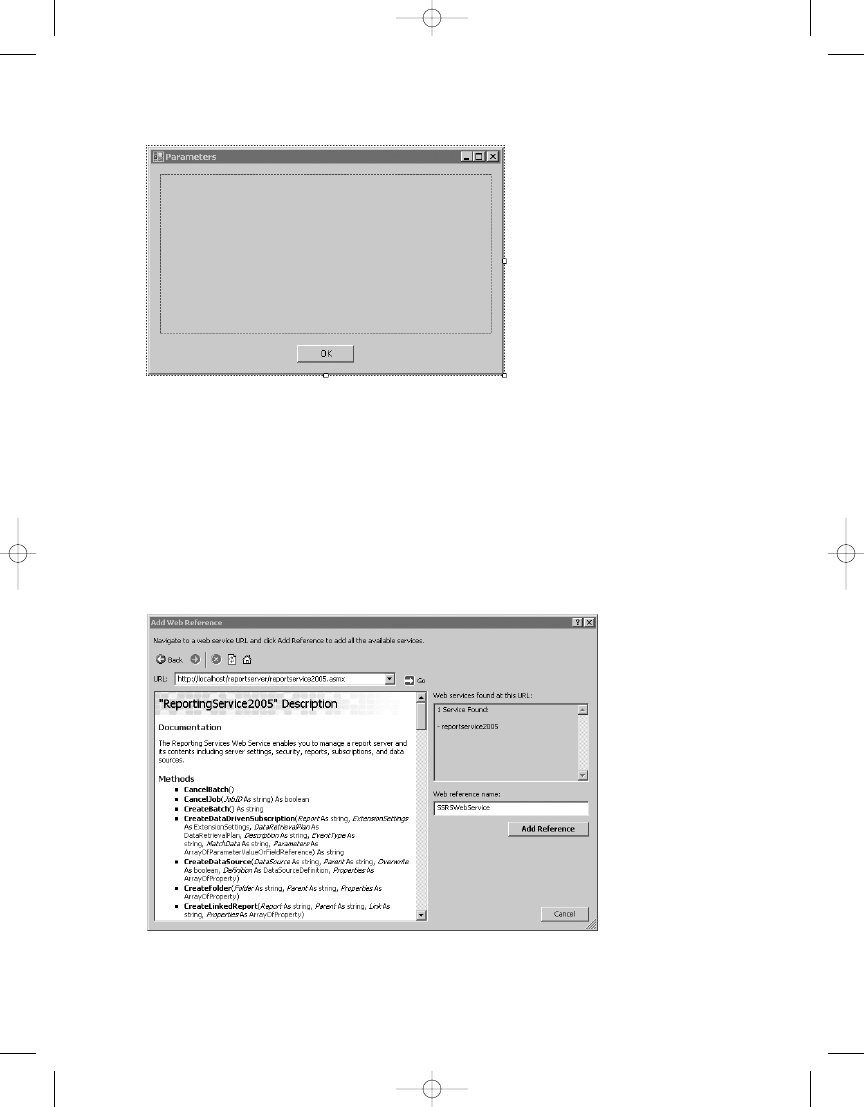
C H A P T E R 6
■
R E N D E R I N G R E P O RT S F R O M . N E T A P P L I C AT I O N S
164
You now need to add a reference to the SSRS 2005 Web service to your project. You do this by
selecting Project ➤ Add Web Reference or by right-clicking the references in the Solution Explorer
and selecting Add Web Reference. When the dialog box appears, enter the following URL:
http://localhost/reportserver/reportservice2005.asmx
Substitute the name of your server for localhost. Then click the Go button. You’ll see
a dialog box similar to Figure 6-8.
Figure 6-7.
SSRS Viewer RVC GetParameters form
Figure 6-8.
Adding an SSRS 2005 Web service reference
4983ch06.qxd 10/7/05 11:09 AM Page 164

C H A P T E R 6
■
R E N D E R I N G R E P O RT S F R O M . N E T A P P L I C AT I O N S
165
In the Web Reference Name textbox, enter SSRSWebService, which is the name by which
you’ll refer to your Web service in your code.
Once this dialog box is closed, you will add the following using statement to the top of
your code in the GetParameters class. Note that if your project name is different from SSRS
Viewer RVC, you should change the reference to reflect the name of your project.
using SSRS_Viewer_RVC.SSRSWebService;
Now you can reference the methods and properties exposed by the Web service much
more easily because you won’t have to enter the fully qualified namespace. Also, add the fol-
lowing directives:
using System.Web.Services.Protocols;
using System.Collections;
Doing this will allow you to access the members of these namespaces without needing to
type the full namespace each time you use a method or property from that namespace.
Because you’ll use this form as a dialog box to display the report parameters and their
possible values, and allow the user to select them, you need a way to communicate between
the two forms.
Coding the Report Parameters Form
When you instantiate the report parameters form (GetParameters), you do so by passing in the
URL of the report the user has entered in the viewer form (ViewerRVC.cs). You use this URL to
determine the report server name and the specific report the user wants to run. You need to know
both of these for the calls to the report server Web service. Because you’ll use this information
throughout the rest of the code, in this class you store them in some class-level private variables,
as shown in Listing 6-4.
Listing 6-4.
Class-Level Private Variables
private string url;
private string server;
private string report;
private Microsoft.Reporting.WinForms.ReportParameter[] parameters;
ReportingService2005 rs;
In the form constructor, break the report server and report name into two separate fields.
To break down the URL into the server and report name, use the string split method and
create a constructor that looks like Listing 6-5.
Listing 6-5.
Report Parameters Form Constructor
public GetParameters (string URL)
{
InitializeComponent();
url = URL;
string[] reportInfo = url.Split('?');
server = reportInfo[0];
report = reportInfo[1];
4983ch06.qxd 10/7/05 11:09 AM Page 165

C H A P T E R 6
■
R E N D E R I N G R E P O RT S F R O M . N E T A P P L I C AT I O N S
166
The GetParameters_Load Event
Now you get to where the real work for this dialog box takes place: the Form_Load event. First,
create a ReportingService object so that you can access SSRS 2005 through the Web service
that you added as a reference earlier. Next, set your Windows credentials as the credentials to
be used for calling the Web service, like so:
rs = new ReportingService2005();
rs.Credentials = System.Net.CredentialCache.DefaultCredentials;
■
Note
You can also use Basic authentication using
rs.Credentials = new System.Net.
Network-Credential("username", "password", "domain");
. The method you use depends on the
security settings for the report server virtual directory. By default, it’s configured to use Windows authentication.
Calling the Web Services GetReportParameters Method
The GetReportParameters method takes five parameters:
• Report: The full path name of the report.
• ForRendering: A Boolean value that indicates how the parameter values should be used.
You must set it to true to get a list of the possible values for each parameter.
• HistoryID: The ID of the report history snapshot. You set it to null because you aren’t
running the report from a snapshot.
• ParameterValues: The parameter values (ParameterValue[] objects) that can be validated
against the parameters of the report that are managed by the report server. Set this to
null
for this example.
• Credentials: The data source credentials (DataSourceCredential[] objects) that can be
used to validate query parameters. Set this to null for this example.
The GetReportParameters method returns an array of ReportParameter[] objects that con-
tain the parameters for the report. You use this information to render combo boxes that allow
the users to select the parameter values they want to use when running the report.
The following code sets up the variables you need to use and then calls the
GetReportParameters
method to retrieve a list of reports that the report expects, as shown in
Listing 6-6.
Listing 6-6.
Call to GetReportParameters
bool forRendering = true;
string historyID = null;
ParameterValue[] values = null;
DataSourceCredentials[] credentials = null;
ReportParameter[] parametersSSRS = null;
parametersSSRS = rs.GetReportParameters(report, historyID,
forRendering, values, credentials);
4983ch06.qxd 10/7/05 11:09 AM Page 166

C H A P T E R 6
■
R E N D E R I N G R E P O RT S F R O M . N E T A P P L I C AT I O N S
167
Once you have the list of parameters from SSRS 2005, you loop through them using the
values to create labels as you create your combo box for each parameter, like so:
foreach (ReportParameter rp in parametersSSRS)
Each ReportParameter object has a read-only property called ValidValues. You can use the
ValidValues
property, which returns an array of ValidValue objects to populate the items in
each combo box, as shown in Listing 6-7.
Listing 6-7.
Iterating Through the ValidValue Objects
if (rp.ValidValues != null)
{
//Build list items
ArrayList aList = new ArrayList();
pvs = rp.ValidValues;
foreach (ValidValue pv in pvs)
{
aList.Add(new ComboItem(pv.Label,pv.Value));
}
//Bind list items to combo box
a.DataSource = aList;
a.DisplayMember="Display";
a.ValueMember="Value";
}
So, for each ReportParameter, you see whether any ValidValues properties exist. If so, you
loop through them, adding each item to the combo box. Because you want to retrieve the display
name and the actual value for each item in the combo box, you have to create a combo box
item class and bind the objects to the combo box. Listing 6-8 shows the GetParameters_Load
event, and Listing 6-9 shows the ComboItem class.
Listing 6-8.
Get Report Parameters and Possible Values, and Display Them in Combo Boxes
private void GetParameters_Load(object sender, System.EventArgs e)
{
rs = new ReportingService2005 ();
rs.Credentials = System.Net.CredentialCache.DefaultCredentials;
bool forRendering = true;
string historyID = null;
ParameterValue[] values = null;
DataSourceCredentials[] credentials = null;
ReportParameter[] parametersSSRS = null;
ValidValue[] pvs = null;
int x=5;
int y=30;
4983ch06.qxd 10/7/05 11:09 AM Page 167

C H A P T E R 6
■
R E N D E R I N G R E P O RT S F R O M . N E T A P P L I C AT I O N S
168
try
{
parametersSSRS = rs.GetReportParameters(report, historyID,
forRendering, values, credentials);
if (parametersSSRS != null)
{
foreach (ReportParameter rp in parametersSSRS)
{
this.SuspendLayout();
this.parameterPanel.SuspendLayout();
this.parameterPanel.SendToBack();
// now create a label for the combo box below
Label lbl = new Label();
lbl.Anchor = (System.Windows.Forms.AnchorStyles.Top |
System.Windows.Forms.AnchorStyles.Left);
lbl.Location = new System.Drawing.Point(x, y);
lbl.Name = rp.Name;
lbl.Text = rp.Name;
lbl.Size = new System.Drawing.Size(150, 20);
this.parameterPanel.Controls.Add(lbl);
x = x + 150;
// now make a combo box and fill it
ComboBox a = new ComboBox();
a.Anchor = (System.Windows.Forms.AnchorStyles.Top |
System.Windows.Forms.AnchorStyles.Right);
a.Location = new System.Drawing.Point(x, y);
a.Name = rp.Name;
a.Size = new System.Drawing.Size(200, 20);
x = 5;
y = y + 30;
this.parameterPanel.Controls.Add(a);
this.parameterPanel.ResumeLayout(false);
this.ResumeLayout(false);
if (rp.ValidValues != null)
{
//Build listitems
ArrayList aList = new ArrayList();
pvs = rp.ValidValues;
foreach (ValidValue pv in pvs)
{
aList.Add(new ComboItem(pv.Label, pv.Value));
}
//Bind listitmes to combobox
a.DataSource = aList;
a.DisplayMember = "Display";
4983ch06.qxd 10/7/05 11:09 AM Page 168

C H A P T E R 6
■
R E N D E R I N G R E P O RT S F R O M . N E T A P P L I C AT I O N S
169
}
}
}
}
catch (SoapException ex)
{
MessageBox.Show(ex.Detail.InnerXml.ToString());
}
}
Listing 6-9.
Combo Item Class
public class ComboItem
{
public ComboItem(string disp, string myvalue)
{
if (disp != null)
display=disp;
else
display = "";
if (myvalue != null)
val=myvalue;
else
val = "";
}
private string val;
public string Value
{
get{ return val;}
set{ val=value;}
}
private string display;
public string Display
{
get{ return display;}
set{ display=value;}
}
public override string ToString()
{
return display;
}
}
Upon loading, you’ll see a form like Figure 6-9 that displays a series of combo boxes, each
containing the valid values for the report parameters.
4983ch06.qxd 10/7/05 11:09 AM Page 169
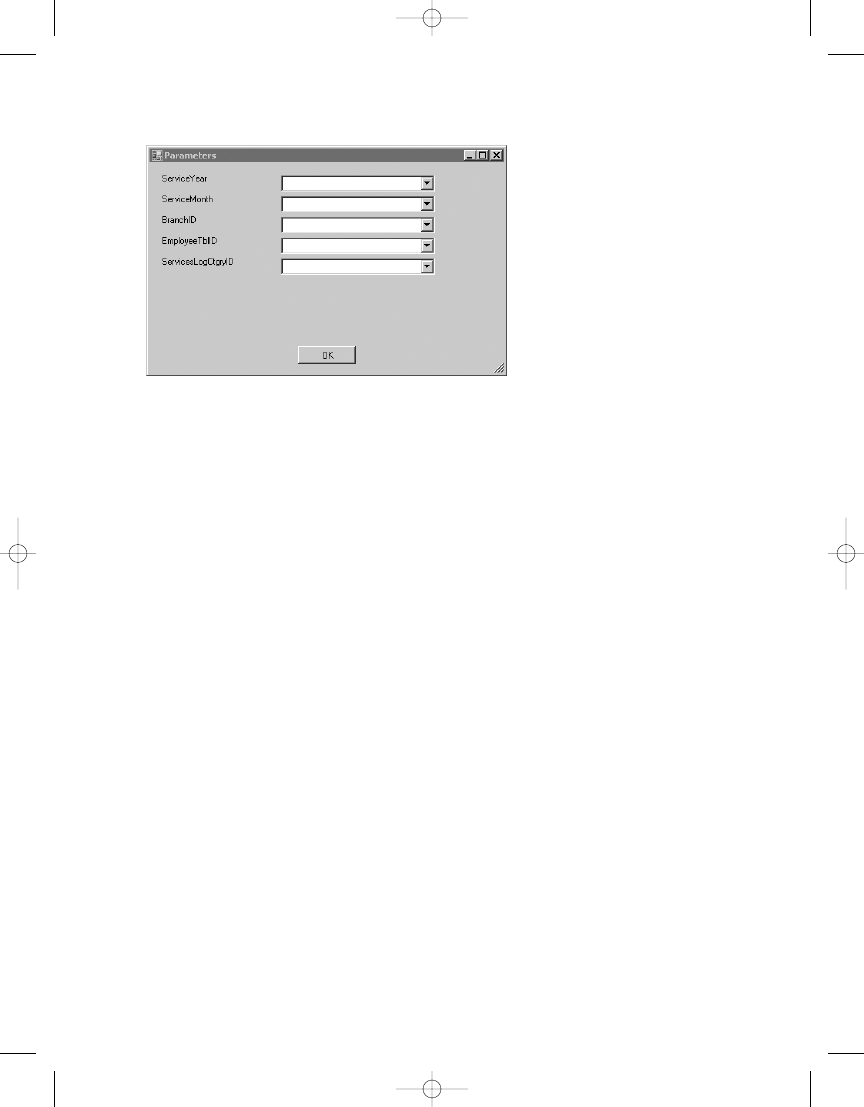
C H A P T E R 6
■
R E N D E R I N G R E P O RT S F R O M . N E T A P P L I C AT I O N S
170
Rendering the Final Report
To finish your SSRS 2005 Windows Forms viewer application, you need to set the parameters’
local variable to the parameter values the user has selected so you can retrieve them from the
ViewerRVC.cs
form using a property you will create in the GetParameters class called Parameters.
You will populate the parameters variable by creating a method called ViewerParameters.
Make sure the GetParameters form is displayed in Designer mode, and double-click the
OK button. To the buttonOK click event handler, add the code shown in Listing 6-10.
Listing 6-10. buttonOK click
Event Handler for the OK Button
private void buttonOK_Click(object sender, EventArgs e)
{
parameters = ViewerParameters();
this.DialogResult = DialogResult.OK;
Close();
}
The method that it calls, ViewerParameters, simply iterates through the combo boxes and
creates an array of ReportParameters, which are essentially name-value pairs used by the
ReportViewer control, as shown in Listing 6-11.
Listing 6-11.
Get Parameters Entered by User
private Microsoft.Reporting.WinForms.ReportParameter[] ViewerParameters()
{
int numCtrls = (this.parameterPanel.Controls.Count / 2);
Microsoft.Reporting.WinForms.ReportParameter[] rp =
New Microsoft.Reporting.WinForms.ReportParameter[numCtrls];
int i = 0;
Figure 6-9.
The Parameters dialog box
4983ch06.qxd 10/7/05 11:09 AM Page 170

C H A P T E R 6
■
R E N D E R I N G R E P O RT S F R O M . N E T A P P L I C AT I O N S
171
foreach (Control ctrl in this.parameterPanel.Controls)
{
if (ctrl.GetType() == typeof(ComboBox))
{
ComboBox a = (ComboBox)ctrl;
rp[i] =
new Microsoft.Reporting.WinForms.ReportParameter();
rp[i].Name = a.Name;
if (a.SelectedValue != null &&
a.SelectedValue.ToString() != String.Empty)
{
rp[i].Values.Add(a.SelectedValue.ToString());
}
else
{
rp[i].Values.Add(null);
}
i++;
}
}
return rp;
}
To finish your GetParameters form, you need to add some code to allow you to pass the
report parameters and their values to the viewer form (ViewerRVC.cs), as shown in Listing 6-12.
Listing 6-12.
Property Used to Get Parameters from the ViewerRVC.cs Form
public Microsoft.Reporting.WinForms.ReportParameter[] Parameters
{
get
{
return parameters;
}
}
To bring it all together, you need to add a button and related code to its click event in
the ViewerRVC.cs form to use the new Parameters dialog box, passing in the URL of the report
you want to run. Then you read the ReportParameter array through the GetParameters forms
Parameters property and use it to set the report parameters for the ReportViewer control, as
shown in Listing 6-13.
Listing 6-13. getParameters click
Event: Retrieving the Parameters and Running the Report
private void getParameters_Click(object sender, EventArgs e)
{
reportURL.Text = "http://localhost/reportserver?➥
/Pro_SSRS/Chapter_6/EmployeeServiceCost";
GetParameters reportParameters = new GetParameters(reportURL.Text);
4983ch06.qxd 10/7/05 11:09 AM Page 171
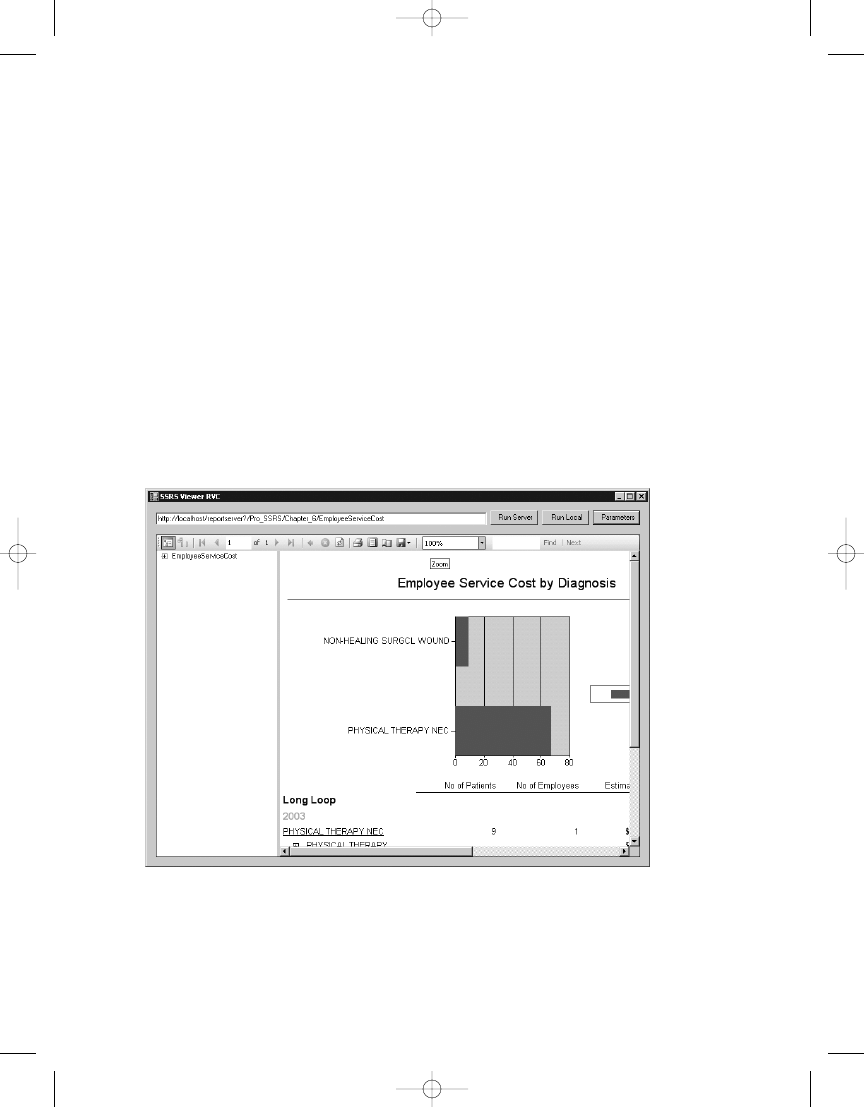
C H A P T E R 6
■
R E N D E R I N G R E P O RT S F R O M . N E T A P P L I C AT I O N S
172
{
reportViewer.ProcessingMode =
Microsoft.Reporting.WinForms.ProcessingMode.Remote;
reportViewer.ServerReport.ReportServerUrl =
new Uri(@"http://localhost/reportserver/");
reportViewer.ServerReport.ReportPath =
"/Pro_SSRS/Chapter_6/EmployeeServiceCost";
reportViewer.ServerReport.SetParameters(reportParameters.Parameters);
reportViewer.ShowParameterPrompts = false;
reportViewer.RefreshReport();
}
}
Now run the project in debug mode. When the form displays, click Parameters. The
Parameters dialog form will be displayed. Select 2003 for the ServiceYear option, leave the other
drop-down lists blank, and click OK. This renders the local Employee Service Cost report, which
is located on the SSRS 2005 server using the parameters you have supplied. At this point, you
should see something that looks like Figure 6-10.
Now you have a foundation for a report viewer to use with Windows Forms. This example
has implemented URL access as well as used the new ReportViewer controls for rendering the
reports, providing you with multiple choices for integrating reporting into your Windows
Figure 6-10.
The finished report using your parameters
4983ch06.qxd 10/7/05 11:09 AM Page 172

C H A P T E R 6
■
R E N D E R I N G R E P O RT S F R O M . N E T A P P L I C AT I O N S
173
Forms applications. You’ve made your viewer a lot more user-friendly by using SSRS 2005’s
SOAP-based API to access the rich functionality of SSRS 2005 to retrieve the available report
parameters and possible values. This allows you to create a more familiar and responsive
Windows-based user interface for your users.
You can also render reports using the Report Server Web service directly. However, you
lose the functionality of features such as the report toolbar with its built-in navigation and
export functionality. This means you have to create these on your own if you use the SOAP API
for rendering.
Summary
In this chapter, we showed how to use the URL access capabilities of SSRS 2005 and the new
ReportViewer controls to embed reports quickly into applications. Beyond the WebBrowser
and ReportViewer controls used in this chapter, you can use other applications to render
reports. For example, SSRS 2005 includes a new Report Viewer Web Part for Windows Share-
Point Services and SharePoint Portal Server as well as a Report Explorer Web Part. We’ll discuss
using these in greater detail in Chapter 10. By combining SharePoint and SSRS 2005, you can
quickly build a portal that displays your reports without much code at all.
In this chapter, you also learned how to make Report Server Web service calls to augment
your Windows Forms viewer application. The application you created allows you to type the
URL of a server-based report you want to view. It then uses SSRS 2005’s GetReportParameters
method to retrieve a list of report parameters and the ValidValues method to retrieve possible
values. It then reads the values selected by the user and populates an array of
ReportParamters
, which is then used by the Report Viewer control to render your report with
the selected parameters. In Chapter 8, we’ll expand on this example by using the Report Server
Web service to allow the user to set the report to run on a schedule with the supplied parame-
ters instead of rendering it immediately.
4983ch06.qxd 10/7/05 11:09 AM Page 173

4983ch06.qxd 10/7/05 11:09 AM Page 174

Deploying Reports
T
hroughout the lifecycle of a report—from creation to maintenance—administrators, devel-
opers, and now even end users using Report Builder need to deploy reports continually to the
SSRS 2005 server. Deploying a report simply means uploading the RDL file onto the SSRS 2005
server so that your users can use it. (For more information on the specifics of the RDL format
of these reports, see Chapter 3.)
Fortunately, SSRS 2005 provides several means for deploying reports:
Using the Report Manager interface through your Web browser: This simple method allows
anyone with an RDL file to upload it to the SSRS 2005 server. This can be especially useful
if you’re developing your report’s RDL files in an application that doesn't provide you
with a method to upload them to the server. It’s also useful if you want to make a quick edit
of the RDL file—say to change a misspelled word—using an application such as Notepad,
which doesn’t offer a built in way to upload the report. We cover this scenario in Chapter 8,
where Notepad is used to modify a report.
Using the Import option in SSMS: SSMS is now a centralized management tool for all
services provided by SQL Server 2005 including Reporting Services. You can use SSMS to
import reports and add data sources.
Using the Deploy option in SQL Server BIDS: This method allows you to deploy your
reports to the SSRS 2005 server from directly within your development environment. If
you’re using BIDS and have direct access to the report server to which you want to deploy
your reports, this is by far one of the easiest options.
Using the Deploy option in Visual Studio 2005: This method is essentially identical to
deploying a report with BIDS, thanks to the high level of integration between SQL Server
2005 and Visual Studio 2005.
Using the Save option in Report Builder: Using the Save option in Report Builder offers
a quick and simple way to deploy your custom reports built with Report Builder. We cover
this method in Chapter 11, when building and deploying a custom report.
Using the rs command-line utility: The rs command-line utility is a runtime environment
used to execute VB .NET code in the form of specially formatted script files. You deploy the
report in the same way as the method in the next item of this list. You can find out more
about the rs command-line utility in Reporting Services Books Online.
175
C H A P T E R 7
■ ■ ■
4983ch07.qxd 10/7/05 11:11 AM Page 175
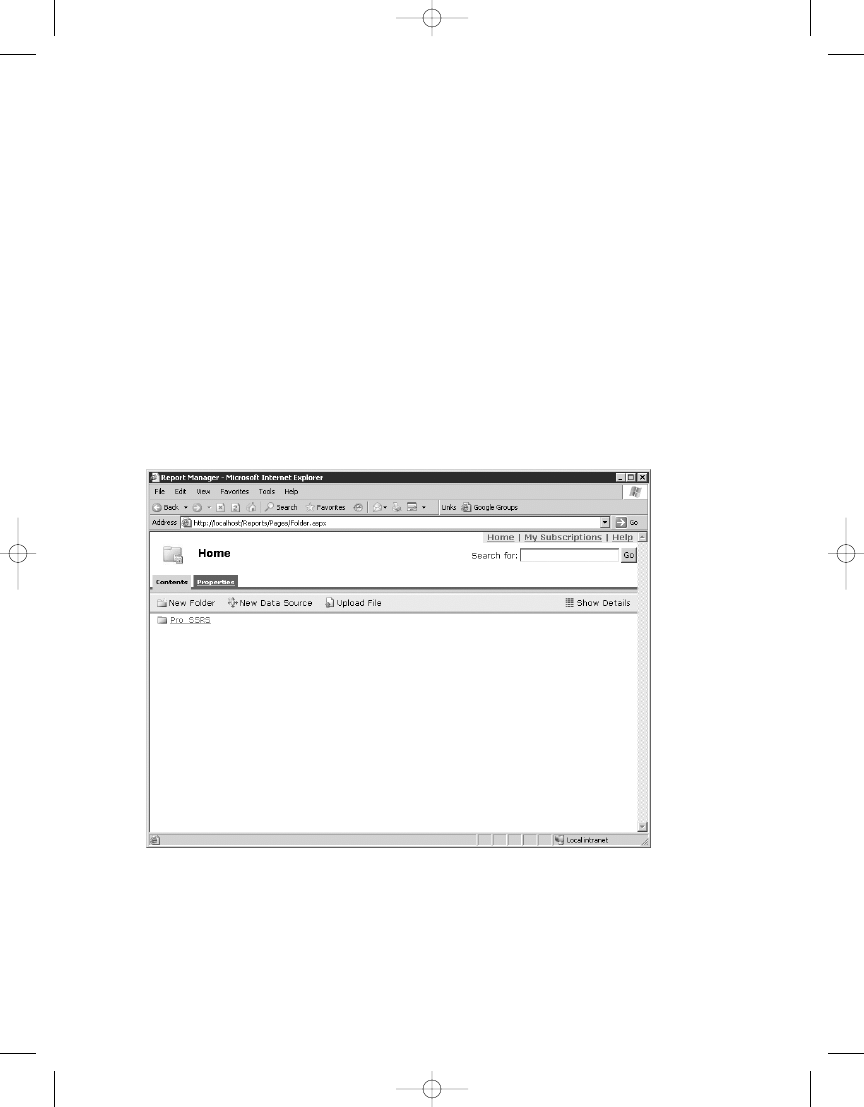
C H A P T E R 7
■
D E P L OY I N G R E P O RT S
176
Figure 7-1.
Report Manager
Programmatically, using the SOAP API: This method gives you complete control over the
deployment process with the added advantage of creating any type of UI you want. Unlike
the rs command-line utility, you have your choice of languages and the full power of
Visual Studio 2005 to help you develop your custom interface. In Chapter 6, we used the
SOAP API, otherwise known as the Report Server Web service, to retrieve report parameter
information about reports from the SSRS 2005 server, and then used that information to
generate a Windows Forms UI for parameter selection. In this chapter, you’ll use the Report
Server Web service to publish reports to the SSRS 2005 server. This type of interface is use-
ful when you need to integrate the deployment of reports into your setup, installation, or
runtime environment for your custom application.
Using Report Manager
To deploy reports using the Report Manager interface, simply open your browser and navigate
to your SSRS 2005 server using an address such as http://localhost/reports/. You see a screen
similar to the one in Figure 7-1.
As you can see, an Upload File option is on the Report Manager toolbar. Selecting Upload
File opens a standard browser-based upload-style dialog box such as the one shown in
Figure 7-2.
4983ch07.qxd 10/7/05 11:11 AM Page 176
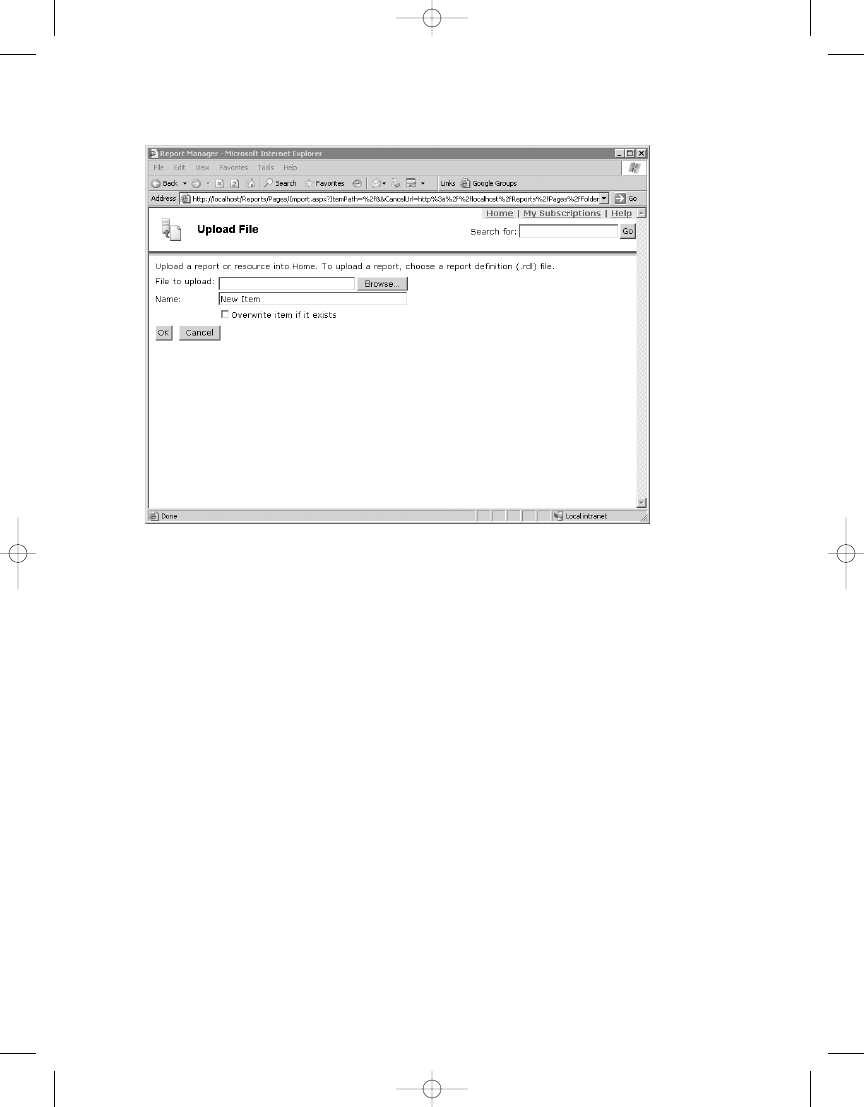
C H A P T E R 7
■
D E P L OY I N G R E P O RT S
177
Figure 7-2.
Report Manager Upload File dialog box
Using this dialog box, you can browse to the RDL file that you want to upload and then
upload it. Report Manager places the file into the current folder (the one from which you initi-
ated the upload process).
After the report is uploaded, you can use the Report Properties page of Report Manager to
modify the properties of the report, such as the name and description, as shown in Figure 7-3.
4983ch07.qxd 10/7/05 11:11 AM Page 177
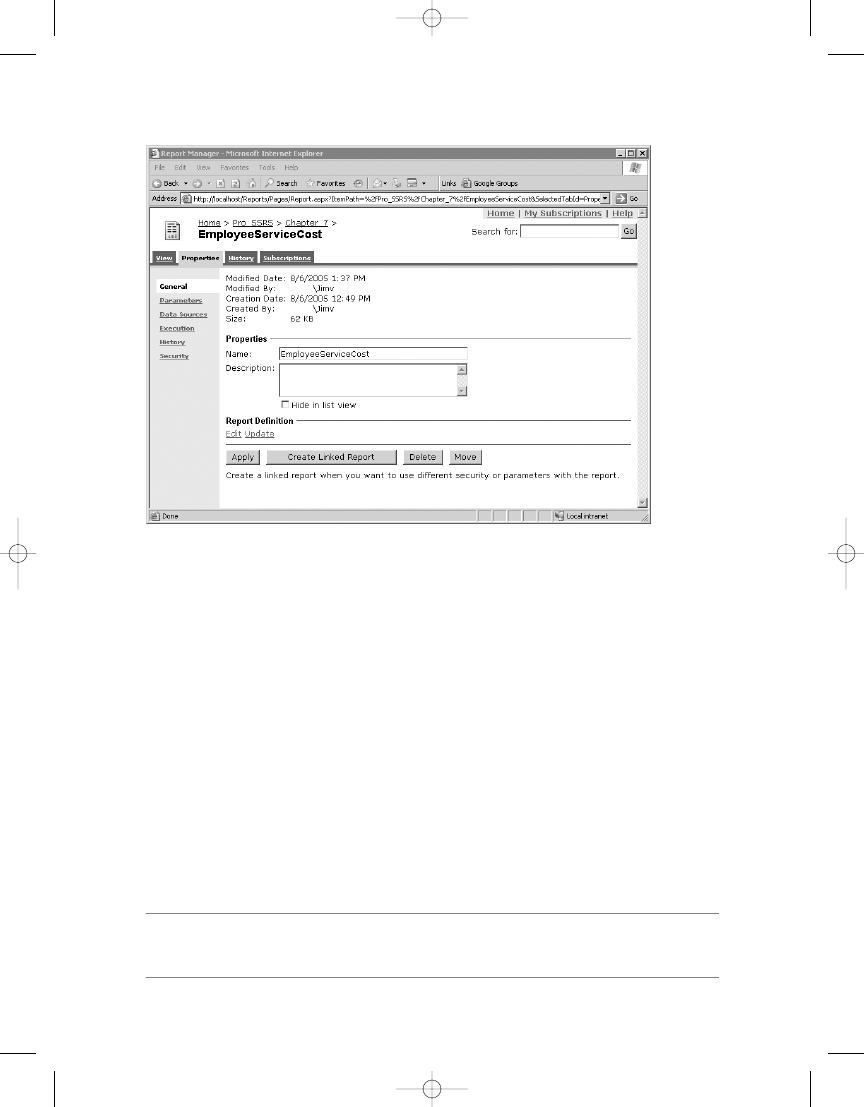
This page also enables you to do the following:
Hide the report in the list view: This can be useful if you don’t want users with access to the
SSRS 2005 server to know that certain reports exist or if you don’t want them to see the
detailed information about the report. Remember that this only hides the report in the
summary view and not the detail view. You can combine the capability to hide reports
with security when you need to prevent a user from running a report.
Edit the RDL and update it by uploading a new copy of the RDL file: This can be useful
when you want to make a minor modification to a report, such as changing the spelling of
a word or modifying an expression. Keep in mind that this method only provides you
access to the RDL file; you still have to use another program to edit the file, and then you
have to upload the modified file.
Delete the report and/or move it to another location on your report server: This gives you
the ability to remove reports that are no longer needed and to organize the reports into
folders for organizational and security purposes.
■
Note
You can perform many of these same operations in detail view by clicking the Show Details icon on
the Report Manager toolbar.
C H A P T E R 7
■
D E P L OY I N G R E P O RT S
178
Figure 7-3.
Report Properties page
4983ch07.qxd 10/7/05 11:11 AM Page 178
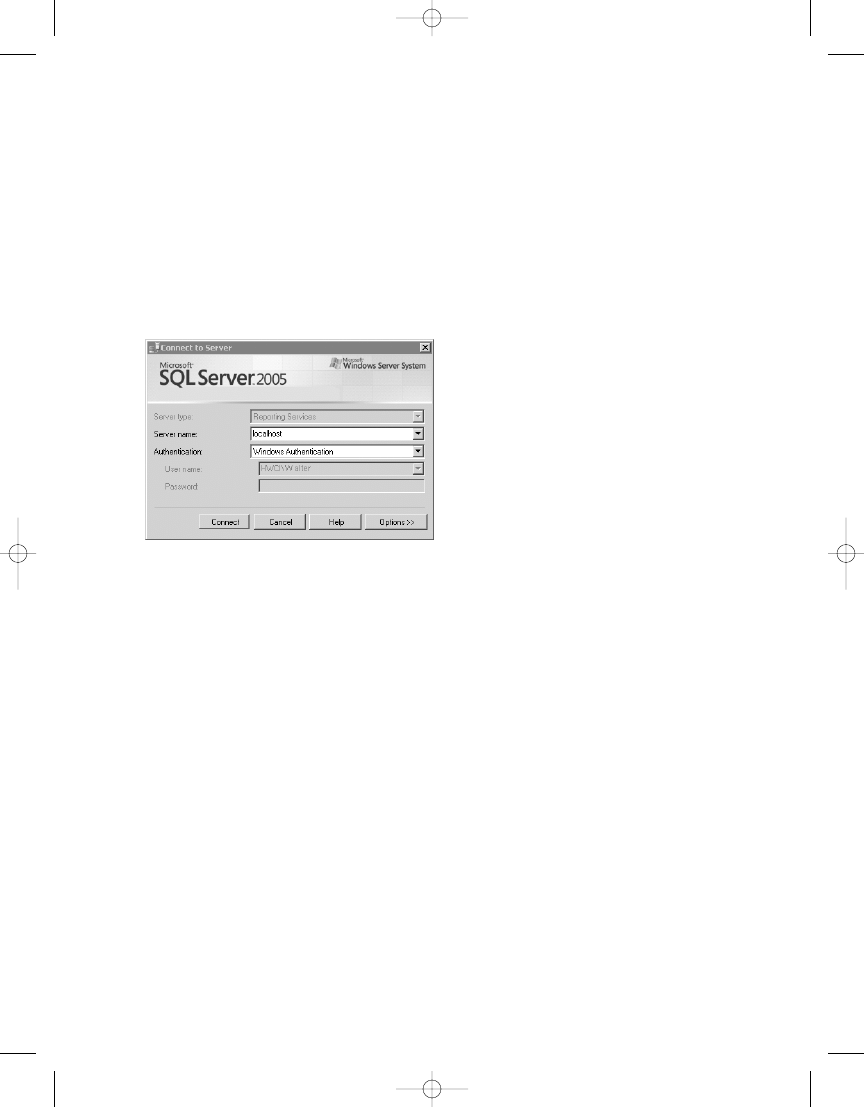
C H A P T E R 7
■
D E P L OY I N G R E P O RT S
179
Using SQL Server Management Studio (SSMS)
To deploy reports using the SSMS, simply open SSMS and connect to your SSRS 2005 server.
When the Connect to Server dialog box appears, select Reporting Server in the Server Type list-
box. The Server Name selection defaults to the local server’s actual name, which you can use if
appropriate. If running locally, you can also use localhost. If your SSRS 2005 services are run-
ning on a different server, simply enter the name here. Choose the appropriate Authentication
type; this is usually the default Windows Authentication. You should see a screen similar to the
one in Figure 7-4.
After you’ve connected to your SSRS 2005 server, you’ll see it listed in the Object Explorer
and in the main Summary tab, as shown in Figure 7-5.
Figure 7-4.
SSMS Connect to Server dialog box
4983ch07.qxd 10/7/05 11:11 AM Page 179
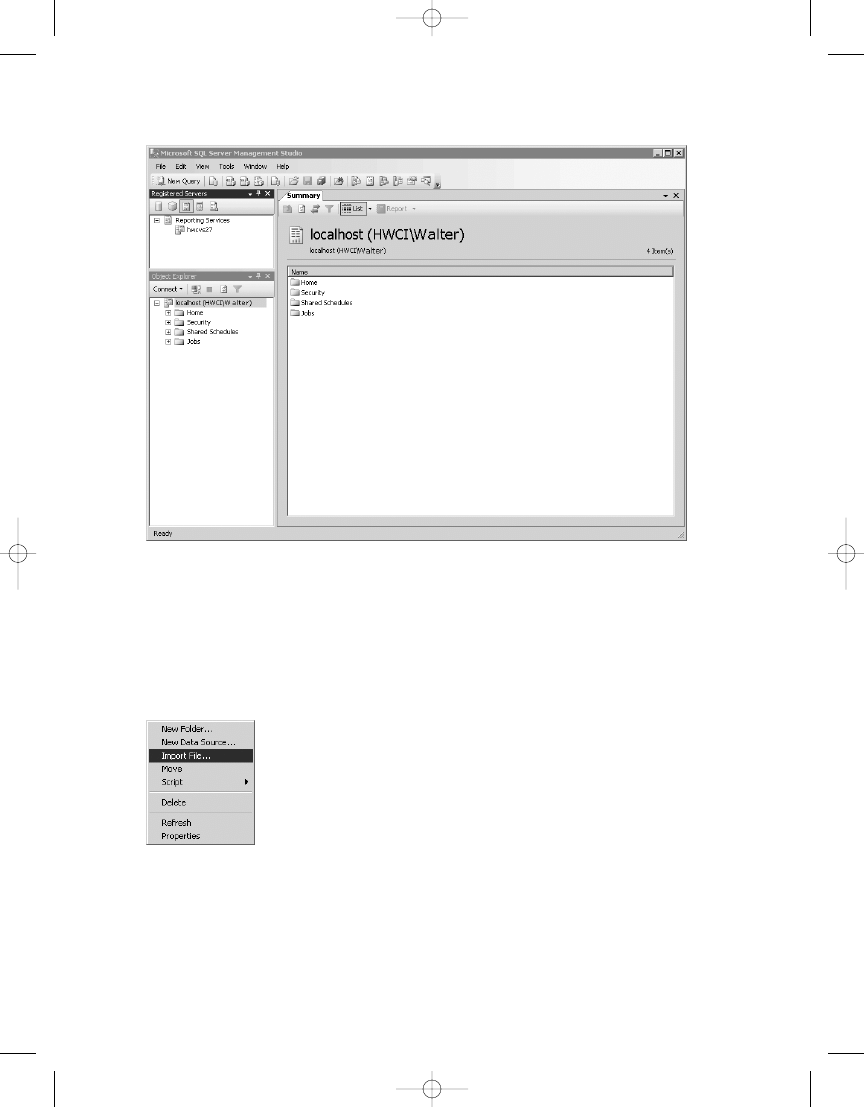
C H A P T E R 7
■
D E P L OY I N G R E P O RT S
180
The Home folder that you see in Figure 7-5 represents the root folder where your reports
are stored on the SSRS 2005 server. You can click on the Home folder to navigate to other folders
on your SSRS 2005 server, or you can right-click and create new ones. You can also set up new
data sources and import report files. To import a report’s rdl file, right-click on the folder you
want to import the file to and the shortcut menu shown in Figure 7-6 appears.
Select Import File as shown in Figure 7-6. On the Import File form, click the ellipsis button
to browse to the RDL file you want to upload. You can then set the name of the file as it will
appear on the report server and select to overwrite the file if it already exists. After you have
selected the file and named it, it will appear similar to Figure 7-7. Click OK and the report you
selected is imported to your SSRS 2005 server.
Figure 7-5.
SSMS main interface
Figure 7-6.
Shortcut menu from a folder
4983ch07.qxd 10/7/05 11:11 AM Page 180
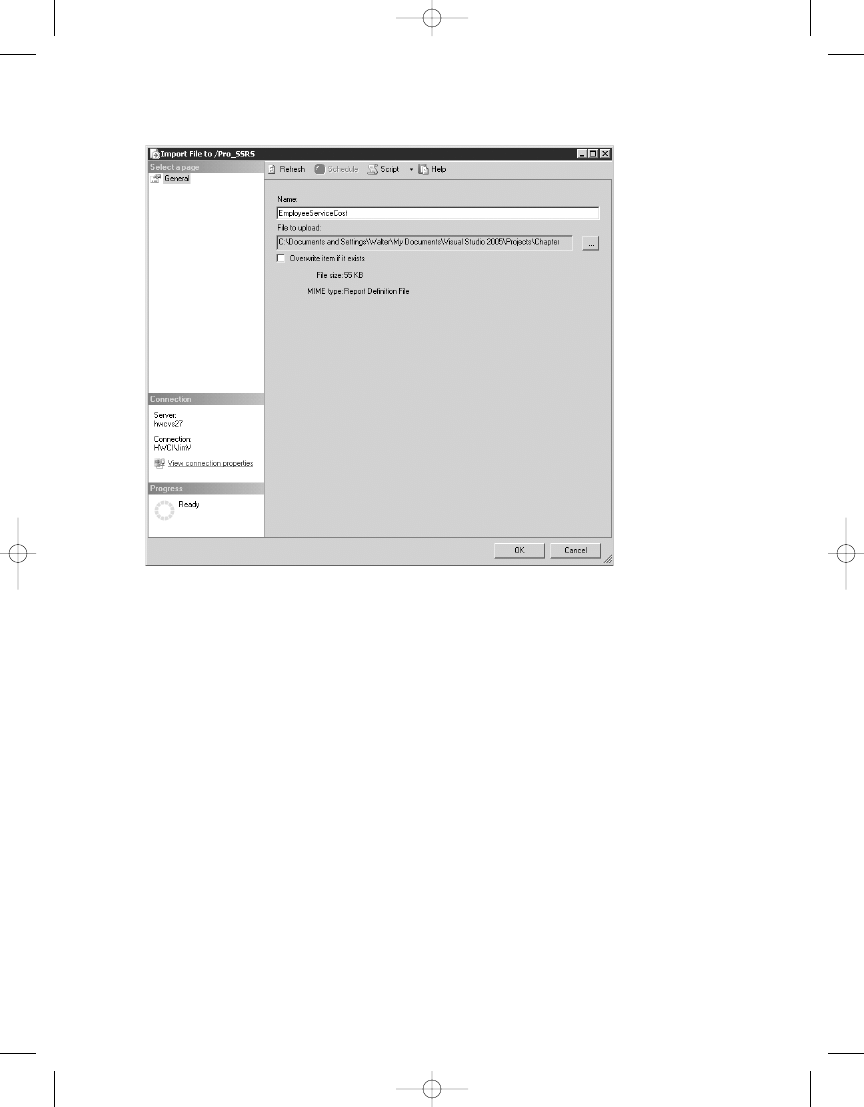
C H A P T E R 7
■
D E P L OY I N G R E P O RT S
181
Using BIDS and Visual Studio 2005
You also can deploy reports using the Deploy option in BIDS and Visual Studio 2005. This is
convenient, because probably you’ll be using one of these to develop your reports in many
cases. In the examples in this chapter, we are looking specifically at Visual Studio 2005; how-
ever, using BIDS is nearly identical because they are both now based on the same IDE.
Configuring Report Deployment Options
BIDS and Visual Studio 2005 allow you to configure a different set of properties for each proj-
ect in your solution. You also can set these properties for each configuration available for your
project, such as Debug, DebugLocal, and Release. For each configuration of a report project, you
can define values uniquely for the following properties:
• StartItem: The name of the report to be displayed in the preview window or in a browser
window when the report project is run.
• OverwriteDataSources: A Boolean value indicating whether or not to overwrite an
existing data source on the server. Set it to true to overwrite, which redeploys any data
sources you have defined in your project each time you select Deploy. Set it to false if
you don’t want existing data sources overwritten.
Figure 7-7.
Report Server Import File dialog box
4983ch07.qxd 10/7/05 11:11 AM Page 181
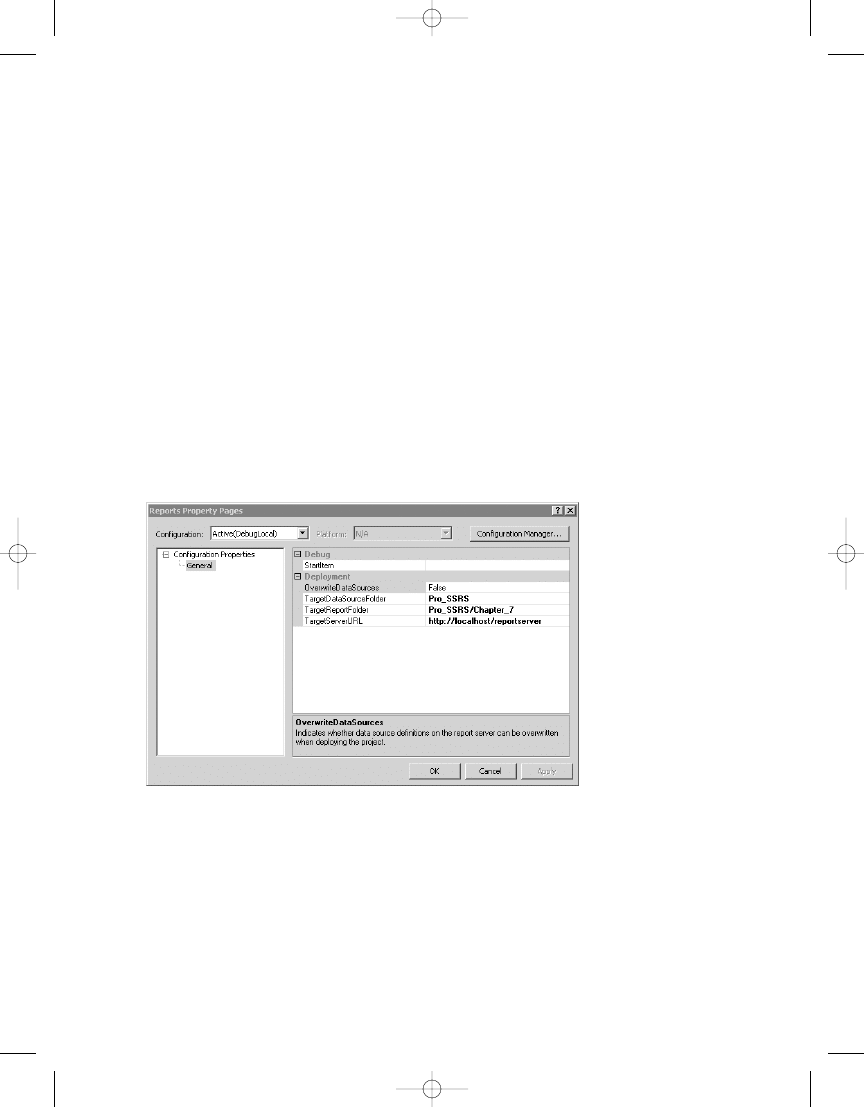
C H A P T E R 7
■
D E P L OY I N G R E P O RT S
182
• TargetDataSourceFolder: The name of the folder in which to place your shared data
sources.
• TargetReportFolder: The name of the folder in which to place your reports. By default,
this is the name of the report project.
• TargetServerURL: The URL of the target report server, such as http://localhost/
reportserver
.
The different configurations are convenient for the report developer because you can set
up different servers and/or folders for testing and deployment in the same project. By default,
when you create a report project, BIDS and Visual Studio 2005 create three different config-
urations for you: Debug, DebugLocal, and Production. You can access the properties for these
configurations through the project’s Property Pages. To get to the configuration Property Pages,
in the Solution Explorer, right-click the project containing the reports and then click Properties.
To see the property settings for each configuration option, select from the Configuration drop-
down list at the top of the dialog box. Figure 7-8 shows the Property Pages for the Reports project
in the Chapter 7 Solution that is part of the sample code provided for this chapter in the Source
Code area of the Apress Web site (http://www.apress.com).
After the configuration information is set up correctly in Visual Studio 2005, you can
deploy reports to your server by using the Build and Deploy options in the Configuration
Manager or by using the Solution Explorer.
Deploying Reports Using the Configuration Manager
The Build and Deploy options in the Configuration Manager determine whether reports are
built, deployed, or both when you start the project in Visual Studio 2005.
Figure 7-8.
Project Property Pages
4983ch07.qxd 10/7/05 11:11 AM Page 182
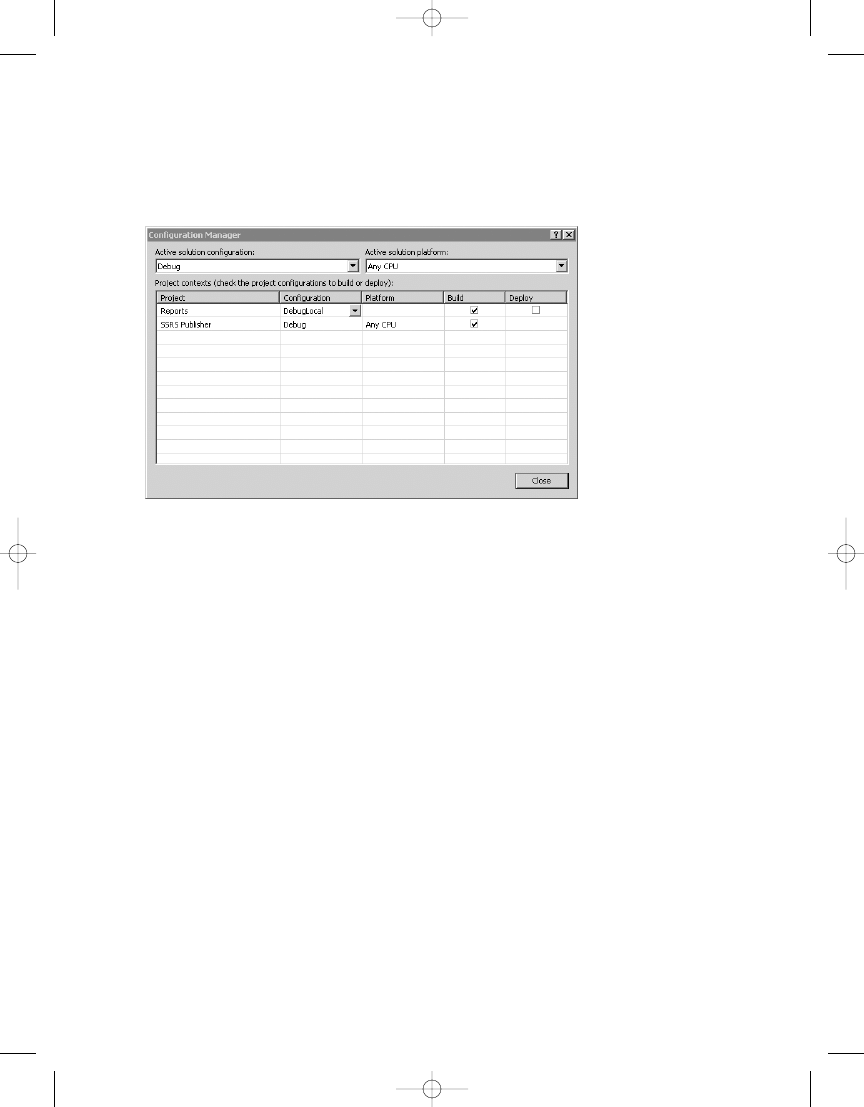
C H A P T E R 7
■
D E P L OY I N G R E P O RT S
183
To open the Configuration Manager, in the Solution Explorer, right-click the project con-
taining the reports and then click Properties. From there, click Configuration Manager to open
the dialog box shown in Figure 7-9.
By default, you see the setup for the currently active configuration. You can select other
configurations by choosing from the Active solution configuration drop-down list. As you can
see, for each project in your solution, checkboxes are in the Build and the Deploy columns.
Each time you start the project, you want to build it so that you will always run the latest
version of your report. If the Deploy checkbox is also checked, then whenever you start the
project in that configuration, Visual Studio 2005 deploys the reports to the specified server.
However, for certain configurations, such as when you’re debugging locally, you won’t neces-
sarily want to deploy your report to the server.
Deploying Reports Through Solution Explorer
You can also deploy reports from the Solution Explorer. A list of options follows for deploying
from the Solution Explorer. You deploy your reports by right-clicking each of the following
items and selecting Deploy:
• The solution: Deploys the reports in all the Report Server Projects in your solution to the
server that has been set up in each project’s properties.
• The project: Deploys the reports in the specific project in your solution to the server that
has been set up in the specified project’s properties. This option is only available for
Report Server projects.
• The report: Deploys an individual report from a project in your solution to the server
that has been set up in the project properties containing the report you’re deploying.
Figure 7-10 shows an example of deploying all the reports in a project.
Figure 7-9.
Visual Studio 2005 Configuration Manager
4983ch07.qxd 10/7/05 11:11 AM Page 183
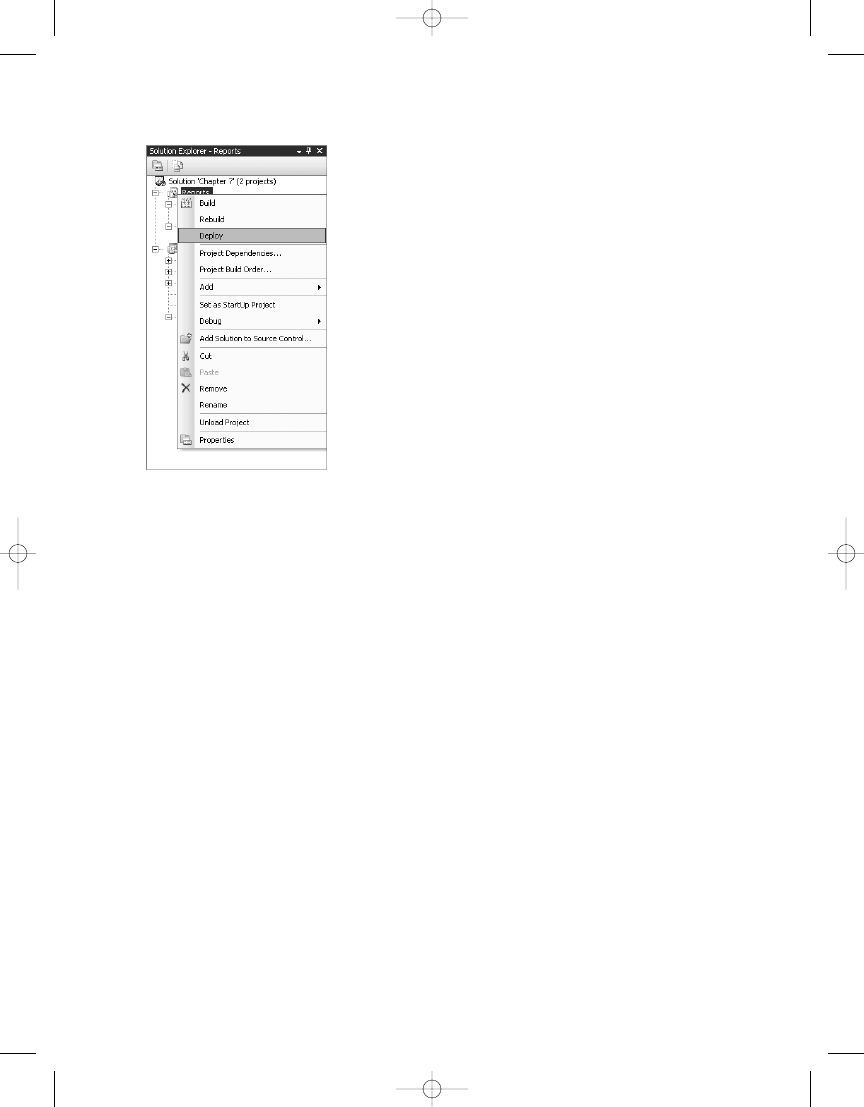
C H A P T E R 7
■
D E P L OY I N G R E P O RT S
184
Using the Report Server Web Service
The method provided by SSRS 2005 for deploying reports programmatically is through using
the Report Server Web service also known as the SOAP API (introduced in Chapter 6 when we
wrote our report viewer). In this section, we’ll look at deploying reports to SSRS 2005 by using
a Windows Forms application that simulates what customers need to do after they have an
RDL file ready for deployment:
• Select a report server to publish their report to.
• Select from a displayed list of folders on that server to determine which folder on the
server to publish the report to.
• Browse to the RDL file that is to be uploaded to their report server.
You will use the Report Server Web service to get a list of folders on the server and then
upload the report to the server. In this example, you’ll upload some of the reports created for
the health-care provider. In the healthcare setting, it’s important to maintain strict control over
the report folders and their permissions on the server, so you won’t allow the users to create
a new folder, only to upload to the existing folders that they already have permission to use.
The CreateReport method of the Report Server Web service allows you to deploy the
report to the report server by creating a copy of the report on the server from an RDL file that
you provide, using the following parameters:
• Report: A string that is the name of the new report. SSRS 2005 uses this name, and it
appears in the SSRS 2005 Report Manager.
• Parent: A string that is the full path name of the parent folder to add the report to.
Figure 7-10.
Deploying a solution through the Solution Explorer
4983ch07.qxd 10/7/05 11:11 AM Page 184

C H A P T E R 7
■
D E P L OY I N G R E P O RT S
185
• Overwrite: A Boolean expression that indicates whether an existing report with the
same name in the location specified should be overwritten.
• Definition: Byte array containing the report definition to publish to the report server.
This is an in-memory representation of the report that’s created by reading the RDL file
from disk.
• Properties: An array of Property[] objects that contains the property names and values
to set for the report. Property[] objects are simply name-value pairs that hold the report’s
properties. You can use them to set the description of your report, for example, by using
the Description property.
■
Note
The
CreateReport
method might pass sensitive data, including user credentials, over the network.
You should use SSL encryption whenever possible when making Web service calls with this method.
First you’ll create a new C# Windows Forms solution with Visual Studio 2005. Call this
project SSRS_Publisher.
Accessing the Web Service
You need to add a reference to the SSRS 2005 Report Server Web service, which is the same as
you did in Chapter 6 for the report viewer. You do this by selecting Project ➤ Add Web Reference
or by right-clicking the references in the Solution Explorer and selecting Add Web Reference. When
the dialog box appears, enter the following URL:
http://localhost/reportserver/reportservice2005.asmx
Substitute the name of your server for localhost in the preceding URL, and then click the
Go button. You see a dialog box similar to the one in Figure 7-11.
4983ch07.qxd 10/7/05 11:11 AM Page 185
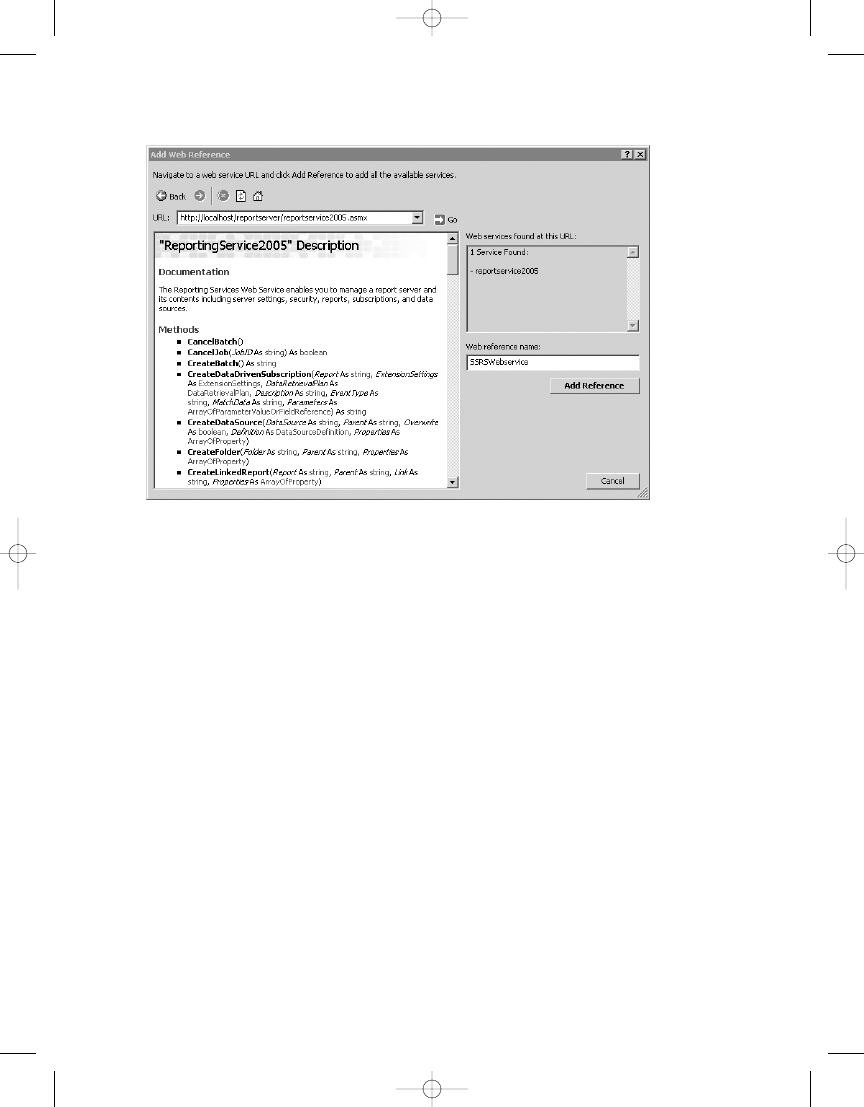
C H A P T E R 7
■
D E P L OY I N G R E P O RT S
186
In the Web reference name textbox, enter SSRSWebService, which is how the Web service
is referenced in the code.
After this dialog box is closed, add the following using directives to the code:
using SSRS_Publisher.SSRSWebService;
Now you can reference the Web service much more easily because you don’t have to enter
the fully qualified namespace. You’ll also add three other using directives that allow you to access
the Web services and I/O-specific functions more easily in your code, as shown in Listing 7-1.
Listing 7-1.
Using Directives
using System.IO;
using System.Text.RegularExpressions;
using System.Web.Services.Protocols;
Laying Out the Form
From the Toolbox, add one label, one textbox, and one button near the top of the form, set the
label text to Report server, and name the textbox reportServer. Name the button getFolders
and set its text to Go. You’ll use the reportServer textbox to allow the user to enter in the report
server URL that they want to deploy to.
Next, add a TreeView control to the center of the form and name it ssrsFolders. You’ll use
it to display a list of available folders on the server where you can upload your report when the
Figure 7-11.
Add Web Reference dialog box
4983ch07.qxd 10/7/05 11:11 AM Page 186
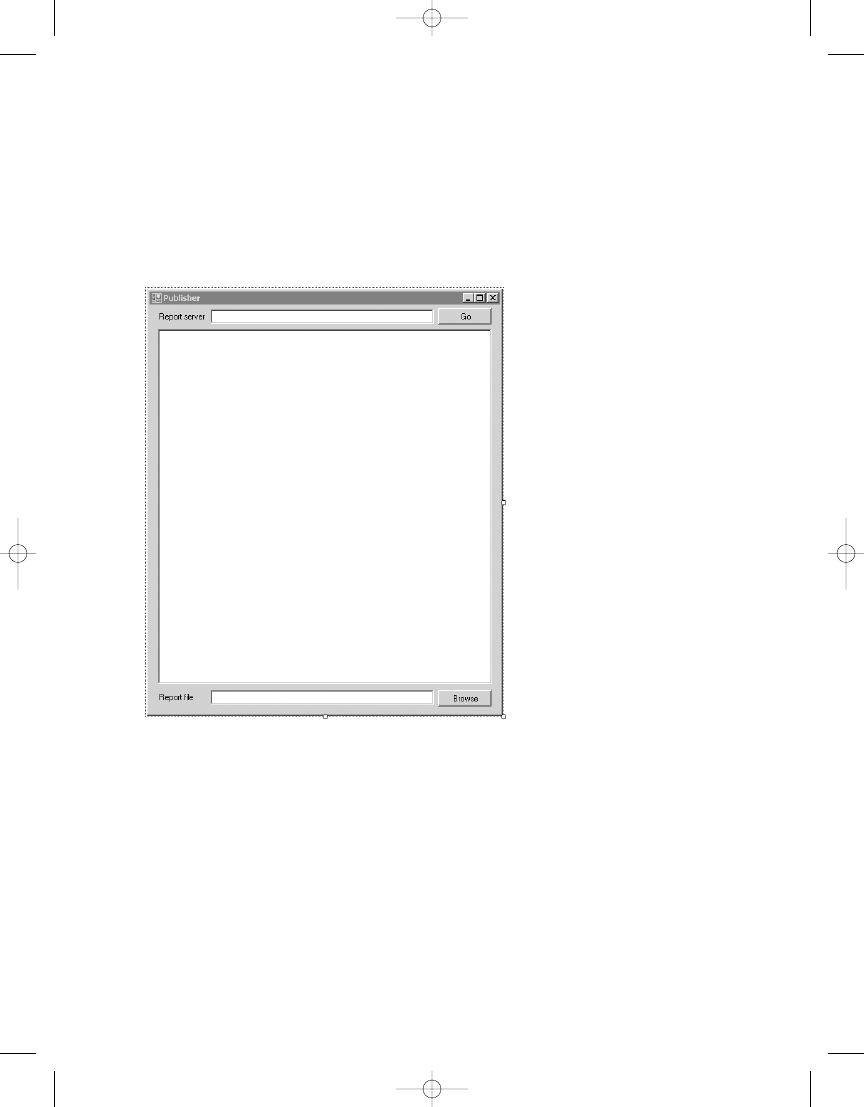
C H A P T E R 7
■
D E P L OY I N G R E P O RT S
187
Add one label, one textbox, and one button near the bottom of the form; set the label text
to Report file; name the textbox reportFile; name the button browseFile; and set the text to
Browse. You’ll use the reportFile textbox to accept or display the path name and file name of
the report file you want to upload to the specified SSRS 2005 server. You’ll use the Browse but-
tons to choose the form that accepts the users’ input.
After you’ve added all these controls, the form should look something like Figure 7-12.
Coding the Form
Now that you have the form laid out, you’ll add code to handle the functions necessary to
allow users to do the following:
1.
Enter in a server name.
2.
Get a list of the folders available on that server.
3.
Select the folder to upload to.
4.
Select an RDL file to upload.
Figure 7-12.
Publisher, the example report publisher
4983ch07.qxd 10/7/05 11:11 AM Page 187

C H A P T E R 7
■
D E P L OY I N G R E P O RT S
188
Identifying the SSRS 2005 Server
When a user types in a server name on the form, the code needs to build the URL that fully
identifies the SSRS 2005 server to deploy the RDL file to.
First, you create a class-level variable to hold the reference to the report server, much as
you did in the SSRS viewers in Chapter 6. You do this by adding the variable definition private
ReportingService2005 rs;
to the class, as shown in Listing 7-2.
Listing 7-2.
Class-level Variable in Context
public partial class Publisher : Form
{
private ReportingService2005 rs;
public Publisher()
To build the URL that identifies the server based on the user input, you first instantiate
the Report Server Web service and then set the URL property to reflect the name of the server
that the user entered into the reportServer textbox.
To do this, first create a short function to check the server name that the user enters and
then append the rest of the path name to the Reporting Services Web service to make up the
complete URL necessary to reference the Reporting Services Web service on the desired server.
By constructing the URL based on the user’s input, you can use the report deployment applica-
tion to deploy the reports on any SSRS 2005 server where the user has permission to do so.
Start by adding the code shown in Listing 7-3 into the Publisher class.
Listing 7-3.
Get Report Server URL
private string GetRSURL()
{
if (reportServer.Text.StartsWith("http://"))
return reportServer.Text + "/reportserver/ReportService2005.asmx";
else
return "http://" + reportServer.Text
+ "/reportserver/ReportService2005.asmx";
}
Populating the TreeView Control
Now you’ll use the Reporting Services Web service to retrieve a list of objects from the server
and use them to populate the ssrsFolders TreeView control. We’ll do this by placing a call to
the ListChildren method of the Report Server Web service.
The ListChildren method takes two parameters:
• Item: The full path name of the parent folder.
• Recursive: A Boolean expression that indicates whether to return the entire tree of child
items below the specified item. The default value is false.
4983ch07.qxd 10/7/05 11:11 AM Page 188

C H A P T E R 7
■
D E P L OY I N G R E P O RT S
189
■
Note
The
ListChildren
method returns all objects on the report server, including data sources and
reports, not just folders. In this example, you’ll filter out everything but the folders because you’re only inter-
ested in the folders. You do this by using the
ItemTypeEnum
enumeration object and then testing it against
the
Type
property of the
CatalogItem
.
Make sure the Publisher.cs form is open in design view and double-click the Go button.
This creates an empty method to handle the button’s click event. Add the code in Listing 7-4
to the method.
Listing 7-4.
Code to Populate the TreeView Control
private void getFolders_Click(object sender, EventArgs e)
{
ssrsFolders.Nodes.Clear();
rs = new ReportingService2005();
rs.Credentials = System.Net.CredentialCache.DefaultCredentials;
CatalogItem[] items = null;
rs.Url = GetRSURL();
TreeNode root = new TreeNode();
root.Text = "Root";
ssrsFolders.Nodes.Add(root);
ssrsFolders.SelectedNode = ssrsFolders.TopNode;
// Retrieve a list of items from the server
try
{
items = rs.ListChildren("/", true);
int j = 1;
// Iterate through the list of items and find all of the folders
// and display them to the user
foreach (CatalogItem ci in items)
{
if (ci.Type == ItemTypeEnum.Folder)
{
Regex rx = new Regex("/");
int matchCnt = rx.Matches(ci.Path).Count;
if (matchCnt > j)
{
ssrsFolders.SelectedNode =
ssrsFolders.SelectedNode.LastNode;
j = matchCnt;
}
4983ch07.qxd 10/7/05 11:11 AM Page 189

C H A P T E R 7
■
D E P L OY I N G R E P O RT S
190
else if (matchCnt < j)
{
ssrsFolders.SelectedNode = ssrsFolders.SelectedNode.Parent;
j = matchCnt;
}
AddNode(ci.Name);
}
}
}
catch (SoapException ex)
{
MessageBox.Show(ex.Detail.InnerXml.ToString());
}
catch (Exception ex)
{
MessageBox.Show(ex.Message);
}
// Make sure the user can see that the root folder is selected by default
ssrsFolders.HideSelection = false;
}
Right below the method for the Go button’s click event, add the following method as
shown in Listing 7-5.
Listing 7-5.
AddNode Method
private void AddNode(string name)
{
TreeNode newNode = new TreeNode(name);
ssrsFolders.SelectedNode.Nodes.Add(newNode);
}
You tell the ListChildren method to start at the root folder by passing in a “/” as the start-
ing point, and also set the recursive option to true, which causes the ListChildren method to
iterate through all the folders and subfolders on the SSRS 2005 server. You use this information
to create nodes in the TreeView control to display each folder in a hierarchy that represents
the hierarchy of the folders on the server. Use a regular expression to look for the number of
“/” characters in the path of each CatalogItem to determine how deep you are in the hierarchy
(one level, two levels, and so on).
Opening the RDL File and Uploading It to the Server
Now you need to add some code to allow users to browse for the file that they want to upload.
You’ll want to limit the users to browsing for files ending in “rdl” by default, because this is the
4983ch07.qxd 10/7/05 11:11 AM Page 190

C H A P T E R 7
■
D E P L OY I N G R E P O RT S
191
native extension for SSRS 2005 report definition files. You also want to read the selected node
in the ssrsFolders TreeView so that you know what folder users have selected to deploy the
report to on the SSRS 2005 server.
Start by reading the path of the selected node from the TreeView control and turning it
into a path name you can use with SSRS 2005’s CreateReport method.
Make sure the Publisher.cs form is open in design view and double-click the Browse but-
ton. This creates an empty method to handle the button’s click event. Add the code in
Listing 7-6 to the method.
Listing 7-6.
Code to Browse for an RDL File
private void browseFile_Click(object sender, EventArgs e)
{
// Get the full path name from the TreeView control
string pathName = ssrsFolders.SelectedNode.FullPath;
if (pathName == "Root")
pathName = "/";
else
{
// Strip off the Root name from the path and
// correct the path separators for use with SSRS
pathName = pathName.Substring(4, pathName.Length - 4);
pathName = pathName.Replace(@"\", "/");
}
byte[] definition = null;
Warning[] warnings = null;
string warningMsg = String.Empty;
OpenFileDialog openFileDialog = new OpenFileDialog();
openFileDialog.Filter = "RDL files (*.rdl)|*.rdl|All files (*.*)|*.*";
openFileDialog.FilterIndex = 1;
if (openFileDialog.ShowDialog() == DialogResult.OK)
{
try
{
// Read the file and put it into a byte array to pass to SRS
FileStream stream = File.OpenRead(openFileDialog.FileName);
definition = new byte[stream.Length];
stream.Read(definition, 0, (int)(stream.Length));
stream.Close();
}
catch (Exception ex)
{
MessageBox.Show(ex.Message);
}
4983ch07.qxd 10/7/05 11:11 AM Page 191

C H A P T E R 7
■
D E P L OY I N G R E P O RT S
192
// We are going to use the name of the RDL file as the name of our report
string reportName =
Path.GetFileNameWithoutExtension(openFileDialog.FileName);
reportFile.Text = reportName;
// Now let's use this information to publish the report
try
{
warnings = rs.CreateReport(reportName, pathName, true, definition, null);
if (warnings != null)
{
foreach (Warning warning in warnings)
{
warningMsg += warning.Message + "\n";
}
MessageBox.Show ➥
("Report creation failed with the following warnings:\n" + ➥
warningMsg);
}
else
MessageBox.Show ➥
(String.Format ➥
("Report: {0} created successfully with no warnings", ➥
reportName));
}
catch (SoapException ex)
{
MessageBox.Show(ex.Detail.InnerXml.ToString());
}
}
}
The code starts by getting the full path on the SSRS 2005 server where the user has
selected to place the report from the ssrsFolders TreeView control, strips the word Root off
the front of the path, and then replaces all occurrences of a backslash in the string with the
forward slash needed for SSRS 2005.
You then set the options for the openFileDialog control so that it browses by default for
files with the RDL extension and then displays the dialog box to the user. If the user makes
a selection, the file is opened using a FileStream object and read from the stream into a byte
array. That’s because the SSRS 2005 CreateReport method expects the contents of the RDL file
to be passed in as a byte array.
Next the file name that the user selected is read and used as the title for the report in SSRS
2005. After you have a title, you have everything necessary to upload the report, which you do
by calling the CreateReport method with the values you’ve created. You can see at the end of
Listing 7-6 where the necessary code has been added into the complete listing.
4983ch07.qxd 10/7/05 11:11 AM Page 192
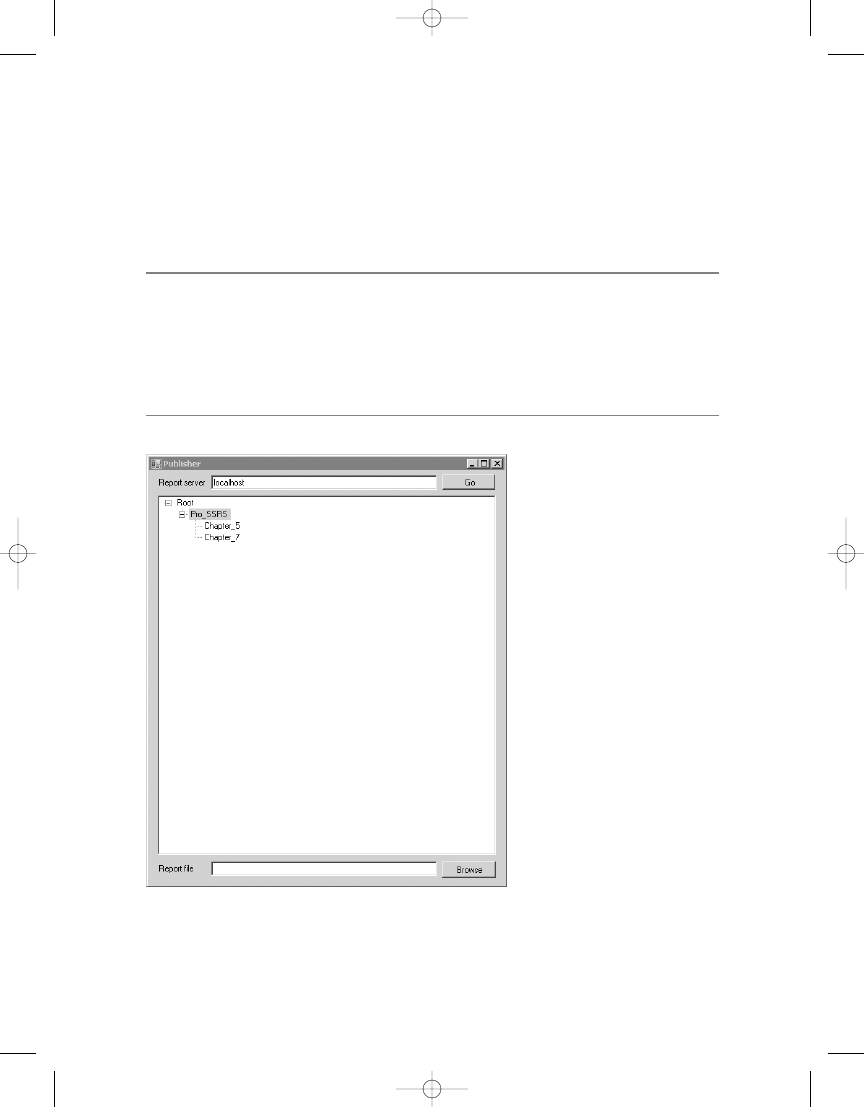
C H A P T E R 7
■
D E P L OY I N G R E P O RT S
193
Running the Application
Now let’s run the example. Start the project and when the form displays, enter the name of
your report server in the Server textbox and click Go. localhost was used in the example; use
the name of your server if it is different. Your form now looks similar to Figure 7-13, with the
folders on your SSRS 2005 server displayed and the Root folder highlighted.
■
Note
You need to deploy the Shared Data Source from the Chapter 7 sample code prior to uploading the
sample report included in Chapter 7. The report uses this shared data source and will tell you that it could
not publish the report because it can't find the shared data source on the SSRS 2005 server. Also note that
the shared data source in this chapter is in the local
Chapter 7
folder instead of the
Pro_SSRS
folder we
have been using. We did this because when uploading the report using the SSRS Publisher, it will make the
connection to the shared data source
Pro_SSRS
only if it resides in the same folder as you deploy the report to.
Figure 7-13.
Complete report publisher showing folders on the SSRS 2005 server
4983ch07.qxd 10/7/05 11:11 AM Page 193
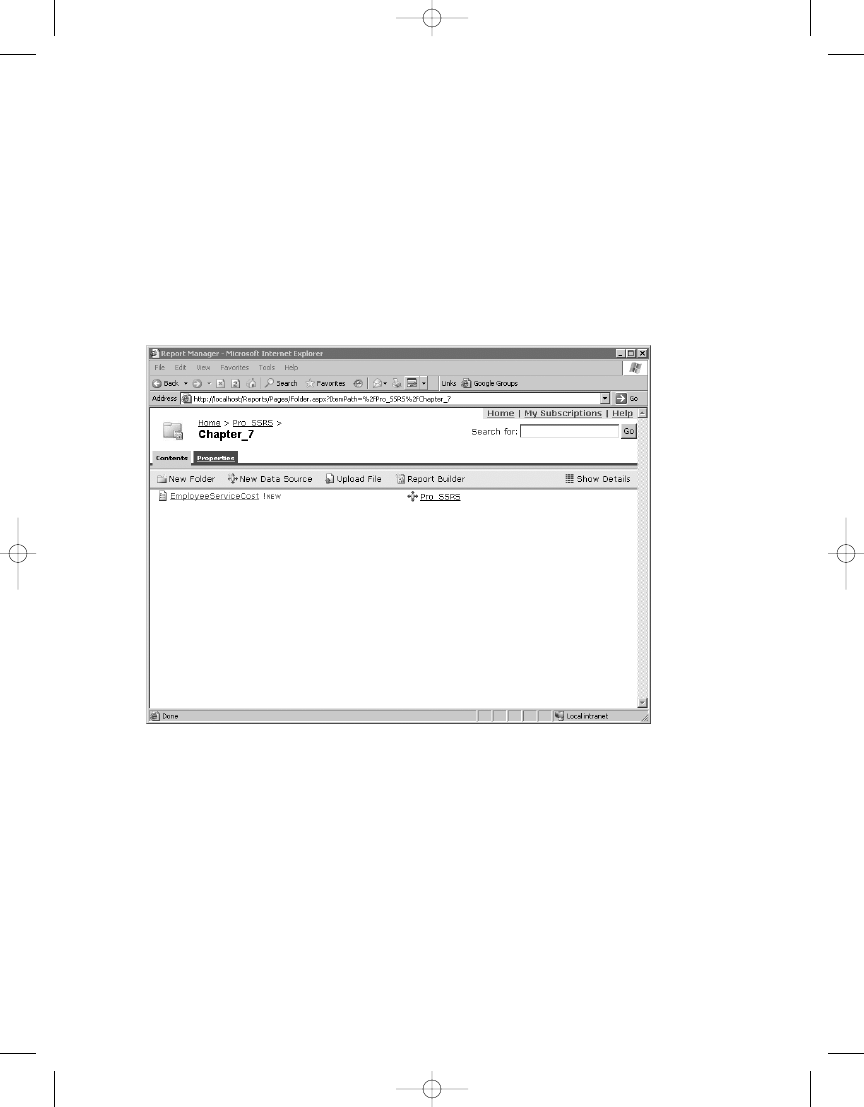
C H A P T E R 7
■
D E P L OY I N G R E P O RT S
194
Figure 7-14.
Report Manager showing uploaded report
By default, the Root folder on your server has been selected. Drill down and select the
Chapter 7 node in the TreeView. After you’ve selected the folder to use, click Open and select
the report included in the EmployeeServiceCost.rdl file included in the Chapter 7 sample code.
When you click Open, your report publishing application uses the Report Server Web services
CreateReport
method and publishes the report to the selected server.
In this case, the Pro_SSRS/Chapter_7 folder on the localhost server has been selected, and
we’re uploading a report called EmployeeServiceCost.rdl. If you navigate to that folder with
your Web browser, you’ll see something similar to the screen shown in Figure 7-14 (note that
Report Manager marks it as “!NEW” to indicate that it has just been deployed).
You now have a Windows Forms application that allows files to be uploaded to your report
server. This can be a handy way to add the capability to upload or update reports from within
an application without needing the user to interact with the SSRS 2005 Report Manager directly.
This can be especially useful if you want users to interact with all aspects of SSRS 2005
from within your application. In Chapter 6, you developed an application that allows users to
display reports from within the application. By combining that application with this report
publisher, you can handle a number of nonadministrative tasks directly from your application.
You also could expand on this example by providing the user with some additional options:
4983ch07.qxd 10/7/05 11:11 AM Page 194

C H A P T E R 7
■
D E P L OY I N G R E P O RT S
195
• You could allow the user to create shared data sources.
• You could allow the user to enter the name of the report to publish instead of taking the
name from the RDL file itself. For example, you could add another textbox to the form
and read it for the report title. So, instead of the following code:
// We are going to use the name of the RDL file
// as the name of our report
string reportName =
Path.GetFileNameWithoutExtension(openFileDialog.FileName);
you could do the following:
// We are going to read the contents of textbox reportTitle
// as the name of our report
string reportName = reportTitle.text
• You could allow the user to set other properties of the report, such as adding a descrip-
tion that will be displayed in Report Manager in the detailed list view. For example, you
could add a Description property:
Property[] itemProps = new Property[1];
Property itemProp = new Property();
itemProp.Name = "Description";
itemProp.Value = "Employee Service Cost by Patient";
itemProps[0] = itemProp;
• You could then change your call to CreateReport from the following code:
warnings = rs.CreateReport(reportName, pathName,
true, definition, null);
to the following code instead:
warnings = rs.CreateReport(reportName, pathName,
true, definition, itemProps);
With Report Server Web service, there isn’t much you can’t do. For more details on addi-
tional properties that you can set on reports or to find out more about the SOAP API, see the
SQL Server 2005 Books Online.
Summary
In this chapter, you used the SOAP APIs through the Report Server Web service to list the fold-
ers on the selected server and then allowed the user to select an RDL file and upload it to the
user-specified folder on the selected report server. We also examined some of the additional
features you could provide the application by using a few of the many methods and properties
exposed by SSRS 2005.
4983ch07.qxd 10/7/05 11:11 AM Page 195

4983ch07.qxd 10/7/05 11:11 AM Page 196

197
C H A P T E R 8
■ ■ ■
Managing Reports
I
n many reporting solutions prior to SSRS, report management required little more than deliv-
ering the completed report file to the end user via a file share or embedded in a third-party
application. SSRS is a full reporting environment with features such as scheduled report execu-
tion, report subscription services, snapshots, content caching, and on-demand Web access.
With these added benefits comes an additional level of management responsibility. Depend-
ing on the size of the organization, some management tasks can be delegated to other users,
such as departmental managers, who might maintain report folders for their departments, as
well as to system administrators and DBAs. Fortunately, SSRS provides several means of man-
aging the report server at all levels. In this chapter, you’ll continue to work with built-in tools
such as Report Manager and command-line utilities, as well as with custom .NET management
tools that take advantage of the SSRS programming models to administer an SSRS deployment.
We’ll also demonstrate SSRS’s new Report Server Configuration Manager. When connecting to
an SSRS instance, it provides much, if not all, of the functionality that is provided by Report
Manager and the command-line utilities. We’ll show the tasks that can be completed with the
well-designed SSMS tool. However, we have chosen to use Report Manager for most of the
examples here, mainly because it can be accessed from a Web browser, which does not require
a local install of the SQL client tools.
Exploring Management Roles in SSRS Deployment
You can subdivide the management roles for an SSRS deployment into three basic categories:
• Content management
• Performance
• Report execution
It is always best practice to perform a test deployment of any application or service before
placing it in a production environment. Because our company provides services via the Internet
to a wide range of users, special management considerations—such as how to provide report
subscriptions to the same report for different companies—were imperative, and we needed to
test various scenarios to ensure proper functionality in each case. Let’s begin by looking at the
three management categories and how we implemented and tested them to make sure that
when deployed to production, we would have few (if any) unexpected consequences. We will
show how to perform all these tasks using the built-in administration tools with SSRS and SQL
Server 2005. Later in the chapter, we’ll show how to build a management application interface
with .NET that provides the ability to schedule reports.
4983ch08.qxd 10/7/05 11:13 AM Page 197

C H A P T E R 8
■
M A N A G I N G R E P O RT S
198
Managing Content
To effectively manage content on the SSRS report server, you need to be familiar with the
management tasks available. Several aspects of report management are available only after
the report has been deployed. We’ll cover each aspect in detail as we show how to deploy the
health-care reports for selected users:
• Shared schedules
• Report parameters and data sources
• Report snapshots, history, and caching
• Subscriptions
For each content management task, we’ll provide specific real-world scenarios, continu-
ing with the health-care agencies as an example. Up to this point, you have deployed several
reports, data sources, and other report items, such as graphic images and code, which you have
developed throughout the book. Now it’s time to put on your administrator’s cap and take
advantage of all the features that make SSRS a unique and powerful report-delivery system in
addition to providing a rich report-authoring environment.
Setting Up Shared Schedules
Generally speaking, a shared schedule is like a shared data source in that it is available systemwide
to users who have permission to access it. You can create a shared schedule specifically for
a certain job type. It is possible to configure a recurring shared schedule to execute by the
hour, day, month, and week or to run only once. In this example, the financial reports will exe-
cute at the end of each month. It is important that a history be maintained for these reports so
that you can freeze the values at any point in time or use them for auditing capabilities, such
as understanding which users viewed a report and what they saw in the report.
You’ll create a shared schedule that will be used to run the financial reports on the last
day of each month to provide the following benefits:
• You can schedule the reports to execute at a predetermined time.
• You can store a snapshot of each report to maintain an historical perspective of the data.
■
Note
Report snapshots are reports that are executed at a specific time, either when initiated by a user or as
part of a schedule, and that collectively make up the report history. We’ll cover snapshots in more detail later.
4983ch08.qxd 10/7/05 11:13 AM Page 198

C H A P T E R 8
■
M A N A G I N G R E P O RT S
199
One financial report that customers might run at the end of the month is an AR Reconcilia-
tion report. This report lists financial transactions that occurred during the current accounting
period, such as 10-2005 for October 2005. This report may be one of several that need to exe-
cute on the same schedule. Other financial reports might include an Aged Trial Balance report
and an AR Aging report. We’ll use the AR Reconciliation report in the following section to show
the management tasks associated with setting up shared schedules and creating report snap-
shots. We’ve included the AR Reconciliation report in the Pro_SSRS report project download,
available in the Source Code section of the Apress Web site (http://www.apress.com). The report
definition file is AR Reconciliation.rdl. In this section, we’ll show how to use a deployed ver-
sion of the AR Reconciliation report to configure its parameter values to coincide with the
scheduled times that it will execute each month.
To deploy the AR Reconciliation report, open the Pro_SSRS project in BIDS and then open
the Solution Explorer. Before deploying this report, however, you need to change the project
property that controls which folder the report will be deployed in on the report server. In the
AR Reconciliation example, you will deploy the report to a folder called End of Month Financials.
In the Solution Explorer, right-click the Pro_SSRS report project, and select Properties. Change
the TargetReportFolder value from Pro_SSRS to End of Month Financials, and click OK. Now,
when you right-click the AR Reconciliation report in the Solution Explorer and select Deploy,
the new folder is created on your report server that contains the AR Reconciliation report.
Creating a Shared Schedule
To create the shared schedule in Report Manager, click Site Settings, and then select Manage
Shared Schedules at the bottom of the page. Click New Schedule, and name the schedule End
of Month Financials. In the Schedule Details section, you are presented with the standard
scheduling options: Hour, Day, Week, Month, or Once. For this report, choose Month.
The first challenge when configuring a shared schedule to run on the last day of each
month is to overcome the built-in data validation on the Shared Schedule form. Although it is
possible to tell SSRS to execute the report on the last Sunday of every month, it is not possible
to select the last day of each month because the last day is variable (that is, it could be 28, 29,
30, or 31, depending on the month). Well, it should be possible to create a single schedule to
encompass all four dates, right? Not exactly. Choosing 31 causes an error when all the days of
the month are selected, as shown in Figure 8-1, because not all months have 31 days.
■
Note
You must be logged in as a user who is a member of the SSRS 2005 System Administrators role to
add new schedules.
4983ch08.qxd 10/7/05 11:13 AM Page 199
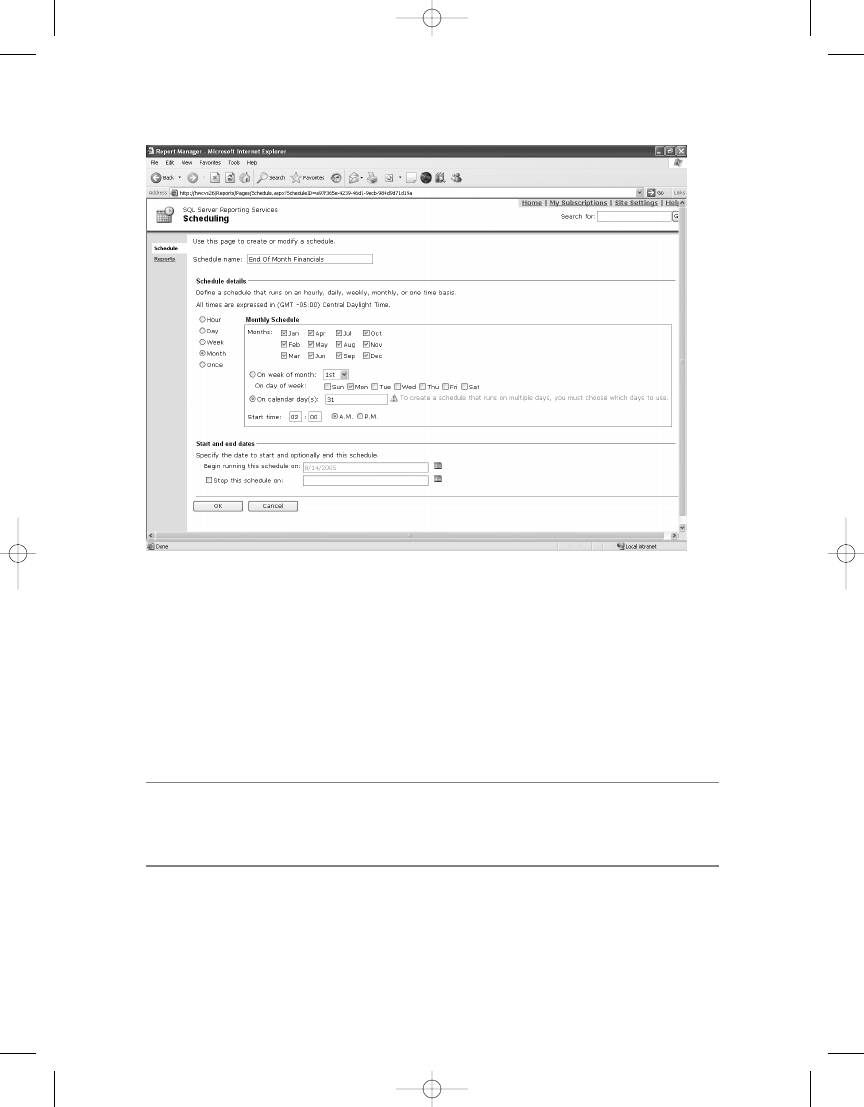
C H A P T E R 8
■
M A N A G I N G R E P O RT S
200
The solution in this example—because we know that no activity will occur after 12:00 AM
on the last day of the month—is to set the schedule to run on the first day of the month at
12:01 AM. This essentially gives you the last day for every month.
Next, select an appropriate start date and end date for the schedule (in this case, don’t spec-
ify an end date), and then click the OK button. Now you can move on and prepare the report
itself to use the new schedule. As a note, schedules in SSRS rely on the SQL Server Agent service,
and as such, the service must be running before you can successfully create a schedule.
■
Note
Note that when a job, such as a subscription or an execution snapshot, is scheduled to run within
SSRS, a SQL Server job is created using the SQL Server Agent. Jobs can be monitored through SSMS or
Report Manager.
Configuring a Report to Use a Shared Schedule
The AR Reconciliation report contains report parameters that can limit the data displayed on
the report. Two of the parameters, AcctPeriodYear and AcctPeriodMonth, are used in the driv-
ing stored procedure to limit financial data to an accounting period. When the AR Reconciliation
report is executed from a shared schedule, it is important that all the parameters for the report
Figure 8-1.
Choosing the last day of the month
4983ch08.qxd 10/7/05 11:13 AM Page 200
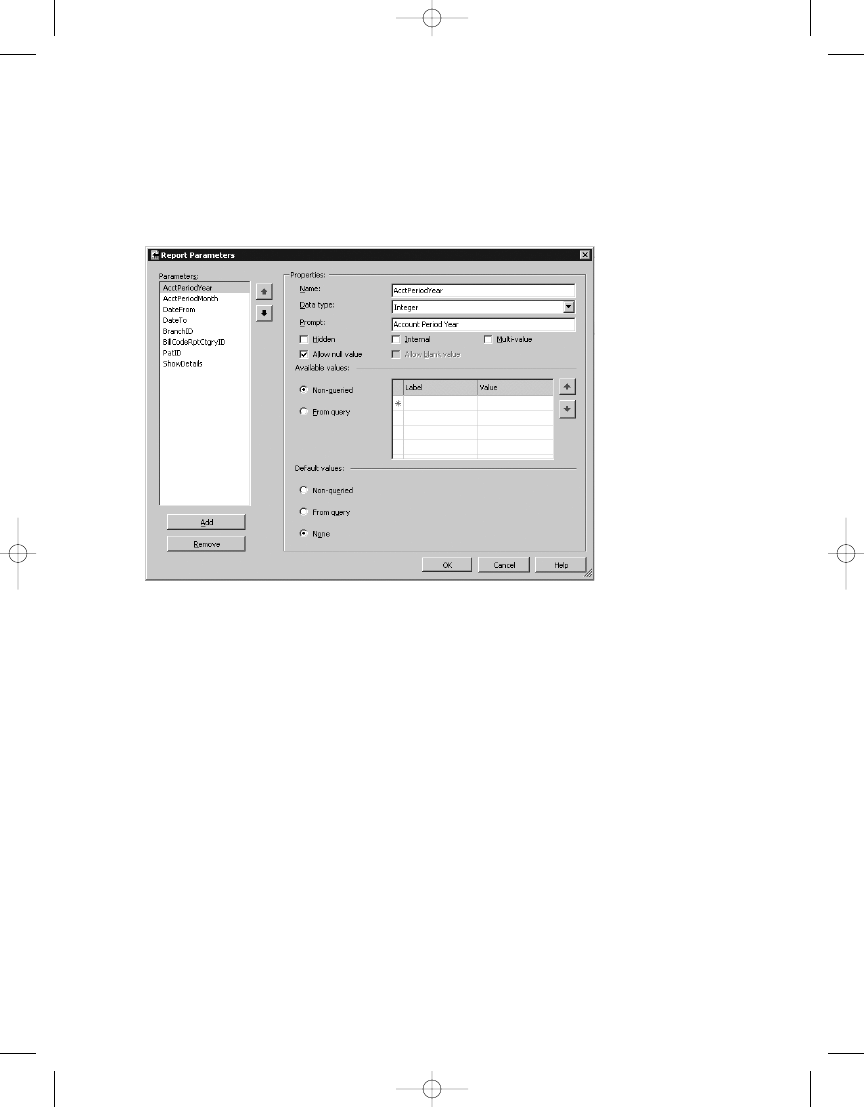
C H A P T E R 8
■
M A N A G I N G R E P O RT S
201
Figure 8-2.
AR Reconciliation report parameters
have default values. To begin with, all eight parameters in the AR Reconciliation report are set
to allow NULL values, as shown in Figure 8-2, which causes the default value of the parameter
to be set to NULL when executed. This is OK because the logic in the main stored procedure
that uses the parameters knows to return all data when a NULL value is passed to it.
For the parameters AcctPeriodYear and AcctPeriodMonth, however, you need to add default
non-NULL parameter values so that the returned dataset includes only those records for the
current accounting period. To do this, you use two functions:
• DATEPART: Returns an integer representing one of the component parts of a date, such as
year, quarter, month, or day
• TODAY: Returns the current date
Used together in an expression, these functions allow you to set the desired default values
for your two parameters. For AcctPeriodYear, you simply set the default value to the current
year, as follows:
=DATEPART("yyyy",TODAY())
For AcctPeriodMonth, you essentially do the same thing, but you need to subtract 1 from
the expression value to return the data for the correct month. For example, the expression
=DATEPART("m",TODAY())
, when run at 12:01 AM on November 1, would return a value of 11,
when the current accounting period is 10-October. To account for January, you add an IIF
function to evaluate the DATEPART so that when 1 is returned for January, a 12 is returned, letting
the report know to process the December accounting period. So the correct expression is as
4983ch08.qxd 10/7/05 11:13 AM Page 201
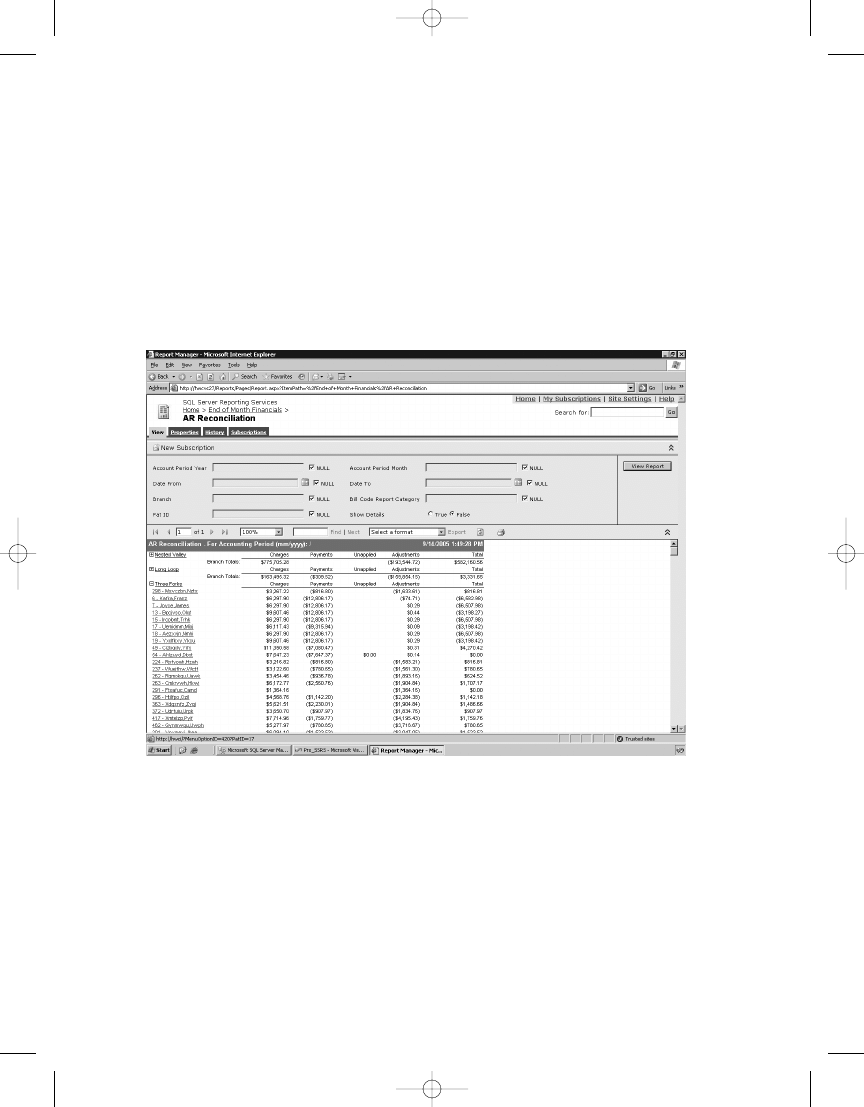
=IIF(DATEPART("m",TODAY()) = 1, 12,DATEPART("m",TODAY()) -1)
Updating and Uploading the RDL File Using Report Manager
For this section, you will navigate to the AR Reconciliation report in Report Manager and modify
the RDL manually to add the AcctPeriodMonth and AcctPeriodYear default parameter values
via Notepad instead of using BIDS or SSMS. This will demonstrate that you can make simple
modifications to published reports without the need for a full-blown design environment. Open
Report Manager, and navigate to the AR Reconciliation report in the End of Month Financials
folder on your report server, as shown in Figure 8-3. The names have been intentionally scrambled.
C H A P T E R 8
■
M A N A G I N G R E P O RT S
202
On the properties page for the AR Reconciliation report are two links under the Report
Definition section, Edit and Update, that administrators can use to modify the RDL directly
without having to redeploy reports through other means (such as through use of custom code,
the authoring environment, or the rs command-line utility). Click the Edit link to open the
RDL file in the default text editor, which is typically Notepad if Visual Studio is not installed.
Figure 8-4 shows the RDL file for the AR Reconciliation report. Notice the AcctPeriodYear and
AcctPeriodMonth
parameters in the RDL code.
Figure 8-3.
AR Reconciliation report in Report Manager
4983ch08.qxd 10/7/05 11:13 AM Page 202
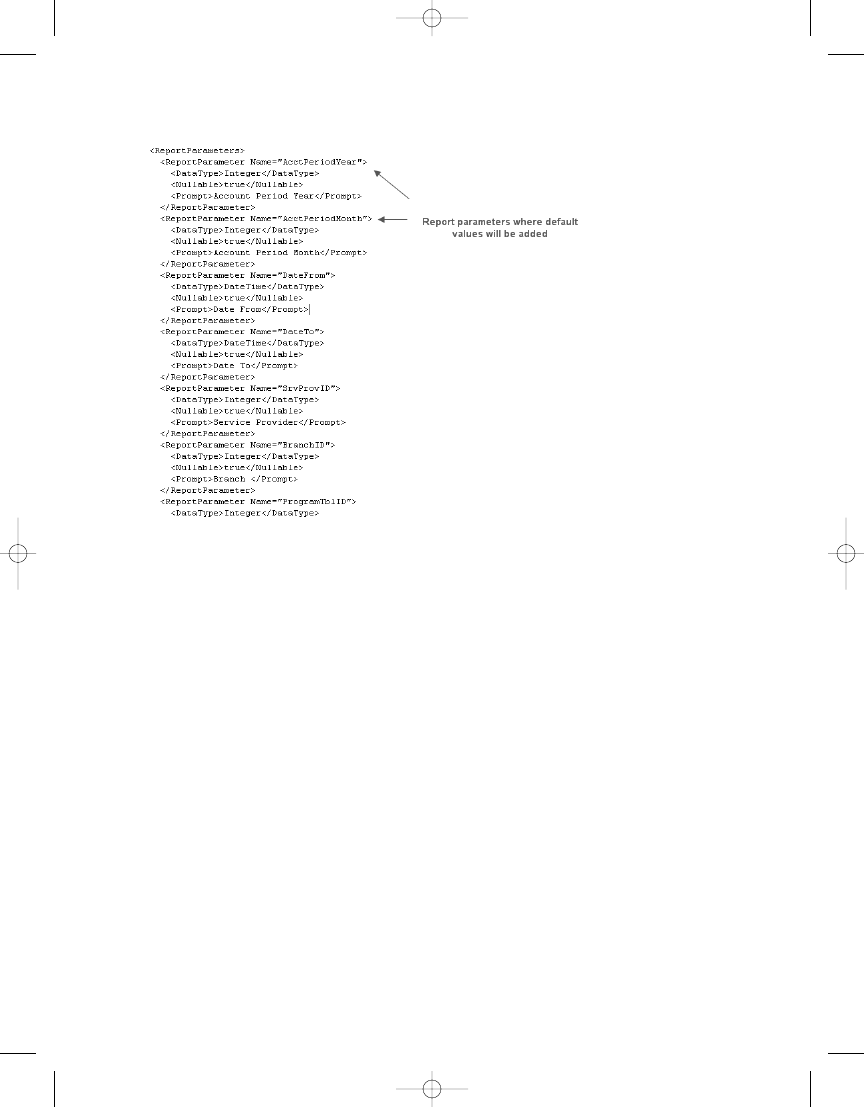
C H A P T E R 8
■
M A N A G I N G R E P O RT S
203
To update the report to include the default parameter values that you created in the previ-
ous section, you can place RDL code directly in the file and save it. The section of the RDL that
generates the default values for each parameter is only five lines long, as you can see in Listing 8-1,
which shows the default value section for the AcctPeriodYear parameter.
Listing 8-1.
RDL Default Value Section
<DefaultValue>
<Values>
<Value>=datepart("yyyy",TODAY())</Value>
</Values>
</DefaultValue>
Figure 8-5 shows the RDL file after the default value code was inserted for both parameters.
Figure 8-4.
RDL file edited in Notepad
4983ch08.qxd 10/7/05 11:13 AM Page 203
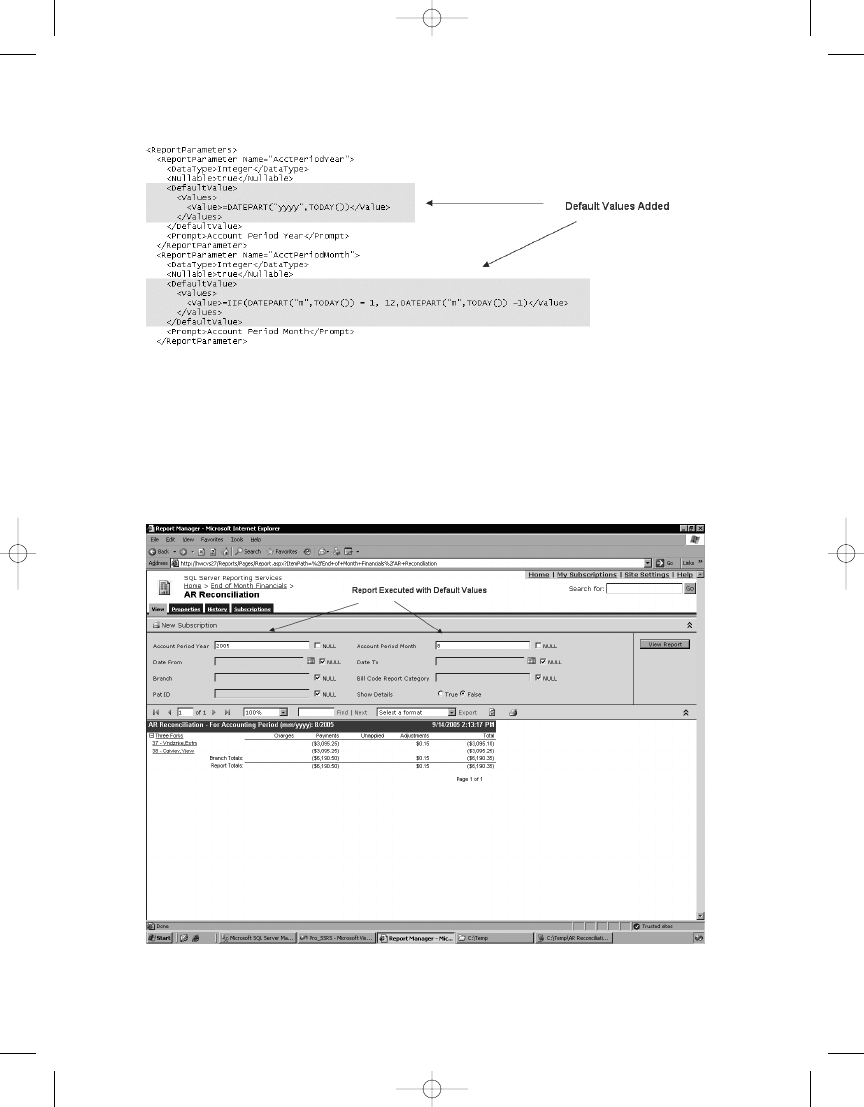
C H A P T E R 8
■
M A N A G I N G R E P O RT S
204
Now you have to save a copy of the RDL file to disk, because you can’t save directly back to
the SSRS server from Notepad. Any accessible location is fine, such as a network share. After
the file is saved, you can click the Update link, locate your updated RDL file on disk, and click
OK to update the existing report. If you executed the report now, you would see the report with
correct default values, as shown in Figure 8-6.
Figure 8-5.
RDL file with default parameters
Figure 8-6.
AR Reconciliation report with default parameters
4983ch08.qxd 10/7/05 11:13 AM Page 204

C H A P T E R 8
■
M A N A G I N G R E P O RT S
205
Updating the report through Report Manager doesn’t overwrite other properties of the
report such as history, schedules, and execution methods.
■
Caution
When you use default values based on variable data such as values in a database, it’s important
to note that the returned value must coincide with available values. In this example, if a value of
5
is returned
for May, but no values for May can be selected, the report will force the user to make a selection, as opposed
to executing and returning no data. We chose to limit the data to values actually stored in the database.
Setting Up a Data Source for the Report
The AR Reconciliation report will be set up to generate a history that allows users to view the
report as it was when it was executed. Also, because the report will be run at a prescheduled
time, SSRS needs to know what credentials to use to access the data for the report. You need to
create a new data source to accommodate this.
First navigate to the folder that contains the report, End of Month Financials, and then select
New Data Source. Name the data source EOM Financials. Because this is a SQL Server–based
connection, you supply the appropriate connection string, which includes the server name
and database or catalog for the connection. Next, choose to store the credentials securely on
the server, and supply a name and password—in this case, SQL authentication credentials.
Finally, choose to hide the data source in list view so that you can prevent users from acciden-
tally selecting it when browsing. Your configuration should look similar to Figure 8-7. After you
click the Apply button to create the data source, all you need to do is associate the report to the
new shared data source, which you’ll do in the following sections.
4983ch08.qxd 10/7/05 11:13 AM Page 205
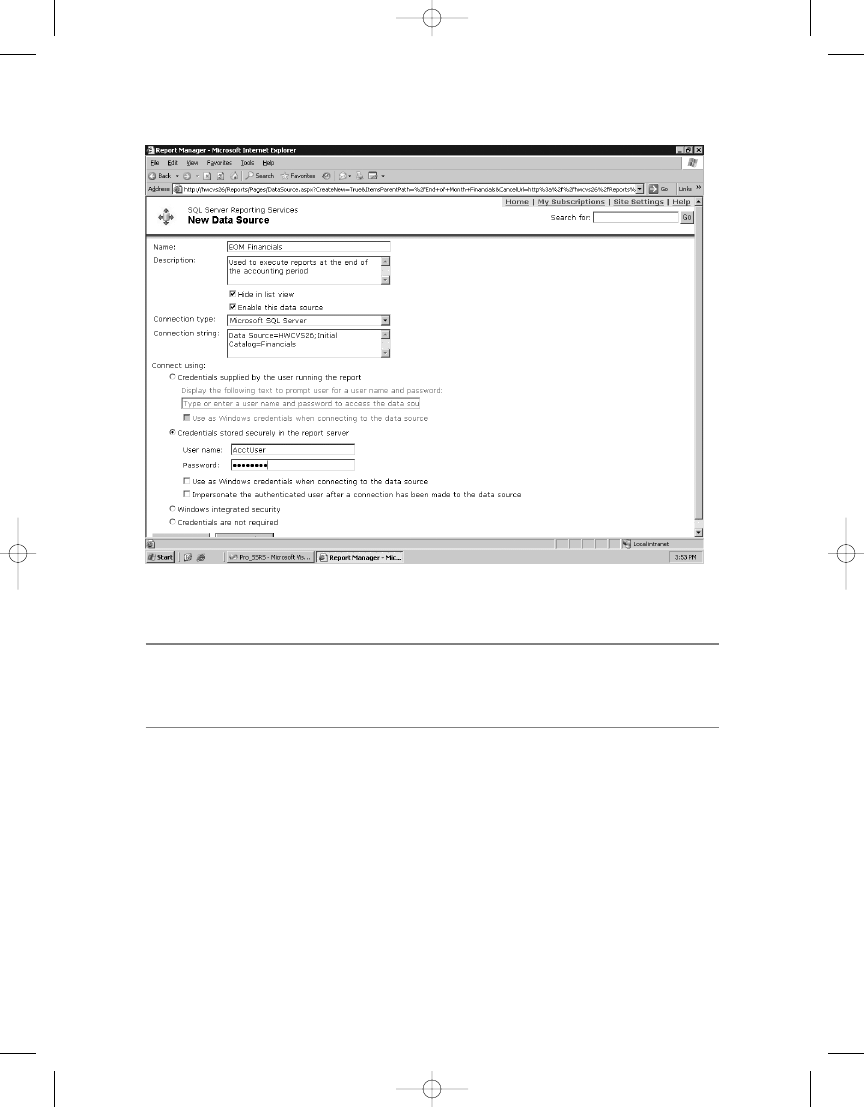
C H A P T E R 8
■
M A N A G I N G R E P O RT S
206
■
Note
Microsoft recommends using Windows authentication when connecting to SQL Server. We chose
SQL authentication in this example simply because our health-care application was originally developed with
SQL authentication.
Creating Snapshots for the Report History
The goal for the AR Reconciliation report is to allow it to execute at a specified time of month,
during off-peak hours for performance benefits, and to maintain an historical picture of each
month’s processing. To this end, the shared schedule, End of Month Financials, has been cre-
ated. Now it’s time to use a beneficial feature of SSRS, which is the capability to process a report
as a snapshot.
A snapshot is a static “point-in-time” copy of a report. Two types of snapshots are used in
SSRS: those generated as execution snapshots, which render a single report from a preexecuted
point in time, and those generated to be stored in report history, which can contain multiple
copies of a report at given points in time. In this section, we are concerned with showing how
to configure the AR Reconciliation report to generate snapshots for the report history so that
we can generate a series of historical financial reports.
Figure 8-7.
Data source selections
4983ch08.qxd 10/7/05 11:13 AM Page 206
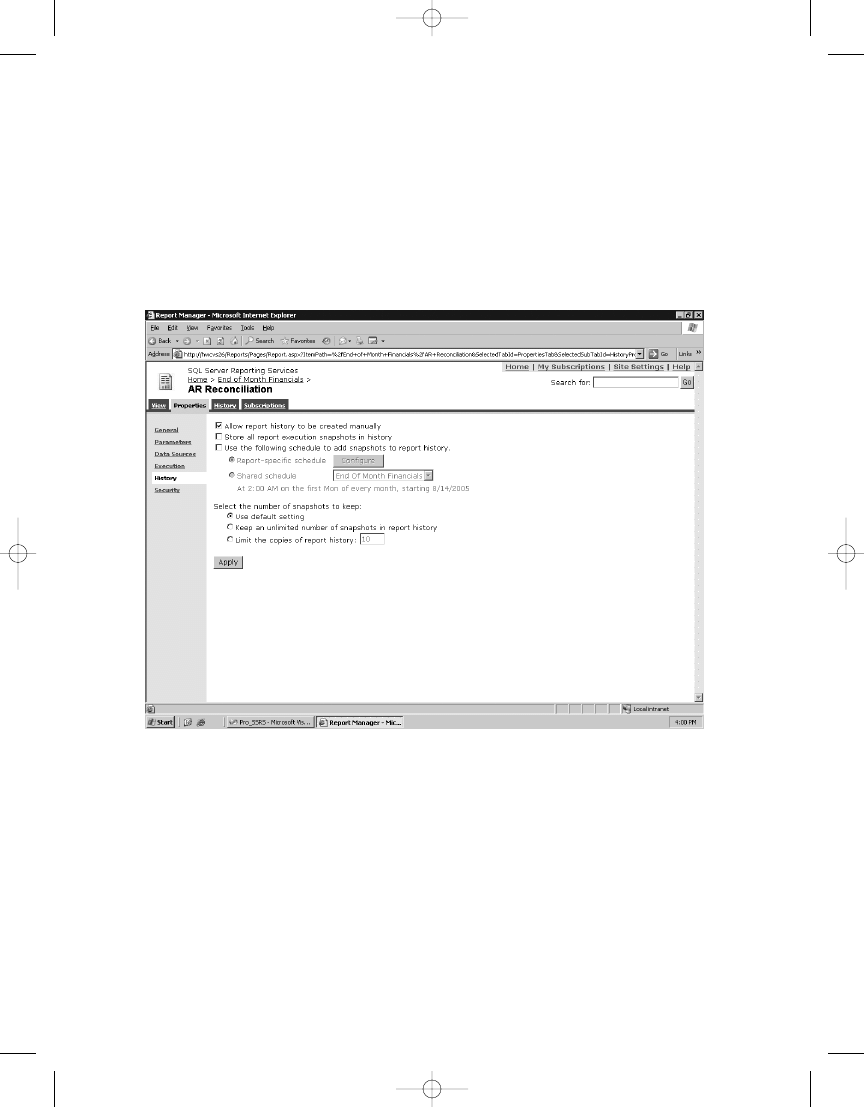
C H A P T E R 8
■
M A N A G I N G R E P O RT S
207
You’ll use Report Manager to configure the report history properties for the AR Reconcili-
ation report so that a snapshot of the report is generated each time the report is processed,
according to the End of Month Financials schedule.
Let’s begin by looking at the available settings for the report history. As you can see in
Figure 8-8, several settings affect not only the creation of snapshots but also how the snapshots
are stored in the report history. You can navigate to the report history properties for any report
by clicking the Properties tab in Report Manager while viewing the report and then selecting
History in the left frame.
For the AR Reconciliation report, set the history properties so that
• Users will not be able to create snapshots for the report history. Set this entry so that
only reports that are run by the schedule will appear in the report history.
• Report execution snapshots are not stored in the report history. This option is related to
report Execution properties, which is covered in the next section.
Figure 8-8.
Report history properties
4983ch08.qxd 10/7/05 11:13 AM Page 207
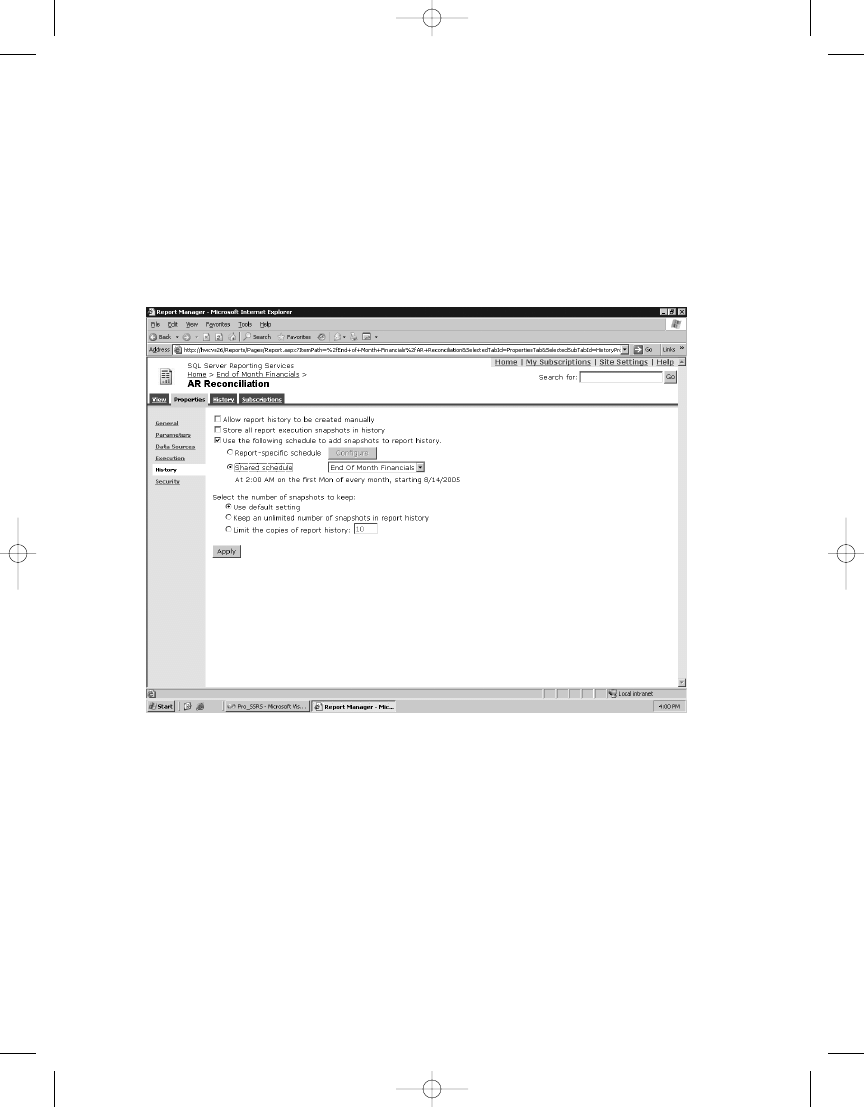
C H A P T E R 8
■
M A N A G I N G R E P O RT S
208
• The End of Month Financials shared schedule is used.
• The Default setting is used for the number of snapshots to keep in the report history.
The Default setting keeps an unlimited number of reports, but you can change this via
Site Settings in Report Manager. If a specific number of snapshots is selected to be kept,
such as 10, then older snapshots are removed first to make room.
After making the selections as shown in Figure 8-9, click Apply.
Over time, the snapshots will be created in the report history. Users who have access to
the report history can access the snapshots through Report Manager by navigating to the
History tab for the report. The History tab for the AR Reconciliation report, as shown in
Figure 8-10, indicates that over a two-month period, two snapshots have been generated, as
expected.
Figure 8-9.
Report history settings for the AR Reconciliation report
4983ch08.qxd 10/7/05 11:13 AM Page 208
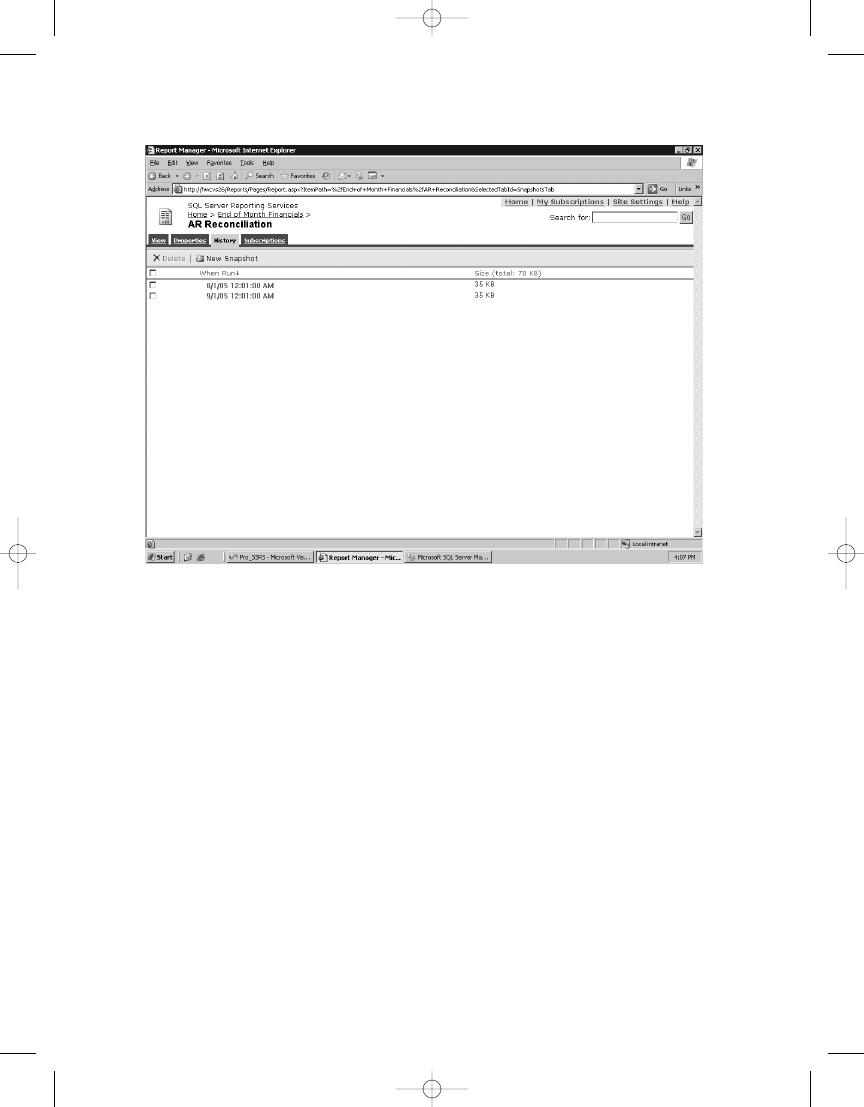
C H A P T E R 8
■
M A N A G I N G R E P O RT S
209
It is beneficial for performance to render a report from the history, first because the report
has been preprocessed and second because there is no need to query the data source for the
report, as both the data and layout information are stored in the snapshot. When generating
large reports, such as financial reports with hundreds of pages, we highly recommend using
snapshots, as well as other performance-enhancing features of SSRS such as report caching,
which we will cover next.
Executing Reports and Performing Caching
The AR Reconciliation report is now set up to be delivered from a schedule, rendered from
a snapshot, and saved in the report history. Employees will also run this report on-demand,
meaning that users can view the report with the most recent data. Because this is potentially
a resource-intensive financial report, you should ensure that performance isn’t affected when
the report is rendered for multiple users simultaneously. You’ll use Report Manager to config-
ure the settings that control how the report is executed.
The first step is to navigate to the Properties tab for the AR Reconciliation report and then
select Execution in the left frame. Figure 8-11 shows the available settings for report execution.
Figure 8-10.
AR Reconciliation report snapshots created on schedule
4983ch08.qxd 10/7/05 11:13 AM Page 209
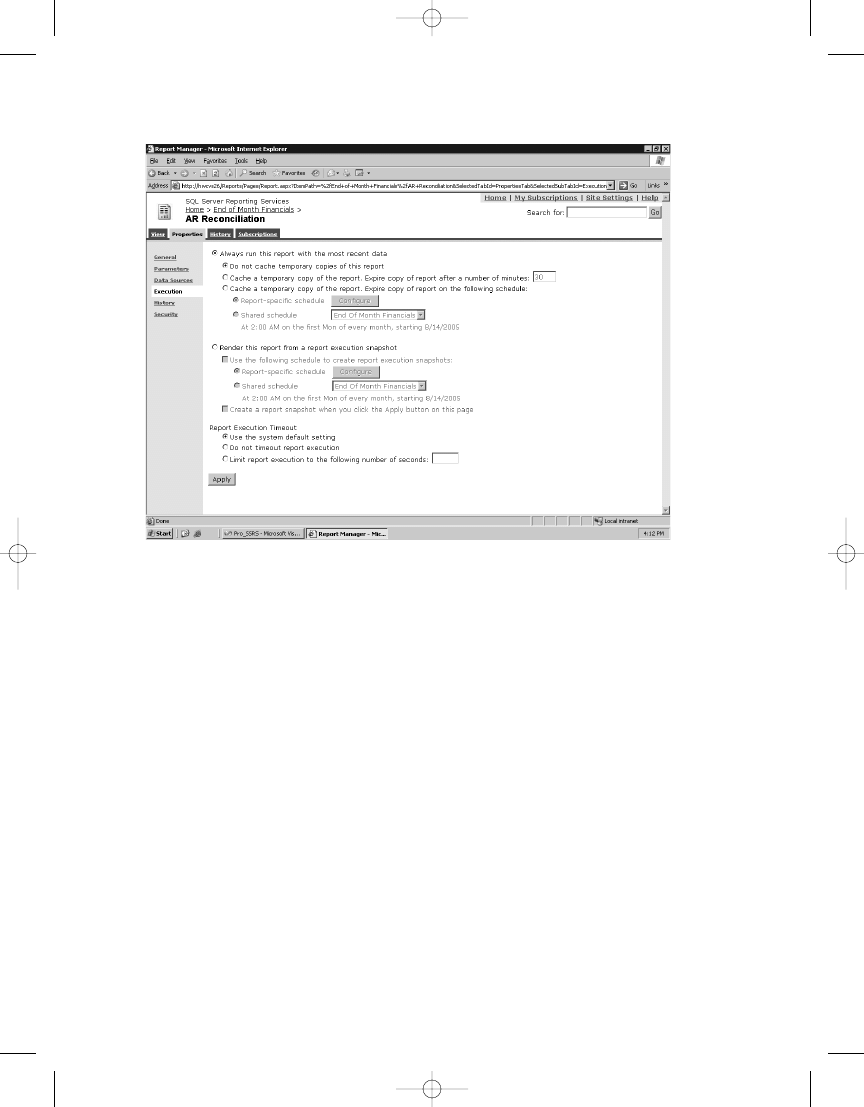
C H A P T E R 8
■
M A N A G I N G R E P O RT S
210
The first execution selection, Always Run This Report from the Most Recent Data, has several
options that control report caching.
Caching is an SSRS feature that allows temporary copies of a report to be stored and rendered
to a user. The main advantage for creating a cached copy of a report is increased performance.
Users who access a report that is set to be cached generate the first cached instance. Every
subsequent user receives the cached copy if certain conditions are met. The conditions for
a user to receive the cached copy are as follows:
• The subsequent user must access the report within the time interval before the cached
report is set to expire. When the cached report expires, the next user must create a new copy.
• If the cached report has parameters that change during subsequent executions, and
each user receives a new report based on that parameter, each report that’s generated
becomes a cached copy specific to the parameter value.
• The report’s data source isn’t set to Windows authentication or to prompt the user for
login credentials.
For our report, instruct SSRS to cache a temporary copy of the report and expire the cached
copy after ten minutes. Ten minutes is generally a good length of time to maintain cached
reports, although it really depends on the time sensitivity of your data. The data in a cached report
will, of course, reflect the time at which the report was rendered rather than the current time,
and short of printing the execution time on the report, users have no way to know if they’re
Figure 8-11.
Execution properties
4983ch08.qxd 10/7/05 11:13 AM Page 210

C H A P T E R 8
■
M A N A G I N G R E P O RT S
211
The second selection, Render This Report from a Report Execution Snapshot, shouldn’t be
confused with a snapshot that creates a report history. An execution snapshot, unlike a history
snapshot, is viewed from a Report folder in Report Manager just like on-demand reports would
be viewed. History snapshots, on the other hand, are viewed from the History tab of the report
and can accumulate many copies.
Execution snapshots don’t expire like cached reports; rather, they’re refreshed at a specified
interval. If you choose to generate an execution snapshot for a report, then that report can’t be
cached. In this example, don’t select this option.
The final report execution option sets the timeout interval for the report, either at a default
setting, which is typically 1,800 seconds (30 minutes), or at a specified value. This is an impor-
tant setting because long-running reports use valuable system resources. You’ll use the default
value for the AR Reconciliation report.
We mentioned the trade-off involved in using caching for reports with time-sensitive
data. Another important consideration when choosing to use either snapshots or cached
reports is disk space. Over time, history and cached reports set with lengthy expiration times
can accumulate. The cost of disk storage compared to the performance and subsequent pro-
ductivity increase is negligible, however, and shouldn’t stop anyone from taking advantage of
these beneficial features of SSRS.
Managing Subscriptions
Subscription services for SSRS provides a means for delivering preexecuted reports to speci-
fied locations, to a user via e-mail, to a network file share, or even directly to a printer. Using
subscriptions has several key benefits. Internally in an organization, employees need key
information at certain times, such as daily or at the end of a month. Externally, customers may
want to receive newsletters or financial statements on a predetermined schedule. Subscriptions
can accommodate both of these needs easily.
Setting up subscriptions has the added benefit of allowing you to schedule the processing
of resource-intensive reports at off-peak hours, thus ensuring little or no degradation to perfor-
mance during periods of heavy usage. You’ll be working with two types of subscriptions in this
section:
• Standard subscriptions: Statically set up for one or more users.
• Data-driven subscriptions: Subscriber lists can be derived from multiple data source
locations and can be generated from a custom query.
■
Note
Data-driven subscriptions are by far the most powerful form of subscriptions. They’re available only
in the Enterprise edition of SSRS.
Managing Standard Subscriptions
You’ll begin by setting up a standard e-mail subscription for employees in a health-care organi-
zation that provides home-care services to patients. The report, called Patient Recertification
Listing, was designed for employees who are responsible for tracking patient documentation.
You can create standard e-mail subscriptions with any report. In our business, it is a requirement
4983ch08.qxd 10/7/05 11:13 AM Page 211
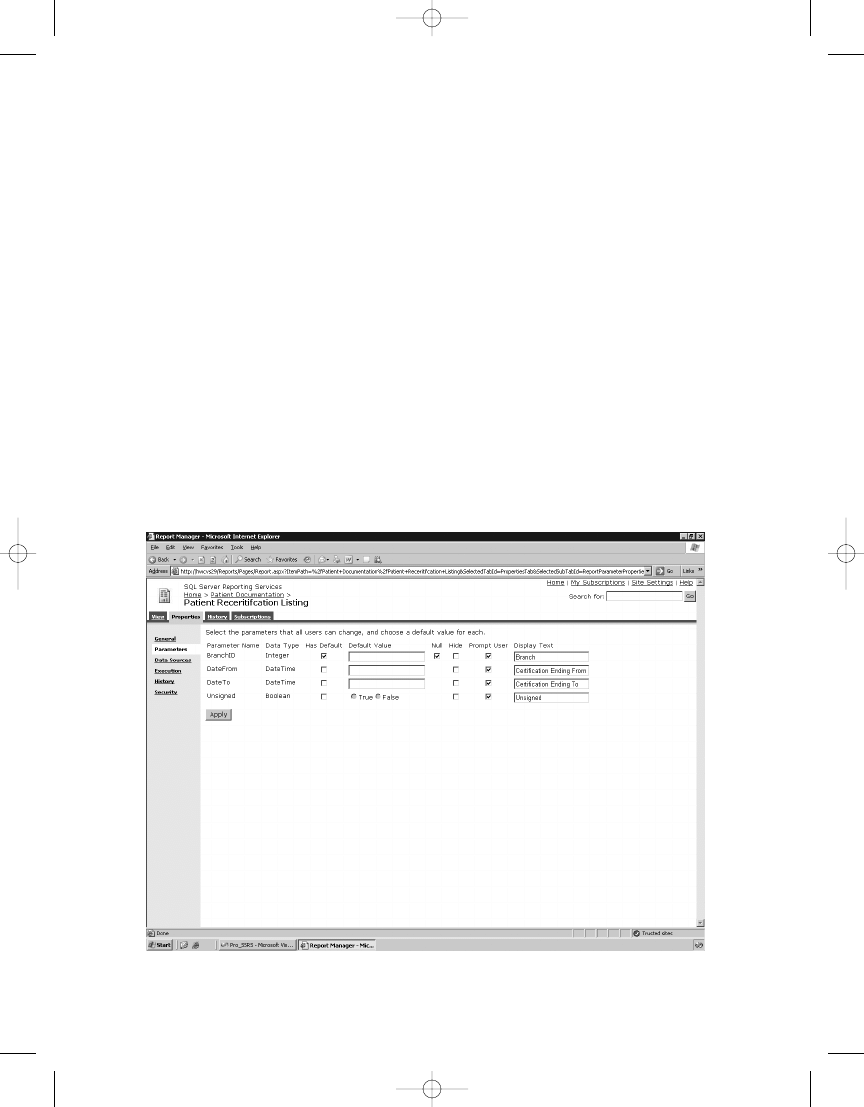
C H A P T E R 8
■
M A N A G I N G R E P O RT S
212
that the patient’s documentation, in this case an HCFA 485, be completed and signed by the
attending physician. The report is essentially a daily work list for these employees, where any
documentation that is unsigned becomes a work item.
You can find the Patient Recertification Listing report in the Pro_SSRS report project pro-
vided in the Source Code area on the Apress Web site (http://www.apress.com). You can
deploy the report to your report server using BIDS. Open the Pro_SSRS project, and change
the TargetReportFolder for the project to Patient Documentation. Next, right-click the Patient
Recertification Listing report, select Deploy to create the Patient Documentation folder, and
publish the report and data source to your report server. It is important to note that the Pro_SSRS
data source that is provided in the Pro_SSRS project uses Windows authentication, and for
subscriptions to work successfully, the credentials will need to be stored securely in the
database. To change the deployed Pro_SSRS data source from Windows authentication to
stored credentials, navigate in Report Manager to select the Pro_SSRS data source in the
Patient Documentation
folder. Change the Connect Using option to Credentials stored securely
in the report server, and supply the appropriate credentials.
Because this report needed to be generic enough for on-demand viewing in addition to
being used for subscriptions, we added a report parameter called Unsigned that works with
a report filter to show patients with both signed and unsigned documentation. This report has
other parameters as well, as shown in Figure 8-12. As you’ll see, you will use the parameters
when you generate the subscription.
Figure 8-12.
Patient Recertification Listing report parameters
4983ch08.qxd 10/7/05 11:13 AM Page 212
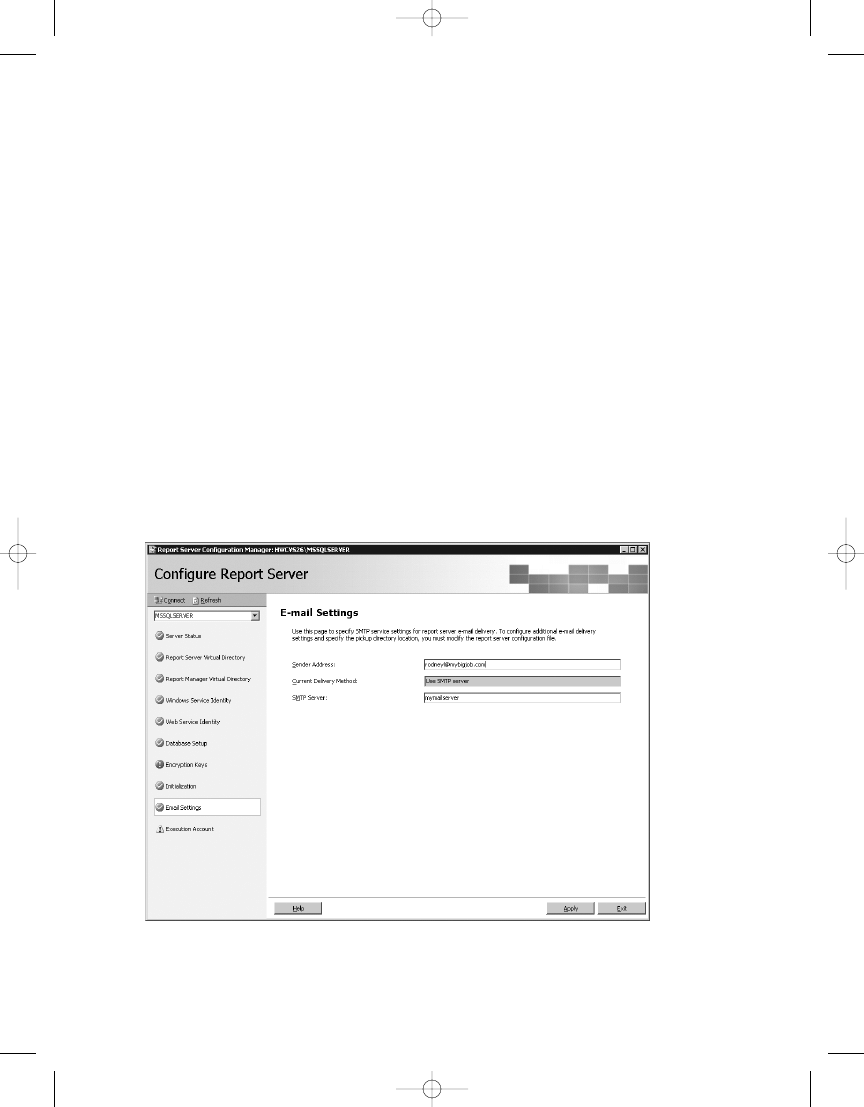
C H A P T E R 8
■
M A N A G I N G R E P O RT S
213
Creating a Standard Subscription
The first step in manually creating a subscription is to run Report Manager and navigate to the
report for which you want to create the subscription. You can also create and manage subscrip-
tions using SSMS. Later in this chapter, you’ll learn how to manage the subscription that you
create here for the Patient Recertification Listing report using SSMS in the “SSMS and SSRS”
section.
For the example, navigate to the Patient Certification Listing report, which is in the
Patient Documentation
folder on the report server. Each report has a number of configurable
values under four different pages: View, Properties, History, and Subscriptions.
Select the Subscriptions page, and then click New Subscription for the report. If you have
configured your SMTP server correctly during installation, you will see an option, after click-
ing the Subscription page, to select Report Server E-mail. If this option is not available, you
can use the Report Server Configuration Manager to set up e-mail, as shown in Figure 8-13.
The Report Server Configuration Manager can set many of the same properties that control
the report server as the command-line tools or SSMS. The Report Server Configuration Manager
is a good tool to use to set the properties of the report server that may need to be configured
post-installation, such as the report server virtual directory or the account used to execute unat-
tended reports. You’ll use the Report Server Configuration Manager again to join the instance
of SSRS to another report server, which creates a Web farm of report servers to gauge performance.
For now, check to ensure that the SMTP settings are correct.
Figure 8-13.
Report Server Configuration Manager, E-mail Settings
4983ch08.qxd 10/7/05 11:13 AM Page 213
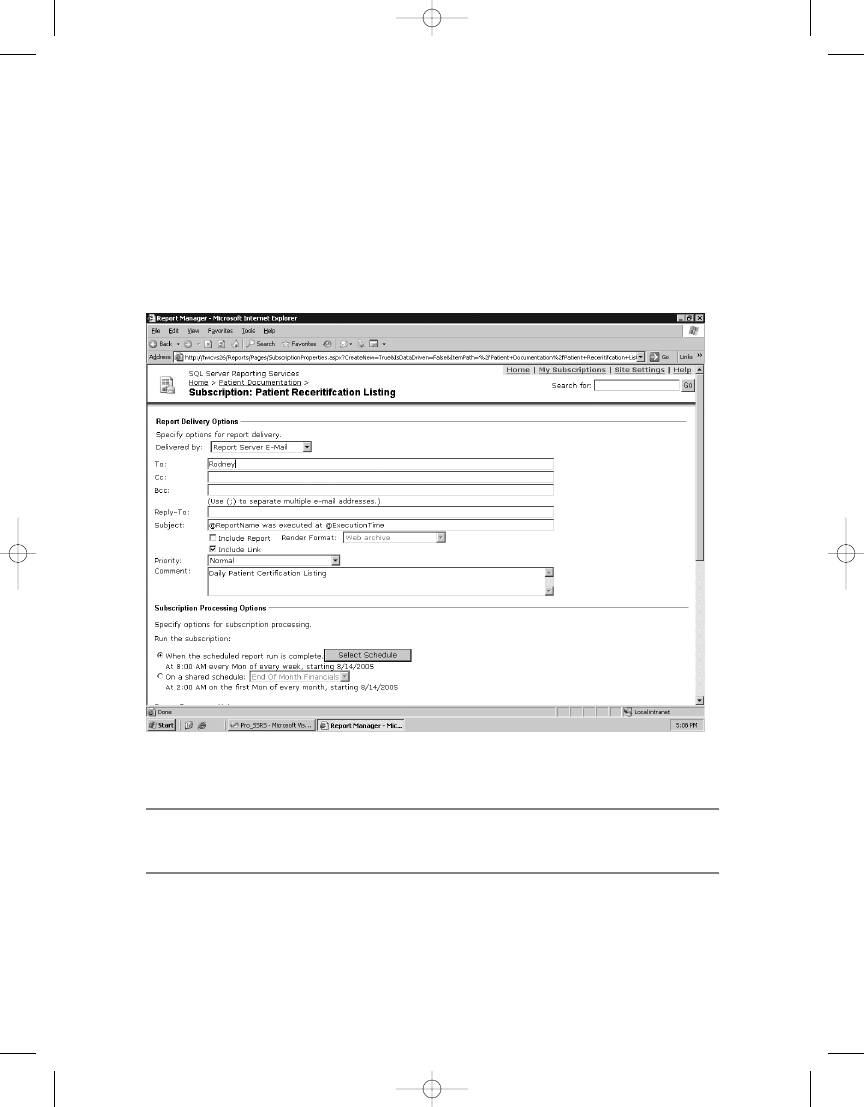
C H A P T E R 8
■
M A N A G I N G R E P O RT S
214
A subscription that is delivered via e-mail provides standard delivery options for Cc, Bcc,
Reply-To, Subject, Priority, and Comment, which will be the body of the e-mail message. You
can also send the entire report in the e-mail, a link to the report, or both. Because the user
who will be receiving this subscription will have network access to the report server, you can
send just a link to the report. Sending the report itself via e-mail does have benefits, however,
especially when working with users who need the report offline, such as traveling staff. We will
demonstrate this in the next section when you set up a data-driven subscription. Figure 8-14
shows the e-mail options available for a report subscription.
■
Note
During the default installation of SSRS, an SMTP server and default e-mail address are configured,
which SSRS uses to send e-mail based subscriptions.
Configuring the Subscription
Subscriptions are configured to execute at a scheduled time. You can customize the schedule
for individual reports or based on a shared schedule. This report needs to be delivered to staff
members in the morning, and it can be run anytime after 5:00 PM on the previous day as long
Figure 8-14.
E-mail options for subscriptions
4983ch08.qxd 10/7/05 11:13 AM Page 214
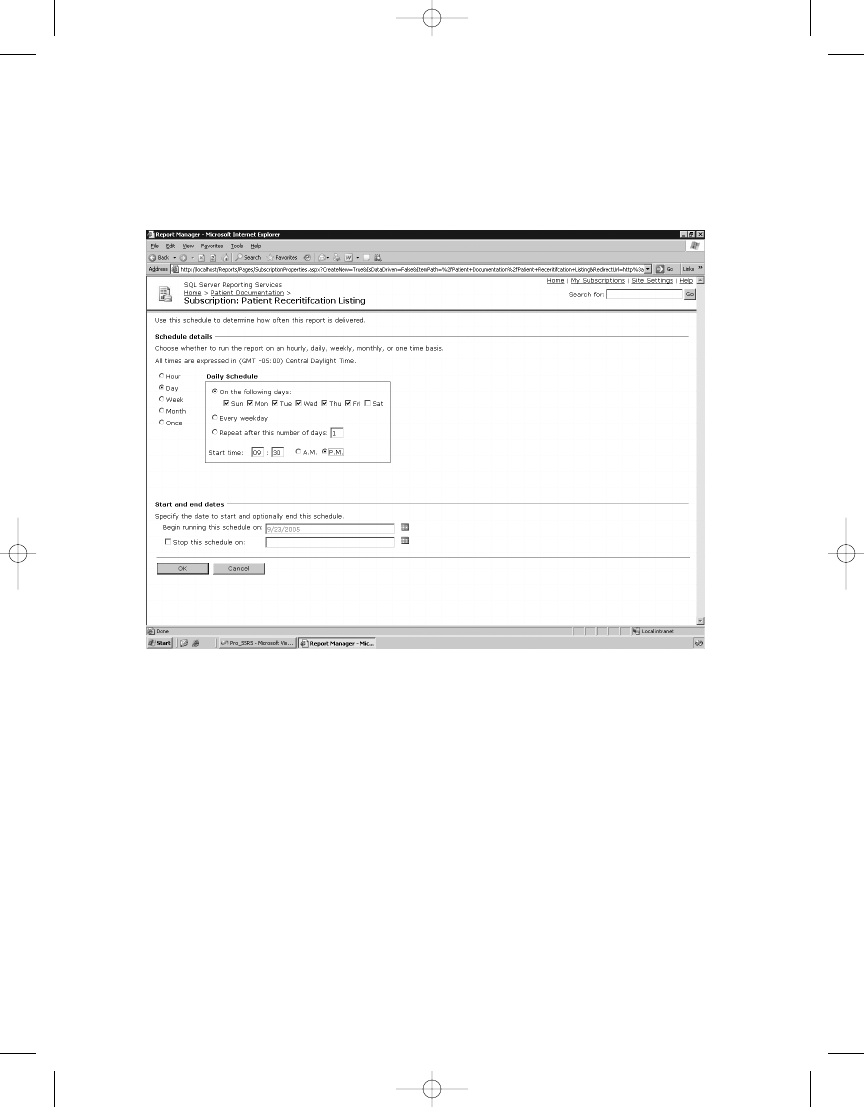
C H A P T E R 8
■
M A N A G I N G R E P O RT S
215
as it is delivered by the next business day. For our needs, a schedule of 9:30 PM every day except
Saturday is sufficient, as shown in Figure 8-15, which is set by clicking the Select Schedule but-
ton under Subscription Processing Options.
Figure 8-15.
Daily schedule for Patient Certification Listing report
Next, you configure the parameters for the report. As mentioned earlier, this particular
report has a parameter called Unsigned, which is a Boolean datatype (either True or False) that
shows both signed and unsigned documentation. When this report is rendered, by default it
includes all patients, whether signed or unsigned documentation exists. The subscribers of
this report, however, will be interested in seeing only unsigned documentation, so set the
parameter for Unsigned to be True. Because this report has been designed to provide populated
drop-downs for the parameter values that are based on individual datasets, these values are
available here, such as populated Branch selections, as shown in Figure 8-16. For now, leave all
the parameters, except Unsigned, with their default values.
4983ch08.qxd 10/7/05 11:13 AM Page 215
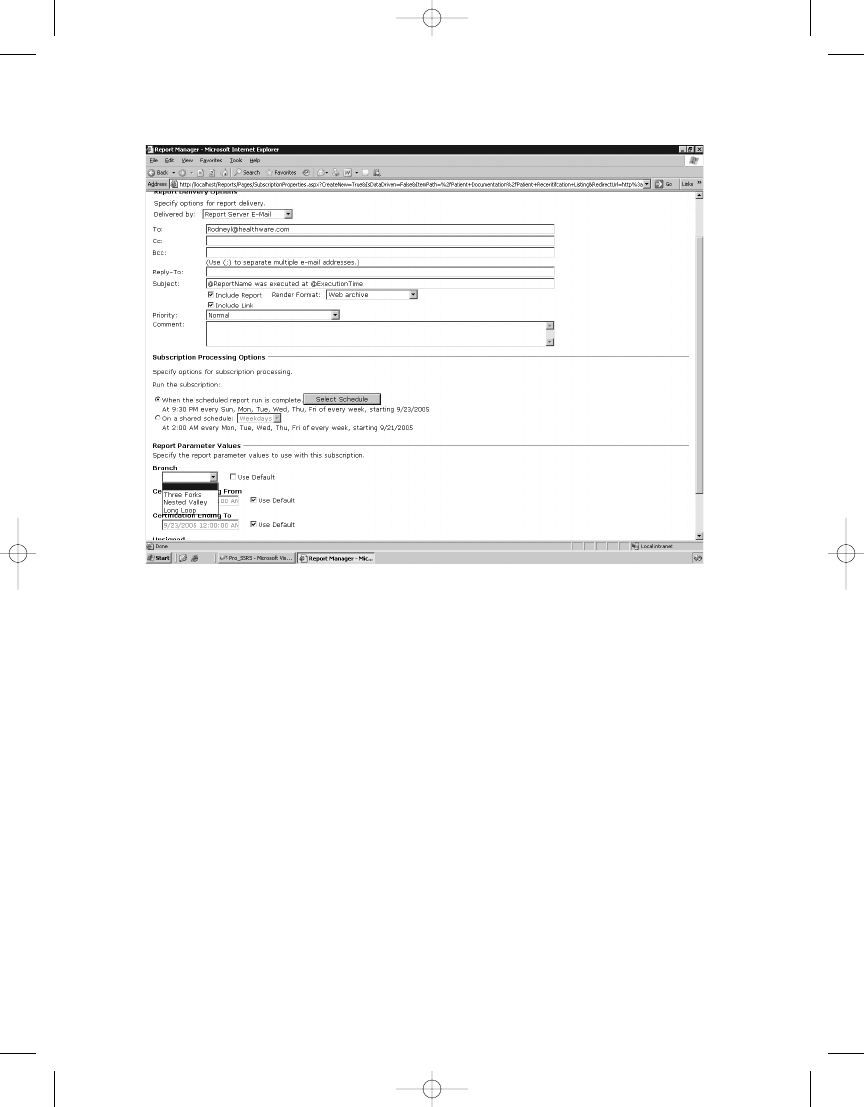
C H A P T E R 8
■
M A N A G I N G R E P O RT S
216
To verify that the subscription is working as anticipated, we made rodneyl@healthware.com
the sole recipient of the mail for testing. In Figure 8-17, you can see standard e-mail options for
To, Cc, Bcc, and Reply-To. In the To field, you add the recipient’s e-mail address and then click
OK to add the subscription. After you verify the subscription’s success, modify the attributes of
the subscription to add the real subscribers by navigating to the report in Report Manager,
selecting Subscriptions, and then selecting Edit.
Figure 8-16.
Subscription parameter drop-downs
4983ch08.qxd 10/7/05 11:13 AM Page 216
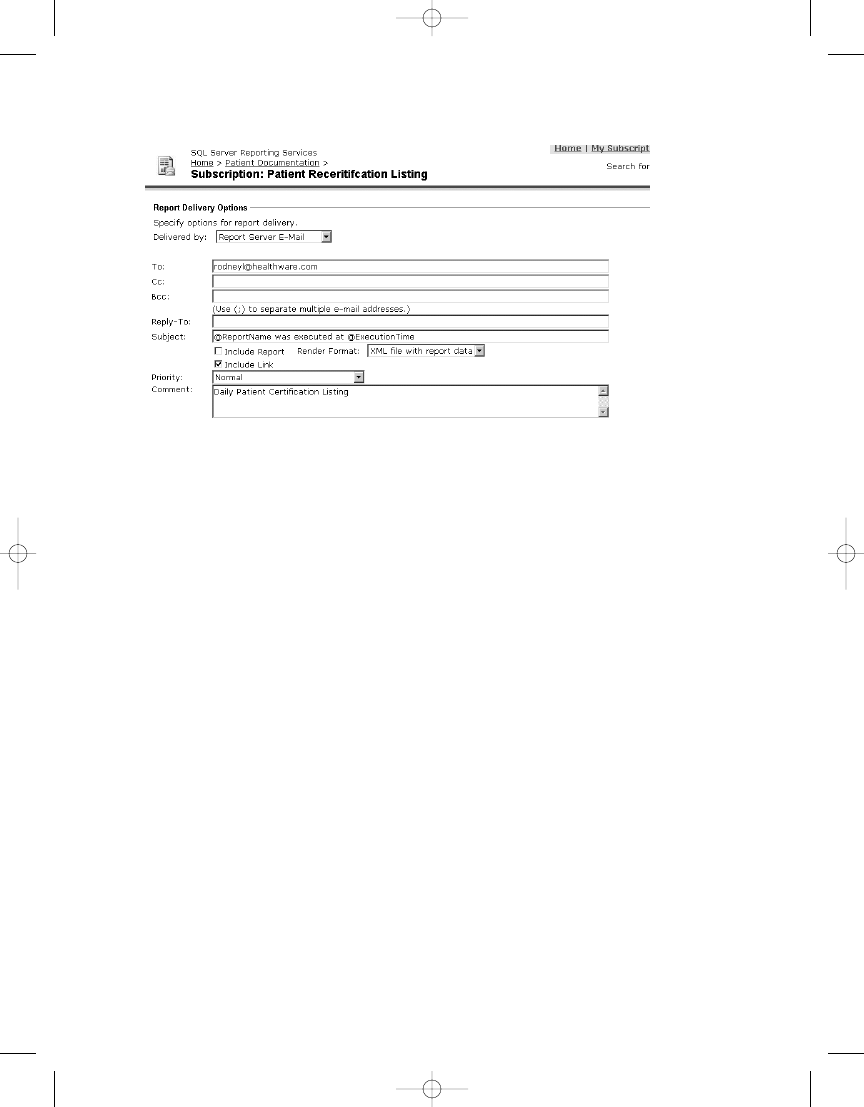
C H A P T E R 8
■
M A N A G I N G R E P O RT S
217
Managing Data-Driven Subscriptions
Standard subscriptions address the needs of many companies that want to set up custom sub-
scriptions for both their employees and their customers. However, you can use another, much
more flexible method for delivering reports: the data-driven subscription. Data-driven subscrip-
tions allow administrators or content managers to query a data source—a SQL Server table,
for example—to return a list of subscribers that meet a specific set of criteria. This is the ideal
way to deliver reports to a wide-ranging list of subscribers. Plus, you have to manage only one
subscription for all subscribers, and those subscribers could have different parameters that are
used to generate personalized reports.
We knew we would want to let our customers and their employees take advantage of
data-driven subscriptions, and fortunately we had long ago structured our application data-
base to include employee information that would be useful for just this purpose. By storing
the employees’ e-mail addresses as well as other data, such as geographical locations and cer-
tifications, we had all we needed to provide a flexible delivery system, via e-mail, to traveling
staff. The employees we initially targeted were clinicians who had a daily schedule of patients
to see. Most of the clinicians operated laptops or PDAs as part of their daily routines.
Designing the Subscription Query
The first step was to redesign a report in SSRS so that it would provide clinical employees with
their daily schedules and parameterize it so that it would be employee-specific each time it
was executed. As part of the data-driven subscription, the report would be processed and
delivered to employees as both an embedded, printable format, and as a link to connect to the
SSRS report server if they were online. Figure 8-18 shows the report we created, Daily Activity.
Figure 8-17.
Assigning recipients to subscriptions
4983ch08.qxd 10/7/05 11:13 AM Page 217
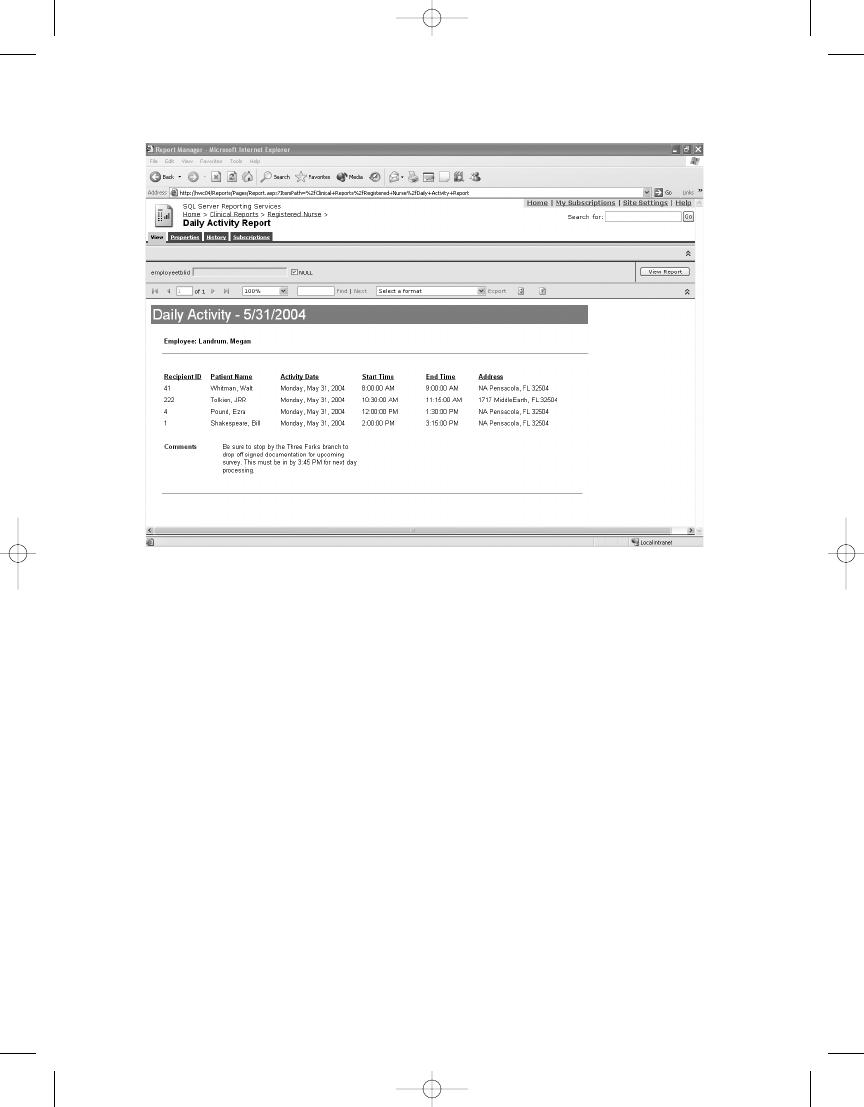
C H A P T E R 8
■
M A N A G I N G R E P O RT S
218
Because data-driven subscriptions are based on just that, data, a query to drive the sub-
scription is essential. It is important to design the query to have selective criteria, because
SSRS delivers a copy of the report for every record that is returned from the data source.
For our recipient list, we use the query in Listing 8-2. Essentially, the query returns all
employees who have an e-mail address and who also have scheduled activities for the day
following the date of report execution. The report is processed and delivered after hours. It is
unusual in our environment that an employee’s schedule will change after 9:00 PM, so we set
up the report to execute at that time.
Listing 8-2.
T-SQL Query to Return the Subscriber List
SELECT
DISTINCT EmployeeTblID,Email,HWUserLogin,ActivityDate
FROM
Employee INNER JOIN
Activity ON Employee.EmployeeTblID = Activity.ProviderID
WHERE
Email IS NOT NULL AND
ActivityDate BETWEEN GETDATE() AND GETDATE () + 1
When this query is executed, the output of the query yields six rows of data, as you can
. You have many
Figure 8-18.
Daily Activity report
4983ch08.qxd 10/7/05 11:13 AM Page 218

C H A P T E R 8
■
M A N A G I N G R E P O RT S
219
ways to format and compare datetime values. However, in this case, using the GETDATE func-
tion to compare the current date with the ActivityDate field value was the best choice. It was
necessary to use BETWEEN with GETDATE because the ActivityDate value defaults to 00:00:00 for
the time value, whereas GETDATE returns the current time. The comparison values wouldn’t
match in a one-to-one comparison.
Table 8-1.
Output of a Data-Driven Query
EmployeeTblID
UserLogin
ActivityDate
15
NurseC@healthware.com
hwci\Nursec
2005-08-15
34
Lottah@healthware.com
hwci\Lottah
2005-08-15
44
MaryElizah@healthware.com
hwci\MaryElizah
2005-08-15
147
Fayel@healthware.com
hwci\Fayel
2005-08-15
155
Brendanl@healthware.com
hwci\brendanl
2005-08-15
159
Ethanl@healthware.com
hwci\Ethanl
2005-08-15
Creating the Data-Driven Subscription
Now we will show the procedure for creating the data-driven subscription in Report Manager.
The Daily Activity report is included in the Pro_SSRS report project available in the Source
Code area of the Apress Web site. You can deploy the report to any folder on your report server
for testing the subscription. Make sure when you deploy the report that you modify the Pro_SSRS
data source that is deployed with the report so that it stores the credentials on the report server,
which is required for the subscription to be created. Open the browser, and navigate to the
Daily Activity Report, and from there select Subscriptions. On the toolbar, select New Data-
Driven Subscription. Follow these steps to complete the data-driven subscription:
1.
Choose a name, delivery method, and data source type.
2.
Choose the data source location or define a new data source.
3.
Choose the command or query to return a list of recipients.
4.
Choose the settings for the Report Server Delivery E-mail delivery extension.
5.
Choose the report parameters.
6.
Choose when the subscription will be processed.
7.
Set up a schedule for the report.
The most important of these steps is step 4, in which you specify the settings for the deliv-
ery extension. This is where you’ll use the data from the driving query to instruct SSRS how to
send the subscription. Every selection in step 4 has the option to retrieve the value derived from
the query used in step 3, which is much more versatile than a standard subscription.
You paste the query into the query box in step 3, as you can see in Figure 8-19, and verify
it by clicking the Validate button. From this point, the fields you selected in the query, namely
EmployeeTblid
, Email, HWUserLogin, and ActivityDate, can all be used as criteria in the remain-
ing steps.
4983ch08.qxd 10/7/05 11:13 AM Page 219
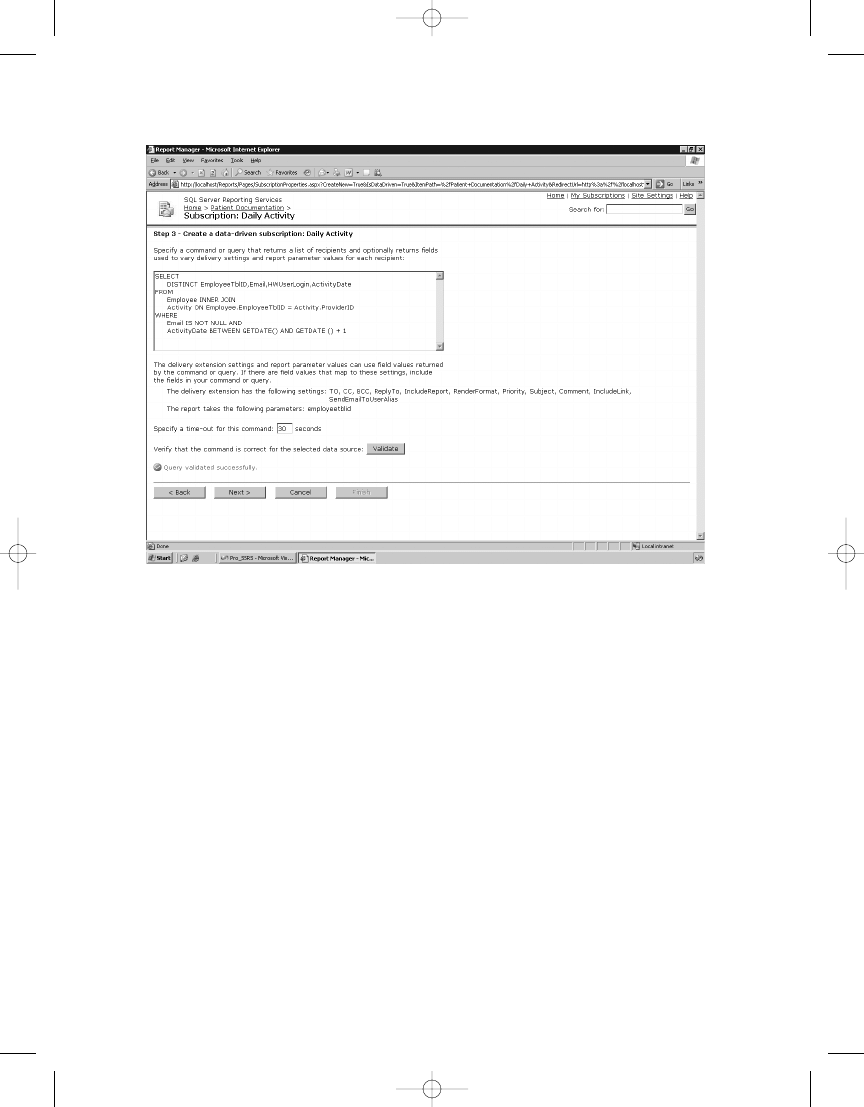
C H A P T E R 8
■
M A N A G I N G R E P O RT S
220
Figure 8-19.
The verified query that drives the subscription
In step 4, several settings control how the report will be sent to subscribers: To, Cc, Bcc,
ReplyTo
, IncludeReport, RenderFormat, Priority, Subject, Comment, and IncludeLink. For each
setting, except for To, you can choose a static value, a database value, or no value, as shown in
Figure 8-20. You assign the To field to the Email field from the subscription query. Leave the values
for all the other fields at their default settings. By leaving the defaults, the subscription auto-
matically includes the report itself and the link to the report in the e-mail to the subscribers.
4983ch08.qxd 10/7/05 11:13 AM Page 220
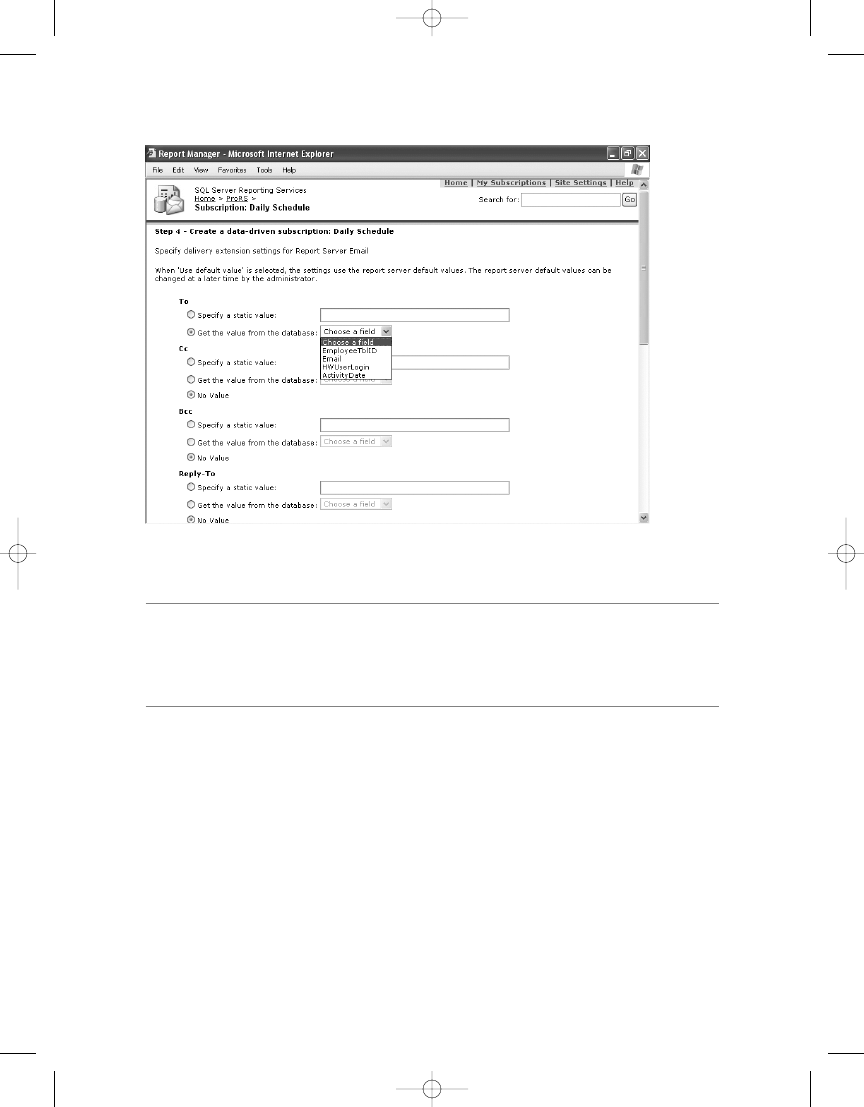
C H A P T E R 8
■
M A N A G I N G R E P O RT S
221
■
Tip
All the report-rendering formats are available for subscriptions, except for HTML Office Web Components.
With data-driven subscriptions, unlike with standard subscriptions, you can control the rendering format per
subscriber because it too is a data-driven setting. If you need to control the rendering format per user, you
can add a field to store this value in the
Employee
table and select this value in the query.
The EmployeeTblid field is used for the one parameter in the report. Because you’ve selected
this field in the query and passed this as a parameter input, each report is automatically
generated with data specific to the employee who subscribed to the report. The other field,
HWUserLogin
, is put in the driving query, which you’ll ultimately compare to the Windows login
name of the user executing the report. You can accomplish this, as you’ll see in Chapter 9, by
using the User global collection.
For the final step, you create a schedule that processes the report each weeknight at 9:30
PM, as described earlier. You can create another shared schedule to process the subscription
and test it to verify that the e-mail is being delivered successfully. After that is complete, you’re
finished with the subscription configuration.
Figure 8-20.
Subscription settings
4983ch08.qxd 10/7/05 11:13 AM Page 221
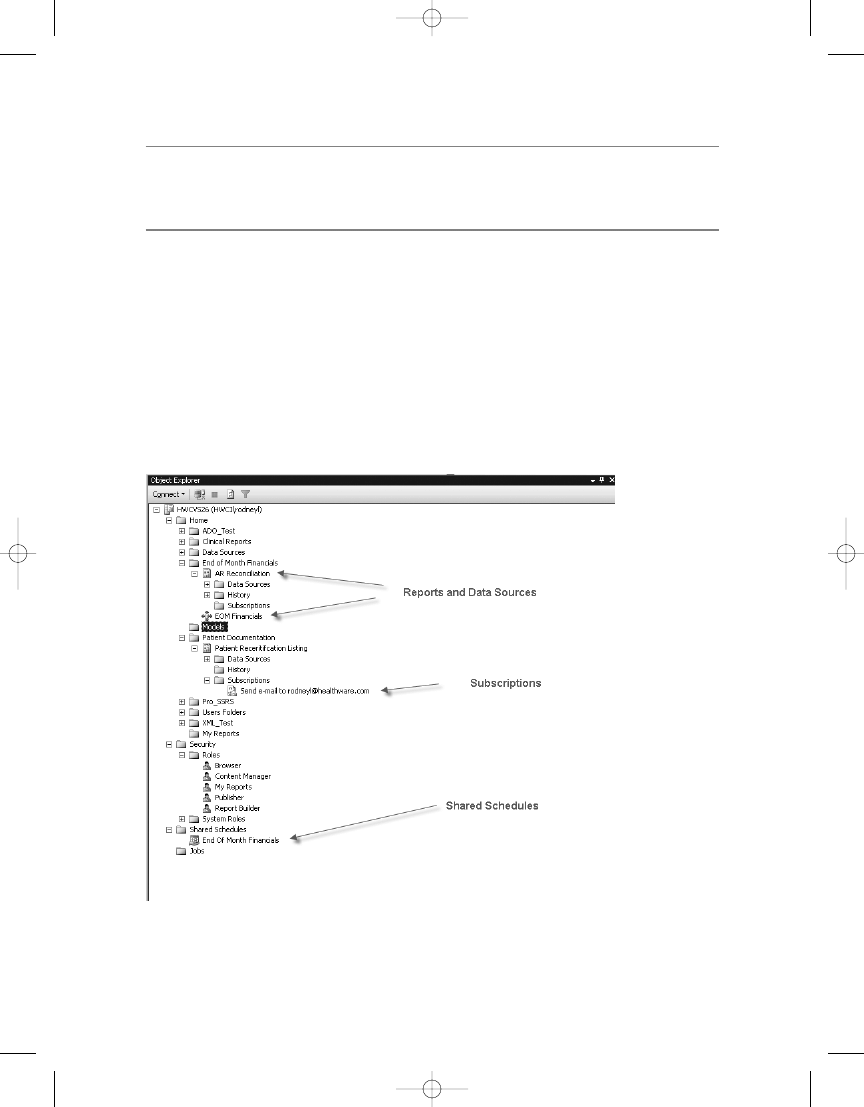
C H A P T E R 8
■
M A N A G I N G R E P O RT S
222
Figure 8-21.
SSMS report server configuration objects
■
Note
The default rendering format for subscriptions is a Web archive, but for many types of reports, this
isn’t the ideal choice. Other printable reports are better suited for Adobe Acrobat PDF files or static image
files such as TIFF.
Using SSMS and SSRS
Most of the management tasks that are available with other SSRS tools, such as Report Manager
and rsconfig, are available in SSMS, and often SSMS is the best application for the job because
its tasks are contained within a single, familiar environment that does not require the cumber-
some page refreshes and maneuvering through the browser-based Report Manager. Let’s take
a quick look at SSMS, which by now you know is new to SQL Server 2005. You can configure all
the report objects and their properties, including data sources, subscriptions, execution, history,
and shared schedules, that you have completed with Report Manager just as easily using SSMS.
Figure 8-21 shows SSMS and the configuration tasks available within the IDE.
4983ch08.qxd 10/7/05 11:13 AM Page 222
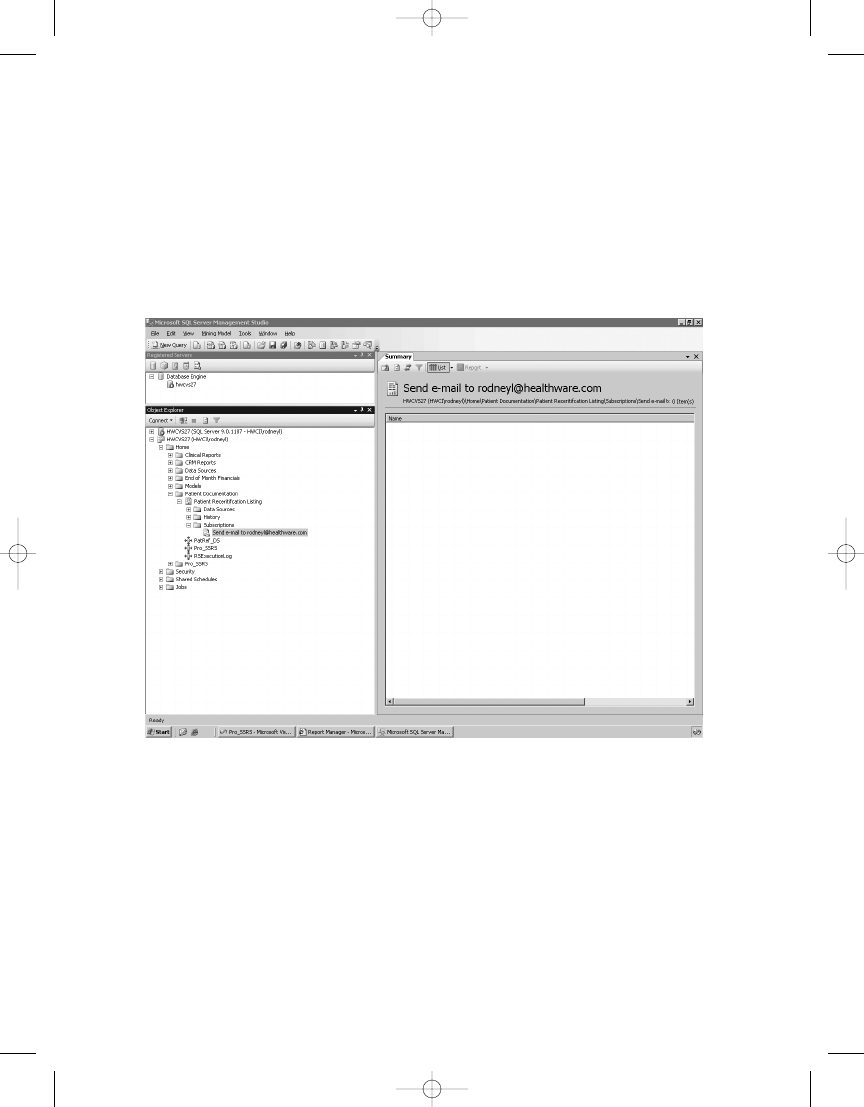
C H A P T E R 8
■
M A N A G I N G R E P O RT S
223
We mentioned earlier in the chapter, when creating a schedule for the Patient Certification
Listing report, that we would show how to configure it in SSMS. Let’s do that now by opening
SSMS and connecting to the Reporting Services Server type connection. For your server, enter
localhost or the name of the computer where you are hosting SSRS. Next, navigate to the
Patient Certification Listing report, as shown in Figure 8-22, that you deployed to the Patient
Documentation
folder. Notice that under the report are three folders, Data Sources, History,
and Subscriptions. When you expand the Subscriptions folder, you should see the e-mail
subscription.
Double-clicking the subscription opens its Properties window, which at first glance con-
tains all the values that you could configure in Report Manager when you first created it. The
General page shows the e-mail properties, such as To, Cc, and whether to include the report or
a link. In this case, let’s say you had a request to change the time for the report schedule, from
9:30 PM, as it was originally set, to 10:30 PM. To do this, select the Scheduling page, as shown
in Figure 8-23. You can see that the schedule set up in Report Manager is available and can be
modified by clicking Set Schedule.
Figure 8-22.
Navigating to the subscription in SSMS
4983ch08.qxd 10/7/05 11:13 AM Page 223
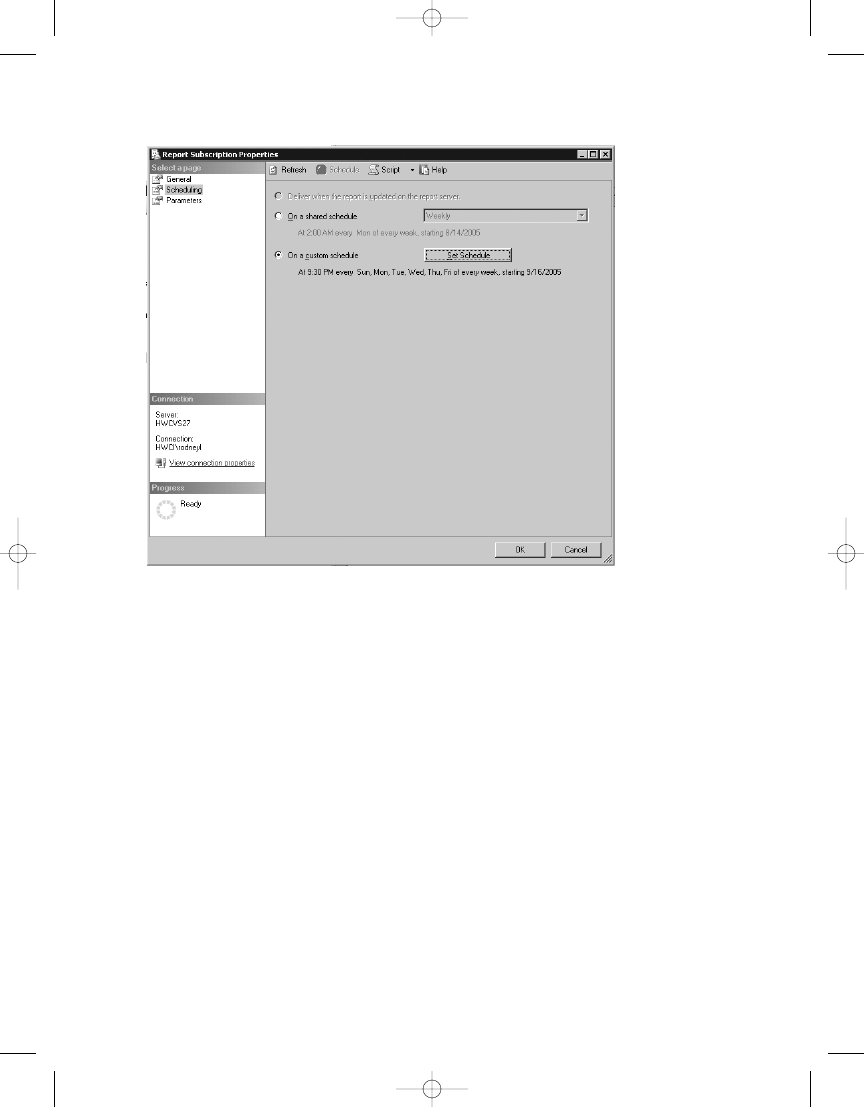
C H A P T E R 8
■
M A N A G I N G R E P O RT S
224
Figure 8-23.
Scheduling page in SSMS Report Subscription properties
When you click Set Schedule, a Create Custom Schedule form appears, as shown in
Figure 8-24. Simply change the 9:30 start time to 10:30, and click OK. If you need to change the
default parameters for the subscription, you can do that as well by selecting the Parameters page.
4983ch08.qxd 10/7/05 11:13 AM Page 224
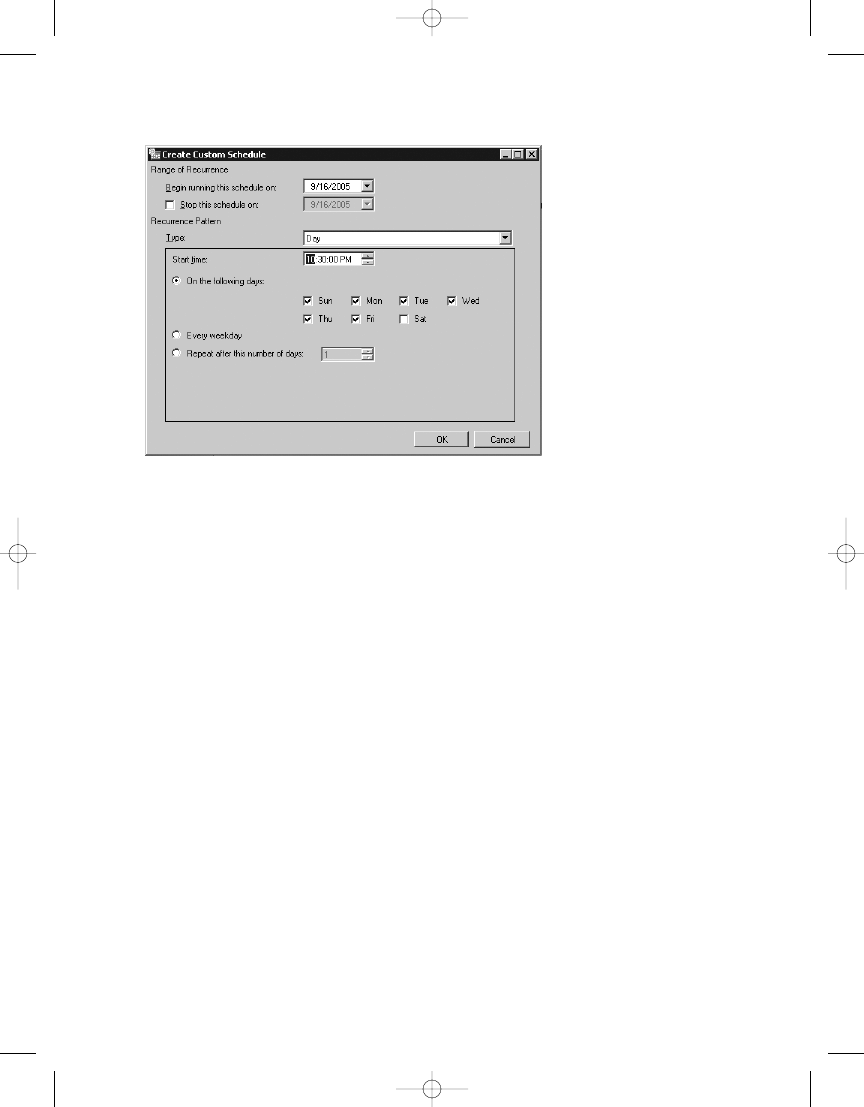
C H A P T E R 8
■
M A N A G I N G R E P O RT S
225
One of the main drawbacks to using SSMS is that it has to be installed on your worksta-
tion, unlike the browser-based Report Manager that is accessible from anywhere. If you are
doing a lot of management work at one time such as setting security for a large number of
users, however, SSMS is definitely a much faster front-end application.
Performing Execution Auditing and Performance
Analysis
As you deploy SSRS in both test and production environments, gauging performance involves
a variety of benchmarking and analysis tools. Based on the performance analysis, administra-
tors are armed with the knowledge of what stress levels their servers can endure, and they’ll be
able to configure the environment accordingly. We’ll show how to put the components of your
SSRS deployment to the test and show how to analyze the output using standard tools.
Many agencies need to monitor and archive the details of user activity. This is especially
important if you suspect there’s undesired access to data. SSRS provides a built-in logging fea-
ture that captures several key pieces of information. This information is useful in two ways:
• You can capture performance information about the reports, such as the processing
duration and record count.
• You can capture security information, such as who executed the report and whether or
not they were successful.
The first goal in the following sections is to set up and extend the built-in logging func-
tionality of SSRS using tools provided in the SSRS installation. You’ll need to log all activity so
Figure 8-24.
Changing the subscription start time
4983ch08.qxd 10/7/05 11:13 AM Page 225

C H A P T E R 8
■
M A N A G I N G R E P O RT S
226
that you can pinpoint the reports and users who are most impacting the server. We have cre-
ated a custom SSRS report, Report Execution Log, which will deliver the logging statistics to
administrators and contain dynamic column groupings based on a report parameter and be
rendered in HTMLOWC for PivotTable analysis. We’ll show how you can use this report for
your SSRS deployment.
The second goal in the following sections is to show how to perform benchmarking tests
on the SSRS servers in our test Web farm to ensure there won’t be any unexpected perfor-
mance problems when SSRS is deployed to a production environment. We’ll show how to
work with a Web application stress-test utility called Application Center Test (ACT) to gauge
performance.
Configuring SSRS Logging
Getting to the execution log information in SSRS is a fairly straightforward procedure. It con-
sists of a main table in the SSRS database called, appropriately enough, ExecutionLog. When
SSRS is installed by default, execution logging is enabled. However, the data in the table, although
useful by itself, isn’t ideally formatted for direct querying. Because one of the aims is to build
a custom SSRS report to deliver report execution information to administrators, you’ll need to
be able to query the log data. Fortunately, SSRS provides a means of transforming the data in
the ExecutionLog table into several tables that can be queried more easily to produce valuable
output.
Transforming the ExecutionLog Table
Setting up SSRS to transform the logging data is a simple step-by-step procedure. We will
show how to step through the process in our environment here. You can find all the files
you’ll need to create and transform the SSRS logging data in the SQL Server 2005 installa-
tion folder in the following sub-folder: Samples\Reporting Services\Report Samples\
Server Management Sample Reports\Execution Log Sample Reports
. Which in a default instal-
lation is: C:\Program Files\Microsoft SQL Server\90\Samples\Reporting Services\
Report Samples\Server Management Sample Reports\Execution Log Sample Reports
. The
first step is to create the database where the execution log data will be stored. The database
may reside on the same SQL Server as SSRS, but you can create it on another database server
if desired. In SSMS, connect to the SQL Server where the ReportServer database is stored.
Next, right-click the Databases folder in SSMS, and select New Database. Name the database
RSExecutionLog, and click OK. Still in SSMS, highlight the newly created database, and then
click New Query on the toolbar. The script to create the required tables in the RSExecutionLog
database is called CreateTables.sql. You can load the script and execute it in the query window
in SSMS.
After creating the database that will store the log data, you load and execute the SSIS
package called RSExecutionLog_Update.dtsx, which populates the tables in the newly created
database, as shown in Figure 8-25.
4983ch08.qxd 10/7/05 11:13 AM Page 226
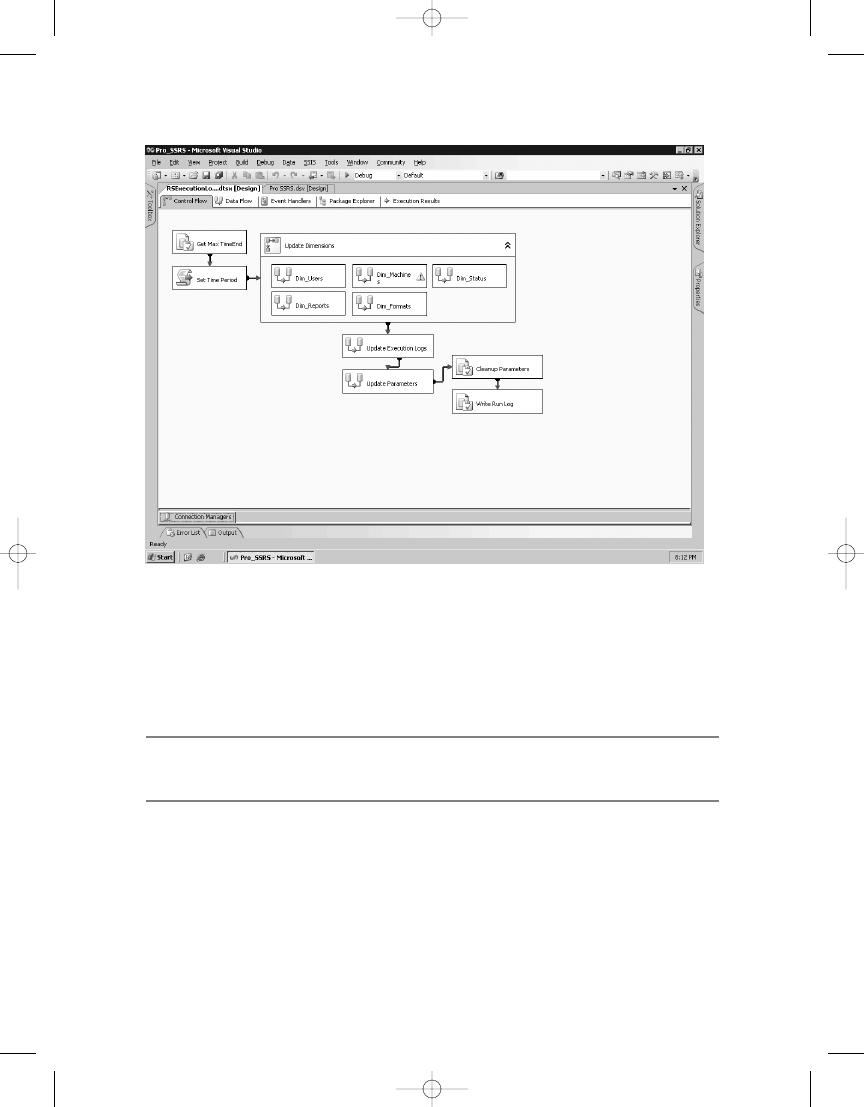
C H A P T E R 8
■
M A N A G I N G R E P O RT S
227
This package uses an initialization file that specifies the source and destination databases
and their locations—typically ReportServer and RSExecutionLog, respectively—on the local
server. You can modify these values if the default names and locations were not used to create
the execution log database.
■
Tip
Note that the package needs to be executed regularly to keep the transformed log data current. In our
situation, we created a scheduled job for this purpose that runs the SSIS package every evening.
Microsoft provides a set of sample reports that you can use with the ExecutionLog data-
base. These reports are included in the SQL Server 2005 installation in the following
location: Samples\Reporting Services\Report Samples\Server Management Sample Reports\
Execution Log Sample Reports
. The sample reports are useful for giving administrators infor-
mation, such as report execution by user and report size, among other things. You will find
three SSRS execution log sample reports in all, one of which, Execution Summary, is shown in
Figure 8-26.
Figure 8-25. RSExecutionLog_Update
SSIS package
4983ch08.qxd 10/7/05 11:13 AM Page 227
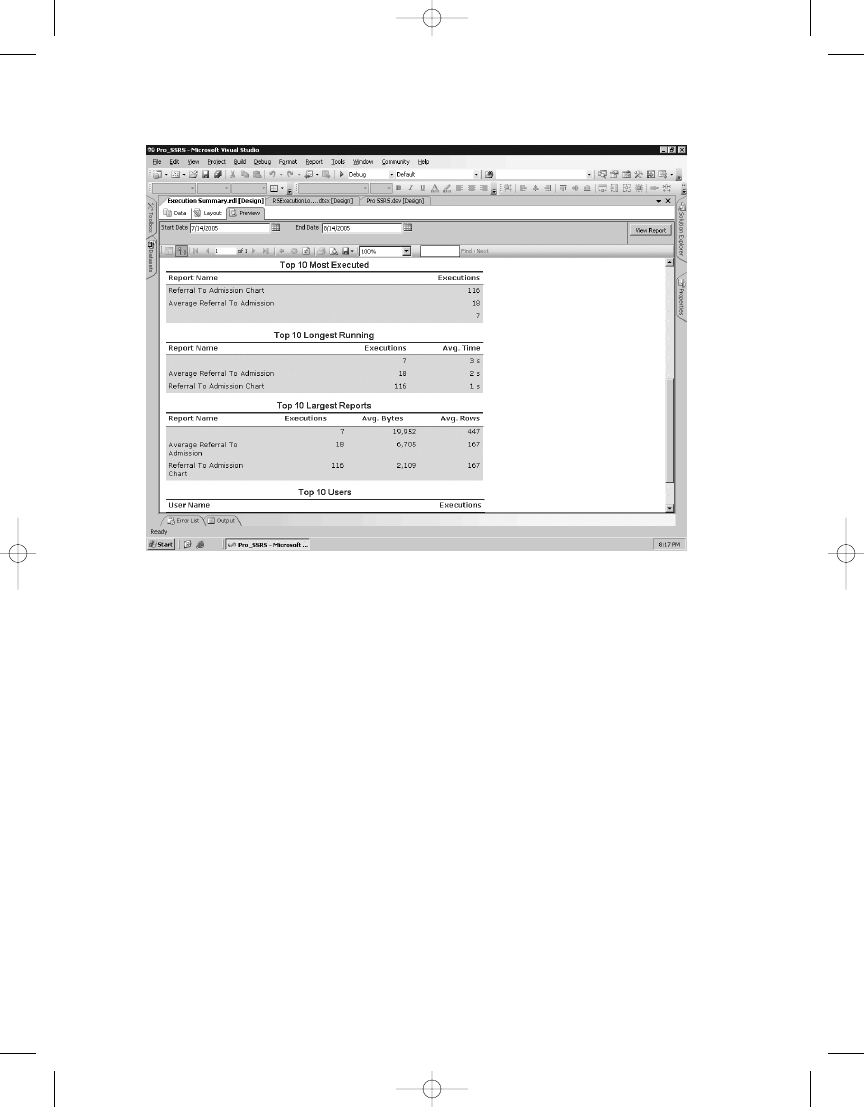
C H A P T E R 8
■
M A N A G I N G R E P O RT S
228
Figure 8-26. Execution Summary
sample report
Designing the Log Report
We knew we would need a single report that contained all the execution log information and
was easy for administrators to analyze. Thus, we created a matrix-style report, called Report
Execution Log, using data from a single query. We needed to use the OWC rendering format to
take advantage of the user interactivity and drag-and-drop capabilities of the PivotTable control.
To measure performance from information contained in the execution log, you need several
statistics:
• Total time to retrieve the data: How long did it take to retrieve data?
• Total time to process: How long did the report take to process?
• Total time to render: How long did the report take to render?
• Byte count: How many bytes are in the report?
• Row count: How many rows of data are in the report?
In addition, knowing when the report was executed is also useful. For the row groupings
in the matrix, we want to see what report was executed, who ran the report, and from which
client machine the report was run. For the column group, we want to have two possible selec-
tions: either rendering format, such as HTML 4.0, HTMLOWC, or PDF, or source types, meaning
how SSRS generated the report (live, cache, or snapshot, for example). Source_Type is an
4983ch08.qxd 10/7/05 11:13 AM Page 228
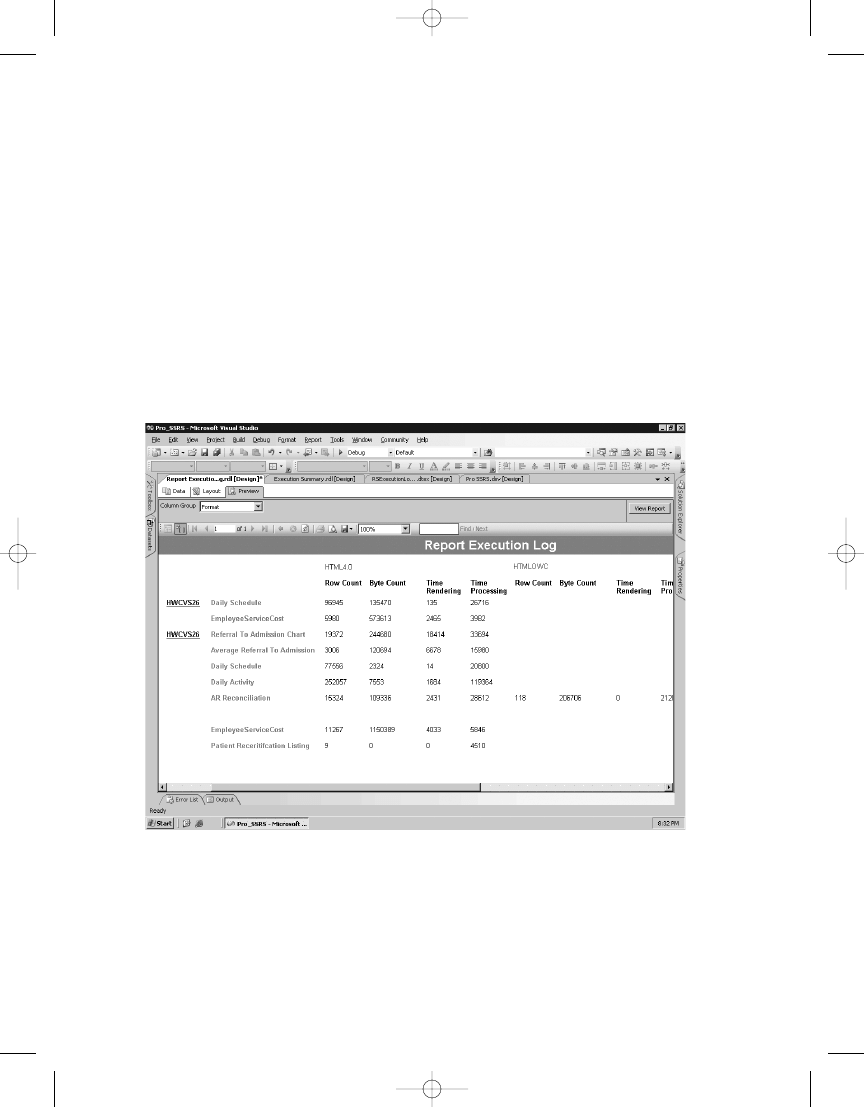
C H A P T E R 8
■
M A N A G I N G R E P O RT S
229
important field to monitor because how SSRS generates reports directly impacts performance.
Generating reports from a cached copy or a snapshot, which are both preprocessed copies of
reports, is a performance benefit. If SSRS is always generating live or on-demand reports for
users, performance may suffer.
To accomplish the dynamic column groupings in the matrix, you’ll use a parameter called
Column_Group
that takes the values of the field names in the query, Format or Source_Type. You’ll
use a default value of Format so that the report is automatically rendered when previewed.
Both the column grouping and heading values will use the following expression to make the
column dynamic based on the parameter:
=Fields(Parameter!Column_Group).Value
When the report is rendered, as you can see in Figure 8-27, it will default to the Format
field, but you can change it dynamically by changing the parameter drop-down selection to
Source_Type
.
One problem remains: automatically rendering the report in OWC instead of the default
HTML 4.0. To accomplish this goal, you can simply navigate to Report Manager and export
the base Report Execution Log to the HTML with Office Web Components format. The URL
will look similar to the following: http://hwcvs26/Reports/Reserved.ReportViewerWebControl.
axd?ReportSession=4k45vk55nkth5dnpes5nvq55&ControlID=727156ae-c1ea-4457-95b0-
Figure 8-27.
Report Execution Log report
4983ch08.qxd 10/7/05 11:13 AM Page 229
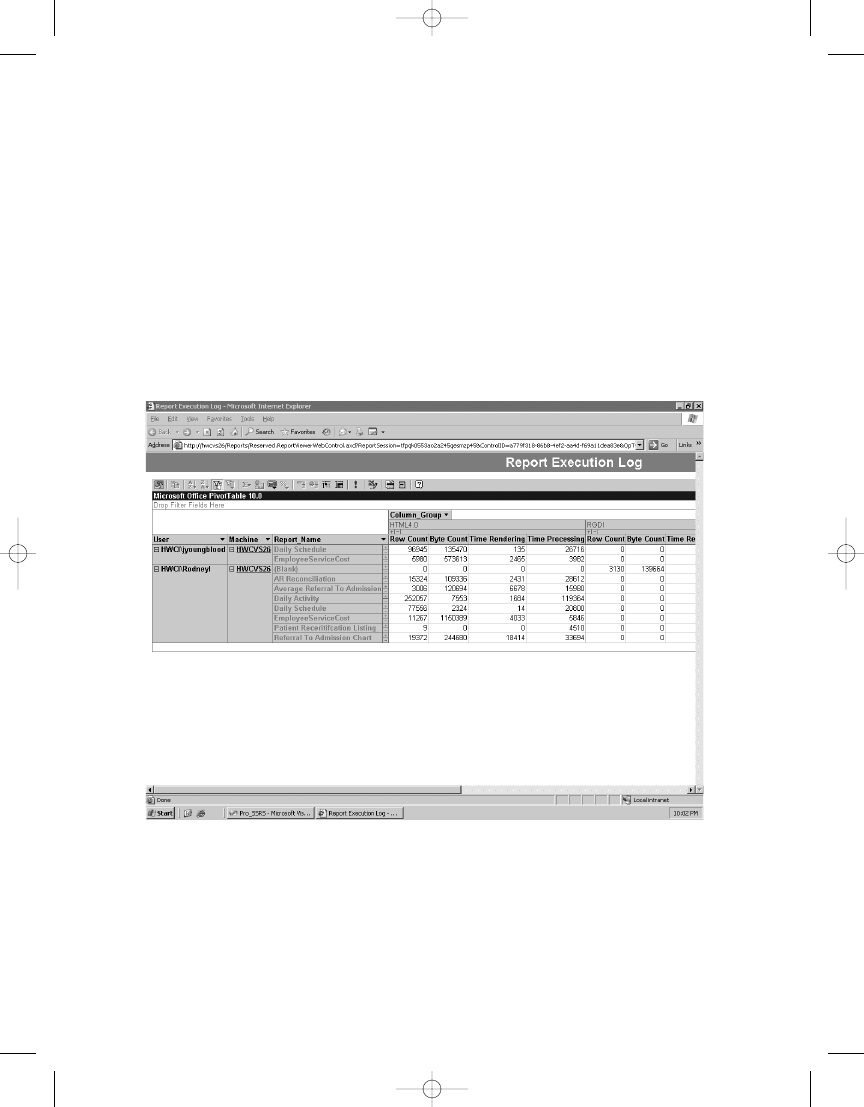
C H A P T E R 8
■
M A N A G I N G R E P O RT S
230
Figure 8-28.
HTMLOWC Report Execution Log report
When administrators execute the report from this URL, they will be able to dynamically
work with the report to gain a clear picture of the longest-running reports overall, as well as
the report that contained the most data. Having the ability to group by user and machine will
further narrow potential bottlenecks. You could gather additional performance measures to
report on if you chose to, such as the parameter value that the user selected. This would be
useful when a pattern is discovered, such as that a particular user runs a certain report and
always chooses the same parameters that return more than 10,000 records. Thousands of pos-
sible combinations of data views exist for the administrator within the PivotTable. Further, if
administrators want to save a custom view of the report, they can export the PivotTable from
OWC directly to Excel.
Figure 8-28 shows the Report Execution Log report rendered in OWC. We have included
this report for download in the Source Code area on the Apress Web site; you will find it in the
Pro_SSRS
project and can use it directly with your SSRS deployment.
Working with OWC for SSRS for SQL Server 2005 has one major caveat: it has been
stricken from the base formats by default. You may notice, on your initial installation of SSRS
2005 that the HTML with Office Web Components option is not a selectable option. I (Rodney)
was not pleased with this, so I put it back in, and you can too, with a few simple lines added to
the reportserver.config file located in your SSRS installation path, typically C:\Program Files
\Microsoft SQL Server\MSSQL.n\Reporting Services\ReportServer
. Listing 8-3 shows these
4983ch08.qxd 10/7/05 11:13 AM Page 230

C H A P T E R 8
■
M A N A G I N G R E P O RT S
231
lines, which you can add to the Render section of the reportserver.config file. You can find
this code, called HTMLOWC.txt, in the Queries folder in the Source Code section of the Apress
Web site.
Listing 8-3.
Code to Add HTMLOWC Support
<Extension Name="HTMLOWC" Type="Microsoft.ReportingServices.Rendering➥
.HtmlRenderer.HtmlOWCRenderingExtension,Microsoft.ReportingServices.HtmlRendering">
<Configuration>
<OWCConfiguration>
<OWCDownloadLocation language="de">http://office.microsoft.com/germany/➥
downloads/2002/owc10.aspx</OWCDownloadLocation>
<OWCDownloadLocation language="en">http://office.microsoft.com/➥
downloads/2002/owc10.aspx</OWCDownloadLocation>
<OWCDownloadLocation language="ja">http://office.microsoft.com/japan/➥
downloads/2002/owc10.aspx</OWCDownloadLocation>
<OWCDownloadLocation language="zh-chs">http://office.microsoft.com/china/➥
downloads/2002/owc10.aspx</OWCDownloadLocation>
<OWCDownloadLocation language="zh-cht">http://office.microsoft.com/china/➥
downloads/2002/owc10.aspx</OWCDownloadLocation>
<OWCDownloadLocation language="es">http://office.microsoft.com/spain/➥
downloads/ 2002/owc10.aspx</OWCDownloadLocation>
<OWCDownloadLocationlanguage="ko">http://office.microsoft.com/korea/➥
downloads/2002/owc10.aspx</OWCDownloadLocation>
<OWCDownloadLocation language="fr">http://office.microsoft.com/france/➥
downloads/2002/owc10.aspx</OWCDownloadLocation>
<OWCDownloadLocation language="it">http://office.microsoft.com/italy/➥
downloads/2002/owc10.aspx</OWCDownloadLocation>
</OWCConfiguration>
</Configuration>
</Extension>
You also need to make sure that the client machine where the report is being exported to
HTMLOWC contains the OWC installed that is the supported version for SSRS, version 10. SSRS
will instruct the user where to download the OWC installation file if it’s not already installed;
otherwise, you can download and preinstall it from http://office.microsoft.com/downloads/
2002/owc10.aspx
. The default installation of Office XP or 2003 also installs these controls.
Monitoring Performance
Of course, no one wants to experience the frustration of building a solid reporting solution in
a development environment only to find out that when deployed to the masses, it can’t hold
up under the strain. Generally, it’s a best practice to put a simulated load on your servers to
gain a better understanding of how the systems will function. Also, when you roll out a full
solution, it’s a common practice to roll out several pieces at a time to a limited number of
users. That is what we’ve done in our online models.
The strategy for rolling out should also include a plan for which reports will be available
on-demand versus which ones will be provided via report snapshots or subscriptions, as
strategy of peak and off-peak report
4983ch08.qxd 10/7/05 11:13 AM Page 231
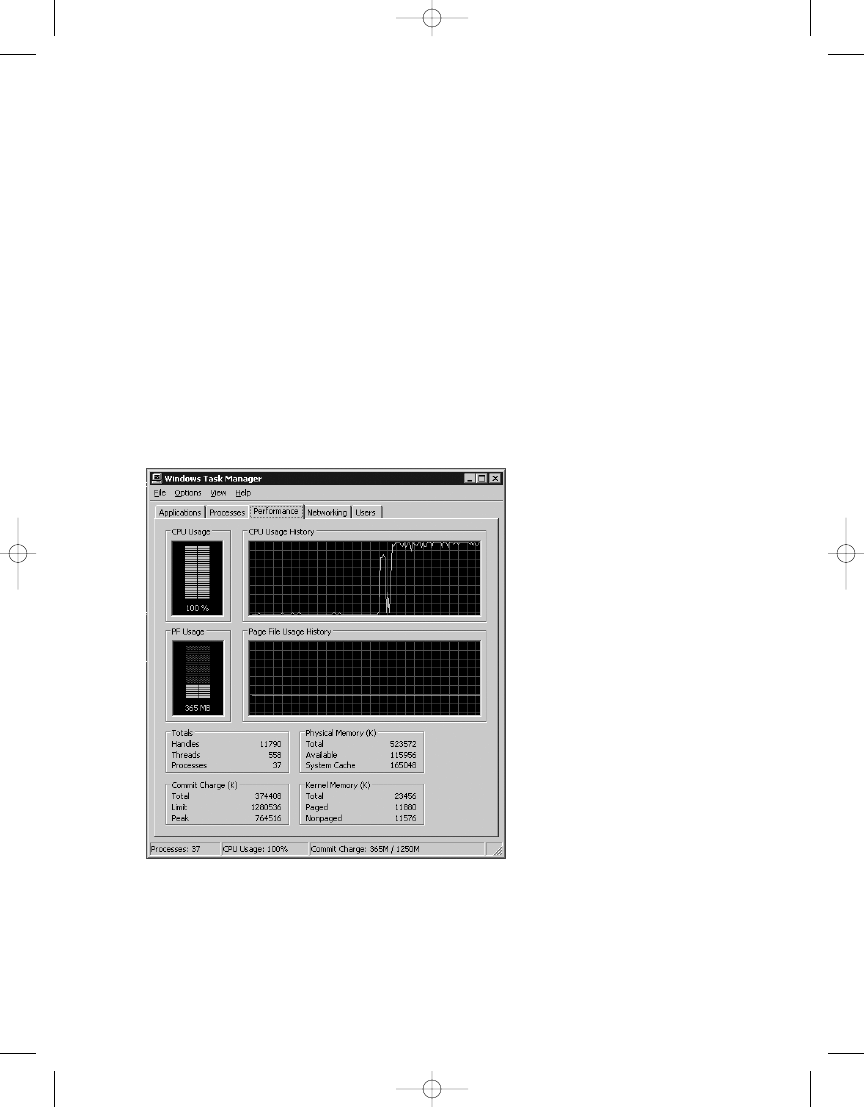
Figure 8-29.
Task Manager at 100 percent
C H A P T E R 8
■
M A N A G I N G R E P O RT S
232
processing will greatly improve performance. Another consideration for performance with
SSRS lies in splitting the load of SSRS Web services and database services. That is, if the
entire SSRS installation resides on the same system, this could negatively impact performance.
In this section, we’ll show the results of a stress test that we ran accessing two report server
instances on two separate servers, RS05 and HWC04. Many tools, such as SSRS, are available for
stress testing Web applications; fortunately, Visual Studio 2005 has a Web stress-test tool built
in that we used to perform a simulated load on the two servers.
We’ll also show you how to use rsconfig to join an SSRS server to a Web farm to see
how offloading resources to another system will enhance performance. The Report Server
Configuration Manager can also be used for this purpose.
We began by running a simulated load of 15 users, all executing a single report against RS05.
We quickly assessed the performance impact by monitoring the server with Task Manager. Unfor-
tunately, our test pushed the server to 100 percent CPU utilization. Analyzing the individual
processes that were taxing the processor, we ascertained that they were SQL Server and the
Web service W3WP.exe. Figure 8-29 shows the CPU usage jumping to 100 percent as the test was
running.
We knew our test SSRS server was a single processor system with more than 500MB of RAM.
In this case, it was the CPU that was the bottleneck. Because our production deployment of
SSRS would not mirror the setup of RS05 (in other words, the production server would be a high-
e could take that into consideration.
4983ch08.qxd 10/7/05 11:13 AM Page 232
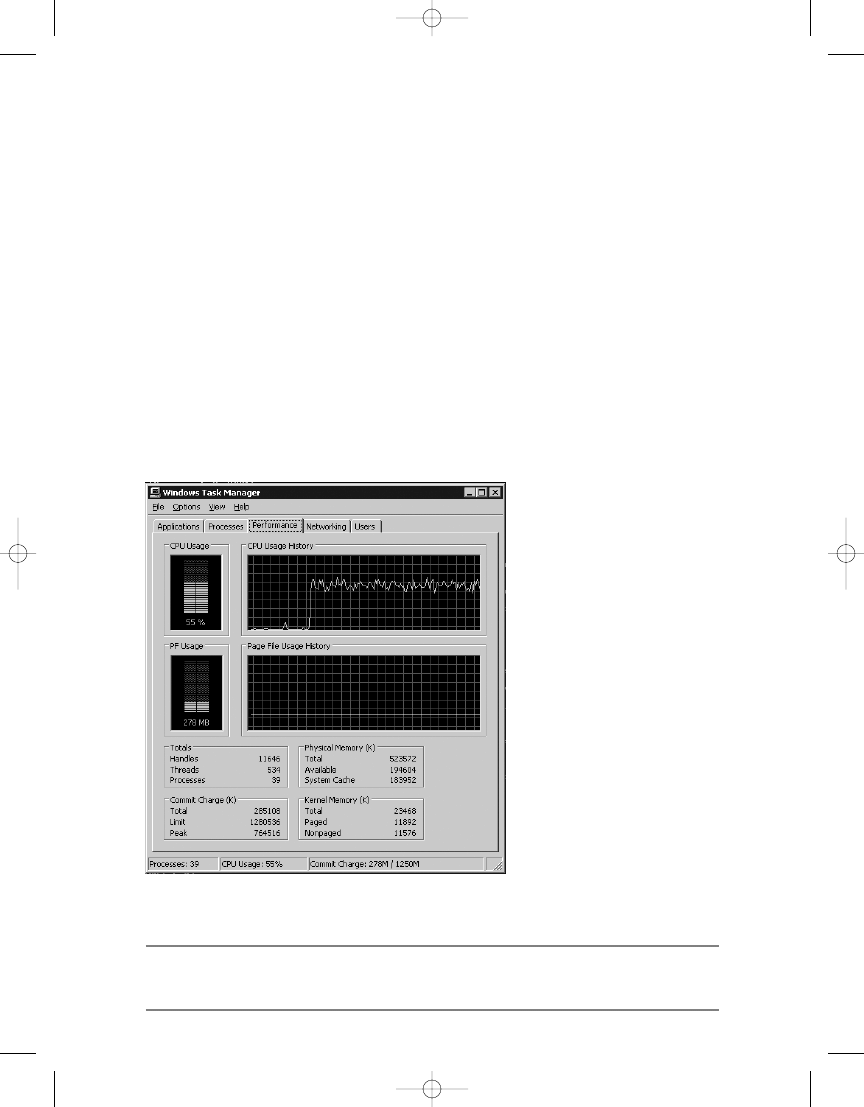
C H A P T E R 8
■
M A N A G I N G R E P O RT S
233
However, one other factor would have a substantial impact on the difference in performance
between the production and test environments. In the test environment, the SSRS Web service
and SQL Server were on the same system, RS05. What if we configured the SSRS Web service to
use a remote SQL Server instance for its database? Any performance degradation caused by
accessing the ReportServer database over the network instead of a local database would be
negligible if the CPU utilization percentage dropped down to a more manageable number.
If you have two SSRS servers, then moving an SSRS server from one instance to another is
simple. We had two SSRS servers in the test environment, RS05 and HWC04, so the move was
easy enough. To instruct the Web service on RS05 to use the SSRS databases on HWC04, we used
the command-line utility rsconfig. The rsconfig command or Report Server Configuration
Manager is required when first joining one SSRS Web service to a Web farm that uses the same
ReportServer
database. The syntax for the rsconfig command is as follows:
rsconfig -c -s HWC04 -d ReportServer -a SQL -u username -p password
With RS05 using the remote SQL Server database, we initiated another test to see whether
the CPU utilization improved. As you can see in Figure 8-30, CPU utilization improved substan-
tially and was now under the 60 percent average.
Figure 8-30.
Task Manager with improvements
■
Note
Specific licensing guidelines are available for the SSRS 2005 deployment and the location of the
databases and data sources. For more information, visit
http://www.microsoft.com/sql/reporting/
.
4983ch08.qxd 10/7/05 11:13 AM Page 233

C H A P T E R 8
■
M A N A G I N G R E P O RT S
234
Controlling SSRS Programmatically
SSRS 2005 offers two main methods of controlling SSRS 2005 through code:
• Web services
• Windows Management Interface (WMI)
In the following sections, we’ll give an introductory look at using both of these technologies
to manage reports from code. You’ll use the SOAP API, otherwise known as the Report Server
Web service, to add subscription functionality to the SSRS viewer you created in Chapter 6,
and you’ll extend it to allow your users to add subscriptions for the reports you’ve developed
and deployed so far. This has two main benefits. First, it allows you to offload some of the pro-
cessing activity from the SQL Server and SSRS 2005 server during the day, when they are used
most heavily. Second, it saves the executives who want to receive the reports from spending
time navigating to the report server, entering the parameters, and waiting for the results.
Controlling SSRS with SOAP
The SSRS 2005 Report Server Web service offers a feature-rich way of interacting with and con-
trolling your reporting server. Based on SOAP and operating over HTTP, the Report Server Web
service is a simple, yet powerful, way to access the features of the server. In fact, SSRS 2005’s
Report Manager is built using ASP.NET and the SSRS Report Server Web service.
Using the Report Server Web service, you can create custom applications that control all
aspects of the server and cover the entire reporting life cycle:
• Folder and resource management
• Task, role, and policy management
• Data sources and connections
• Report parameters
• Report rendering
• Report history
• Report scheduling
• Report subscriptions
• Linked reports
Adding Subscription Functionality to SSRS Viewer
You’ve already used the Report Server Web service to provide a list of report parameters and
their possible values and to deploy reports in Chapters 6 and 7. In this chapter, you’ll learn how
to use the Report Server Web service to schedule reports to run automatically each morning
before the office opens.
As you saw in the earlier part of this chapter, you can set up subscription services through
the user interface of the report server itself. You may, however, want to provide this functionality
4983ch08.qxd 10/7/05 11:13 AM Page 234
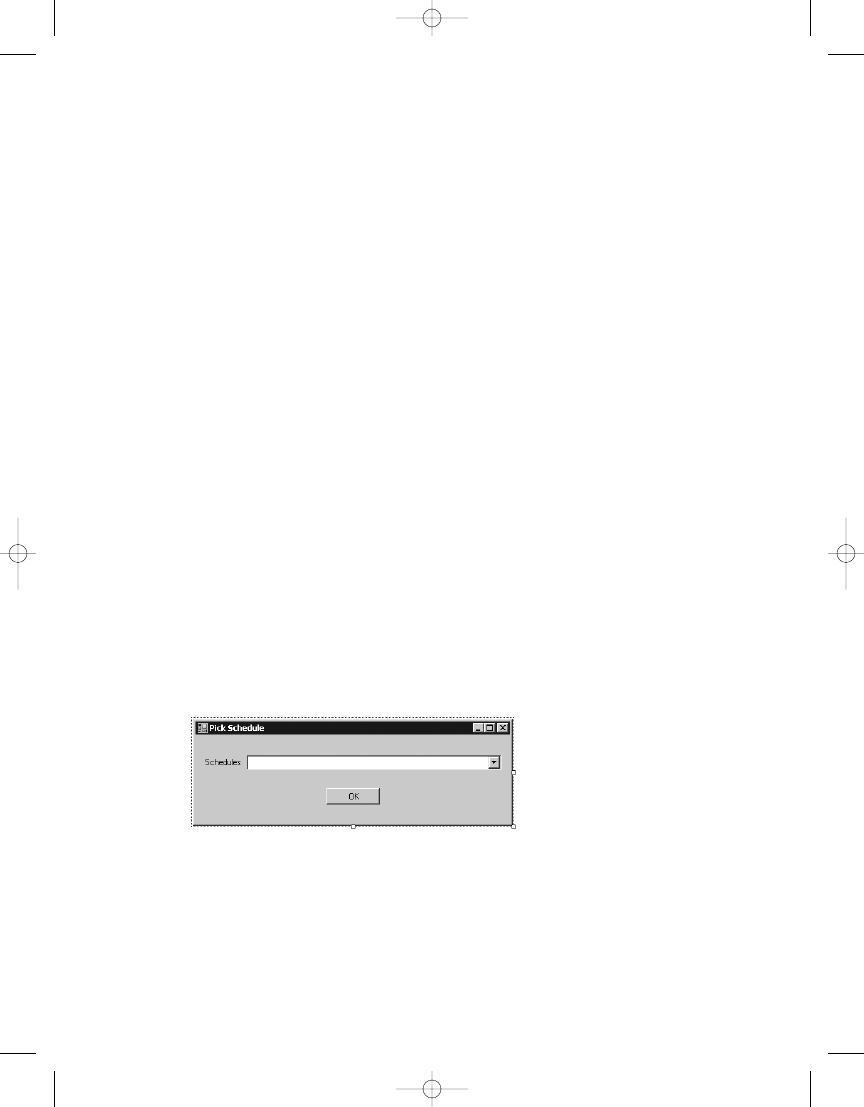
C H A P T E R 8
■
M A N A G I N G R E P O RT S
235
within your customized Windows Forms (or Web) application. In the example, you’ll expand
on the previous Windows Forms application to allow users to provide the parameters that they
want to run the report with, as well as schedule the time to run the report and indicate the
delivery mechanism to use.
In the example, you’ll allow the users to pick only a shared schedule that has already been
defined by the systems administrator. Because you want centralized control over when sched-
uled reports will be run, you won’t give users the ability to define their own schedules. You’ll
also allow them to trigger a subscription based on a snapshot. This allows them to receive
their subscribed report whenever a snapshot is created for it. See the “Creating Snapshots for
the Report History” section earlier in this chapter for details.
Before you run the included examples, make sure to read the ReadMe.htm file. It is located in
a file in the samples root folder. If you have the code open in Visual Studio, it will be under the
Solution Items
folder. It contains setup and configuration steps that are required before running
the examples.
Accessing an Existing Shared Schedule
If you are walking through this code, start by opening the project from Chapter 6, as it will serve
as the starting point for our additions. After you have the solution, open the SSRS Viewer RVC
project, and complete the following steps:
1.
Select Project ➤ Add New Item.
2.
In the Add New Item dialog box, select Windows Form, and enter PickSchedule.cs for
the name.
3.
With the PickSchedule.cs form open in design mode, resize it to 450
×
150 through the
properties page.
4.
Add a label, set its Text property to Schedules, add a combo box named sharedSchedules,
and add a button named setSchedule and set its Text property to OK. When you’re done,
you should have a form that looks like Figure 8-31.
Figure 8-31.
Pick Schedule dialog box
Now select View Code for the PickSchedule class. For this example, you’ll add a few
using
statements to import types defined in other namespaces so you can avoid typing
the full namespaces during the actual coding. Add the namespaces shown in Listing 8-4 to the
PickSchedule.cs
class file below the other using statements.
4983ch08.qxd 10/7/05 11:13 AM Page 235

C H A P T E R 8
■
M A N A G I N G R E P O RT S
236
Listing 8-4.
Importing Namespaces
using System.Collections;
using System.Diagnostics;
using System.Web.Services.Protocols;
using SSRS_Viewer_RVC.SSRSWebService;
Next, add the class variables shown in Listing 8-5 to PickSchedule.cs just below the class
declaration. The ReportingService2005 type contains the methods and properties you can use
to call the SSRS 2005 Report Server Web service and is made available through the Web refer-
ence you added to the SSRS Viewer RVC project in Chapter 6.
Listing 8-5.
Class-Level Private Variables
private string url;
private string server;
private string report;
private ReportingService2005 rs;
Next, modify the PickSchedule_Load event to query the SSRS 2005 server for the shared
schedules that are available.
■
Note
You’ll need to set up these shared schedules in advance using Report Manager on your SSRS 2005
server. You can add and edit shared schedules by navigating to your SSRS 2005 server with your Web browser,
selecting Site Settings, and then under Other, selecting Managed Shared Schedules. You can also use SSMS
to setup shared schedules. By default, you need to set up these Shared Schedules as a user who is in the
SSRS 2005 System Administrator role, and users who access them must be members of the System Users
role. Also, subscriptions require that the SQL Server Agent is running and that your data source has stored
credentials. See the “Shared Schedules” section earlier in this chapter for details.
Next, take the URL that is passed in when the PickSchedule class is initialized and break it
apart to get the report name for which you are setting the schedule. Add the code in Listing 8-6
to the class’s constructor.
Listing 8-6. PickSchedule
Constructor
public PickSchedule(string URL)
{
InitializeComponent();
url = URL;
string[] reportInfo = url.Split('?');
server = reportInfo[0];
report = reportInfo[1];
}
4983ch08.qxd 10/7/05 11:13 AM Page 236

C H A P T E R 8
■
M A N A G I N G R E P O RT S
237
■
Note
The call to
InitializeComponent
is present in the constructor already. It was added automatically
when the form was created.
To get a list of available shared schedules from your SSRS 2005 server, you’ll use the
ListSchedules
method of the Report Server Web service. The ListSchedules method returns
an array of Schedule objects, so after you call the method, you’ll need to loop through the
array to populate your combo box. Because you’re expanding the existing viewer, you still
want the user to be able to run the report immediately. You also want your users to be able to
trigger the subscription whenever a snapshot of the report is created. To do this, add a Do Not
Schedule choice and a Schedule with Snapshot choice to your combo box.
■
Note
You can set up snapshots through the Report Manager Web interface of your SSRS 2005 server or
through SSMS.
The code shown in Listing 8-7 uses the ComboItem class that you created in Chapter 6 to
add the items to combo boxes. With PickSchedule.cs in design mode, double-click the form.
This creates an empty method to handle the form’s Load event. Add the code shown in Listing 8-7
to the PickSchedule_Load method.
Listing 8-7.
Getting Shared Schedules
private void PickSchedule_Load(object sender, EventArgs e)
{
rs = new SSRSWebService.ReportingService2005();
rs.Credentials = System.Net.CredentialCache.DefaultCredentials;
Schedule[] schedules = null;
try
{
schedules = rs.ListSchedules();
if (schedules != null)
{
//Build list items
ArrayList aList = new ArrayList();
// Now add the Do Not Schedule item
aList.Add(new ComboItem("Do not schedule", "NS"));
// And the Snapshot schedule
aList.Add(new ComboItem("Schedule with Snapshot", "SS"));
foreach (Schedule s in schedules)
4983ch08.qxd 10/7/05 11:13 AM Page 237

C H A P T E R 8
■
M A N A G I N G R E P O RT S
238
{
aList.Add(new ComboItem(s.Description, s.ScheduleID));
Debug.WriteLine(String.Format("Desc: {0} - ID: {1}", s.Description,
s.ScheduleID));
}
//Bind list items to combo box
sharedSchedules.DataSource = aList;
sharedSchedules.DisplayMember = "Display";
sharedSchedules.ValueMember = "Value";
}
}
catch (SoapException ex)
{
MessageBox.Show(ex.Detail.InnerXml.ToString());
}
}
Scheduling the Report
Now that you have the list of available scheduling options, you need to add some code to han-
dle the case in which the user has selected to schedule the report to be delivered based on one
of the shared schedules or on the creation of a snapshot. To do this, you’ll use another method
of the Report Service Web service, CreateSubscription. The CreateSubscription method of the
API takes six parameters:
• Report: The full path name of the report for which to create a subscription.
• ExtensionSettings: Represents a delivery extension and contains a list of settings specific
to the extension. SSRS 2005 comes with two built-in extensions, the Email Delivery
extension and the File Share Delivery extension.
• Description: A meaningful description displayed to users.
• EventType: The type of event that triggers the subscription. The valid values are
TimedSubscription
and SnapshotUpdated.
• MatchData: The data that is associated with the specified EventType parameter. This
parameter is used by an event to match the subscription with an event that has fired.
• Parameters: An array of ParameterValue[] objects that contains a list of parameters for
the report.
In your report scheduler, you’ll create a new method, ScheduleReport, which is called
whenever the user chooses to have a report scheduled. This method sets these parameters to
the appropriate values and then calls the CreateSubscription method of the SSRS 2005 Report
Server Web service. Most of the values are just strings and are straightforward to set.
Check to see whether the user selected a subscription and, if so, whether it is based on
a shared schedule or a snapshot. You’ll use this to set the EventType accordingly. If the user
selected Shared Schedule, then set the variable matchData to the ScheduledID. If not, set the
snapshot.
4983ch08.qxd 10/7/05 11:13 AM Page 238

C H A P T E R 8
■
M A N A G I N G R E P O RT S
239
if (sharedSchedules.SelectedValue.ToString() == "SS")
{
eventType = "SnapshotUpdated";
matchData = null;
}
else
{
eventType = "TimedSubscription";
matchData = sharedSchedules.SelectedValue.ToString();
}
To set up a subscription, you have to provide SSRS 2005 with some information about how
to deliver the subscription. To do this, set the delivery extensions through an ExtensionSettings
object, which itself contains ParameterValue objects. ParameterValue objects are essentially
name-value pairs, making the ExtensionSettings object essentially an array of name-value
pairs.
To use the ExtensionSettings object, create ParameterValue objects (your name-value
pairs) with your delivery settings and then add them to the ExtensionSettings object. You’ll
then call the CreateSubscription method and pass in the ExtensionSettings object to give
SSRS 2005 the subscription specifics. (See Listing 8-8 for details.)
If the user decides on a subscription based on a shared schedule, and the report accepts
parameters, then you’ll need to collect them from your report viewer interface so that you can
set them in the subscription. These are the values that the report will run with whenever it’s
run by the subscription. To do this, you’ll add code to the PickSchedule form to call the
GetParameters
form. Because the GetParameters class returns values in the form of Winforms.
ReportParameters
, you’ll have to convert them into an array of ParameterValue objects required
by the Report Server Web service. The only other item you need is the report itself, which you
already have as a class-level variable that was set in the Forms constructor. The final method
should look like Listing 8-8; add it to PickSchedule.cs.
Listing 8-8.
Report Scheduler
private void ScheduleReport()
{
// See whether the user wants to schedule this versus run it now
if (sharedSchedules.SelectedValue.ToString() != "NS")
{
string desc = "Send report via email";
string eventType = String.Empty;
string matchData = String.Empty;
// If the user selected SnapShot, then
// set up the parameters for a snapshot
if (sharedSchedules.SelectedValue.ToString() == "SS")
{
eventType = "SnapshotUpdated";
matchData = null;
}
4983ch08.qxd 10/7/05 11:13 AM Page 239

C H A P T E R 8
■
M A N A G I N G R E P O RT S
240
// otherwise the user is using a subscription
else
{
eventType = "TimedSubscription";
matchData = sharedSchedules.SelectedValue.ToString();
}
ParameterValue[] extensionParams = new ParameterValue[8];
extensionParams[0] = new ParameterValue();
extensionParams[0].Name = "TO";
extensionParams[0].Value = "someone@company.com";
extensionParams[1] = new ParameterValue();
extensionParams[1].Name = "ReplyTo";
extensionParams[1].Value = "reporting@company.com";
extensionParams[2] = new ParameterValue();
extensionParams[2].Name = "IncludeReport";
extensionParams[2].Value = "True";
extensionParams[3] = new ParameterValue();
extensionParams[3].Name = "RenderFormat";
extensionParams[3].Value = "PDF";
extensionParams[4] = new ParameterValue();
extensionParams[4].Name = "Subject";
extensionParams[4].Value = "@ReportName was executed at ➥
@ExecutionTime";
extensionParams[5] = new ParameterValue();
extensionParams[5].Name = "Comment";
extensionParams[5].Value = "Here is your @ReportName report.";
extensionParams[6] = new ParameterValue();
extensionParams[6].Name = "IncludeLink";
extensionParams[6].Value = "True";
extensionParams[7] = new ParameterValue();
extensionParams[7].Name = "Priority";
extensionParams[7].Value = "NORMAL";
ParameterValue[] pvs = ReportParameters();
// Configure the extension settings required
// for the CreateSubscription method
ExtensionSettings extSettings = new ExtensionSettings();
4983ch08.qxd 10/7/05 11:13 AM Page 240

C H A P T E R 8
■
M A N A G I N G R E P O RT S
241
extSettings.ParameterValues = extensionParams;
extSettings.Extension = "Report Server Email";
// Get the report parameters using the GetParameters form
GetParameters reportParameters = new GetParameters(url);
reportParameters.ShowDialog();
Microsoft.Reporting.WinForms.ReportParameter[] rps =
reportParameters.Parameters;
// Convert the Winforms.ReportParameter returned
// from the GetParameters to ParameterValues required for
// the CreateSubscription method
int i = 0;
foreach (Microsoft.Reporting.WinForms.ReportParameter rp
in rps)
{
if (rp.Values.Count != 0)
i++;
}
ParameterValue[] pvs = new ParameterValue[i];
int j = 0;
foreach (Microsoft.Reporting.WinForms.ReportParameter rp in rps)
{
if (rp.Values.Count != 0)
{
pvs[j] = new ParameterValue();
pvs[j].Name = rp.Name;
pvs[j].Value = rp.Values[0];
j++;
}
}
// Now set up the subscription
try
{
rs.CreateSubscription(report, extSettings, desc,
eventType, matchData, pvs);
}
catch (SoapException ex)
{
MessageBox.Show(ex.Detail.InnerXml.ToString());
}
}
}
4983ch08.qxd 10/7/05 11:13 AM Page 241

C H A P T E R 8
■
M A N A G I N G R E P O RT S
242
To complete the PickSchedule form, you need to wire up the setSchedule button’s click
event so it will call the ScheduleReport method to actually schedule the report with the schedule
selected by the user. With the PickSchedule.cs in design mode, double-click the OK button.
Add the code shown in Listing 8-9.
Listing 8-9.
Hooking the Schedule Button's click event to the ScheduleReport Method
private void setSchedule_Click(object sender, EventArgs e)
{
ScheduleReport();
}
Now let’s add a button to the ViewerRVC.cs form that you’ll code to call the new
PickSchedule.cs
form. First, you need to add a new button to the ViewerRVC.cs form.
Name it pickSchedule, and set its Text property to Schedule. This will allow the user to pick
a schedule from the viewer. Second, after you add the button to the form, add the code
shown in Listing 8-10 to the button’s click event by double-clicking the Schedule button
with the ViewerRVC.cs in design mode. Of course, you need to use the name of your report
server where you see localhost in the URL.
Listing 8-10.
The pickSchedule Button’s click Event
private void pickSchedule_Click(object sender, EventArgs e)
{
reportURL.Text = "http://localhost/reportserver?/Pro_SSRS/➥
Chapter_6/EmployeeServiceCost";
PickSchedule reportSchedule = new PickSchedule(reportURL.Text);
reportSchedule.ShowDialog();
}
At this point, you can run the program; however, before you can schedule the report, you
must set the credentials for the shared data source so the report will have login credentials to
use when it is run noninteractively. If you are using SQL authentication, you can do this by
opening the Reports project in the solution and double-clicking the Pro_SSRS.rds data source.
On the Shared Data Source dialog box, select the Credentials tab, and select Use a Specific User
Name and Password. Enter the appropriate username and password to use when running
this report. If you are using Windows integrated authentication, such as running reports
under your Windows account, you need to use Report Manager or SSMS to edit the data
source and select the Use As Windows credentials when connecting to the data source option.
For Windows accounts, specify the login name using the format domain\user.
Now run the program, and pick one of your previously configured schedules. For the
parameters, enter ServiceYear 2003, ServiceMonth November, BranchID Long Loop, and
EmployeeTblID Ywzcsl,Nnc.
■
Note
Remember to use SSMS or Report Manager to set up your shared schedules. You must be logged in
as a user who is a member of the SSRS 2005 System Administrators role to add new schedules. See the section
titled “Creating a Shared Schedule” earlier in this chapter for details.
4983ch08.qxd 10/7/05 11:13 AM Page 242

C H A P T E R 8
■
M A N A G I N G R E P O RT S
243
Delivering the Report
In the example, you’ve used PDF to deliver the report to the subscription user. You’ve also hard-
coded the e-mail address, which isn’t practical in the real world. One other issue of concern,
especially in the health-care setting, is complying to HIPAA and protecting patient information.
You could give the user a textbox with which to enter the e-mail address to which the
user wants the report delivered. However, the user could possibly type in an incorrect e-mail
address and deliver the report to the wrong person. It would be great if the user’s e-mail address
could be filled in automatically, to make sure it is the correct address. You can do this by pulling
the address from a field in a table in the database similar to the data drive subscription example
given earlier in the chapter where you pulled the e-mail address from the Employee table. How-
ever, in this case, the user pulling the report may not be in the database table, and you want
the report delivered automatically to the user scheduling it. Fortunately, the .NET Framework
and Active Directory offer an easy way to do this. For many organizations using Microsoft
Exchange Server 2000 or 2003, e-mail addresses are integrated with Active Directory. If you aren’t
using Exchange Server, e-mail addresses aren’t integrated with Active Directory, but you can
still enter them into Active Directory manually.
Let’s create a method that determines the e-mail of the currently logged-in user. Then you
can use it to provide the To e-mail address for the subscription. Start by adding a new reference
to the project for System.DirectoryServices. Select References under the SSRS Viewer RVC
project in your solution, and then select Add Reference. In the Add Reference dialog box under
the .NET tab, select System.DirectoryServices from the list of component names. Next, add using
statements to simplify your typing, as follows:
using System.DirectoryServices;
using System.Security.Principal;
To find the current user’s e-mail address, use DirectorySearcher, which allows you to per-
form queries against Active Directory, as shown in Listing 8-11. You’ll start at the root level of
the directory and look for the user by name. When you find the user’s name, you return the
first e-mail address you find for the user.
Listing 8-11.
Code to Query Active Directory for E-mail Addresses
private string GetEmailFromAD()
{
DirectoryEntry rootEntry;
DirectoryEntry contextEntry;
DirectorySearcher searcher;
SearchResult result;
string currentUserName;
string contextPath;
WindowsPrincipal wp =
new WindowsPrincipal(WindowsIdentity.GetCurrent());
currentUserName = wp.Identity.Name.Split('\\')[1];
4983ch08.qxd 10/7/05 11:13 AM Page 243

C H A P T E R 8
■
M A N A G I N G R E P O RT S
244
rootEntry = new DirectoryEntry("LDAP://RootDSE");
contextPath =
rootEntry.Properties["defaultNamingContext"].Value.ToString();
rootEntry.Dispose();
contextEntry = new DirectoryEntry("LDAP://" + contextPath);
searcher = new DirectorySearcher();
searcher.SearchRoot = contextEntry;
searcher.Filter =
String.Format("(&(objectCategory=person)(samAccountName={0}))",
currentUserName);
searcher.PropertiesToLoad.Add("mail");
searcher.PropertiesToLoad.Add("cn");
searcher.SearchScope = SearchScope.Subtree;
result = searcher.FindOne();
return result.Properties["mail"][0].ToString();
}
To use this, all you have to do is modify the TO parameter for the delivery extension in the
ScheduleReport
method you wrote earlier to use the new method you just wrote. So, your pre-
vious code for the TO parameter becomes this:
extensionParams[0] = new ParameterValue();
extensionParams[0].Name = "TO";
extensionParams[0].Value = GetEmailFromAD();
Now run the SSRS Viewer RVC, and choose a schedule from the shared schedules you
previously configured. For the parameters, enter ServiceYear 2003, ServiceMonth November,
BranchID Long Loop, and EmployeeTblID Ywzcsl, Nnc.; this will create a subscription that is
e-mailed to you on the schedule you selected. If you navigate to the server now using your
browser, select the Employee Service Cost report, and then select the Subscriptions tab, you
should see your subscription, as shown in Figure 8-32. If you click Edit, you see that it has pro-
vided all the parameters you selected, and it inserted your e-mail address in the To field.
4983ch08.qxd 10/7/05 11:13 AM Page 244
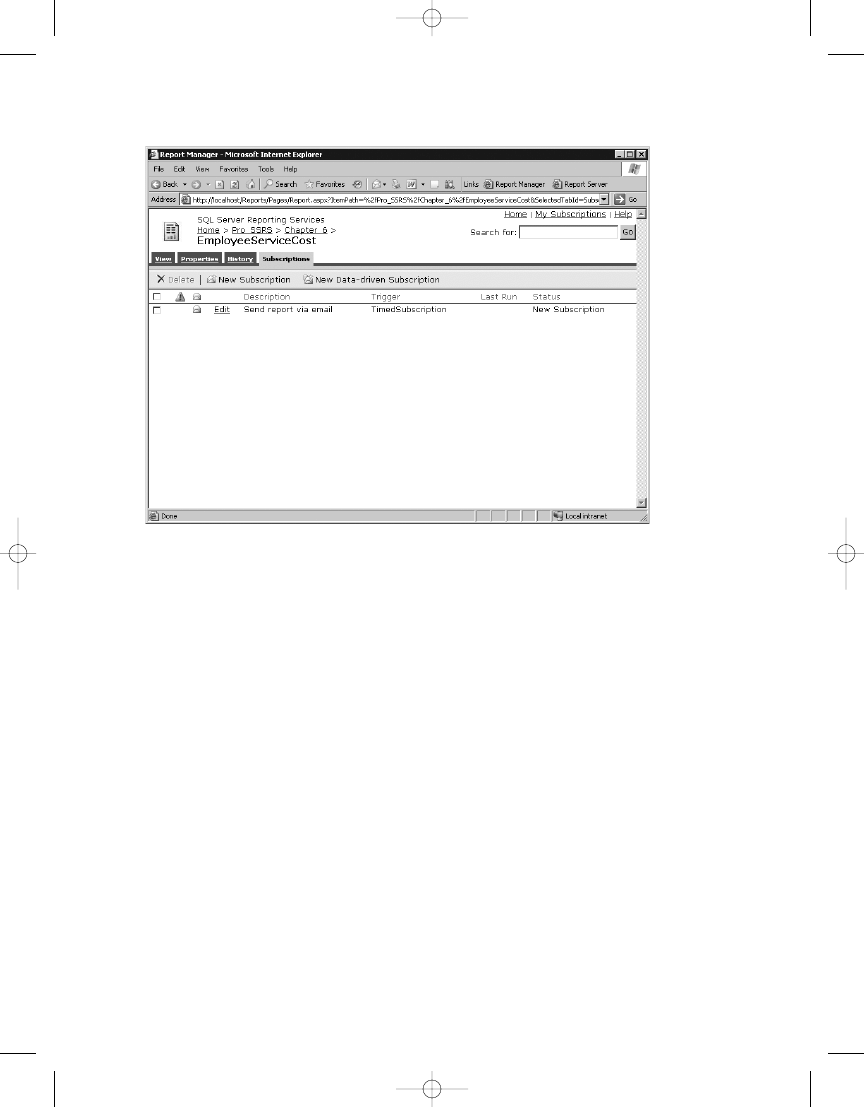
C H A P T E R 8
■
M A N A G I N G R E P O RT S
245
You haven’t seen all the possible options that you can use when scheduling reports such
as the Employee Service Cost report, but we’ve given you a good start to schedule and deliver
reports and add other functionality. Some possibilities include the following:
• Allowing the user to decide the format the report will be delivered in
• Allowing the user to attach the report or just provide a link
• Allowing the user to create schedules on the fly
You can use the SSRS 2005 Report Server Web service to control many more aspects of the
report server and the reports under its control. We have just scratched the surface here of what
you can do, but be aware that the basic aspects of dealing with the report server through the
Report Server Web service are the same for nearly all the functions.
Controlling SSRS with WMI
Before we finish this chapter, we should also briefly discuss how you can manage SSRS using
two WMI classes. These classes are used more for administrative tasks and allow you to
programmatically access server settings. WMI is not used for manipulating reports or report
settings.
WMI offers a standardized way to monitor and control systems and services running any-
where on your network. Using the WMI provider, you can write code that allows you to query
the current settings of an SSRS 2005 server and also to change those settings through properties
.
Figure 8-32.
Subscription as it appears in SSRS 2005
4983ch08.qxd 10/7/05 11:13 AM Page 245

C H A P T E R 8
■
M A N A G I N G R E P O RT S
246
Essentially, these providers allow you to change the settings of the configuration files on
the server programmatically. So, as you might guess, the properties of these classes correspond
almost directly to the elements within the XML files that hold SSRS 2005 configuration
information.
Table 8-2 shows the two classes provided by SSRS 2005 for use with WMI.
Table 8-2.
SSRS 2005 Classes for Use with WMI
Class
Controls
Configuration File
MSReportServer_ConfigurationSetting
Report Server
RSReportServer.
config
MSReportServerReportManager_ConfigurationSetting
Report Manager
RSWebApplication.
config
You can use the MSReportServer_ConfigurationSetting class to determine and/or config-
ure most of the database settings used by SSRS 2005 itself—that is, for the database that SSRS
uses to store the reports, snapshots, and so on. This class doesn’t control the data source con-
nection information used in your reports, although you can set the login information that
the server uses to run a report in unattended mode. You can also work with things such as the
database server name, database name, and login credential information in this class. You can
also use this class to configure the SSRS 2005 service instance name, path name, and virtual
directory it maps to in IIS.
You can use the MSReportServerReportManager_ConfigurationSetting class to determine
the instance name, path name, and virtual root of the SSRS 2005 Report Manager, as well as to
read or set the URL of a particular instance.
To access this information through the SSRS 2005 WMI providers, you use the System.
Management
namespace, which provides access to WMI.
■
Note
If more than one instance of a report server is installed, you’ll need to locate the correct instance
before reading and setting properties. The
PathName
property is the key property, and it uniquely identifies
a particular instance.
Summary
SSRS 2005 provides many tools for management tasks, and we covered several of them in this
chapter. Because SSRS 2005 is a full reporting solution, administrators may find it difficult to
manage the entire site single-handedly without some level of automation or divided tasks,
especially as the number of reports and other objects such as data sources, models, folders,
and subscriptions grows. Maintaining these objects, whether it be to update the report via
Report Manager or to mass deploy reports via a custom application, administrators will con-
tinually find themselves maintaining their SSRS report servers. Tools such as SSMS, Report
Server Configuration Manager, and Report Manager go a long way to centralize the administrative
4983ch08.qxd 10/7/05 11:13 AM Page 246

C H A P T E R 8
■
M A N A G I N G R E P O RT S
247
tasks but do not necessarily reduce the potential rote tasks associated with managing a large
installation. Fortunately, SSRS provides the flexibility to allow other professionals, department
managers, and users to maintain their own reports using tools provided with SSRS 2005 or
through your own custom applications. Of course, with this flexibility comes the need for tighter
security. We will turn now, in the next chapter, to security and show how to make sure that
you can lock down and monitor this flexible model.
4983ch08.qxd 10/7/05 11:13 AM Page 247

4983ch08.qxd 10/7/05 11:13 AM Page 248

Securing Reports
I
f a topic is currently on the minds of operating system makers, application developers, and
system administrators more than security is, we would be hard-pressed to name it. We all
know that security threats come in many flavors and levels of severity—from the innocuous
pop-up Web pages to the invasive worms and viruses that wreak havoc on systems and take
their toll on productivity by wasting time and resources.
These threats are often anonymous scripts or executables—automatons—that their human
creator has released into the wild. But what about the security violations from real individuals?
These are not just elusive system crackers bent on destruction; they can be the overlooked
disgruntled employee who left the company with a notebook full of passwords and the deter-
mination to make a point about the insecurity of the company’s vital data.
Securing systems takes time and effort and sometimes, unfortunately, has a lower priority
than other important daily tasks. However, if your company, like ours and thousands of
others, is affected by the regulations imposed by HIPAA, meeting stringent security standards
is a requirement, not just a recommended practice. Most companies have policies and proce-
dures in place that will meet HIPAA compliance, which took effect in April 2005. As a roles-based
application, SSRS will take advantage of the underlying authentication and network already at
work in your organization, especially if you are running a Windows 2000 or 2003 domain. The
SSRS security model has three important components:
• Data encryption
• Authentication and user access
• Report audits
The goal in this chapter is to meet the challenge of effectively setting up and testing each
of these security components in your SSRS deployment. We will show how to do this through
our experience using SSRS to meet HIPAA compliance.
When we first decided to incorporate SSRS into our business, we knew we would have to
deploy it in two environments: the first is an internal deployment to a secure intranet site for
our employees, and the second is as an application service provider (ASP) to our Internet cus-
tomers who use our health-care application via a hosted Terminal Services connection. Though
each model requires unique security considerations, which we will discuss in the “Exploring
Deployment Models” section, fundamentally our three security checkpoints—authentication,
encryption, and report auditing—apply to both environments.
249
C H A P T E R 9
■ ■ ■
4983ch09.qxd 10/7/05 11:14 AM Page 249

C H A P T E R 9
■
S E C U R I N G R E P O RT S
250
When we decided to deploy SSRS to our clients, it was not without much consideration
and testing. We had already determined, through the beta test cycles with Microsoft, that the
report design aspects of SSRS met our needs. But until we could actually deploy and monitor
the access and execution of the reports we would be rewriting for our health-care application,
we could not be certain we would be able to deploy for each of our required models.
Further, we knew that at some point we may alter our then-current model, which required
all our clients to have their own Windows domain accounts. With SSRS, where the default
authentication method is Windows authentication, we realized we could remove this require-
ment. This would open the possibility of allowing Internet reporting, where users could access
reports from their browser or other custom forms we provided. If we had to require every user
to have a Windows account, this would be impossible, or at least more difficult to administer.
Knowing that SSRS offered an extendable security model, we were aware that we could go
forward with our plans to incorporate the default Windows security model into our application,
and when and if we decided to, we could create our own authentication.
Encrypting Data
When working with confidential data of any kind, the chief concern is that the only people
who can see that data are those who need to see it and who have been specifically granted
permission to see it. This is especially true of patient identifiable (PI) data, as defined by
HIPAA, with which we as a software development company had to be concerned. We’ll start
with the first of the three main challenges we defined as crucial to a successful, secure deploy-
ment of SSRS: data encryption.
Introducing Encryption
In today’s mixed-technology networked environment, data encryption comes in many varieties.
However, regardless of the technology, the encryption algorithms must meet a high standard
for complexity and reliability. Fortunately, many applications provide built-in levels of encryp-
tion. SSRS natively supports encrypting the data it stores in the ReportServer database and
configuration files. Companies may have the following other technologies in place that can be
used in conjunction with SSRS encryption:
• Wireless: Uses Wireless Encryption Protocol (WEP), with shared keys to encrypt data
transmitted through wireless access points.
• IIS: Uses a server certificate, generally from a trusted authority such as VeriSign, to
provide encryption over Secure Sockets Layer (SSL). SSL is used when transmitting data
with HTTPS instead of HTTP.
• Terminal Services: Uses Remote Desktop Protocol (RDP) for connecting remotely from
a client workstation to a terminal server. This provides four levels of data encryption in
Windows 2003 with Service Pack 1: Low, Client Compatible, High, and FIPS Compliant.
• VPNs: Allows accessibility to internal networks from VPN client systems. Encapsulates
and encrypts Point-to-Point Tunneling Protocol (PPTP) and Layer 2 Tunneling Protocol
(L2TP).
• IPSec: Is the standard security protocol for Transmission Control Protocol/Internet
Protocol (TCP/IP) traffic. This adds several layers of security, including data encryption.
4983ch09.qxd 10/7/05 11:14 AM Page 250

C H A P T E R 9
■
S E C U R I N G R E P O RT S
251
In our health-care application’s two deployment scenarios for SSRS, we utilize several of
the encryption technologies listed here. In the Internet-hosted deployment model, for exam-
ple, we use both SSL and Terminal Services encryption. For the internal deployment, on an
intranet server, we set up a VPN solution, configured a wireless access point to encrypt data
packets transmitted to and from wireless devices, and also provided SSL pass-through from
a Microsoft Integrated Security and Accelerator (ISA) server.
Securing Network Traffic Using SSL
In the following sections, we will show how to set up the SSRS server to use SSL. By having an
SSL server certificate installed on the server, all data transferred between the client applica-
tion (which can be a browser or custom application) and the report server will be encrypted.
This is essential when transmitting confidential data such as PI information over the Internet.
Having a certificate from a trusted authority such as VeriSign or Thawte also ensures that the
registered domain name used to access the Web server has been validated and can be trusted
to be from the legitimate company that it claims to be from.
Before we show how to install the certificate on the SSRS server, we will cover what data is
being transmitted at the packet level to your SSRS server through HTTP requests. In this way,
when you do actually install the certificate, you will be able to compare the data packets before
and after installation to verify that the certificate is working as it should. To begin, we will show
how to use a tool that is included with most versions of Windows, Network Monitor.
Analyzing HTTP Traffic
Network Monitor is a packet analysis utility that allows you to capture all the data packets
transferred to and from the target server and client. The version of Network Monitor that
comes with Windows is unlike other network capture tools, such as the version of the same
tool included in Systems Management Server, in that it can listen to traffic that is destined
only for the machine on which it is executed. Network Monitor is not installed with Windows
by default, though. You can add it post-installation through the Add/Remove Programs applet.
In this applet, select Add Remove Windows Components and then Management and Monitoring
Tools. Next click Details, and then select Network Monitoring Tools.
On the SSRS server, we will show how to launch Network Monitor from Administrative
Tools. If more than one network interface card (NIC) is installed on your machine, as in our
case, make sure you select the card on which you will be testing. Figure 9-1 shows the main
screen of Network Monitor and the traffic that it is capturing on the network, including broad-
casts and local packets. Network Monitor can be daunting to the uninitiated, as it was designed
to be used by network administrators who have more than a cursory understanding of network
protocols.
4983ch09.qxd 10/7/05 11:14 AM Page 251
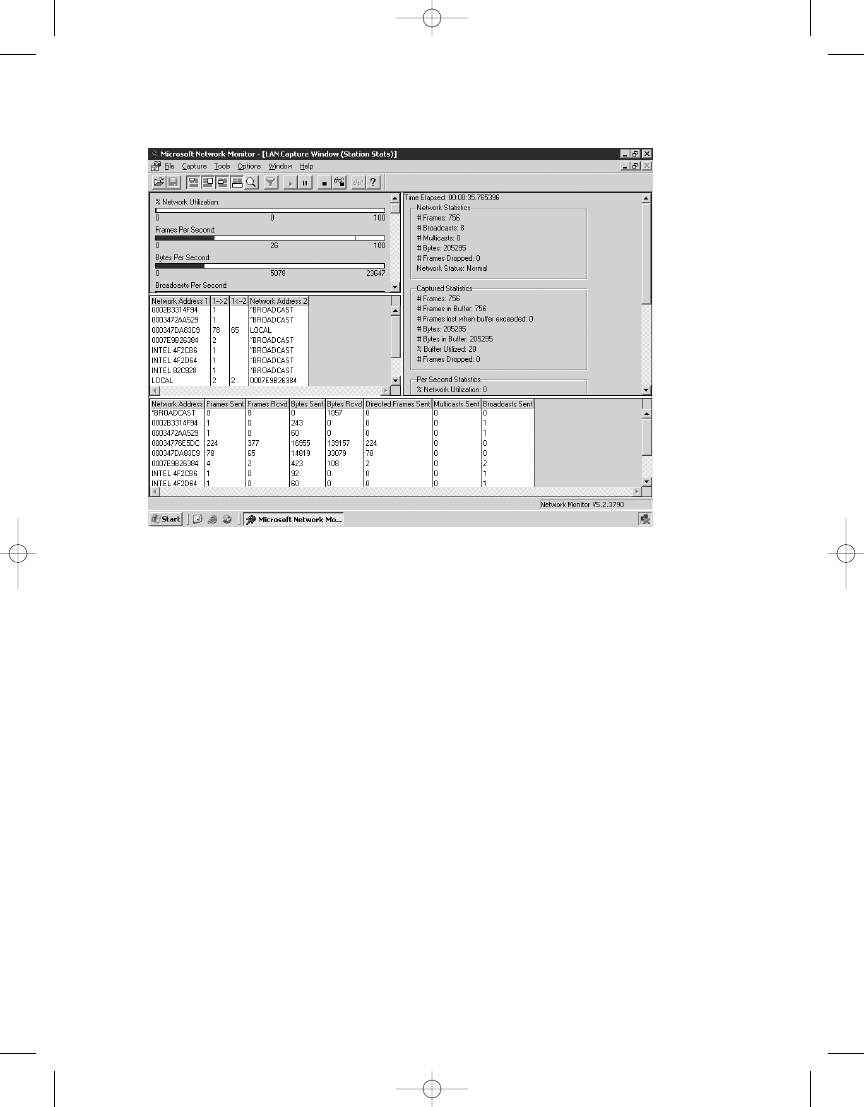
C H A P T E R 9
■
S E C U R I N G R E P O RT S
252
Figure 9-1.
Network Monitor
You can filter out any unwanted traffic, which we will cover in this section because we will
be showing how to capture data through a Remote Desktop session that sends a steady stream
of RDP frames on ports 3389 and 3381; for our health-care example, we want to see only HTTP
traffic on port 80. We could actually go to the server’s console to run Network Monitor, which
would preclude capturing unwanted RDP frames, but that would require leaving our office
chairs and thus interrupt our sedentary lifestyles that have been exacerbated—or should we
say enhanced?—by the creation of the remote administration features of Windows. So, we will
lazily apply a filter.
You could, for example, define a capture filter that uses a pattern match in the data packet
to limit the results of the capture. Alternately, you could capture everything and then configure
a display filter to limit the results. In this case, it is worth the effort of setting up a capture filter
to exclude RDP traffic. To do this, you must know two important values, the pattern and the
offset. The pattern is a hexadecimal value that represents the port numbers, 3389 or 3381. The
offset is the location pointer of the pattern in the frame. You can glean both of these values by
running a capture with no filters applied. In Figure 9-2, you can see a frame that has a source
port of 3389 (OD3D in hex) and the offset location. You can use these values, as well as the val-
ues for port 3381, to now exclude all RDP traffic and then open Report Manager from your client
machine and navigate to your reports to capture SSRS-specific traffic.
4983ch09.qxd 10/7/05 11:14 AM Page 252
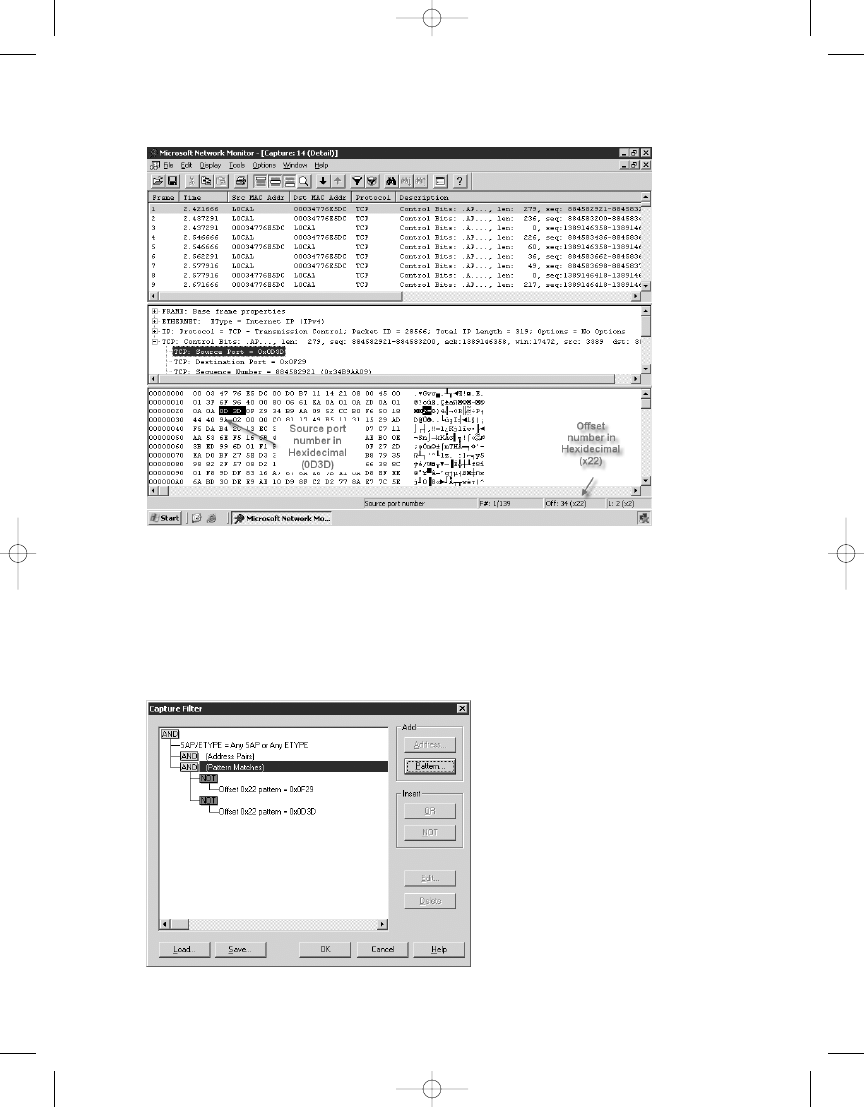
C H A P T E R 9
■
S E C U R I N G R E P O RT S
253
On the Network Monitor toolbar, click the Edit Capture Filter button. In the Capture Filter
dialog box, click Pattern and enter your pattern for port 3389 as a hexadecimal value, 0D3D.
For the offset, enter a value of 22, and leave From Start of Frame checked. Next, because you
want to exclude these frames, select each pattern, click Not to add the exclusion to the tree,
and then click OK, as shown in Figure 9-3.
Figure 9-2.
Offset and pattern location
Figure 9-3.
Capture Filter properties
4983ch09.qxd 10/7/05 11:14 AM Page 253
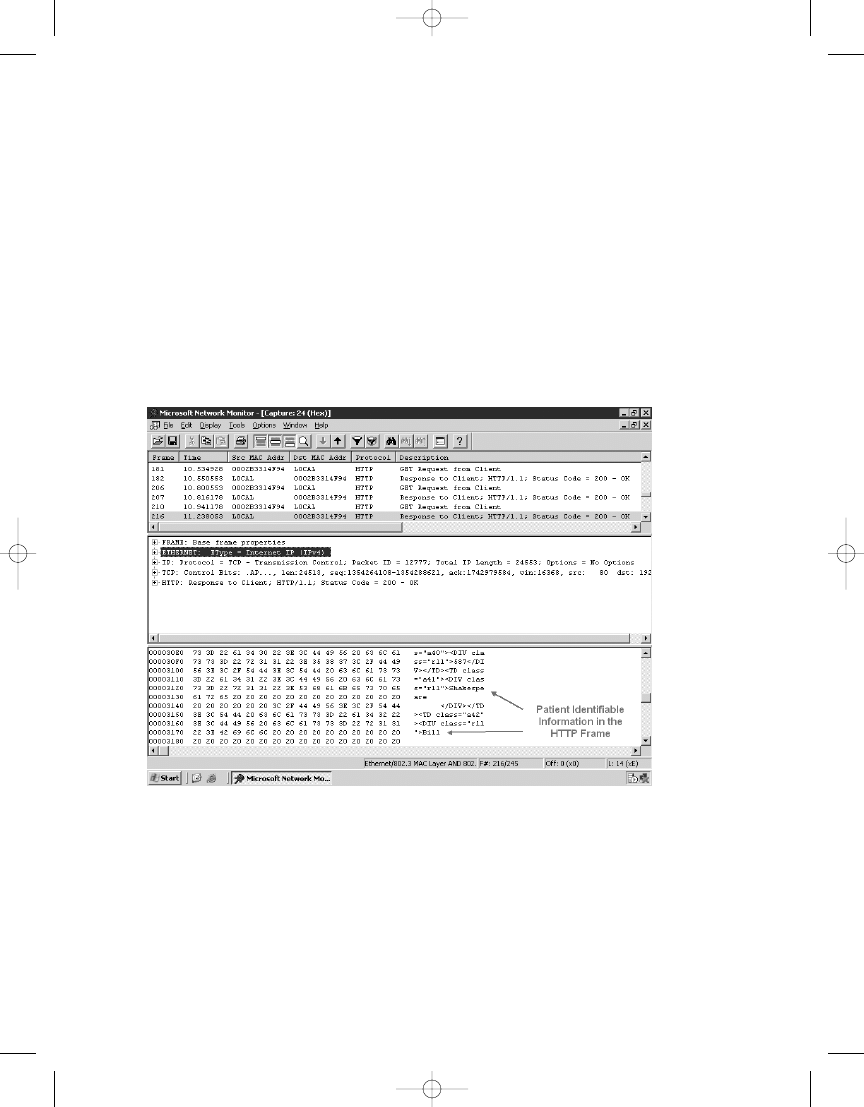
C H A P T E R 9
■
S E C U R I N G R E P O RT S
254
Now, click the Start Capture button, and let the capture run as you view a report with
Report Manager. You will want to make sure you access a report that could have identifiable
information in it. The Employee Service Cost report that you have been working with does, so
you can use it for this purpose. You are concerned not only with capturing user login informa-
tion potentially passed in a URL but also with any information that may identity a patient. If
this is the case, and you allow access to the report over the Internet, you would have a serious
problem and be out of compliance with HIPAA regulations.
After executing the report, analyzing the captured frames reveals the disturbing news.
You can see the name of one of the patients (whose true identity has been altered to be Bill
Shakespeare) returned directly in an HTTP frame, as clearly shown in Figure 9-4. In this case,
you have not analyzed other types of traffic, such as SQL requests on port 1433, to see whether
other protocols are potentially sending plain-text information, but you can use the same tool
to do that.
Figure 9-4.
PI data captured
4983ch09.qxd 10/7/05 11:14 AM Page 254

C H A P T E R 9
■
S E C U R I N G R E P O RT S
255
■
Tip
Though we will not cover the steps to configure SQL Server itself to encrypt network traffic, as we will
be doing with IIS, it is important to mention that SQL Server uses SSL as well, and that by having a certificate
installed, you can easily configure SQL Server to transmit encrypted data. A minimal performance hit is
associated with encryption.
Applying the SSL Certificate
Now it is time to apply a certificate to the SSRS server and rescan the traffic to make sure the
viewable data in clear text will be encrypted.
Several companies provide server certificates that can be installed on a Web server and
verified directly over the Internet from the trusted site that issued the certificate. By using the
certificates issued from these trusted sources, such as VeriSign, the client will automatically trust
the site. Other certificates, such as those generated through Certificate Services in Windows,
may require that the certificate be installed on the client machine, because the client will not
automatically trust the certificate if it cannot reach the certificate authority. Generally, for
Internet use, it is more practical to pay the fee to use the commercial certificate. The online
deployment uses a server certificate issued from a commercial certificate authority. However,
for the temporary test environment, you can use SelfSSL, a handy little utility that comes with
the IIS 6.0 Support Tools. You can download SelfSSL from the following location:
http://www.microsoft.com/downloads/details.aspx?FamilyID=56fc92ee-a71a-4c73-b628-➥
ade629c89499&displaylang=en
SelfSSL will generate and automatically apply a temporary certificate to a Web site. You
run SelfSSL from the command line on the server on which you want to add the certificate.
Once installed, you can open a command prompt for SelfSSL by clicking Start ➤ All Programs
➤ IIS Resources ➤ SelfSSL. The typical syntax will be in the following format:
Selfssl.exe /N:CN=HWCVS26 /V:20 /T
The /N:CN=HWCVS26 option indicates that the common name on the certificate will be the
name of the server (HWCVS26). The /V:20 portion indicates that the certificate is valid for ten
days. The /T option instructs SelfSSL to add the certificate to the Trusted Certificates list so
that the local browser will automatically use the certificate when connecting to the site. You
can manually install a local copy of the certificate on other client machines that will access
this server. Because SelfSSL installs the certificate that it generates, you don’t need to go through
the process of generating a certificate request, which would normally be sent to a commercial
certificate authority. You can view the installed certificate in IIS Manager. To do this, right-click
the default Web site, select Properties, and then click the Directory Security tab. Next, select
View Certificate. As you can see in Figure 9-5, the certificate is good for twenty days and is
issued to the test server, HWCVS26.
4983ch09.qxd 10/7/05 11:14 AM Page 255
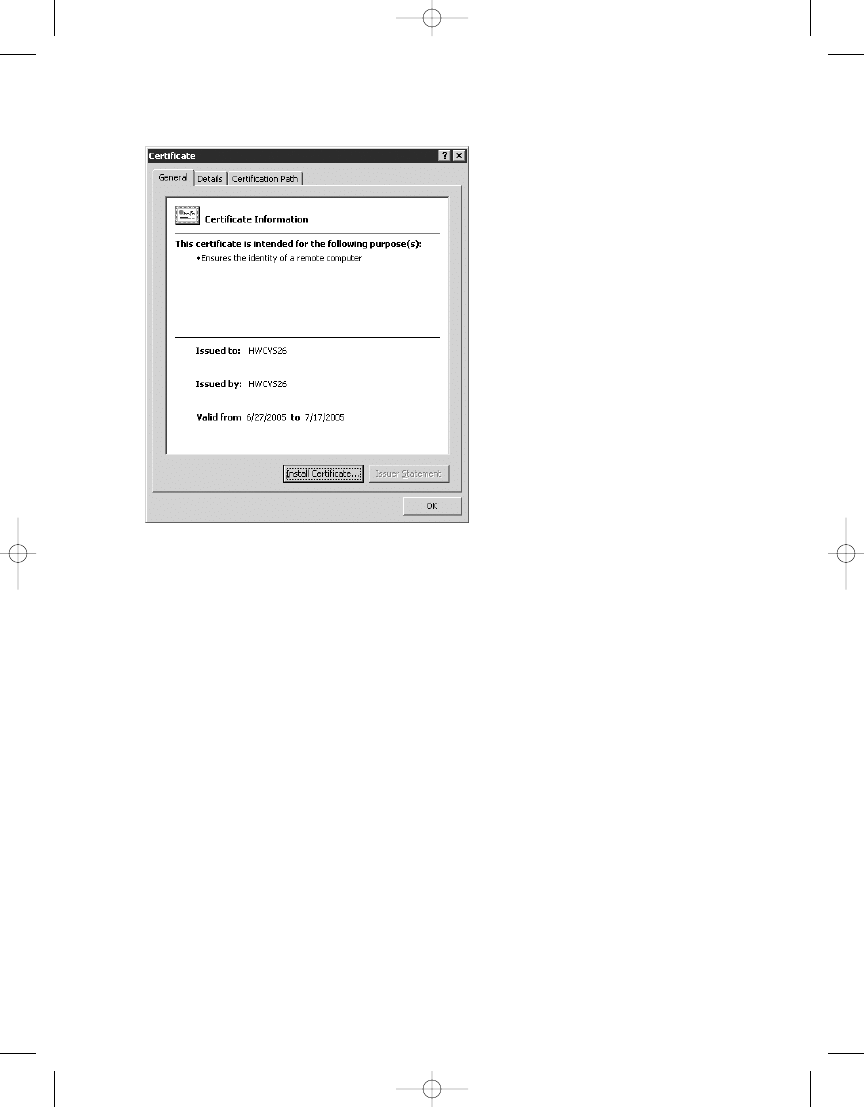
Capturing HTTPS Traffic
Now that you have the certificate installed, let’s return to Network Monitor and capture running
the reports, this time using https in the URL to the report server on HWCVS26, which instructs
the browser to connect to the site with SSL on port 443, instead of HTTP on port 80.
The first thing you’ll notice when you navigate directly to the report is a warning that the
certificate has not passed all the criteria to be trusted because it does not come from a known
certificate authority (see Figure 9-6).
C H A P T E R 9
■
S E C U R I N G R E P O RT S
256
Figure 9-5.
SelfSSL-assigned certificate
4983ch09.qxd 10/7/05 11:14 AM Page 256
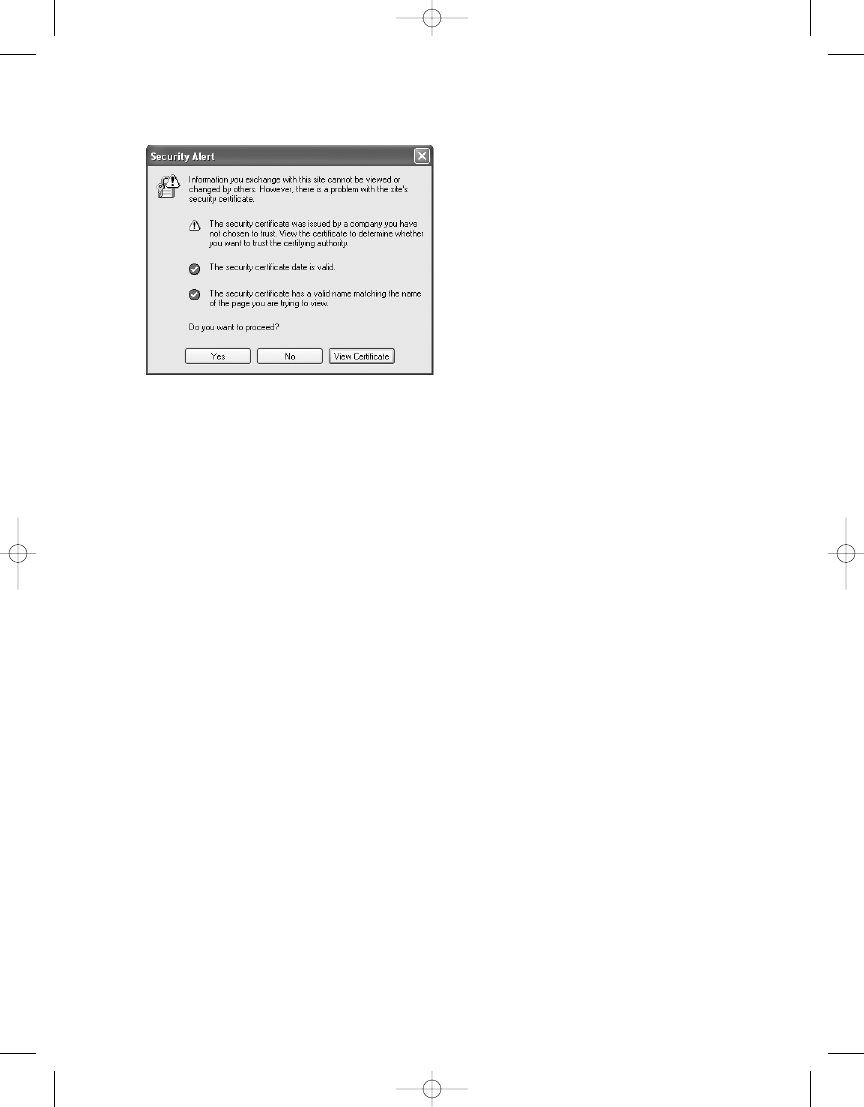
C H A P T E R 9
■
S E C U R I N G R E P O RT S
257
You can select Yes to continue because you do indeed trust the site. You could also
install the certificate on the local machine by clicking the lock at the bottom of the browser
and selecting Install Certificate so that you will not be prompted with this message again.
Installing the certificate in the local client’s certificate store causes the browser to automatically
trust the site. These steps are not required for known certificate authorities such as VeriSign
but are required for this self-assigned certificate.
At this point, because the instance of the report server is still at the default security level,
which does not require SSL, you can access Report Manager with either HTTP or HTTPS. You
can control the required level of security in a few ways. During installation, for example, if you
had a certificate installed already on the default Web site for IIS, you could configure SSRS to
use SSL initially. Because you waited to configure your report server’s required security con-
nection level until after installation, either you can now use the Report Server Configuration
Manager mentioned in the previous chapter, or you can manually set the security level in the
rsreportserver.config
file.
To configure the security using the Report Server Configuration Manager, select Start ➤
SQL Server 2005 ➤ Configuration Tools. Once connected to the report server instance, select
Report Server Virtual Directory, and check the box requiring SSL connections, as shown in
Figure 9-7. When the changes are applied, the report server will now require SSL connections
to execute reports.
Figure 9-6.
Warning for nontrusted security certificate
4983ch09.qxd 10/7/05 11:14 AM Page 257
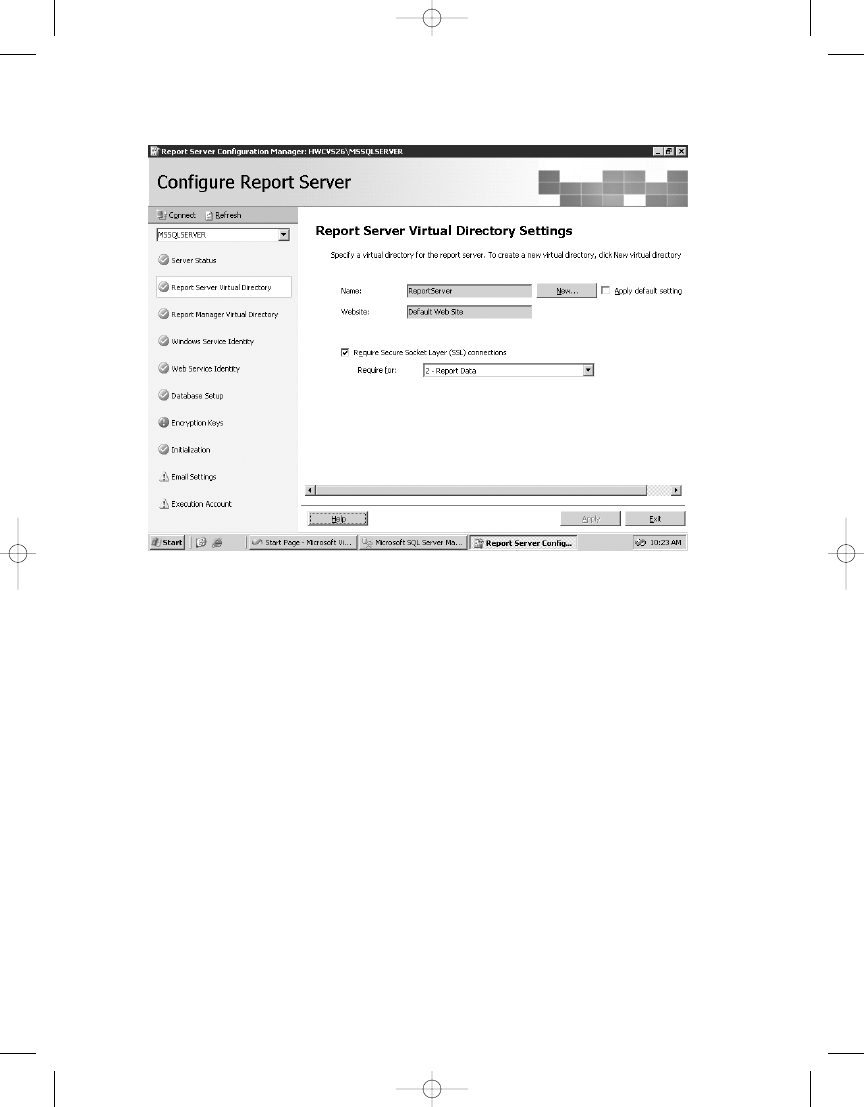
You can also control the level of security that SSRS will use via the service config file,
rsreportserver.config
, located in the installed folder, typically DriveLetter:\Program Files\
Microsoft SQL Server\MSSQL.3\Reporting Services\ReportServer
. Open the file in Notepad,
and look for the following entry:
<Add Key="SecureConnectionLevel" Value="0"/>
Four values control the level of security, 0 through 3. The default for a deployment that
does not configure SSRS for SSL during installation is 0, which is the least secure. A value of 3,
the most secure, requires every SOAP API call to use SSL. For this example, set the value to 2,
which will require encryption of all report data. All calls to the server will now automatically
use port 443 and encrypt the data, including the URL string itself, which is important if you
are passing any confidential information in the URL. If a user tried to connect to the Report
Manager or report server URL using HTTP, the report server would automatically redirect the
client to HTTPS to require a secure connection.
When you capture the frames in Network Monitor, you can see that all the previous HTTP
frames on port 80 are now using SSL on port 443, as shown in Figure 9-8.
C H A P T E R 9
■
S E C U R I N G R E P O RT S
258
Figure 9-7.
Report Server Configuration Manager
4983ch09.qxd 10/7/05 11:14 AM Page 258
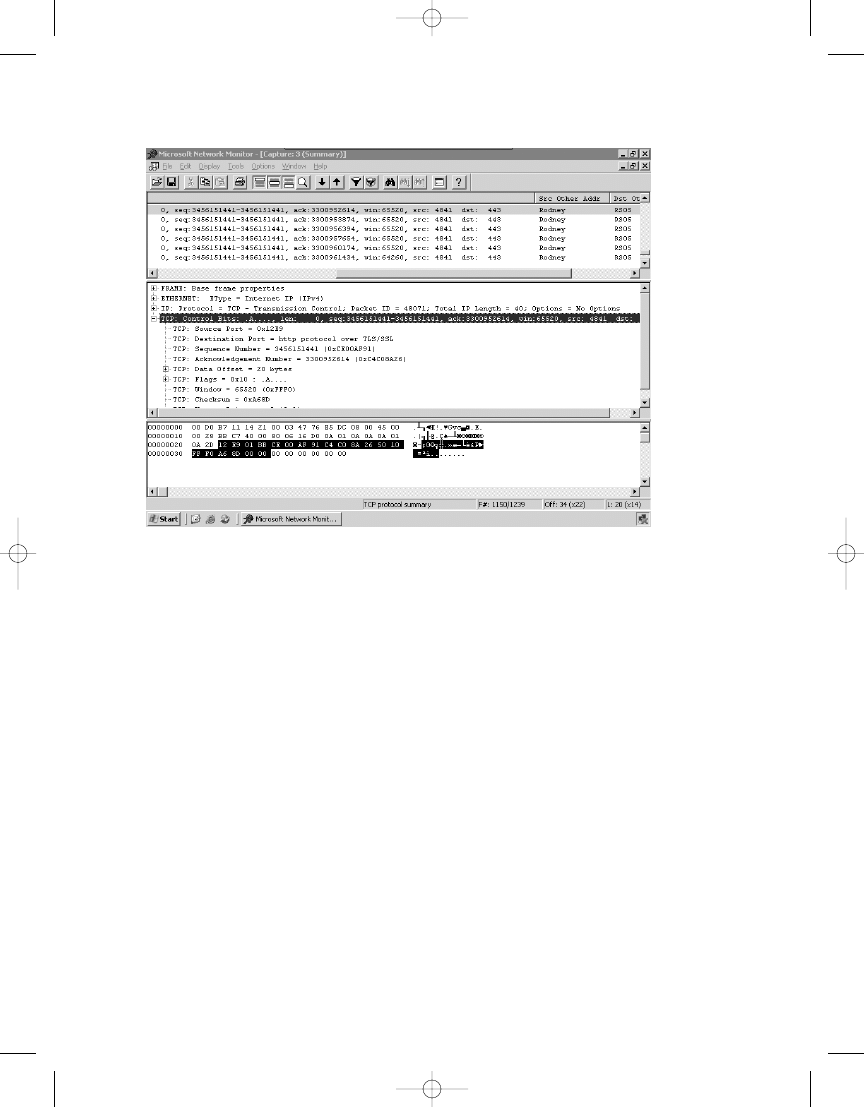
C H A P T E R 9
■
S E C U R I N G R E P O RT S
259
Securing Data Storage in SSRS
While it is important to ensure that network traffic is encrypted, this is only one aspect of main-
taining a secure environment. SSRS requires that sensitive data, such as account information
used for data access, be stored securely. Since this data is stored in different locations, such as
database tables and configuration files, SSRS uses a symmetrical key encryption process to
securely store and access this information. What this means is that the authentication infor-
mation in the database and configuration files is stored in an encrypted format, and SSRS uses
the encryption keys it generates to decrypt the information when needed.
As with many SSRS tasks in SQL Server 2005, multiple tools are available to make configu-
ration changes to the report server. You can manage keys with the Report Server Configuration
Manager as well as a command-line utility called RSKeyMgmt. You can use either of these tools
to back up the keys associated with the report server instance so that if something were to occur
that caused the server to have to be rebuilt, you could reapply the keys to the installation. The
encryption keys are generated when SSRS is installed or joins a web farm. Figure 9-9 shows the
RSReportServer.config
file, which contains sensitive authentication credentials required to
connect to SSRS server components. Notice that several pieces of data inside the file are encrypted.
SSRS uses the keys associated with the report server instance to decrypt the contents of this file
as well as the encrypted content stored in the ReportServer database.
Figure 9-8.
Network Monitor with encrypted packets
4983ch09.qxd 10/7/05 11:14 AM Page 259
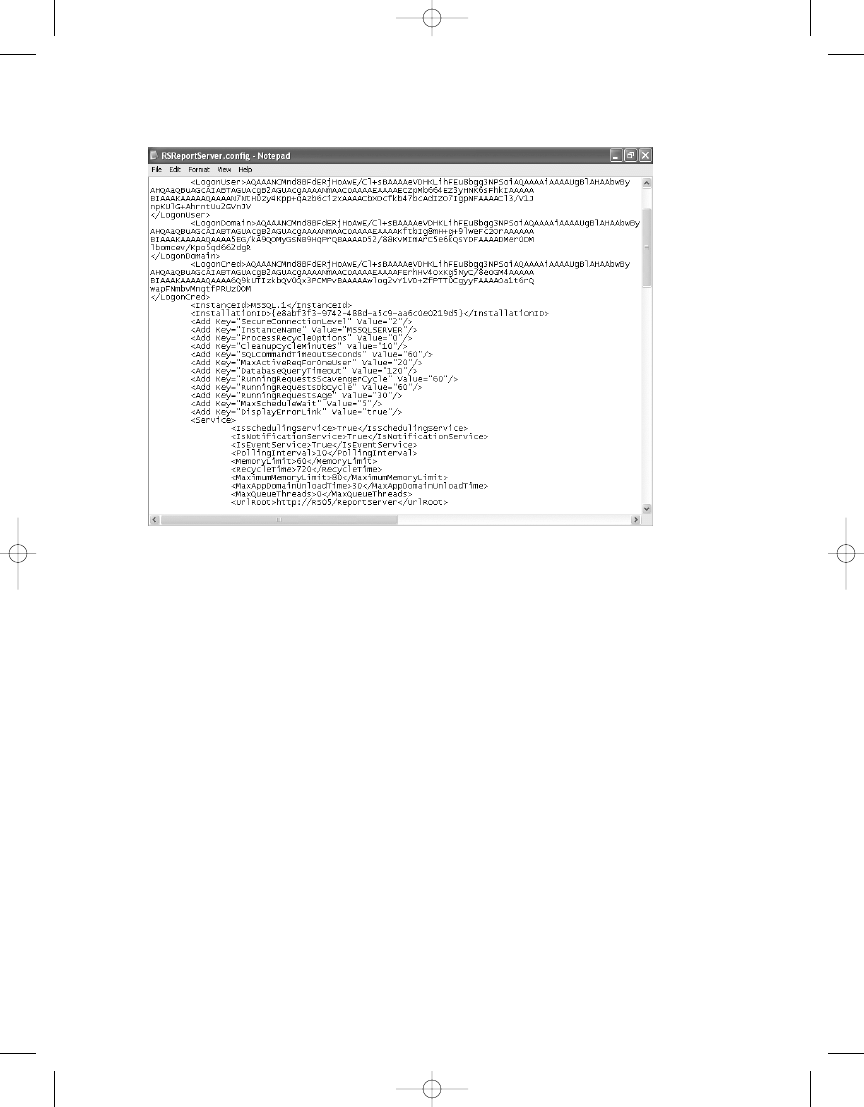
We will show how to use both tools, the Report Server Configuration Manager and the
RSKeyMgmt
utility, to extract the key for the HWCVS26 SSRS installation.
First, open the Report Server Configuration Manager, click Find to locate and connect to
your report server instance (called MSSQLSERVER by default), and then click the Encryption Keys
icon on the left. You will see four options on the Encryption Key page: Backup, Restore, Change,
and Delete. You can back up the encryption key to a key file and supply a password, as shown
in Figure 9-10. This file should be stored in a secure location. If the report server ever had to be
rebuilt for any reason—because of a hard drive failure, for example (and we’re ashamed to admit
this happened to an important test machine of ours)—then having this key is crucial to restor-
ing the ReportServer database to its previous state. Without the key file, it is still possible to
restore and initialize the ReportServer database from backup. However, all objects that require
encryption, such as data sources with stored account information, must be reset manually,
which could be an arduous task at best.
C H A P T E R 9
■
S E C U R I N G R E P O RT S
260
Figure 9-9. rsreportserver.config
encrypted values
4983ch09.qxd 10/7/05 11:14 AM Page 260
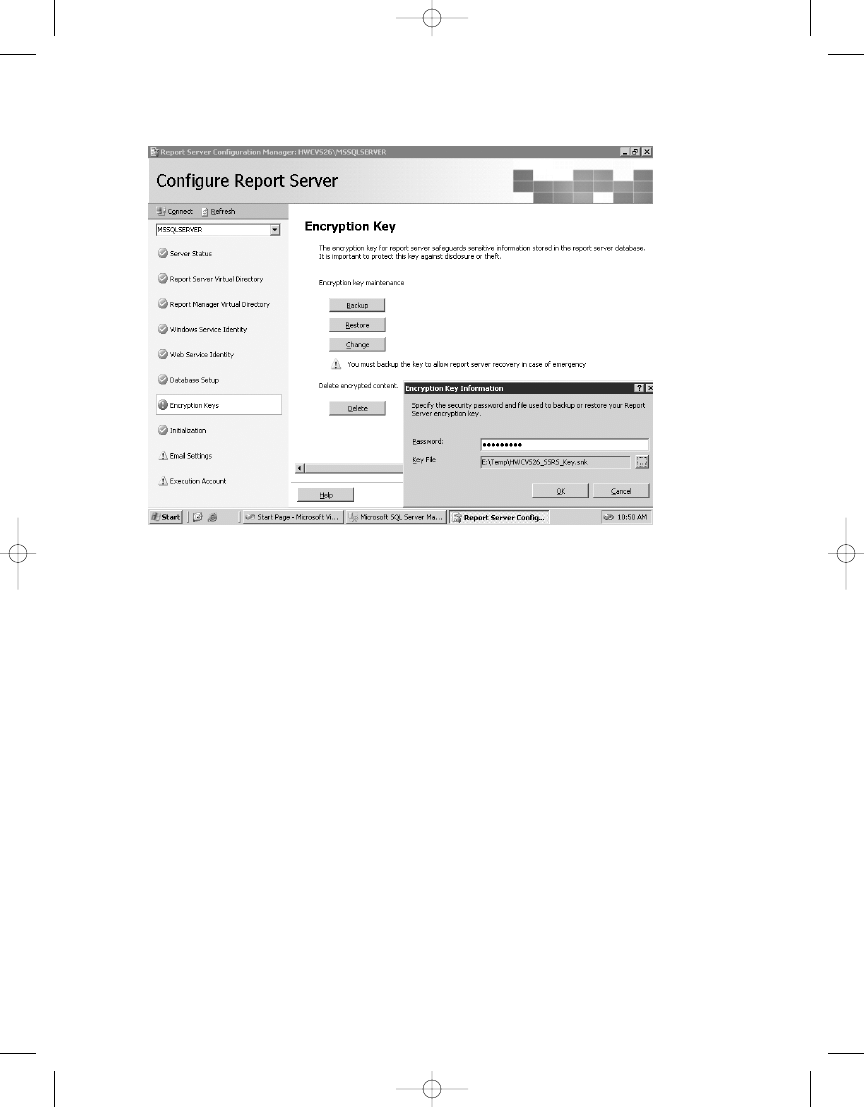
C H A P T E R 9
■
S E C U R I N G R E P O RT S
261
To use the command-line tool that will essentially perform the same task of backing up,
restoring, and deleting the encryption keys for the report server instance, the syntax is as follows:
RSKeyMgmt -e -f E:\Temp\HWCVS26_SSRS_Key -P Password
The -e option tells RSKeyMgmt to extract the key to the file HWCVS26_SSRS_Key in the E:\Temp
folder. The password option is required. If you needed, you could reapply the key to the server
using the same command but changing the -e option to -a. After executing the command, you
are timidly instructed to SECURE THE FILE IN A SAFE LOCATION!
Setting Up Authentication and User Access to Data
Access to confidential electronic data, no matter where it resides, begins and ends with user
authentication. Having security users or roles properly configured is critical to a secure deploy-
ment of SSRS. In a Windows 2000 or 2003 domain environment, SSRS can then take advantage
of the authentication provided by Active Directory’s security groups and users. The SSRS admin-
istrator is responsible for configuring SSRS-specific security roles that link to Active Directory
security accounts. In the following sections, we will show how to set up a test Windows account
for an employee who will have limited access to the SSRS report server. We will discuss the
following:
Figure 9-10.
Encryption keys in the Report Server Configuration Manager
4983ch09.qxd 10/7/05 11:14 AM Page 261

• Setting up SSRS roles: SSRS roles dictate what permissions the users will have when
they access the SSRS server. An Active Directory security account, either a group or
a user, is assigned either to one of four predefined SSRS roles or to a new role that the
SSRS administrator may create.
• Assigning SSRS roles: Assignments are the actual SSRS tasks that a user in a specific
SSRS role may perform.
• Configuring and testing permissions for SSRS objects: Each report folder and its objects
maintain individual permissions that can be set at the folder level and propagated to all
children objects or that can be set specifically per object. We will show how to set up
two folders for the test user account and add report objects that are to be secured.
• Filtering reports: It is possible to limit what data is displayed within a report based on
the Active Directory login account that is accessing the report server. You do this by
associating the value returned from an SSRS global collection, User!UserID, with a field
value in the dataset of the report; User!UserID returns the current login account.
• Authenticating data sources: In addition to the Windows login account and SSRS role
assignments, data sources maintain their own authentication properties, which we will
discuss.
• Setting permissions on the data source database objects: You may recall from Chapter 2
that you created a stored procedure, Emp_Svc_Cost, to use with the Employee Service
Cost report but did not assign user-specific permissions. We will show how to assign the
permissions settings in this chapter.
Introducing SSRS Roles
By default, the SSRS Web service installed in IIS uses Windows integrated authentication to
access reports and report content. Windows user or group security accounts stored in Active
Directory must be associated with an SSRS role before they will have access to the SSRS server.
Administrators can assign the Windows accounts to SSRS roles with Report Manager. In the
test scenario for our health-care application, we have setup a test Windows account, named
jyoungblood
, in Active Directory; you will assume jyoungblood is a registered nurse in a health-
care organization who makes home visits to patients.
All the clinical staff, including nurses such as jyoungblood, are associated with security
groups within Active Directory for the domain. So, you will make jyoungblood a member of
the RN security group. In addition to the security group RN, all registered nurses, including
jyoungblood
, will be contained with an organizational unit (OU) inside Active Directory, as
shown in the Active Directory Users and Computers window in Figure 9-11. Though you will
not use OUs when assigning a user or group to a role in SSRS, it is important to note that you
can use OUs to configure Group Policy settings that apply to security as well, such as locking
down the user’s desktop or Internet Explorer.
C H A P T E R 9
■
S E C U R I N G R E P O RT S
262
4983ch09.qxd 10/7/05 11:14 AM Page 262
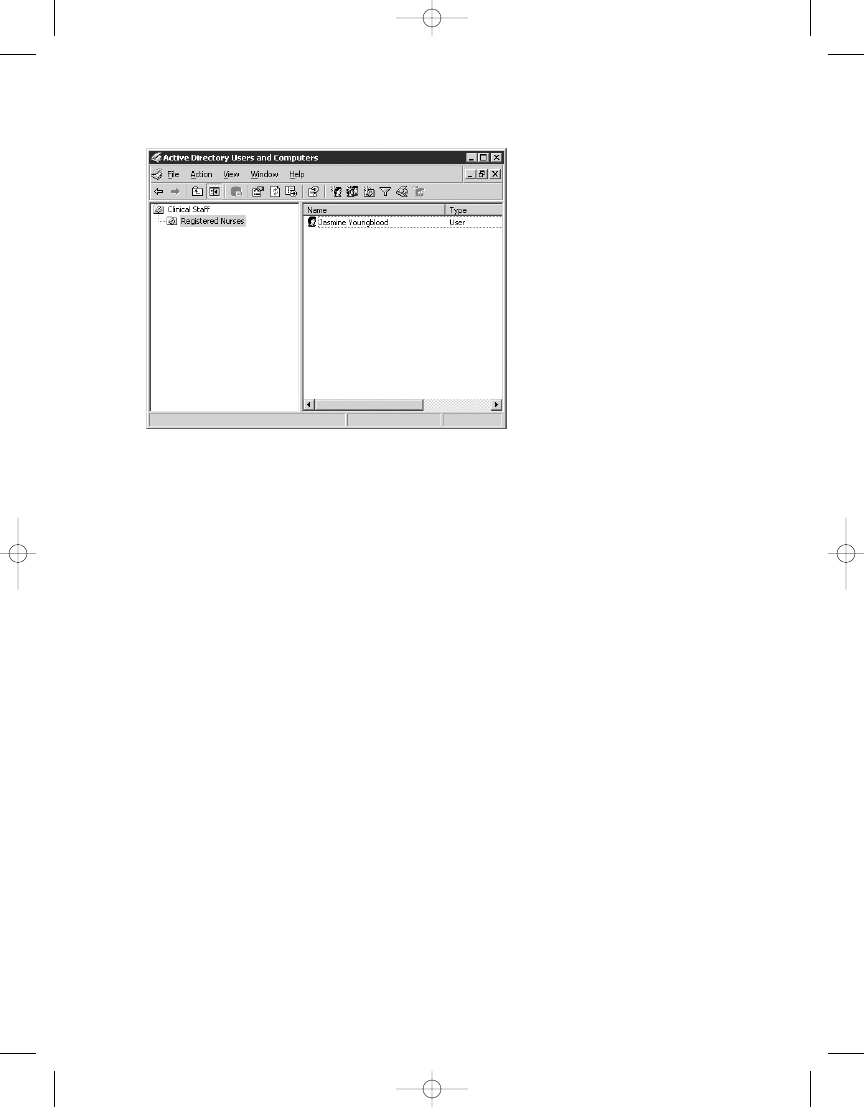
C H A P T E R 9
■
S E C U R I N G R E P O RT S
263
Before assigning the test Windows user to an SSRS role and testing the permissions set-
tings, first look at these five predefined roles:
• Browser: Users assigned to the Browser role may only view reports, folders, and
resources. They may also manage their own subscriptions.
• Content Manager: Administrators are assigned to the Content Manager role by default.
Users assigned to this role can perform every task available for SSRS objects such as
folders, reports, and data sources that they manage.
• My Reports: This is the default role automatically assigned to a user when the My
Reports feature is enabled on the SSRS server, discussed later in this section.
• Publisher: Users assigned to this role have by default enough privileges to publish
reports and data sources to the report server. Typically this role is used for report
authors who work with Report Designer to create and deploy reports.
• Report Builder: The Report Builder role is new to SSRS 2005 and is used primarily for
assigning the required permissions to users who will use the Report Builder application,
which is covered in Chapter 11.
SSRS roles are defined by the tasks that users assigned to each role may perform. SSRS
tasks provide content management permissions and define which SSRS objects are viewable
by the user. Users can perform the following tasks:
Figure 9-11.
Test Windows account in Active Directory
4983ch09.qxd 10/7/05 11:14 AM Page 263

• Consume reports
• Create linked reports
• Manage all subscriptions
• Manage data sources
• Manage folders
• Manage individual subscriptions
• Manage models
• Manage report history
• Manage reports
• Manage resources
• Set security for individual items
• View data sources
• View folders
• View models
• View reports
• View resources
Each predefined role is configured by default, with a specific combination of allowable
tasks. Users assigned to the Publisher role, for example, may manage folders, reports, resources,
models, and data sources as well as create linked reports. To view the allowable tasks for each
role, you can open Report Manager and navigate to the Site Settings page from the Home folder.
On the Site Settings page, click Configure Item-Level Role Definitions. From here you can select
any of the five predefined roles and see the tasks available to each. Figure 9-12 shows the default
tasks available for the My Reports role.
C H A P T E R 9
■
S E C U R I N G R E P O RT S
264
4983ch09.qxd 10/7/05 11:14 AM Page 264
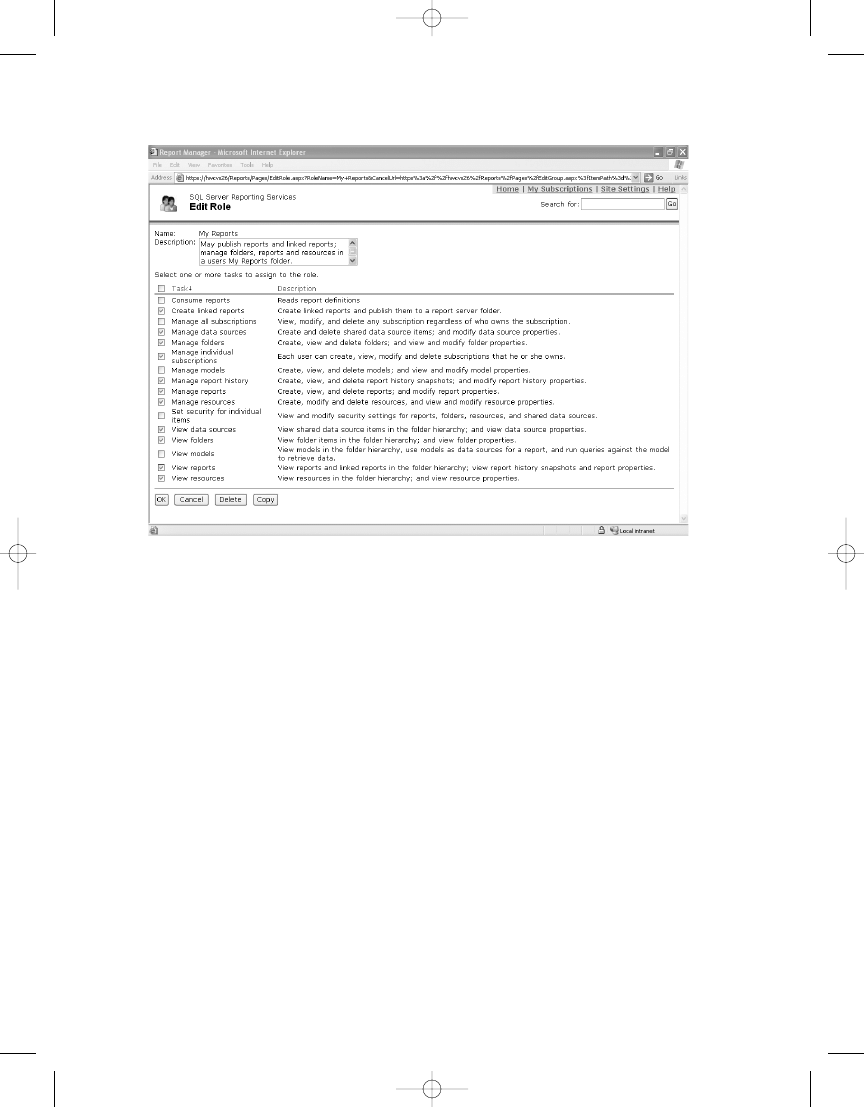
C H A P T E R 9
■
S E C U R I N G R E P O RT S
265
The My Reports feature in SSRS creates individual report folders specific to the Windows
user. My Reports is useful for companies that need to provide a workspace for employees to cre-
ate and manage their own reports. The feature is disabled by default but can be enabled in the
Site Settings area of Report Manager by checking Enable My Reports to Support User-Owned
folders for Publishing and Running Personalized Reports. When it is enabled and a logged-in
user clicks the My Reports link, SSRS creates a folder structure based on the user’s login name
and automatically takes the user to that folder. SSRS also creates a Users Folders folder that
the administrator can use to manage the My Reports folders for each user, as shown in Figure 9-13.
Figure 9-12.
My Reports role task assignments
4983ch09.qxd 10/7/05 11:14 AM Page 265
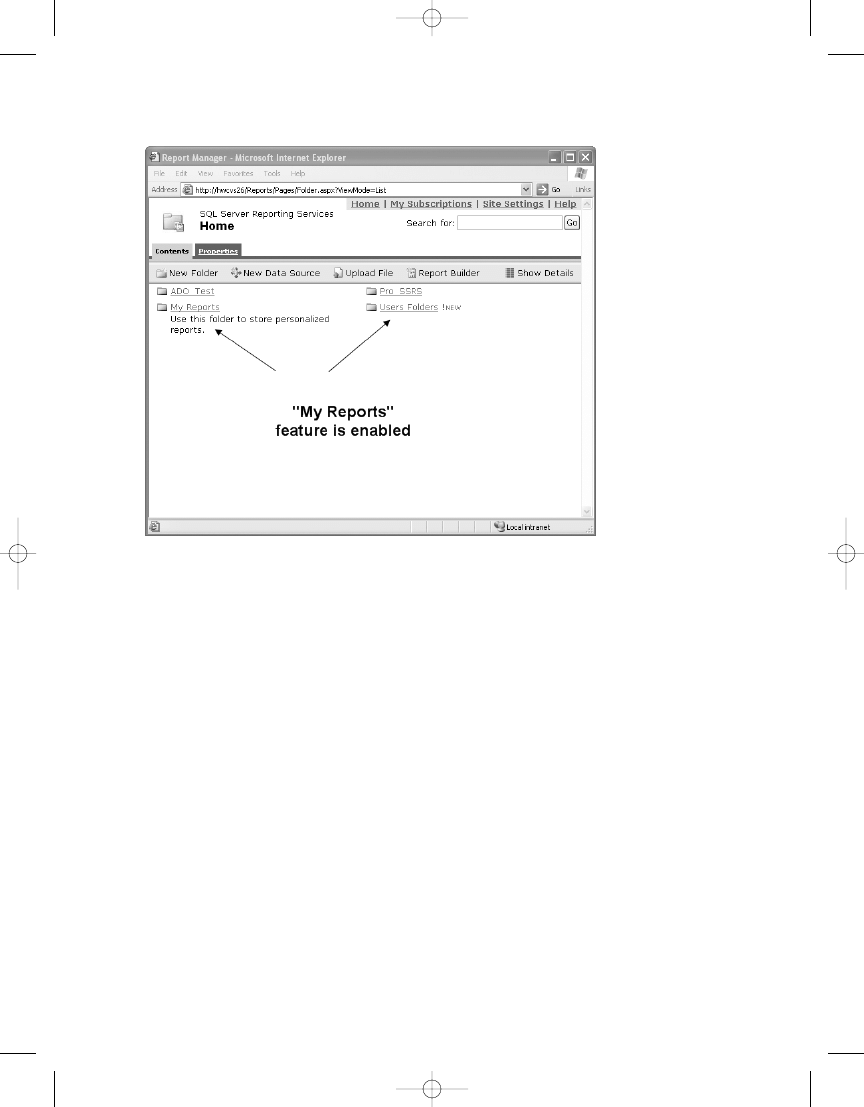
C H A P T E R 9
■
S E C U R I N G R E P O RT S
266
As with many tasks for SSRS, multiple tools are available to accomplish the same result.
In this case, we showed using Report Manager to view the role assignments and view the My
Reports
folder. You can view and configure the same role assignments and folders with SSMS.
Where applicable, we will show both Report Manager and SSMS in this chapter. To enable the
My Reports feature in SSMS, for example, first open SSMS, and then select Reporting Services
as the server type in the Connect to Server dialog box. After successfully connecting, right-click
the server name, and select Properties. On the General tab, as shown in Figure 9-14, the Enable
a My Reports Folder for Each User selection is available. Checking this box will enable the My
Reports feature just as in Report Manager.
Figure 9-13. My Reports
folder
4983ch09.qxd 10/7/05 11:14 AM Page 266
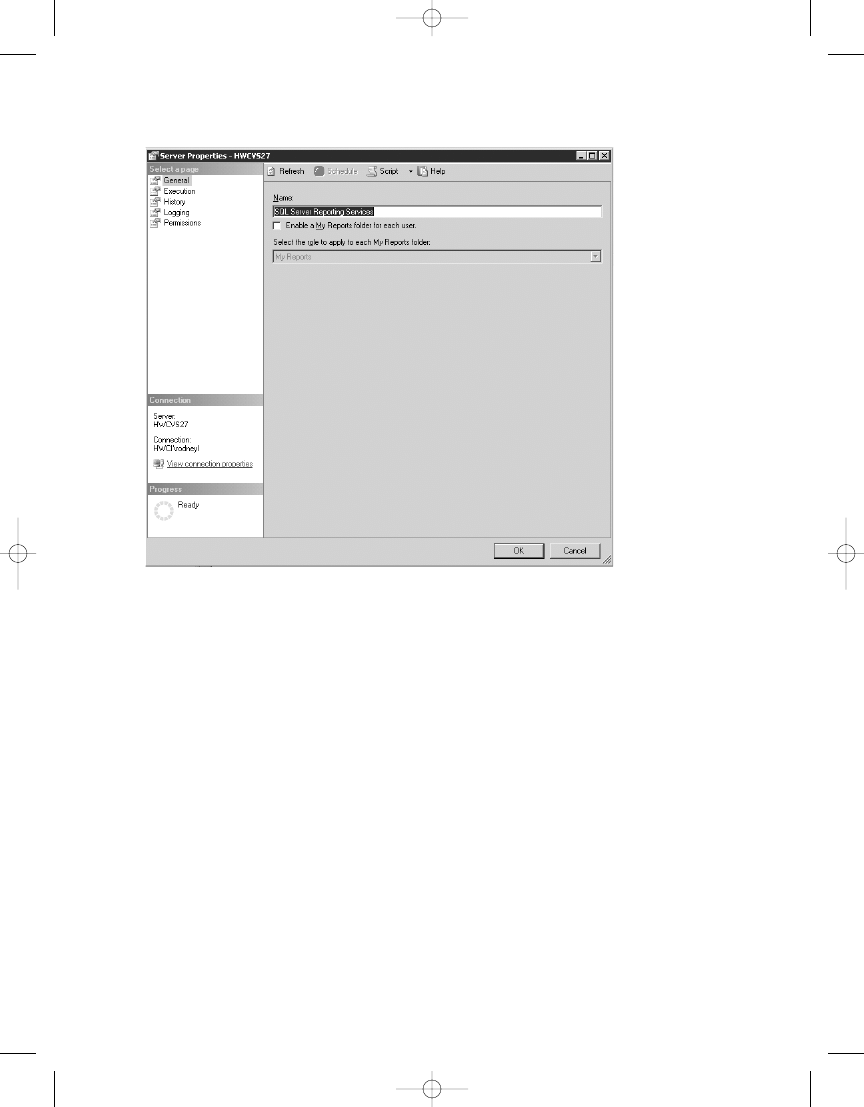
C H A P T E R 9
■
S E C U R I N G R E P O RT S
267
Testing SSRS Role Assignments
In this section, we will go through the process of adding folders and report objects that would
be in line with what nurse jyoungblood would use. You will want to ensure that she will not have
the ability to navigate to other folders and run other reports that may contain confidential
information.
The first step in testing jyoungblood’s access to the reports that have been defined for her
security group, RN, is to publish the reports to a folder on the SSRS server that will contain
reports for registered nurses. As the administrator for the test, open Report Manager, and cre-
ate two new folders, one in the root folder called Clinical Reports and then one inside the
Clinical Reports
folder called Registered Nurse. To do this, simply click New Folder in Report
Manager. Because both of these folders, by default, are inheriting permissions from the parent
folder, which currently is configured for administrator access only, you will alter the permis-
sions manually so that the new folder (and the reports and data source you will add to it) will
maintain its own security settings.
To publish reports to the Registered Nurse folder, you could use any method already
covered, but for this test simply upload a report you have already worked with, Daily Schedule,
and then create a data source called RN_DS for the purposes of testing security. Upload the
report file Daily Schedule.rdl from either Report Manager or SSMS from where it resides in
the Pro_SSRS project. In Report Manager, in the Registered Nurse folder, simply click Upload
SSMS, after connecting to the report server
Figure 9-14.
Enabling My Reports in SSMS
4983ch09.qxd 10/7/05 11:14 AM Page 267
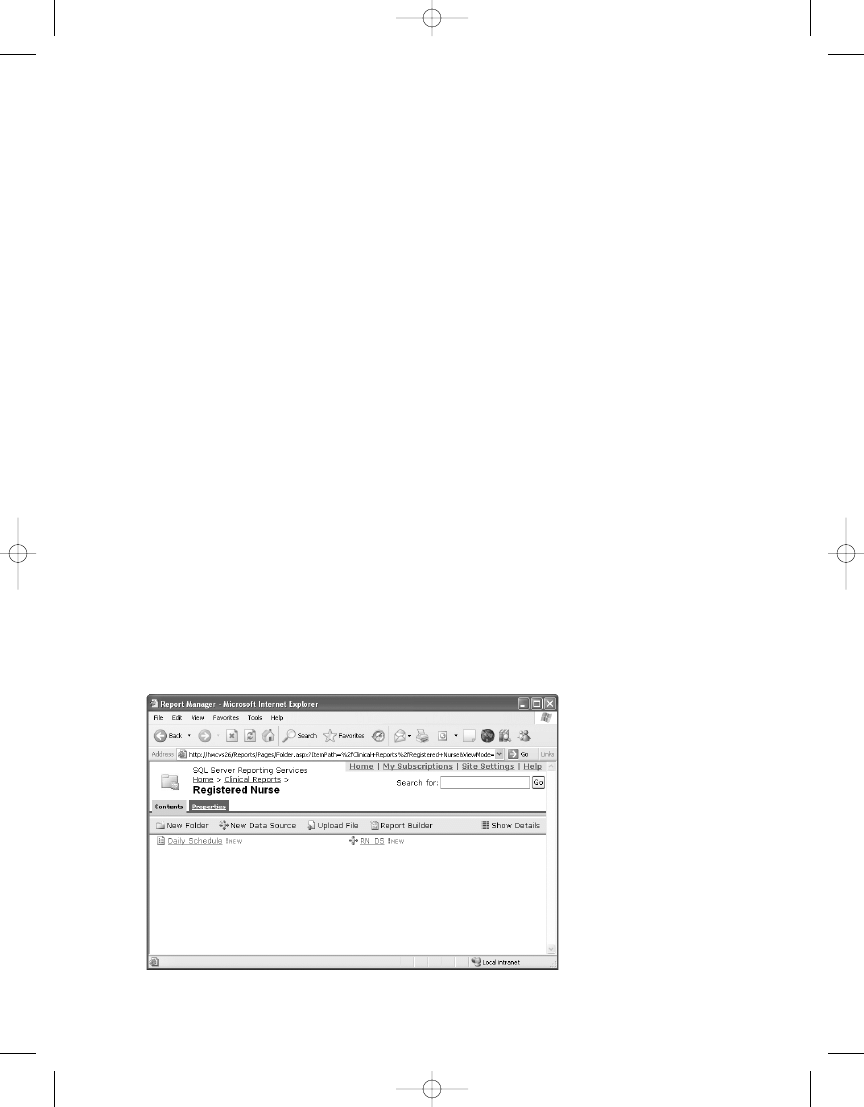
C H A P T E R 9
■
S E C U R I N G R E P O RT S
268
using the Reporting Services type connection, navigate to and right-click the Registered Nurse
folder under Home; then select Import File. You will notice the default selection is for .rdl or
report files. Click the ellipsis to navigate to the Daily Schedule.rdl file, and click Open. Though
it is possible to upload an .rds file or data source file to the report server via Report Manager
and SSMS, neither method will successfully create the actual data source object as such. After
the data source is uploaded, it shows as a link and not as an actual data source. So, you will need
to create the data source manually.
To create the data source manually with Report Manager, simply click New Data Source in
the Registered Nurse folder, name the data source RN_DS, and set the connection string to the
following (replacing localhost, if necessary, with your SQL Server 2005 server name where you
have created the Pro_SSRS database):
Data Source=localhost;Initial Catalog=Pro_SSRS
In this case, you will choose to set the data source authentication method to Credentials
Stored Securely in the Report Server and supply a name and password that will be used to
access the data in the Pro_SSRS database. Assuming that jyoungblood’s Windows account was
granted access to the data source database, you could have selected the Windows Integrated
Security option to pass through the Windows account to the SQL Server 2005 database. You
know that you will configure the report to filter out data that is relevant only to the clinician
jyoungblood
, so you don’t need to be overly concerned with the stored credentials.
Figure 9-15 shows the folder structure and setup of the report objects for the initial test
you will perform. At this point, you have not granted SSRS role assignments to the Windows
account, jyoungblood, or the security group, RN, of which she is a member. The Daily Schedule
report, as you may recall from the previous chapter, provides clinicians with a list of their daily
activities. In a data-driven subscription, where the report can be mailed to the clinicians after
processing, the parameter for the employee’s ID was used to create reports with data unique
to each individual. In this test now, however, you want to allow access to the same report to be
run manually from Report Manager. This poses its own set of concerns, which we will cover as
we step you through the process.
Figure 9-15.
4983ch09.qxd 10/7/05 11:14 AM Page 268
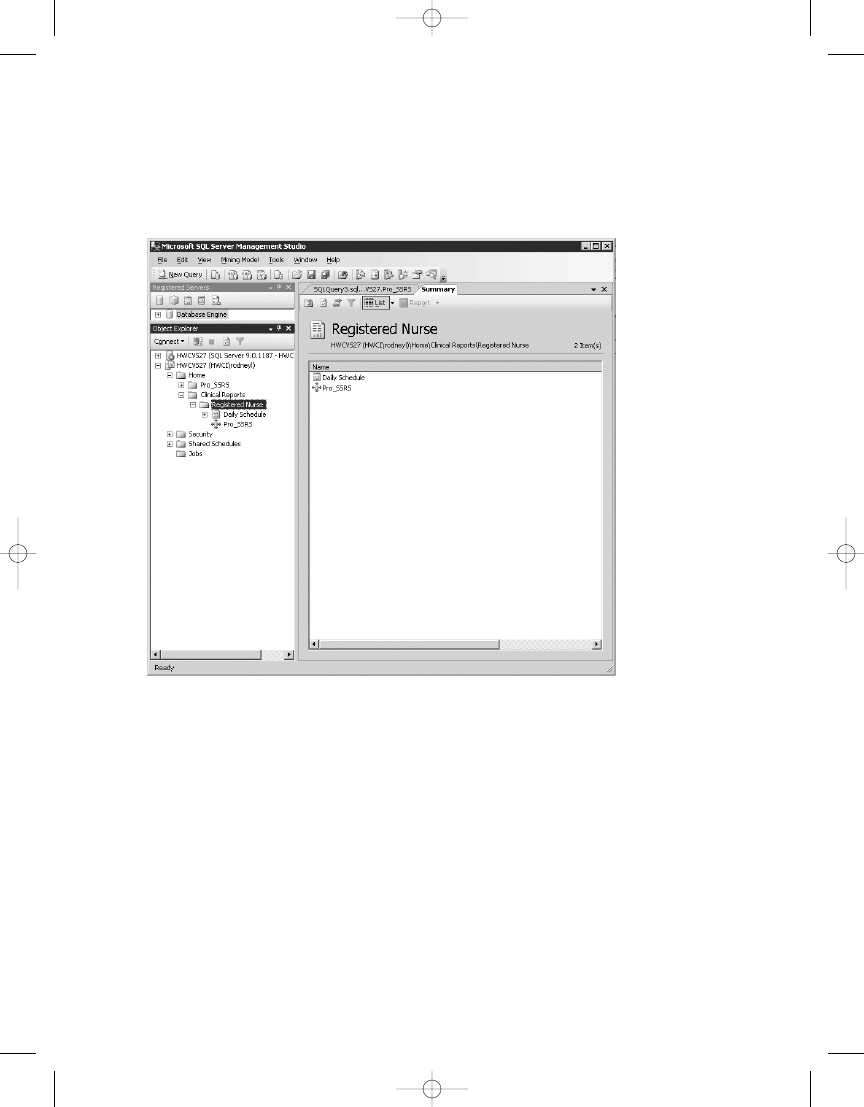
C H A P T E R 9
■
S E C U R I N G R E P O RT S
269
You’ll see the same folder structure in SSMS, which places report server objects, such as
reports and data sources, in a more structured and easily expandable view. Figure 9-16 shows
the SSMS view of the report and data source objects you created in the Registered Nurse folder.
To begin the test, log in as jyoungblood, open your Web browser, and paste the link in the
address bar to the Registered Nurse folder you created previously, as shown here:
http://YourServerName/Reports/Pages/Folder.aspx?ItemPath=%2fClinical+Reports%2➥
fRegistered+Nurse&ViewMode=Detail
You have to paste the link into the browser because the permissions for jyoungblood cur-
rently do not allow navigation to the report directly through Report Manager. As you can see in
Figure 9-17, when you view this link, you receive an error message indicating that the user
does not have permissions to view the resources in the folder.
Figure 9-16.
Report objects in SSMS
4983ch09.qxd 10/7/05 11:14 AM Page 269
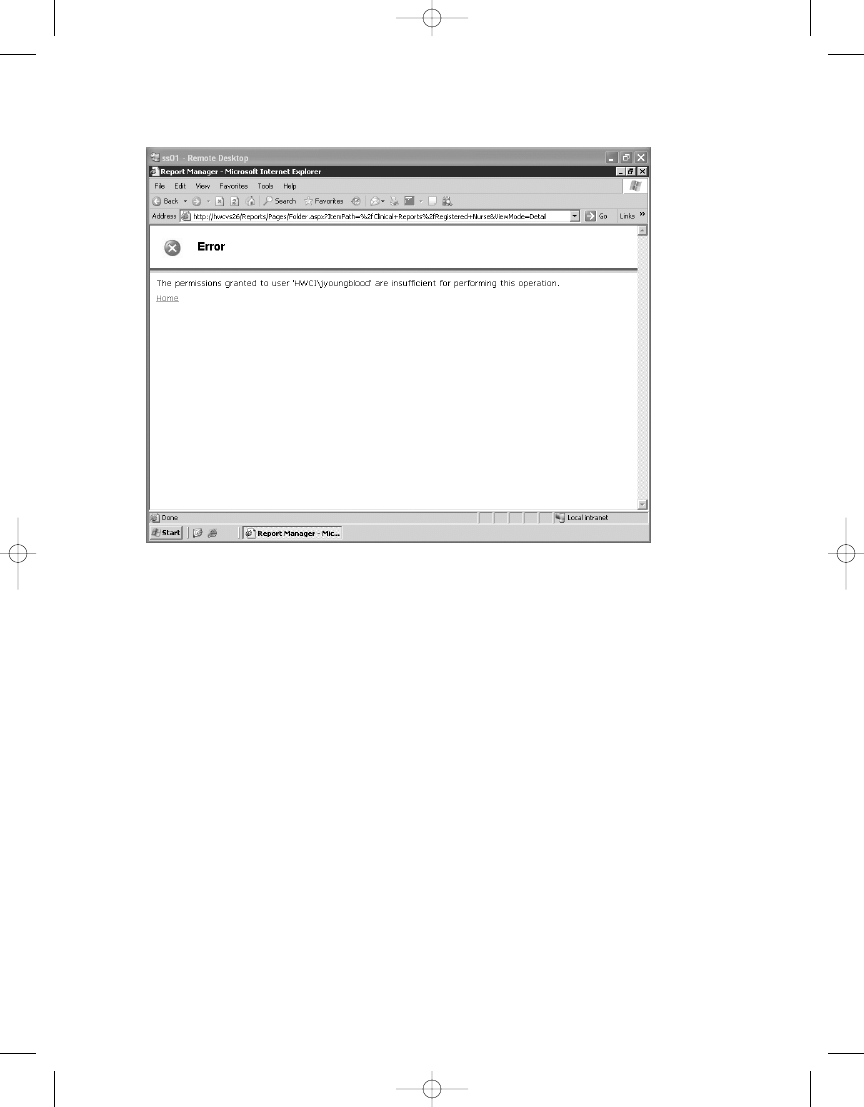
C H A P T E R 9
■
S E C U R I N G R E P O RT S
270
Figure 9-17.
Error message for insufficient permissions
Running Report Manager as an administrator again, you are now going to set the permis-
sions for the test user. You can control security settings on the Property tab for each folder as
well as on individual report items. In this case, you will set permissions at the folder level for
the Registered Nurse folder. Navigate to this folder, click the Properties icon, and then select
Security. As you can see in Figure 9-18, the default security group is BUILTIN\administrators,
which is assigned to the Content Manager role.
4983ch09.qxd 10/7/05 11:14 AM Page 270
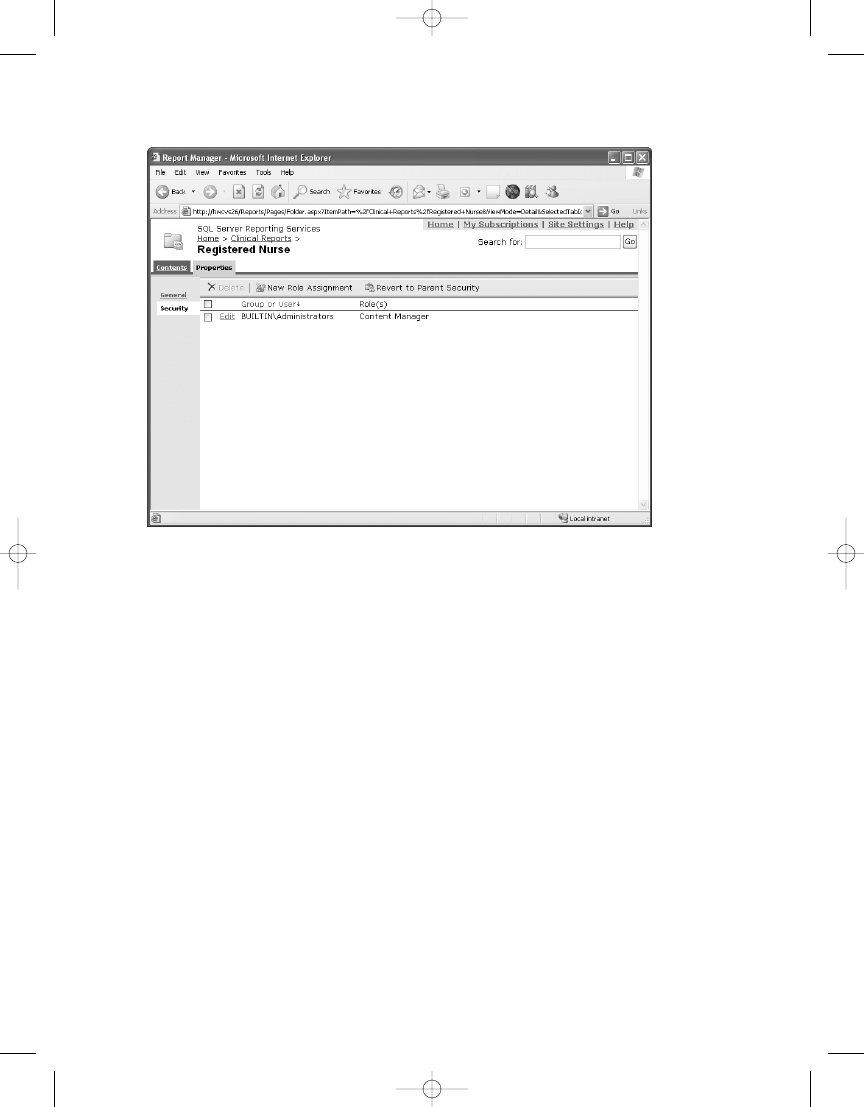
C H A P T E R 9
■
S E C U R I N G R E P O RT S
271
To set permissions for the RN group, click New Role Assignment, and add the RN security
group as the group name on the New Role Assignment form. For the role assignment, choose
Browser, which will allow the users assigned to the RN group to view the Registered Nurse
folder and all its child nodes, to view reports and resources, and to configure their own sub-
scriptions. You can accomplish the same task via SSMS by right-clicking the Registered Nurse
folder in the SSMS report server tree view, selecting Properties, and then clicking the Permissions
link to add the RN security group to the folder.
Now when you access the Registered Nurse folder logged in as jyoungblood, all you see
are the reports that have been deployed to that folder, not the data source. In addition, all the
properties for the objects you can view have limited accessibility and content. If you click the
properties of the Daily Schedule report, for example, you will see only the general properties
information, such as the Creation Date and Modified Date of the Daily Schedule report. By
contrast, an administrator viewing the same properties page would be able to see and modify
other report property settings such as Parameters, Data Sources, Execution, History, and Secu-
rity, as shown in Figure 9-19.
Figure 9-18. Registered Nurse
folder’s default permissions
4983ch09.qxd 10/7/05 11:14 AM Page 271
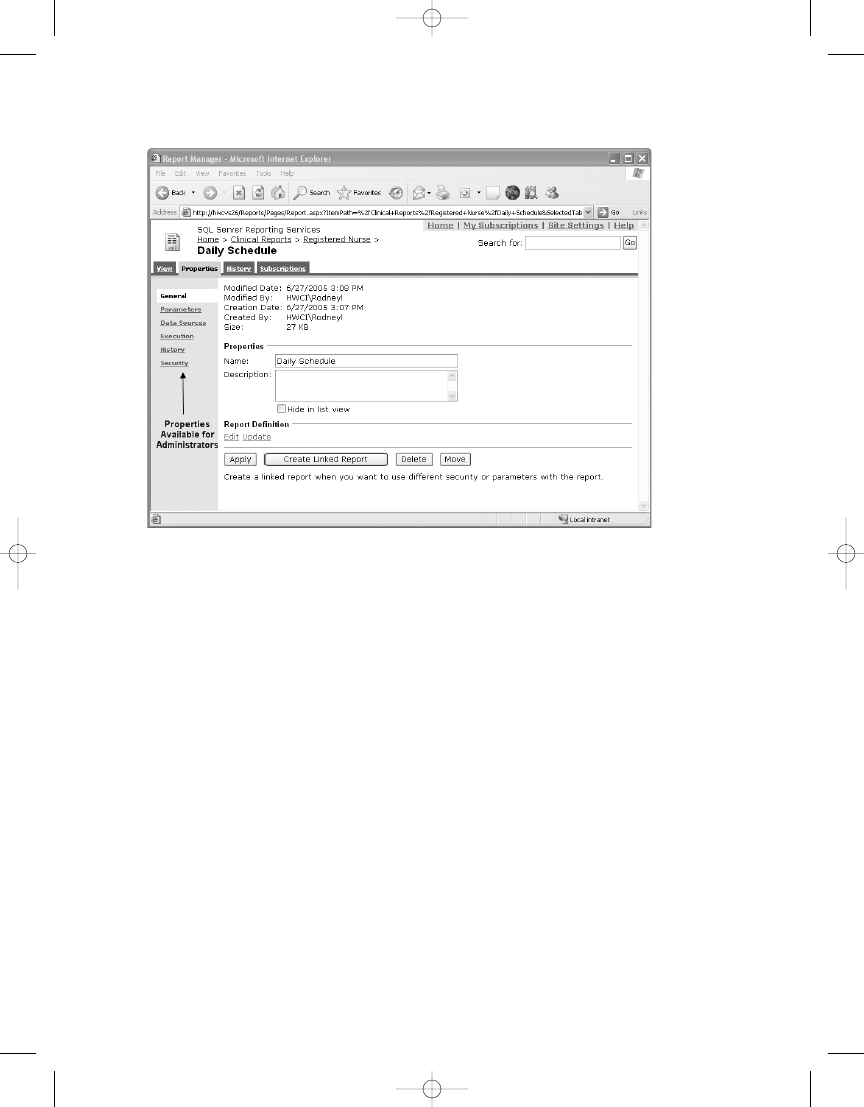
C H A P T E R 9
■
S E C U R I N G R E P O RT S
272
Figure 9-19.
Report properties available for administrator
To complete the test, you will simply execute the Daily Schedule report as jyoungblood.
You have granted permission for the RN Windows security group to inherit the SSRS Browser
role, so you should not have a problem executing the report. The report executes successfully.
However, Figure 9-20 shows one glaring issue—even though jyoungblood has executed this
report, she is seeing other employees’ scheduled visits. Though she would be able to enter an
EmployeeID
parameter value that would limit the data on the report to only her data, she would
still be able to see other employees’ schedules by entering their IDs, assuming she knew what
they were. Though this might be an acceptable practice for many companies, in the next section
we will show how to go a step further to ensure that she will be able to view her schedule only.
4983ch09.qxd 10/7/05 11:14 AM Page 272
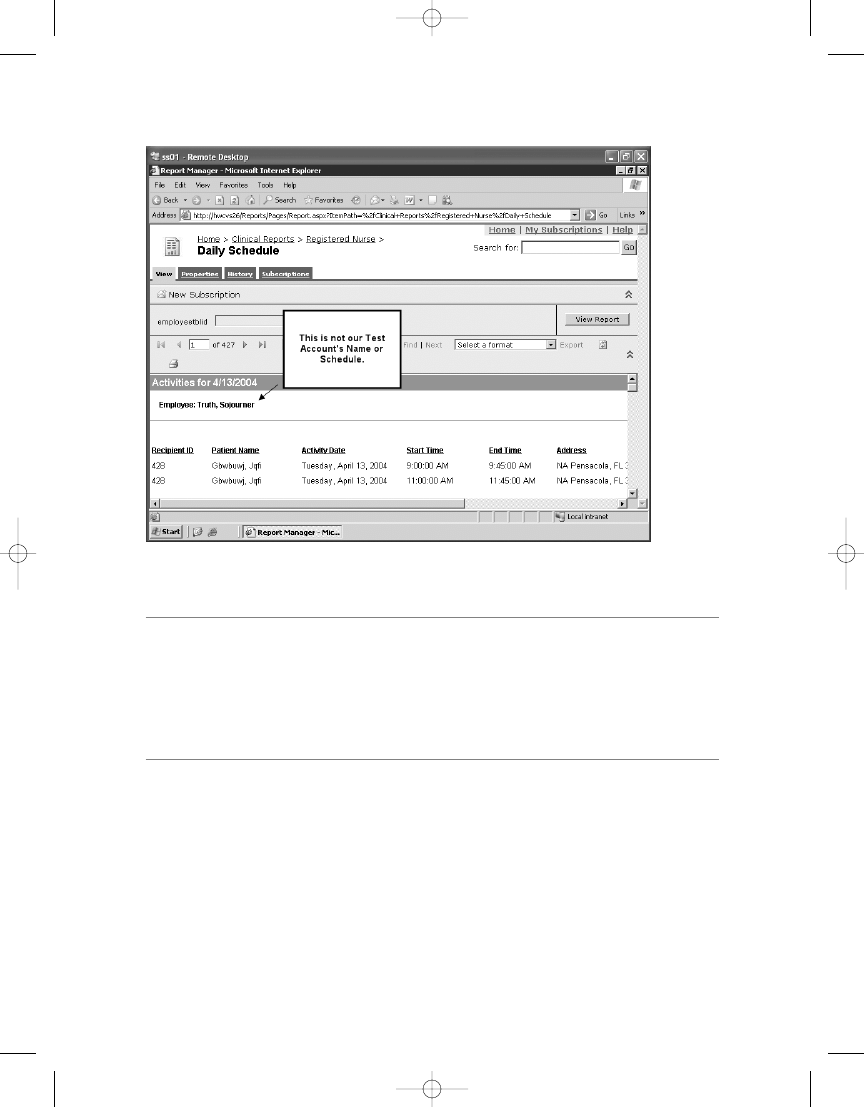
C H A P T E R 9
■
S E C U R I N G R E P O RT S
273
■
Tip
When building a testing environment, a number of available resources can simplify the process. In
our testing, we made extensive use of Remote Desktop Client and the remote administration features of
Windows 2003 Server. Since this would be the environment we would ultimately deploy in—in other words,
Terminal Services—it was beneficial also to see how SSRS would work in this scenario. Microsoft’s Virtual
Server is another advantageous tool for testing, as it allows you to run multiple operating systems simulta-
neously on a single machine.
Filtering Report Content with User!UserID
For the Daily Schedule report, say you have decided that you want the users to be able to view
only their own schedules. SSRS allows you to accomplish this by creating a report filter that uses
the value of the login account for the user executing the report. The login name value is returned
from a global collection in SSRS. You have been using global collections all along—for example,
when you use an expression such as =Fields!FieldName.Value, you are actually returning
a value from the Fields global collection. The global collection that you will use for the report
filter is User, and the value you are interested in is UserID. The expression will therefore be
=User!UserID
.
Figure 9-20.
Test account viewing other employees’ data
4983ch09.qxd 10/7/05 11:14 AM Page 273
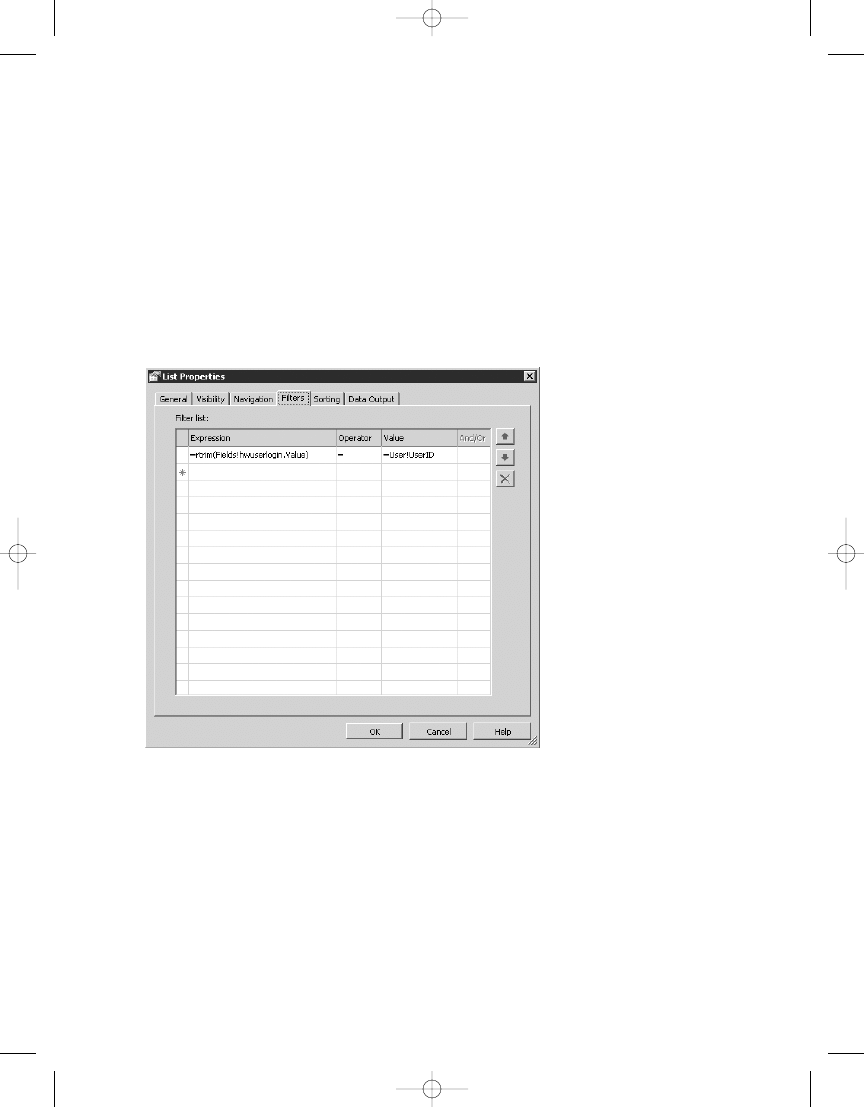
Figure 9-21. UserID
filter for daily schedule report
To use User!UserID in the filter, you will need a field in the dataset that will equal the UserID
value. In the dataset for the Daily Schedule report, you may recall that you have a field called
HWUserLogin
that you can use for this purpose. When compared by the filter, the two values
will be identical—one value delivered with the dataset and the other at execution time of the
report. After the filter is applied, the report will display only those records where the username
of the employee executing the report matches the value of the HWUserLogin field returned with
each record of the dataset.
Unlike parameters, filters cannot be set through Report Manager. To set up a filter, you
will need to modify the report itself, either in the RDL file directly or through Report Designer,
as shown in Figure 9-21. Notice that you can use the RTRIM function to strip off the trailing
spaces; otherwise, the comparison may fail.
Because this report may return several hundred records even though it will filter auto-
matically for each user, it is a good idea to cache the report for ten minutes. Caching, which is
discussed in Chapter 8, will help alleviate the performance hit of requerying the data source
every time a new user accesses the report. When the user jyoungblood executes the report
again, you can see that the schedule now reflects only her schedule, as shown in Figure 9-22.
Also notice that you can choose to employ another new feature of SSRS, and that is to hide the
employeetblID
parameter from the user so users will be unable to select another employee’s
schedule. You can hide parameters during design time by selecting Hidden in the Report
Parameters dialog box or after deployment in Report Manager by selecting Hide on the report
properties page under Parameters.
C H A P T E R 9
■
S E C U R I N G R E P O RT S
274
4983ch09.qxd 10/7/05 11:14 AM Page 274
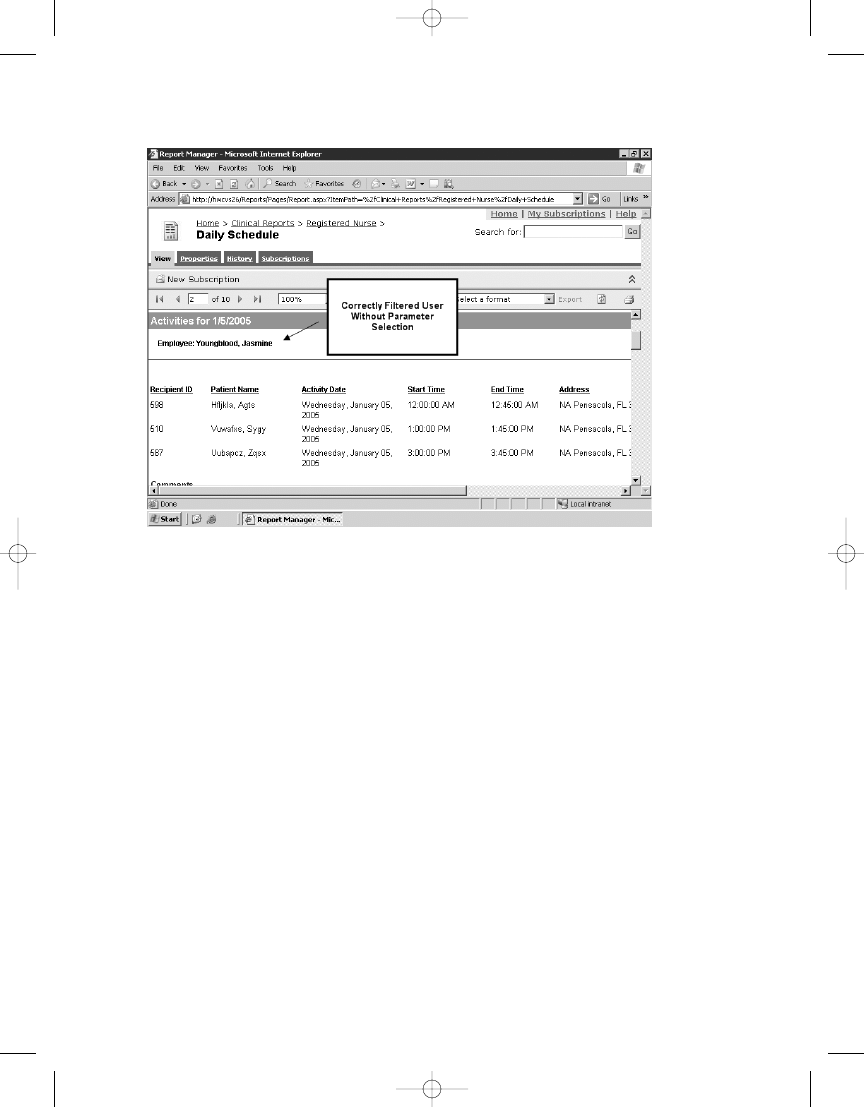
C H A P T E R 9
■
S E C U R I N G R E P O RT S
275
Setting Data Source Security
Once you have deployed the data source to the report server, you can specify its connection
properties. This is an important step because the property settings determine how both the
user and SSRS will connect to the data source. When executing unattended reports—for exam-
ple, for a user subscription—SSRS will control passing authentication credentials to the data
source and must have access to valid authentication credentials.
Four connection options for the data source are available in Report Manager:
• The Credentials Supplied by the User Running the Report: With this option, users are
always prompted to log in to the data source when executing the report.
• Credentials Stored Securely in the Report Server: SSRS uses authentication credentials
stored in the ReportServer database. The sensitive login information is encrypted.
• Windows Integrated Security: This option passes the login information for the current
user to the data source. Don’t choose this option if the data source will be used for unat-
tended installs or if Kerberos is not configured for the Windows domain.
• Credentials Are Not Required: This is the least secure option and is used when the data
source does not require authentication.
Figure 9-22.
Filtered report execution for test user
4983ch09.qxd 10/7/05 11:14 AM Page 275
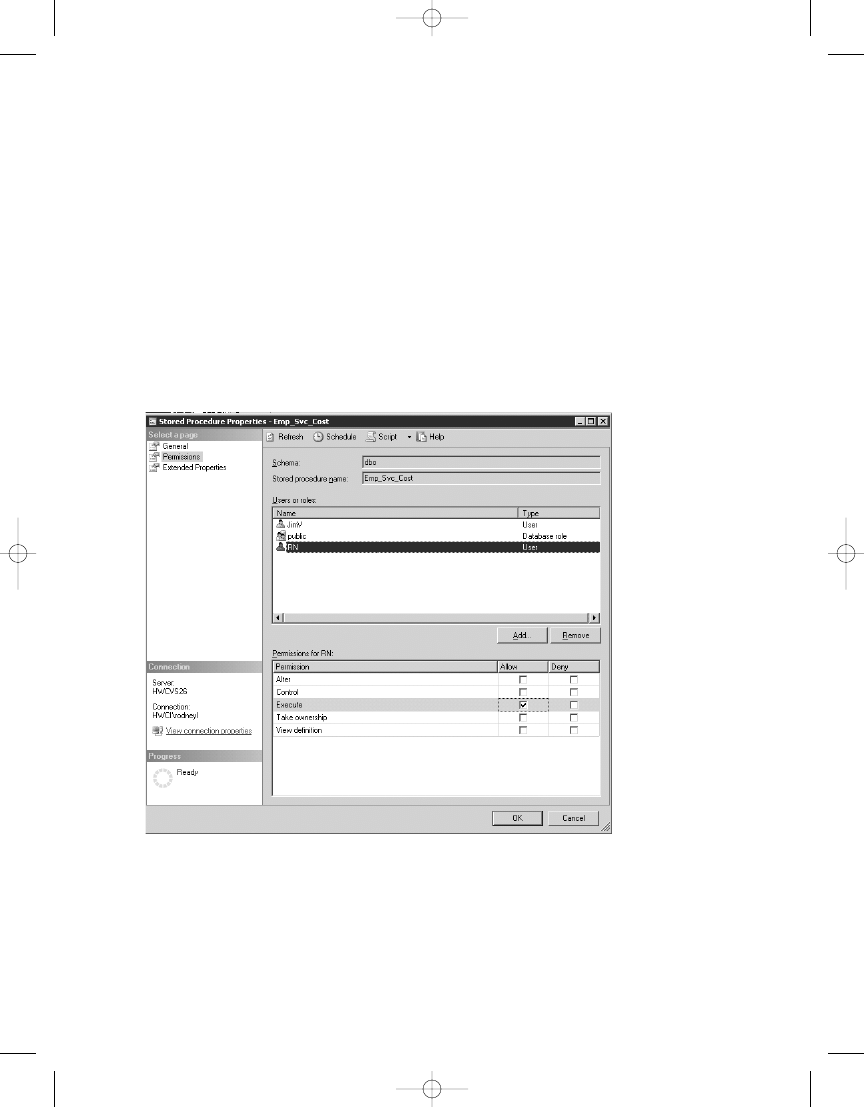
C H A P T E R 9
■
S E C U R I N G R E P O RT S
276
Figure 9-23.
Setting SQL Server stored procedure permissions
Setting SQL Server Permissions
In Chapter 2, when you created the stored procedure called Emp_Svc_Cost, you set the per-
missions to allow public execution while designing the report. The environment you were
working in was otherwise secure, as it was isolated from other networks and there was no fear
of it being compromised.
Now that you are deploying the stored procedure in a production environment, you will
need to lock down the stored procedure as well. You can do this through SSMS by right-clicking
the stored procedure and selecting Properties. Next, click the Permissions page. Uncheck the
Execute checkbox for the public role, and check the Execute checkbox for valid security groups
in the domain, including the RN security group, as shown in Figure 9-23. You do not need to
explicitly grant Execute rights to the test user jyoungblood, as she is a member of the RN security
group.
4983ch09.qxd 10/7/05 11:14 AM Page 276

C H A P T E R 9
■
S E C U R I N G R E P O RT S
277
Auditing Reports
Having the ability to know the details of report execution, specifically for undesired access, is
an essential piece of the security puzzle. In Chapter 8, we showed how to set up the extended
execution-monitoring feature provided with SSRS. Having an audit trail of report execution is
essential for gaining insight into user behavior and possible security breaches.
Introducing SSRS Auditing
In this section, we’ll show how to use the same execution log database, called
RSExecutionLlog
, to audit the following in SSRS:
• Report execution activity: Which user executed which report and when, and whether
a user was denied access to a report because of permissions
• Parameter inputs for reports: Which parameters were entered by a user
The latter is important because even though SSRS contains validation for certain types of
parameters, such as Integer and DateTime, when a report parameter uses a string, it is suscep-
tible to a SQL injection attack. SQL injection attacks are made possible when a Web page or
service takes input from a user or program that could contain injected code that could execute
on the SQL Server machine. These types of attacks can be malicious in nature or cause the report
or page to deliver more data than was intended.
We will show how to use a modified version of the Report Execution Log Report created in
Chapter 8 for performance measuring. In the modified version, you are interested primarily in
report execution for a security audit. You need to know which user executed which report and
when. The generic report shows the user and report name, as well as the times the report was
executed. This report is driven from the same data source, RSExecutionLog, that you have
already used.
We have simply made the report a table instead of a matrix, which was more in line with
the PivotTable analysis for performance. In this modified report, called Report Execution Audit
(which is available in the Pro_SSRS project), you will also include the parameters that the user
has selected.
In Figure 9-24, you can see the times that the selected reports were executed as well as the
parameter name and value that were entered. The user jyoungbloodyoungblood has naughtily
attempted to enter questionable parameter values. In addition to showing how the user inter-
acted with the report via the Parameter field, the Report Execution Audit report also shows from
which machine the report was accessed. Having this level of auditing is a valuable ally in the
struggle to maintain security for confidential information. With HIPAA, it is also necessary
to maintain an audit trail of user access to data. If you are suspicious that someone is accessing
information they are not authorized to view, this report can serve as the audit trail, along with
other normal auditing procedures such as the Windows event log.
4983ch09.qxd 10/7/05 11:14 AM Page 277
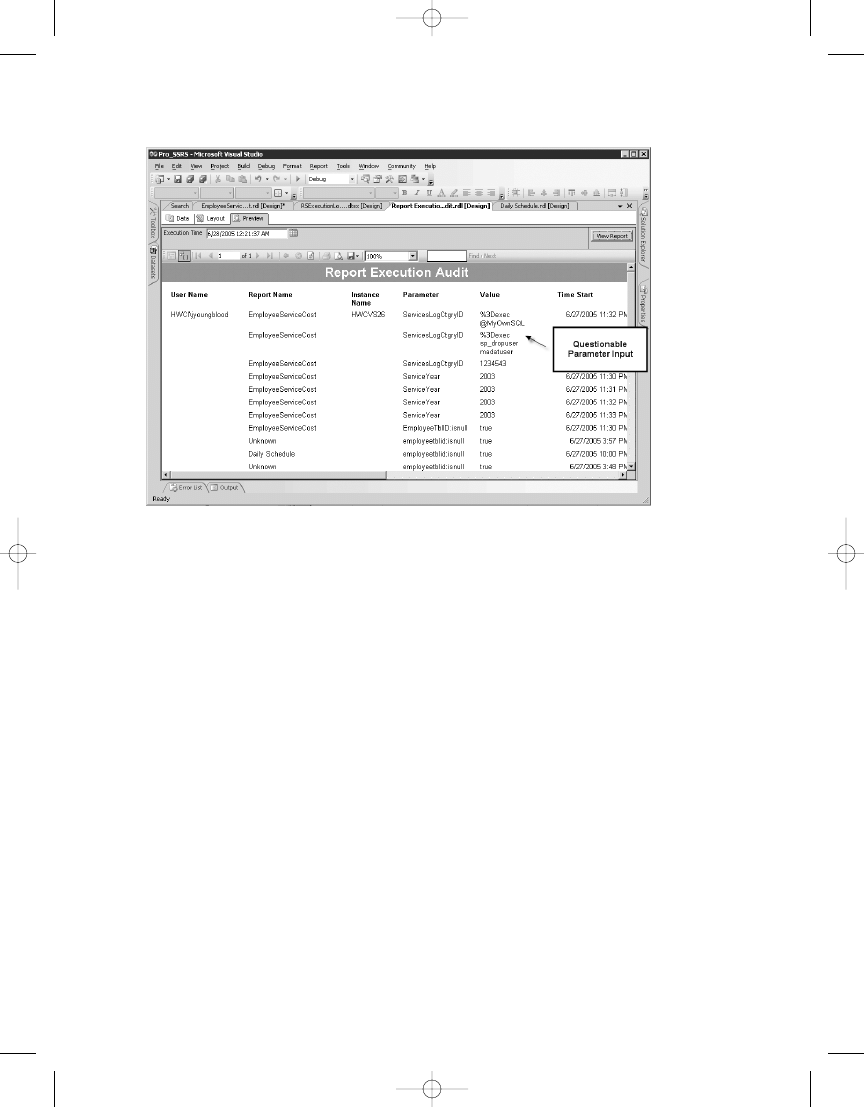
C H A P T E R 9
■
S E C U R I N G R E P O RT S
278
Figure 9-24.
Report Execution Audit report
Introducing Log File Auditing
In addition to report auditing, SSRS supports two other types of logging: standard Windows
event logging and trace file logging. You can use both of these resources to search for errors
and warnings as well as other important information, such as security information.
All the trace files are stored in the default installation location Drive:\Program Files\
Microsoft SQL Server\MSSQL.3\Reporting Services\LogFiles
. Three types of log files exist:
ReportServerService
, ReportServerWebApp, and ReportServer. Each file is named with a time-
stamp, such as ReportServerService_05_31_2004_17_00_30.log, and contains information
specific to its individual service. You can gather five levels of trace log information—0 through 4—
that are controlled in the ReportingServicesService.config file. Selecting 0 will disable tracing,
and selecting 4 will enable verbose mode. Whenever an issue arises with SSRS, the administrator
can generally isolate the problem by looking in either the event log or one of the trace files.
Exploring Deployment Models
We will cover two deployment scenarios—one is an application hosted on the Internet com-
bining Terminal Services and SSRS, and the other is an internal deployment of SSRS that
serves the reporting needs of employees on an intranet and through VPN. As you will see in
both deployment strategies, much of the security benefits are gained by the logical layout of
the systems themselves.
4983ch09.qxd 10/7/05 11:14 AM Page 278

C H A P T E R 9
■
S E C U R I N G R E P O RT S
279
You may note as we go through each model that we will not be deploying SSRS so that it is
directly exposed to the Internet. The primary reason for this is that the version of SSRS released
for SQL Server 2000 as well as for SQL Server 2005 by default directly supports only Integrated
or Basic authentication. This means that without modifying the default installation to include
other authentication mechanisms, a valid Windows login is required to access reports and
objects. Although you can create other authentication methods by building a custom security
extension, SSRS does not, for example, provide forms-based authentication natively, which
would be ideal for full Internet deployment. It is certainly feasible to create a limited Inter-
net deployment for a select group of users by configuring SSRS to use a fully qualified domain
name that is hosted on the public Internet. To ensure that these Internet users have access to
only the report data you intend for them to see, you’ll need to take security precautions. For
example, you could provide report snapshots, which do not query data sources directly, rather
than live reports.
In this scenario, using a preexisting infrastructure with Terminal Services hosted on the
Internet was the ideal solution for integrating SSRS within our health-care application, and
this type of deployment, along with an intranet environment, is what we will cover in the fol-
lowing section.
If you would like more information, including security extensions designed to deploy
SSRS using custom authentication for Internet reporting, even though the guidelines were
originally written with SSRS for SQL Server 2000 in mind, the following URL is a great resource
that covers the topic in detail:
http://msdn.microsoft.com/library/default.asp?url=➥
/library/en-us/dnsql2k/html/ufairs.asp
Implementing SSRS with Terminal Services
When our company decided several years ago to host our SQL Server–based application on
the Internet, the one solution that was most evident at the time was Windows Terminal Services.
The reason that this technology was the best choice for us was that our application was not yet
Web enabled. We needed a thin-client solution for our fat-client application. Servers were added
over the years to support more users, and technology advancements in Windows Server and
.NET provided many benefits that were natively supported. Technologies such as Active Directory,
network load balancing, and Internet printing allowed us to provide a secure and reliable serv-
ice to our customers.
When SSRS was released, we were already poised to integrate it within our Internet-hosted
application. We will now show a design for Internet access using Terminal Services. As you can
see in Figure 9-25, the terminal servers are positioned to reside on the Internet zone as well as
a demilitarized zone (DMZ), which is inaccessible to the outside world. In the DMZ are several
key components that all work together to provide services to the terminal servers, namely, SQL
Server, SSRS, and Active Directory. Users log in to the terminal servers directly, authenticating
to one of two domain controllers. Once authenticated, they are allowed to utilize the services
of the domain.
4983ch09.qxd 10/7/05 11:14 AM Page 279
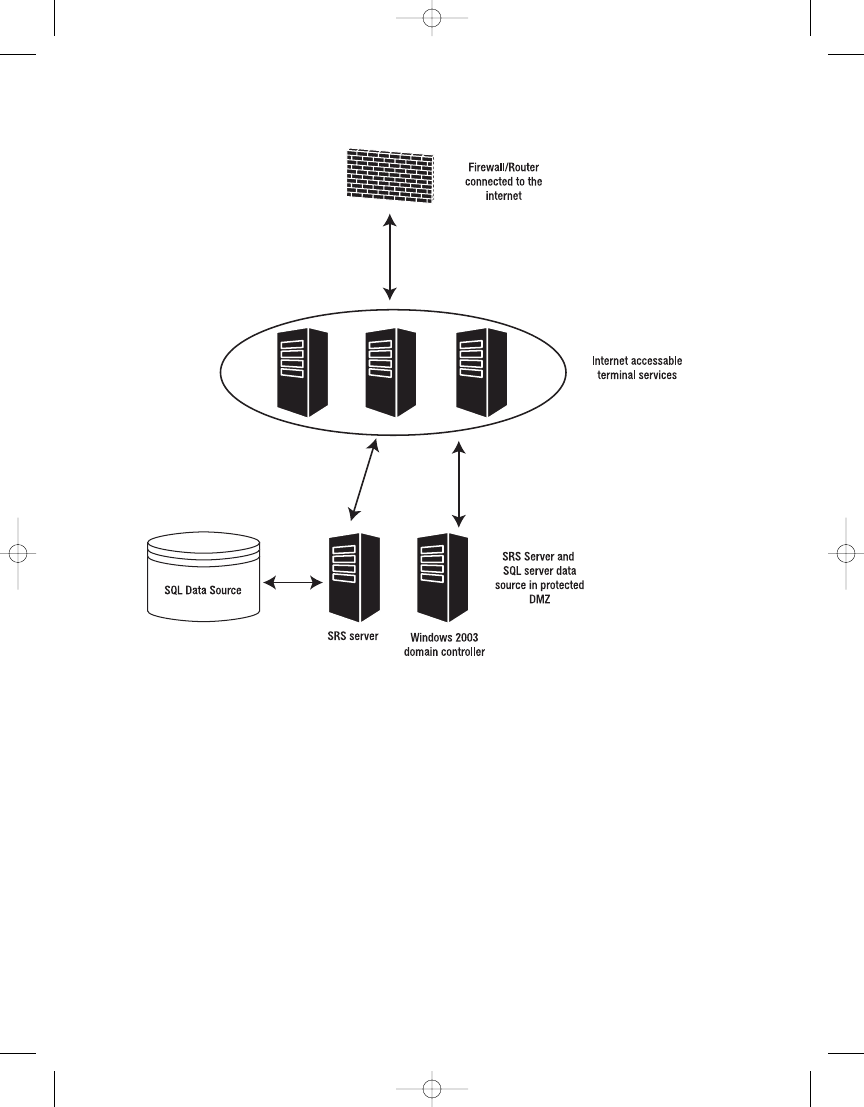
C H A P T E R 9
■
S E C U R I N G R E P O RT S
280
Figure 9-25.
SSRS with Internet-hosted Terminal Services
Several additional security measures are in place besides Windows authentication. Each
Windows 2003 terminal server has its built-in firewall capabilities enabled on the Internet-facing
network card to allow network traffic only on a specific port, 3389, for Terminal Services. All
other network packets, including PING requests, will be dropped. This setup lessens the likeli-
hood of this server being “discovered” using port-scanning tools. The networking components
that provide Windows networking services, such as Client for Microsoft Networks and File and
Printer Sharing for Microsoft Networks, have been disabled on the Internet.
On the DMZ-facing network cards, we can be more liberal with our service abilities. In the
DMZ, we still need to encrypt data, so we have applied a server certificate to our SSRS server,
as demonstrated earlier in the chapter. The only difference is that we are using a commercial
certificate from a trusted authority.
4983ch09.qxd 10/7/05 11:14 AM Page 280
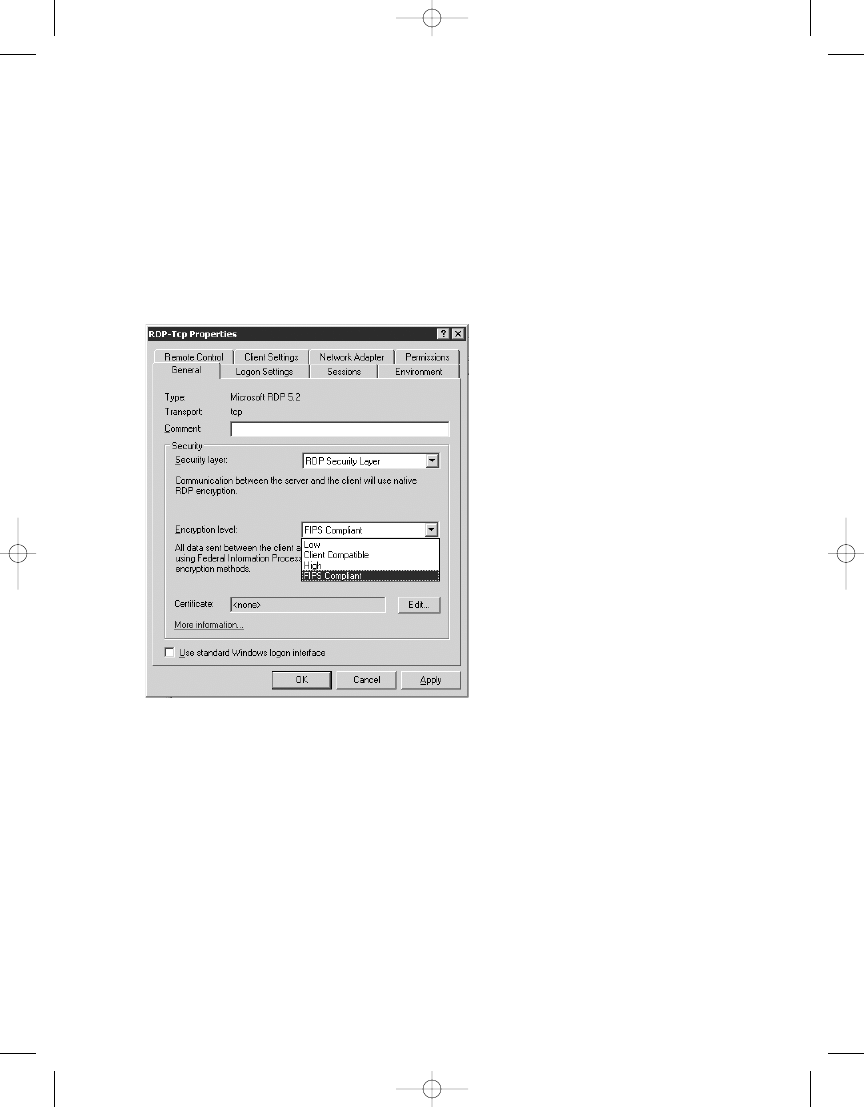
C H A P T E R 9
■
S E C U R I N G R E P O RT S
281
Terminal Services in Windows Server 2003 provides two levels of security at the network
packet level. The first level is because, by its nature, Terminal Services sends data that consti-
tutes only screen shots, keystrokes, and mouse clicks. To glean confidential information from
the RDP stream, which Terminal Services uses, you would need to capture and replay the packets.
It is certainly possible but unlikely. Second, Terminal Services provides four levels of encryption,
the lowest being 56-bit and the highest being FIPS Compliant, as shown in Figure 9-26. By
turning on High encryption, clients that do not support the maximum encryption level of the
server will be unable to connect.
Finally, we have implemented several other security techniques in the Internet-hosted
model by taking advantage of Terminal Services configurations through the use of the Group
Policy feature. These are two important settings for controlling client behavior with Terminal
Services:
• Forcing each user to connect to only one Terminal Services session at a time.
• Automatically executing an application when the user logs in. In our case, every time
the user logs into a session, they will see only our health-care application and not
a desktop.
Figure 9-26.
Terminal Services encryption levels
4983ch09.qxd 10/7/05 11:14 AM Page 281

C H A P T E R 9
■
S E C U R I N G R E P O RT S
282
By configuring Terminal Services in this way, we can be assured users cannot share their
logins to gain access simultaneously to the server. Equally important, our users will not be
allowed to interact with a desktop. All the tasks they will need to perform will be available
within the user interface of the health-care application. Further, because we have built our
own .NET report viewer that is executed from within our application, users will not need to
access Internet Explorer or another browser because they will view the reports from a Web
control within a Windows Forms application.
In the future, as SSRS matures into an application that supports additional authentication
methods, we will look to provide reports directly on the Internet. Currently, SSRS supports only
one type of authentication at a time. In other words, it is not possible to deploy a forms-based
custom security extension and still allow Windows authentication. For now, the Terminal Services
model is the best solution for us and fits in ideally with a preexisting infrastructure.
Implementing for Internal Access
In this scenario, each agency maintains (through an internal IT staff) its security policies, servers,
and applications. We knew that, as a third-party solution provider, we had the responsibility to
offer recommendations for secure deployments of SSRS within their agencies that would take
advantage of their existing security infrastructure. To that end, we decided to embed our reports
inside a custom report viewer that could be accessed through our health-care application. This
would serve to provide a browser control that we could lock down through code and pass the
authentication that they had used initially to access our main application. This method of
deployment was also identical to how we had previously deployed Crystal Reports. Clients
could now have control over which reports the users could actually see from their menu
choices. This did not address the concern about being able to access the SSRS Web service
from a browser and launch the report. However, because we would deploy all our reports to
a single known folder, the client maintained the ability to secure this folder at the user and
role level, as demonstrated earlier.
An internal deployment of SSRS requires the same roles-based security as in the Internet-
hosted model. A Windows domain controller with Active Directory will contain the security
grouping to associate with the SSRS roles. The main difference between the two models is that,
instead of using Terminal Services entirely, users will have the ability to access the reports
through a browser or via custom forms with embedded SSRS controls. In addition, each com-
pany may employ traveling or off-site personnel who need access to the reports. This will be
accomplished in one of two ways, either through VPN access or via secure redirected HTTPS
traffic through a firewall, such as the Microsoft ISA server. With VPN access, clients will connect
to the internal network through a VPN client and will then use the native encryption on that
connection, such as PPTP or L2TP, to access the SSRS server to view reports. The Microsoft ISA
server supports SSL bridging, which allows incoming SSL requests to be redirected to any inter-
nal Web site, providing, in our SSRS deployment, a means of encrypting the data from users
directly on the Internet. The client’s Windows credentials for which they will be prompted can
be passed through the ISA server. Further, the ISA server can limit the connections to a list of
users or known IP address sets.
Another technology consideration when deploying an SSRS server internally is wireless
access. Wireless has its own level of encryption through the use of WEP, but not all default
installations have this setting enabled by default. It is always best practice to have a server
certificate installed on the SSRS server with a SecureConnectionLevel set to 2 or higher when
4983ch09.qxd 10/7/05 11:14 AM Page 282
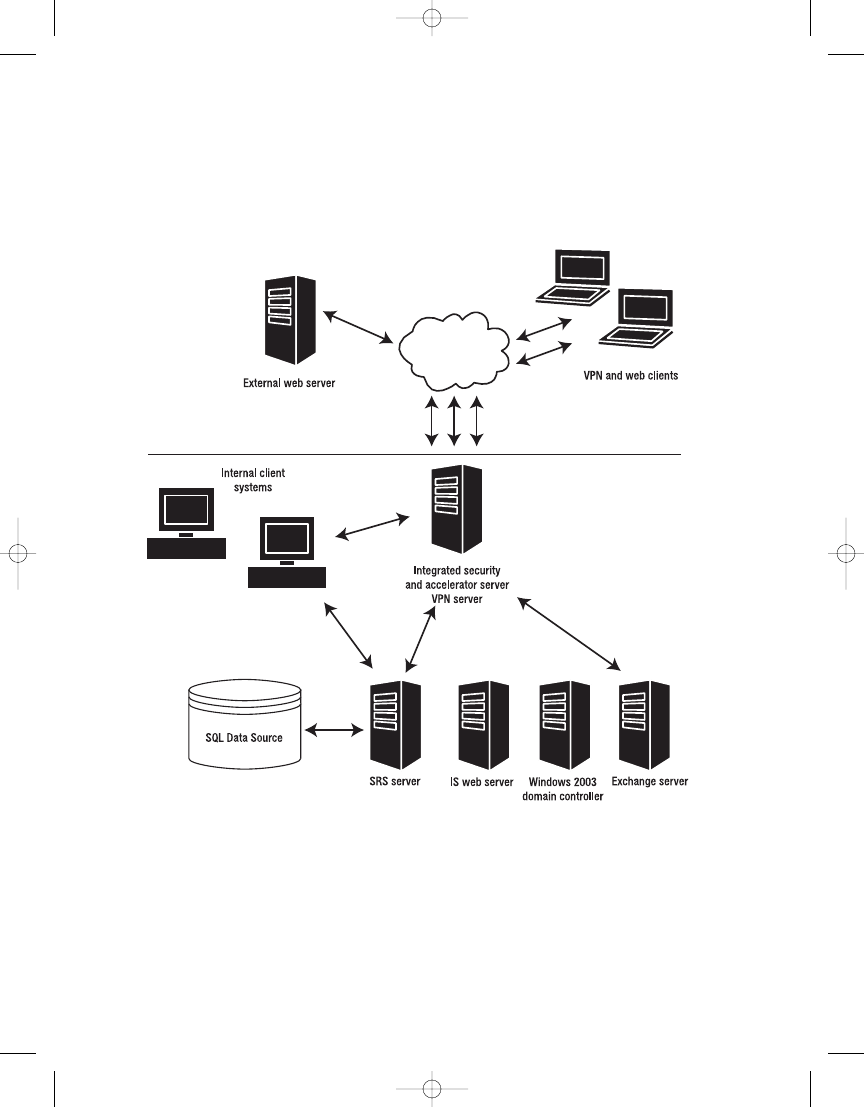
C H A P T E R 9
■
S E C U R I N G R E P O RT S
283
As you can see in Figure 9-27, the internal deployment allows for secure connection
within many points of the company. Administrators can control access to the server via stan-
dard Windows domain authentication policies while maintaining limited and secure external
access from known sources.
Summary
In this chapter, you examined three of the security tasks essential to secure SSRS deployment:
encrypting, authenticating, and auditing. You looked at how we chose to implement SSRS,
both internally to intranet users and externally to Internet clients through a hosted applica-
tion. In both models, the threat of confidential data falling into the wrong hands is real. When
data is transmitted over a public network such as the Internet, you should make sure the three
Figure 9-27.
Internal SSRS deployment
4983ch09.qxd 10/7/05 11:14 AM Page 283

C H A P T E R 9
■
S E C U R I N G R E P O RT S
284
components are properly configured and thoroughly tested. Internally, only employees who
need access to confidential data should have it, and you can ensure this by applying a special
filter for a report deployment. As a software provider for health-care organizations that store
confidential patient information, we are required to conform to the regulations imposed by
HIPAA. However, in other industries, many similar regulations exist. Having security policies
and procedures in place for any company is good practice, even when not working under strin-
gent regulations. Fortunately, SSRS is designed to use the core-level security mechanisms that
already exist in your organization through Windows authentication and can be extended, when
required, to support other means of custom authentication.
4983ch09.qxd 10/7/05 11:14 AM Page 284

Delivering Business Intelligence
with SSRS
M
ost companies accumulate business data that, if analyzed correctly, could provide insights
into what direction the company could take to achieve ultimate success. The aim of BI is to
provide data in such a way that it can be immediately utilized to make important decisions.
Microsoft’s BI platform comprises many services and applications that work together to facili-
tate the analysis and delivery of critical business data. SQL Server is at the heart of the BI model,
providing data storage, data transformation, notification, scheduling, analysis, and now
reporting services.
Having the right data available is just the first part of the challenge in building an effective
BI system. The second part is to ensure that this data is delivered in an effective and accessible
way to all the people who need to see it in order to make the right decisions. This is where SSRS
comes into play. In our health-care company, we found that by integrating SSRS with many of
the other components of the BI platform, we were able to dramatically improve our overall
business strategy by making necessary information available to our employees wherever they
were and whenever they needed it.
In this chapter, you will examine the following four applications that we have extended to
include the SSRS reports for our software development company:
Microsoft CRM: We had been using Microsoft CRM to track sales leads, correspondence,
and marketing efforts. However, the basic reports delivered with Microsoft CRM were lim-
ited in the information they provided to assist us in making business decisions. Using SSRS,
we were able to extend the functionality of Microsoft CRM. In addition to the custom report
that we designed for our company, we will show the report pack released for Microsoft CRM.
This report pack includes several SSRS reports and also includes a sample Microsoft
CRM database.
Microsoft Project: Developing software is an ongoing process of adding new functionality,
assessing the risk of migrating to new technologies, and testing. To make this process effi-
cient, our development team uses Microsoft Project 2003 to track every milestone. Falling
behind schedule at any point in the project affects release dates, which has a cascading
effect on all other departments. When we decided to migrate all the existing reports to SSRS,
we used SSRS as a project management tool to track each report as it was migrated. We will
show how we built the report to track the progress of the migration so that we could use it
both in conjunction with Microsoft Project 2003 and as a stand-alone report to show delivery
time frames.
285
C H A P T E R 1 0
■ ■ ■
4983ch10.qxd 10/7/05 11:18 AM Page 285

C H A P T E R 1 0
■
D E L I V E R I N G B U S I N E S S I N T E L L I G E N C E W I T H S S R S
286
Analysis Services: Having the ability to “slice” through dimensions of data often renders
unexpected and meaningful results. When OLAP Services was introduced with SQL
Server 7.0, we were asked to build a data warehouse, transforming our OLTP data into an
OLAP cube. We maintained this project using Analysis Services that shipped with SQL
Server 2000 and had some new functionality, such as data mining models.
SharePoint Portal Server: Part of Microsoft Office, SharePoint Portal Server provides our
company with an intranet portal that we have departmentalized. Any information relevant
to the company as a whole or to the individual departments is indexed and searchable.
Integrating SRS reports with SharePoint lets our employees easily find the data they require
to do their jobs. We will show how to add SSRS reports to SharePoint. Since SSRS builds on
Windows SharePoint Services, the work you will do in this chapter will also be applicable
to Windows SharePoint Services included with Windows Server 2003.
Most companies have similar applications to the ones we are describing. We are providing
these examples to give you some ideas of how, with a modicum of effort, SSRS can easily enhance
these types of business applications. Our purpose is not necessarily to provide a step-by-step
guide but to show how your company might use SSRS. If you use any of the applications men-
tioned in this chapter, such as Microsoft CRM or SharePoint Portal Server, you can easily integrate
this chapter’s ideas into your own environment. The Microsoft CRM reports used in this chapter
are available on the Apress Web site.
Extending Microsoft CRM with SSRS
Customer relationship management (CRM) applications have been around for many years.
These products facilitate communication with customers, both before and after a sale. A suc-
cessful business understands its market segment and maintains a good relationship with its
customers by delivering products that meet the customers’ changing needs. This is especially
true for a software development company, such as ours, that develops a specialized application.
Our customers must meet strict governmental guidelines imposed by the HIPAA, which means
we must modify our software to accommodate those guidelines. If we did not, we would have
many fewer customers. But aside from required modifications, we also value customer feedback
about how to make our software better. Often, a sale depends on one or two key features.
Knowing what a potential customer needs—and, even more important, why a customer
decided to purchase other software—is the type of information that, if tracked and analyzed,
can assist in making business decisions about the direction of the company.
We began using Microsoft CRM almost immediately after it was released. It falls under the
Microsoft Business Solutions platform and has the distinction of being the first Microsoft
business solution that was designed and built internally. It is a .NET application and uses SQL
Server for database storage. It provides much of the functionality we needed for tracking our
sales goals as well as communicating with our customers and contacts through integration with
Microsoft Exchange Server.
However, it does have a few shortcomings, and one of these is with its reporting capabilities.
Microsoft CRM uses a Crystal Reports–based reporting engine. (Bear in mind that Microsoft CRM
was released before SSRS.) The real issue is that the standard reports do not provide enough of
the kinds of information we needed to track, such as which customers had subscribed to our
4983ch10.qxd 10/7/05 11:18 AM Page 286

C H A P T E R 1 0
■
D E L I V E R I N G B U S I N E S S I N T E L L I G E N C E W I T H S S R S
287
industry newsletters or how companies learned about our software. This is important informa-
tion to us, as it dictates how our advertising money is allocated. If we know that a large percentage
of our sales in the last 12 months were generated from Web searches, for example, we would
want to improve our Web presence.
Not long after the initial release of SSRS, Microsoft released a report pack for its CRM product
that not only extended the basic reports of Microsoft CRM but was also the first step toward
migrating the existing reporting technology used for Microsoft CRM, which is Crystal Reports,
to SSRS. In the following sections, we will demonstrate the custom reports that we designed as
well as the reports included in the Microsoft CRM report pack.
Using the Report Pack for Microsoft CRM 1.2
The report pack for Microsoft CRM 1.2 may not include an overwhelming amount of reports,
six to be exact, but it provides basic reports in SSRS that can be extended or modified to add
value to Microsoft CRM. Microsoft has provided similar report packs to other applications,
such as PeopleSoft, IIS, Exchange, SAP, and SharePoint Portal Server. Another great benefit of
the Microsoft CRM report pack is that it contains a sample Microsoft CRM database that you
can attach to an instance of SQL Server, 2000 or 2005, and can use to create and test reports,
which we will do to demonstrate the sample reports. The six reports in the Microsoft CRM
report pack are as follows:
• Account Chart
• Account Details
• Customer Account Details
• Knowledge Base List
• Lead Summary
• Pipeline
If you would like to download and install the Microsoft CRM report pack, it is available at
http://www.microsoft.com/downloads/details.aspx?FamilyId=619EEF04-DDDA-4811-A8E9-
A7147A446624&displaylang=en
.
Once downloaded, the entire report pack can be installed, and the path that is created—
typically, C:\Program Files\Report Packs\CRM—contains everything needed to load and deploy
the six reports and sample database. The database file, called Adventure_Works_Cycle_MSCRM, is
in the Sample DB folder. It is a standard SQL Server database file with an .mdf extension. You can
find detailed instructions for attaching the database file in the MS CRM 1.2 ReportPack Readme.htm
file in the root folder with the caveat that the instructions are for SQL Server 2000 (for which the
report pack was released). Attaching the database to SQL Server 2005 is also possible using
the .mdf file mentioned. We will show how to use SSMS to attach the sample Microsoft CRM
database.
Open SSMS, connect to your SQL Server 2005 database engine, navigate to the Databases
folder in the Object Explorer, right-click, and select Attach. This will open the Attach Databases
dialog box. Click Add, and navigate to the Adventure_Works_Cycle_MSCRM.mdf file, as shown in
Figure 10-1. The file in this case is stored in C:\Pro_SSRS_Project\CRM. Click OK.
4983ch10.qxd 10/7/05 11:18 AM Page 287
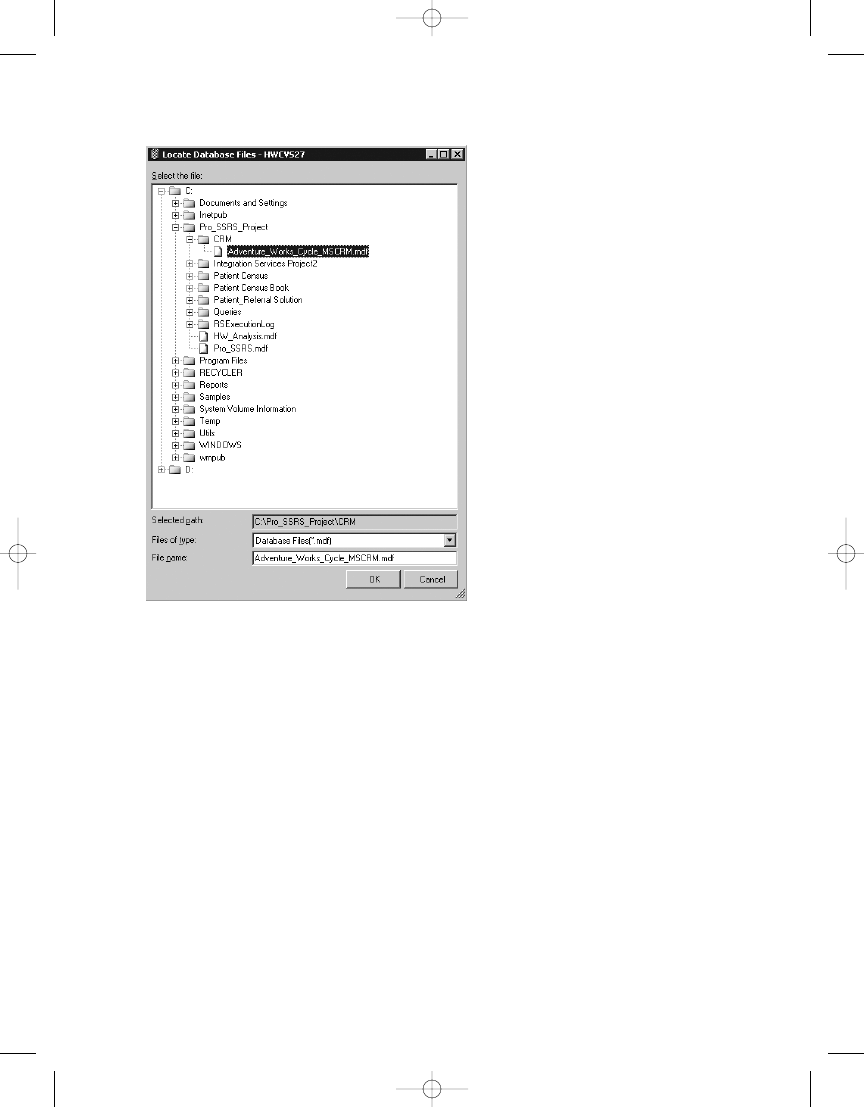
C H A P T E R 1 0
■
D E L I V E R I N G B U S I N E S S I N T E L L I G E N C E W I T H S S R S
288
Figure 10-1.
Attaching the Microsoft CRM sample database
When no log file with an .ldf extension exists, it is important to remove the log file reference
in the Database Details section of the Attach Databases dialog box so that only one file type is
there, Data and not Log. The attach process may ask to find the full-text catalogs for the data-
base. If that is the case, simply click No, and the process will complete successfully.
When you have attached the database successfully, you can expand the various objects
within SSMS to see the database structure. For example, Figure 10-2 shows all the tables in this
database.
4983ch10.qxd 10/7/05 11:18 AM Page 288
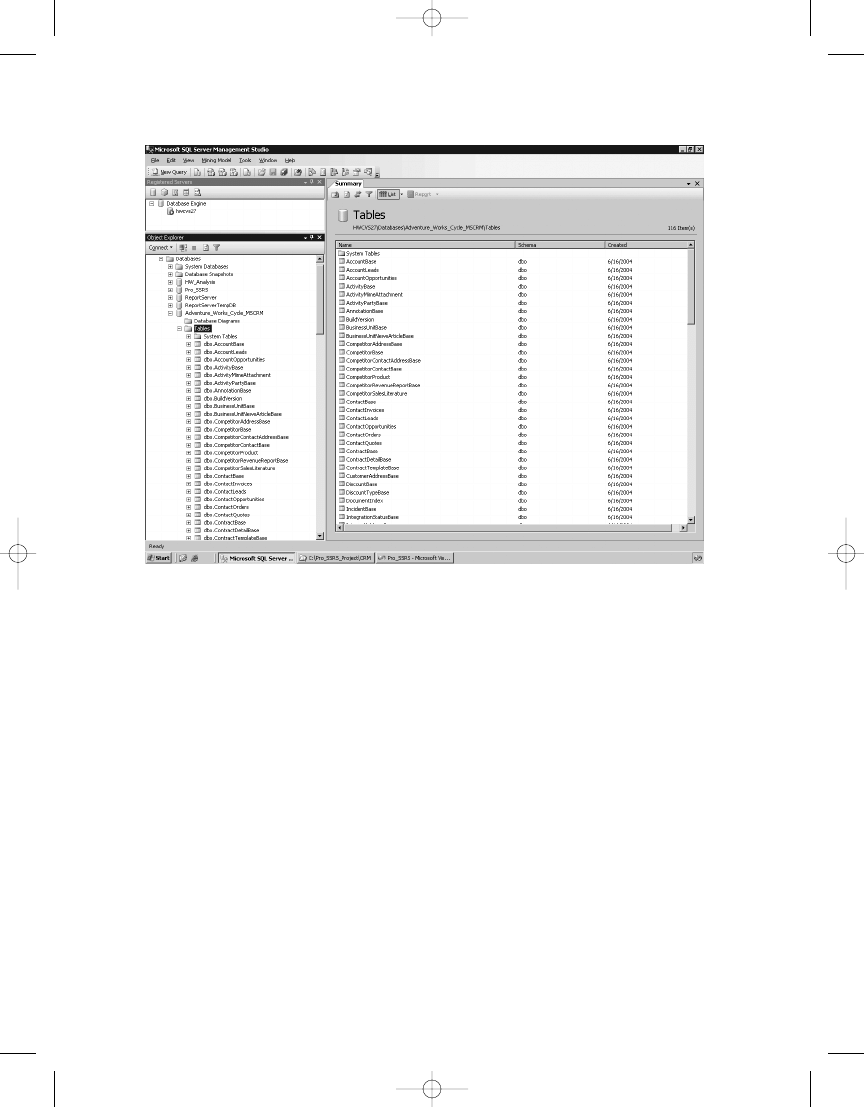
C H A P T E R 1 0
■
D E L I V E R I N G B U S I N E S S I N T E L L I G E N C E W I T H S S R S
289
Figure 10-2.
Microsoft CRM sample database structure in SSMS
Once you have attached the database, you can move on to loading the sample reports
into the VS or BIDS project. The project is in the C:\Program Files\Report Packs\CRM\
Report Definition Files
folder and is named CRM Report Pack.rptproj. If you have been
using the Pro_SSRS solution throughout the book, you can simply add this project to the
Pro_SSRS
solution by right-clicking the Pro_SSRS solution in Solution Explorer and selecting
Add an Existing Project. Navigate to the CRM Report Pack.rptproj file, and click Open.
With the project open, you can see one data source and six reports. The data source,
Adventure_Works_Cycle_MSCRM.rds
, points to local host by default, so if your Microsoft CRM
sample database was attached to the local instance of SQL Server, you should not have to
change it. If your database is on another server, you will have to double-click the data source
and change the Data Source value to point to your server by name.
Let’s open one of the sample reports, Lead Summary, and look at what it offers. When you
double-click the Lead Summary.rdl file in the CRM Report Pack project, the first thing you
should notice is a dialog box informing you that the report must be converted to the current
report definition format and that the report cannot be edited in previous versions of Report
Designer, as shown in Figure 10-3.
4983ch10.qxd 10/7/05 11:18 AM Page 289
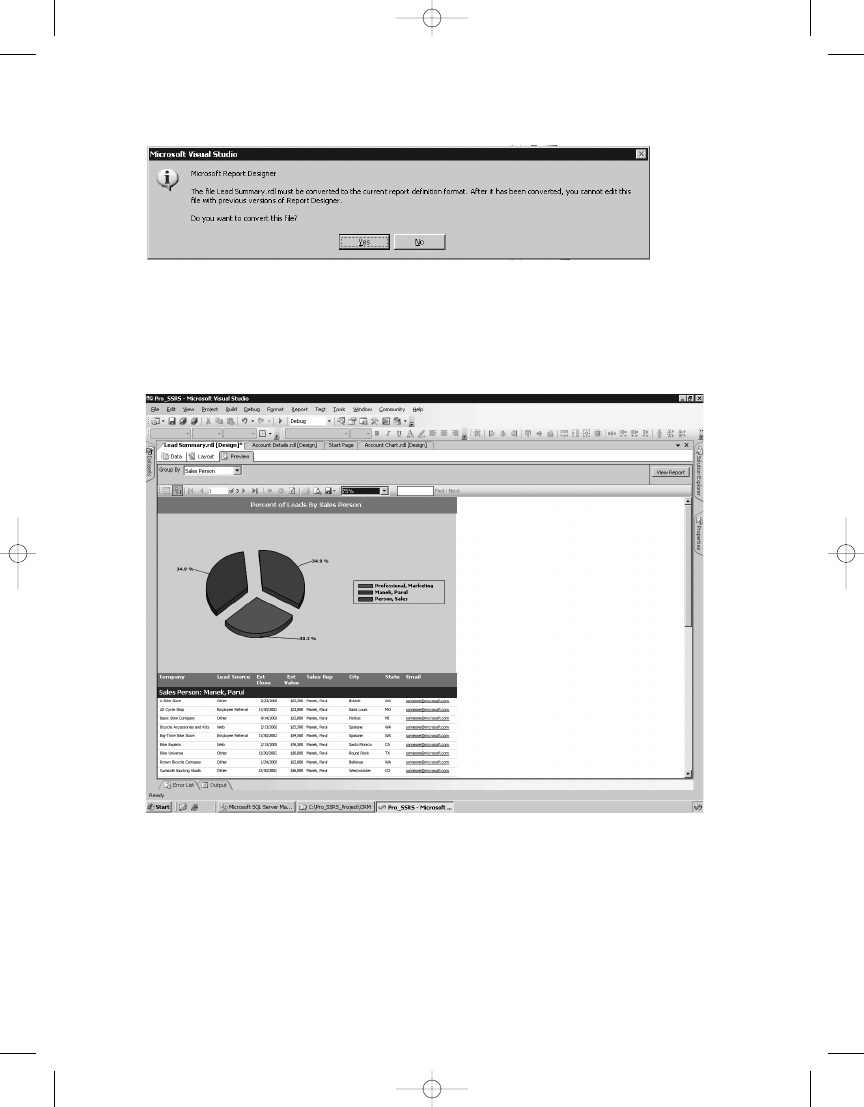
C H A P T E R 1 0
■
D E L I V E R I N G B U S I N E S S I N T E L L I G E N C E W I T H S S R S
290
Click Yes to convert the file. The Lead Summary report contains a pie chart and table that
lists detailed sales by salesperson and by company, as shown in Figure 10-4.
One interesting note about this report is that it uses a navigation item for e-mail
addresses. By adding a simple Jump to URL hyperlink action to this field, whose value is
mailto:someone@microsoft.com
, the report takes on an interactive property, which is one of the
key benefits of a Web-based reporting application. We will show how to do something similar
for the Microsoft CRM report covered in the “Creating Custom SSRS Reports for Microsoft CRM”
section, where we will show how to link to Microsoft CRM forms and pass in parameters. This
ell.
Figure 10-3.
Notice about converting the sample report file
Figure 10-4.
Viewing the Lead Summary report
4983ch10.qxd 10/7/05 11:18 AM Page 290

C H A P T E R 1 0
■
D E L I V E R I N G B U S I N E S S I N T E L L I G E N C E W I T H S S R S
291
You will use these reports in the “Incorporating SSRS with SharePoint Portal Server” section,
where we show how to tie these and other BI reports together using SSRS Web Parts.
Creating Custom SSRS Reports for Microsoft CRM
In this section, we will show two custom Microsoft CRM reports that we developed and deployed
with SSRS: the Sales Projections Chart report and the Lead Conversion report. Both of these
reports are available for download at the Apress Web site and can be used directly with any
Microsoft CRM version 1.2 database.
Though Microsoft CRM is not the easiest database to work with, once you understand
where to retrieve description information that relates to CRM entities, such as opportunities,
leads, lead sources, and industry codes, you’ve won half the battle. The values related to these
entities are stored in the StringMap table. Both reports are based on the same basic query, as
shown in Listing 10-1; you can see that StringMap.Value returns the lead source and is joined
to the LeadBase table.
Listing 10-1.
CRM Query for the Sales Projection Chart Report
SELECT
OpportunityBase.EstimatedCloseDate,
OpportunityBase.Name,
OpportunityBase.StatusCode,
OpportunityBase.EstimatedValue,
RTRIM(CAST(DATEPART
(yyyy, OpportunityBase.EstimatedCloseDate) AS char(5)) +
DATENAME(m, OpportunityBase.EstimatedCloseDate)) AS Estimate_Close,
OpportunityBase.CreatedOn,
StringMap.Value AS [Lead Source],
LeadBase.NumberOfEmployees,
LeadBase.SIC,
LeadBase.FullName AS [Lead Contact],
LeadBase.IndustryCode.
CAST(OpportunityBase.OpportunityId AS nvarchar(80)) AS
OpportunityID
FROM
OpportunityBase INNER JOIN
LeadBase ON
OpportunityBase.OriginatingLeadId = LeadBase.LeadId LEFT OUTER JOIN
StringMap ON LeadBase.LeadSourceCode = StringMap.AttributeValue
AND StringMap.AttributeName = 'leadsourcecode'
WHERE
(OpportunityBase.StatusCode NOT IN (4, 5)) AND
(OpportunityBase.EstimatedCloseDate BETWEEN GETDATE() AND @SixMonthDate)
ORDER BY OpportunityBase.Name
■
Caution
Microsoft does not support accessing the Microsoft CRM database directly for reports.
4983ch10.qxd 10/7/05 11:18 AM Page 291
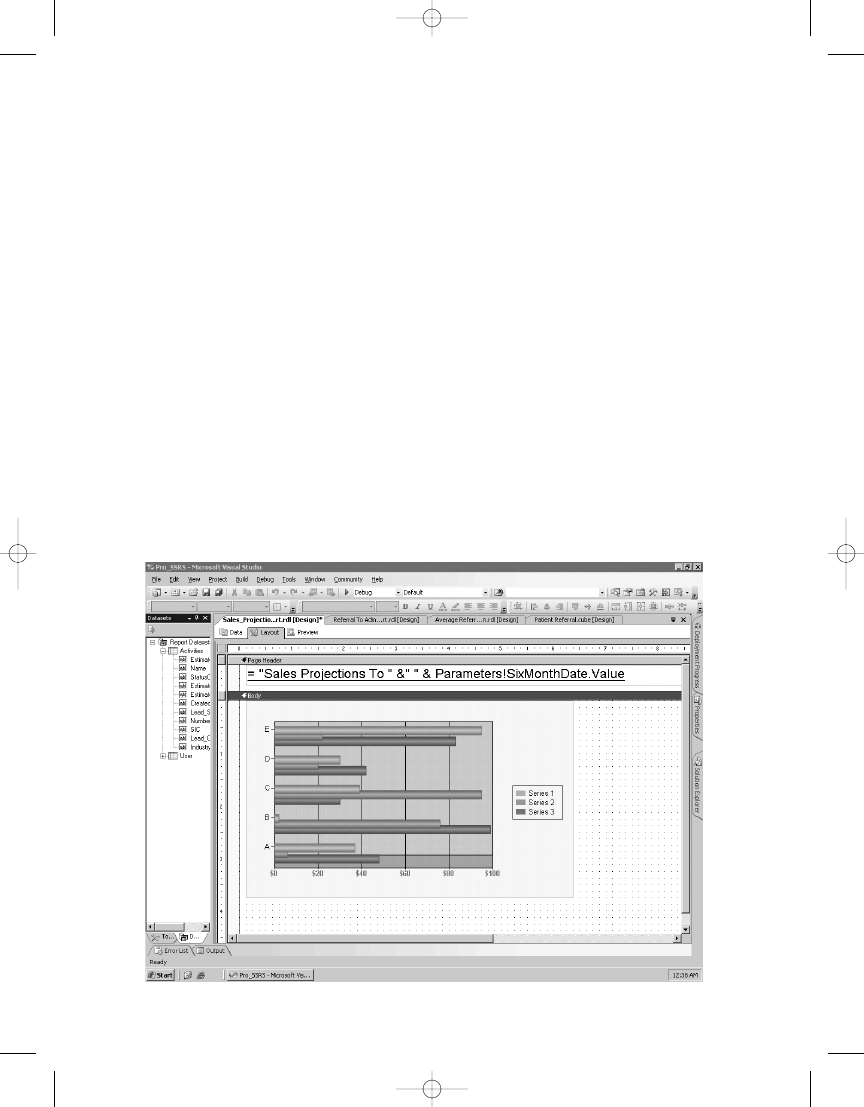
Creating the Sales Projections Chart Report
The Sales Projections Chart report is a fairly simple and compact chart that shows at a glance the
projected sales for the next six months. Several reports are available within Microsoft CRM,
called pipeline reports, that deliver good sales forecasting information. However, if any key
information is not included in the Crystal Reports CRM reports, modifying the reports is no
easy feat. In fact, we needed one piece of information that the Microsoft CRM pipeline reports
did not seem to have, and that was a chart of sales projections based on the lead source, such
as through a Web search or partner.
We created the Sales Projections Chart report with SSRS to add the lead source information
using steps similar to the ones used in Chapter 3, adding 3D effects and a nondefault color
scheme. You can see that the layout of the chart has the Lead Source field applied to the series
of the chart and the Estimated Close Date is defined for the category. The Estimated Value
field makes up the Data section of the chart. This report has a parameter called SixMonthDate
that is used as a query parameter in the WHERE clause of the query to provide a date range for
the EstimatedCloseDate field between the current date and six months in the future. Any CRM
leads or opportunities that are expected to close the sale within that date range will show in
the chart. In Figure 10-5, you will also notice that the report’s title section contains a parameter
value expression for the SixMonthDate parameter. The default value for the SixMonthDate is six
months, but because the user could change the default parameter to, say, three months into
the future, the report title would need to change to reflect the user’s date range. Adding the param-
eter value to the report title will dynamically change when the parameter value changes.
C H A P T E R 1 0
■
D E L I V E R I N G B U S I N E S S I N T E L L I G E N C E W I T H S S R S
292
4983ch10.qxd 10/7/05 11:18 AM Page 292

C H A P T E R 1 0
■
D E L I V E R I N G B U S I N E S S I N T E L L I G E N C E W I T H S S R S
293
To set the default parameter value for the date range of six months in the future, you can
use an expression that takes the current date and adds six months to it, as follows:
=FormatDateTime(DateAdd(DateInterval.Month,6,Date.Today),DateFormat.ShortDate)
By combining several functions and .NET class library property values into a single
expression, you can create a date range with desired formatting. In the preceding expression,
the FormatDateTime function sets the output of the DateAdd function to a short date, which
does not include the neutral time of 00:00:00 that would have been returned from the DateAdd
function. Finally, the DateInterval.Month enumeration uses the value of 6 to add six months
to the current date.
Creating the Lead Conversion Report
When a lead is converted to opportunity, which in CRM means there is a potential interest in
the purchase of a product, it is important to be able to report that information to ensure that
someone regularly follows up with this potential customer and sends important product
information.
To this end, we decided to create the Lead Conversion report to show only opportunities
so that a marketing employee could easily view this information. Further, by having a link
within the report to the actual Microsoft CRM Opportunity form, the employee could then
open the form without having to open the Microsoft CRM application and navigate to the
form manually to update the information related to opportunities. You can do this by adding
a URL link to the navigation sections of the report.
In this case, we designed the report, which lists all the companies that comprise the pro-
jected sales from the chart, with the intention of having the report essentially be an extension
of Microsoft CRM itself. The report contains detailed information for each opportunity, including
the opportunity name. We added a Jump to URL link to the report on the Navigation tab for the
textbox that holds the opportunity name. The link will use the URL-addressable syntax for
Microsoft CRM so that when the opportunity name is clicked in the report, the Microsoft CRM
form associated with that opportunity displays. A sample expression to add to the Jump to
URL field is as follows:
="http://hwcs03/SFA/opps/edit.aspx?id={"& Fields!OpportunityId.Value &"}"
This link will open the Opportunity form and pass in the field value of OpportunityID
when the opportunity name is clicked in the report. One note of interest here is that the
OpportunityID
field value is a globally unique identifier (GUID) data type, and SSRS does not
work well with GUIDs. In the SQL query, you can use the CAST function to convert the field to
be a data type of NVARCHAR, as follows:
CAST(OpportunityBase.OpportunityId AS nvarchar(80)) AS OpportunityID
Then you can pass in the braces in the expression for the URL link. Figure 10-6 shows the
report and the hyperlink to the Microsoft CRM form in the bottom-left corner of the browser.
Notice also the pointing finger icon, indicating a hyperlink.
4983ch10.qxd 10/7/05 11:18 AM Page 293
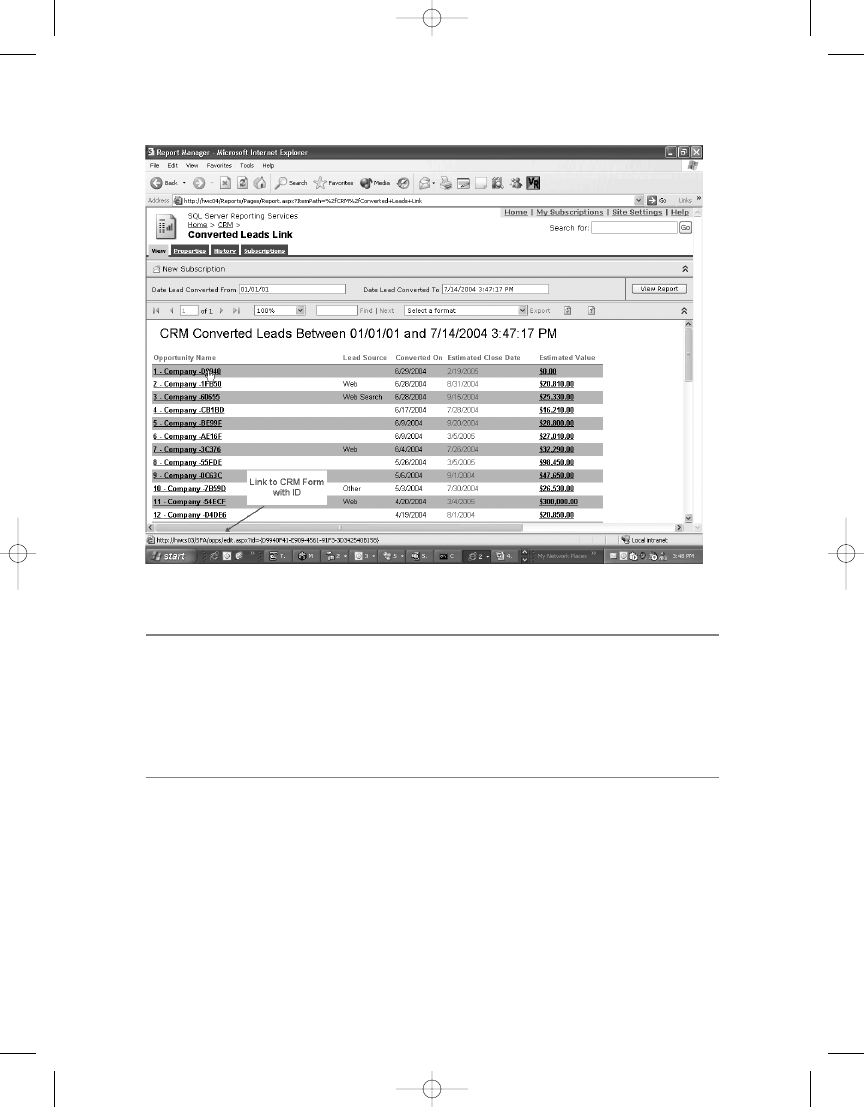
■
Note
In the code download for this chapter, we have not only included the two Microsoft CRM reports
mentioned here, the Sales Projections Chart report and the Lead Conversion report, but have also included
two other complete, full-featured reports, Opportunities Without Activities and Opportunity and Lead Activities.
The Opportunity and Lead Activities report uses an advanced query to combine the two entities in the same
report, with hyperlinks directly to their respective activities. All that is required is to configure each report is
to connect to your Microsoft CRM database.
Managing Projects with SSRS
In this section, we’ll show how to integrate SSRS within a BI model before moving on to Analysis
Services and SSRS. When SSRS was first announced as an add-on product to SQL Server 2000,
we knew, as we said previously, that we would incorporate it into our base application, prima-
rily to standardize our reporting on a single platform and move away from Crystal Reports and
other applications we had used over the years. When I (Rodney) was tasked with migrating
nearly 200 reports from the current system to SSRS, I was a little overwhelmed. On one hand,
I needed a period of time to learn the new product, and on the other hand, I had to implement
risk assessment for the new technology because SSRS is not simply a report designer; it is
C H A P T E R 1 0
■
D E L I V E R I N G B U S I N E S S I N T E L L I G E N C E W I T H S S R S
294
Figure 10-6.
Creating a Microsoft CRM opportunity listing with link
4983ch10.qxd 10/7/05 11:18 AM Page 294

C H A P T E R 1 0
■
D E L I V E R I N G B U S I N E S S I N T E L L I G E N C E W I T H S S R S
295
Coincidentally, at the same time we decided to move to SSRS, our development team had
just begun to design an enhancement to our application. We thought the two projects could be
developed in parallel, with me migrating the reports and with them delivering the new .NET
enhancements. As a software development company, keeping on schedule through every aspect
of a project is important for several reasons, mainly to stay on track with other departmental
goals such as product testing, marketing, and creating documentation.
The development department uses Microsoft Project 2003 to record its project and task
milestones throughout each phase of a project, whereas my work as an engineer and data
analyst does not always require this degree of granular detail and planning.
I proposed a compromise solution (and this was probably because I really did not want to
have to use Microsoft Project): I would develop a project management report using SSRS. In
the report, I would track every report that was slated for migration to SSRS. My project report
would provide timelines and status information similar to those provided by Microsoft Project
(though on a much more limited basis than what Microsoft Project can deliver). As I migrated
the reports from other reporting solutions, I would update a SQL database table that contained the
project information, which would then be reflected in my SSRS report. Developers could use
my report to incorporate the report project information into their own projects so that they
could account for my development time.
In hindsight, developing this report of reports, as it were, was probably the best first SSRS
project that I could have undertaken because it forced me to design a report that was flexible
enough for everyone in the company to use for different purposes: my supervisor needed to
know how much time I was devoting to the task of writing reports per week, the support and
testing departments could use the list in their jobs as they worked with the application
and answered customer questions, and finally the development department could see where
I was in relation to their projects.
The first step was to extract the list of reports from the current SQL Server database that
our application used. We store each report’s name, base query, description, file name, and format
in a table within the health-care database. I used Data Transformation Services (DTS), now SSIS,
to pull this information into a single table, along with other crucial pieces of information for which
I would have to create custom fields. I categorized and subcategorized each report according to
its location within the application (for example, financial or clinical), and I added several track-
ing fields that were in line with a project management application, such as Status, In Progress,
Completion Date, Estimated Time, and Date Last Updated.
It was important to know which reports would be new, which would be replacements, and
which would be removed entirely. By using a combination of filters and parameters, I was able
to deliver the report so that it would show only the reports that were being completed in SSRS,
and I used color formatting to distinguish them from the previous report formats. One of the
features that I wanted was the ability to link to each of the reports so that they could then, from
one location, be printed as samples to include in product literature and customer newsletters.
I added a Jump to URL hyperlink for each report name as well as a document map for easy nav-
igation. Because I was new to SSRS at the time, I completed many of these tasks via trial and error,
and I encountered lots of syntax errors, or other errors, that needed to be debugged. (Chapter 4
demonstrated many of the features that I added to this report.) Figure 10-7 shows the reports
with the document map, parameters, color coding, and estimated completion time used to track
deliverable dates. The single table, HWReports, that contains the project data used to create this
report is included in the Pro_SSRS database, and the RDL report file itself, HW_Reports, is in the code
download on the Apress Web site. We are including this report as a sample not so much for its
eport design that you can add to any report.
4983ch10.qxd 10/7/05 11:18 AM Page 295
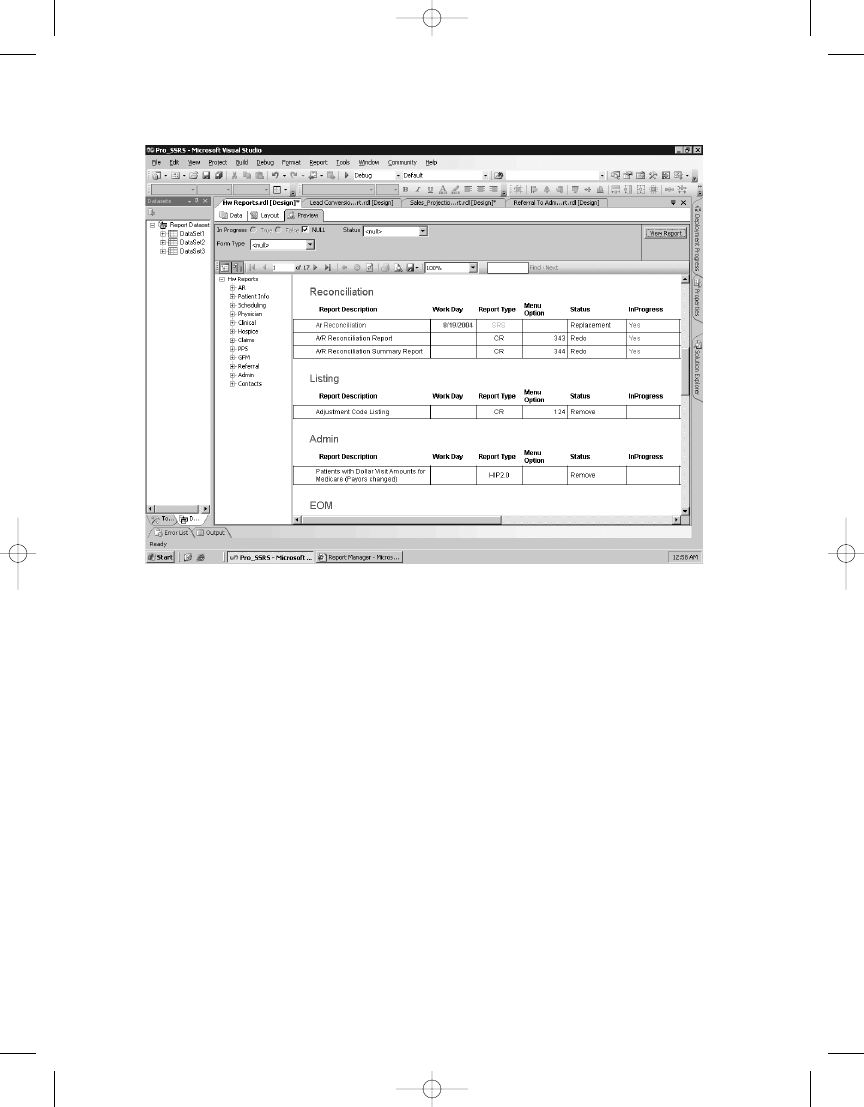
Building SSRS Reports for SQL Analysis Services
When I (Rodney) began the journey of building an OLAP solution for our health-care application
with SQL Server 2000 Analysis Services, I was really eager to jump right in and start analyzing
data the first morning. I had become the resident expert at developing SQL queries to interro-
gate our OLTP database, and since this was the source database from which I was going to build
the warehouse, I thought it would be a simple case of adding a few queries and processing the
cube. It did not turn out to be quite that easy. In retrospect, however, the process of creating
an OLAP data cube from a known source of data was worthwhile because I was able to apply
the skills I learned to many other projects. With each new version of Analysis Services, more
and more features are delivered; this at first can seem overwhelming simply because of the
volume of enhancements and the time required to not only become familiar with the technol-
ogy but also to master it to gain the most benefit. However, while adding new features, Microsoft
also adds many new tools that simplify time-consuming tasks. In the case of Analysis Services
2005, these new tools include a graphical MDX query builder and a cube wizard that automates
many of the steps that create the intricate parts of an Analysis Services solution.
In this section, we will show how to use a simple Analysis Services cube as the data source
to build and deploy SSRS BI reports. The cube is based on a SQL Server database that serves as
a data warehouse for the health-care application you have been using throughout the book.
The cube is populated with data relevant to patient admissions for a health-care agency. Though
y, such as patients
C H A P T E R 1 0
■
D E L I V E R I N G B U S I N E S S I N T E L L I G E N C E W I T H S S R S
296
Figure 10-7.
Features of the report HW Reports
4983ch10.qxd 10/7/05 11:18 AM Page 296
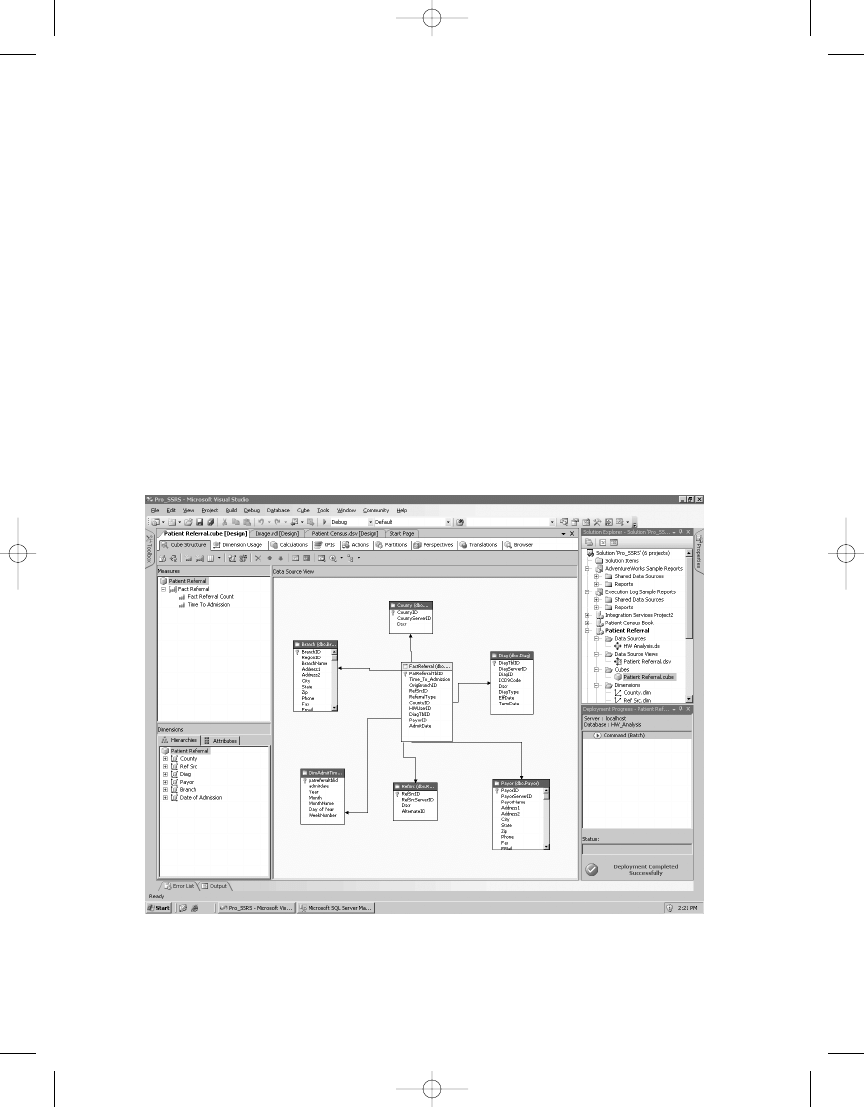
C H A P T E R 1 0
■
D E L I V E R I N G B U S I N E S S I N T E L L I G E N C E W I T H S S R S
297
with multiple recurrent admissions, changing diagnosis and patient referral sources, we will
show how to create a report that specifically delivers analytical information about the length
of time between when a patient is referred to the agency and when they are actually admitted.
Over time, the data that is collected can help assist decision makers isolate problem areas and
improve the processes that may be causing inefficient patient referral times. First, let’s look at
the database and cubes on which the report you create will be based.
The data warehouse database you will use as a source for the Analysis Services project is
called HW_Analysis. It is a simple database containing only eight tables and is populated with
data using SQL Server Integration Services (SSIS). The typical process for preparing a data
warehouse database with SSIS is to export data from the source OLTP database, transform the
data to make it more conducive to analysis by SSAS, and finally load this transformed data
into the data warehouse.
We have already built both the Hw_Analysis database and the SSAS cube called Patient
Referral, and we have included the required files for deploying these two key components and
detailed installation instructions in the code download for this book. Once you have restored
the HW_Analysis data warehouse database, you can open the Pro_SSRS project, which contains
the Patient Referral cube. Figure 10-8 shows the simple Patient Referral cube structure in
BIDS. The cube has six dimensions and two measures.
Figure 10-8.
Patient Referral cube structure
4983ch10.qxd 10/7/05 11:18 AM Page 297

C H A P T E R 1 0
■
D E L I V E R I N G B U S I N E S S I N T E L L I G E N C E W I T H S S R S
298
Of the six dimensions, several of them should be familiar to you because you have worked
with them in other chapters of the book. You can think of a dimension in a cube as preaggre-
gated groups or categories of data that can be associated with one or more measures. Measures,
such as Time to Admission and Fact Referral Count, are calculated values at each level in a dimen-
sion. Multidimensional data stored in a cube consists of both dimensions and measures that,
when queried using MDX, can be analyzed not just two-dimensionally like rows and columns
of a T-SQL query but can be drilled into and sliced at many dimensions. These are the dimensions
you will use in the Patient Referral cube:
• County
• Referral Source
• Diagnosis
• Payer
• Branch
• Data of Admission
Since the starting point in this exercise is a prepopulated and processed cube, it is important
to make sure you are getting the desired data from the cube before creating your SSRS reports.
With the Pro_SSRS project open in BIDS, navigate to the Patient Referral SSAS project in Solution
Explorer, expand to Cubes, and double-click Patient Referral.cube. This will open the cube
in design mode. Once the cube is open, select the Browser tab. Figure 10-9 shows the opened
cube with the combined measures and dimensions ready to be dragged and dropped into the
query pane. If no data appears in the Browser tab, and a message indicates that there is a per-
mission problem or the database does not exist, this usually indicates that the cube needs to
be processed or the SSAS Patient Referral database needs to be deployed. To deploy the Patient
Referral database in BIDS, right-click the Patient Referral project, and select Deploy. Once you
have deployed it successfully, you can return to the Browser tab, and click the available link to
reconnect to the database.
4983ch10.qxd 10/7/05 11:18 AM Page 298
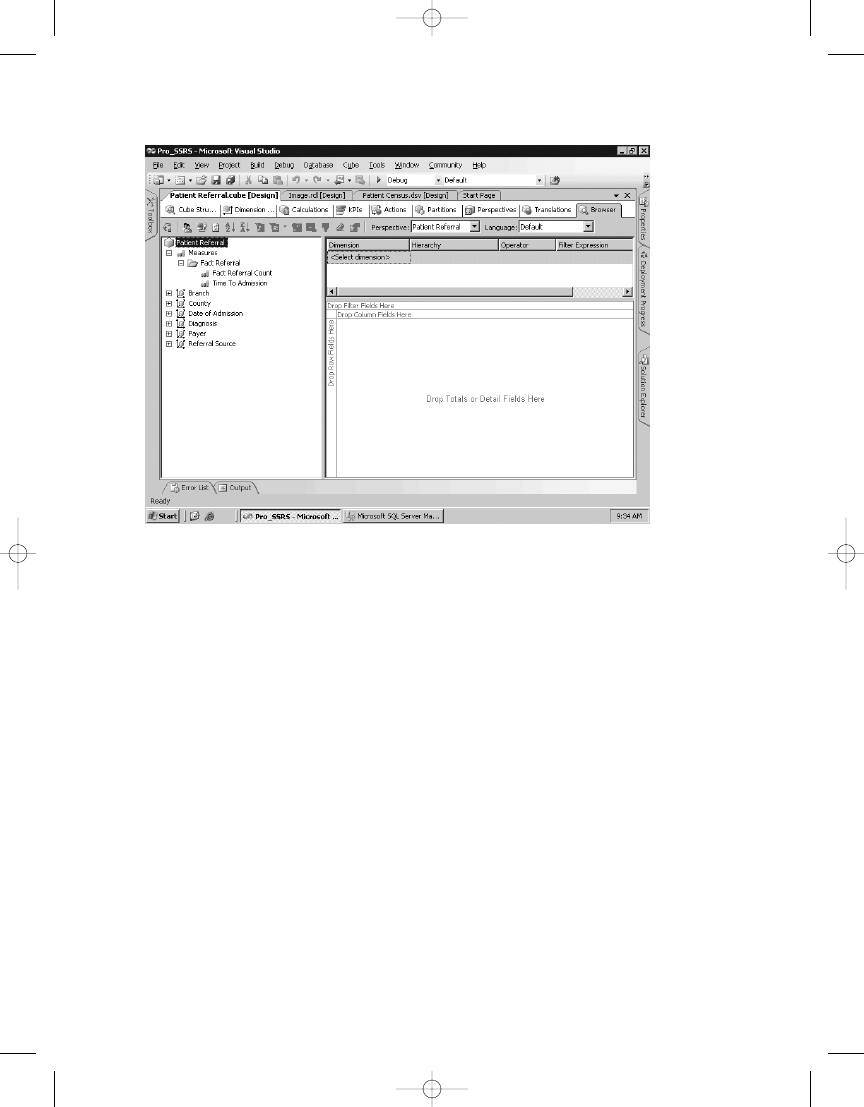
C H A P T E R 1 0
■
D E L I V E R I N G B U S I N E S S I N T E L L I G E N C E W I T H S S R S
299
You can begin by expanding Measures and then Fact Referral in the cube object window.
Next, drag the Time of Admission measure to the Drop Totals or Detail Fields Here section of
the query pane. You should see an average time of 14.095 minutes. This calculation was done
at the time the cube was originally loaded and processed and represents a total average of
time to admission for all dimensions combined. Figure 10-10 shows the Time to Admission
measure in the query pane.
Figure 10-9.
Viewing the Patient Referral cube in BIDS
4983ch10.qxd 10/7/05 11:18 AM Page 299
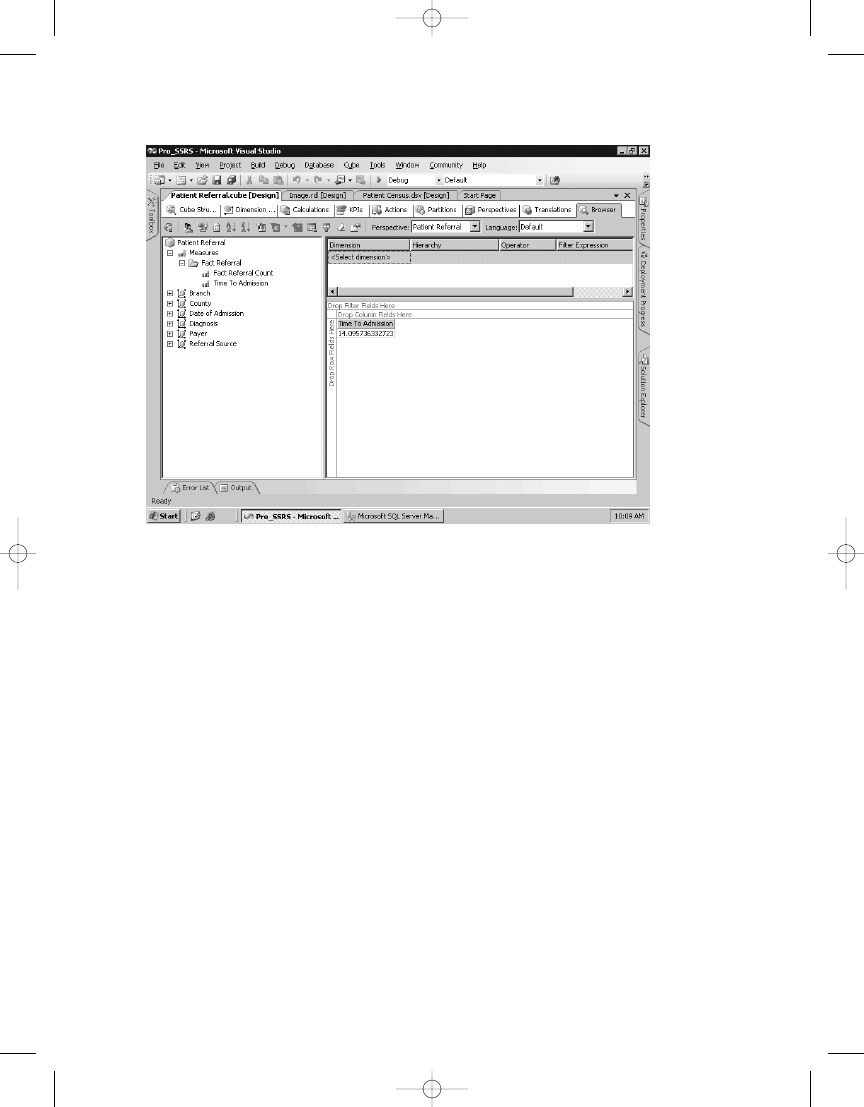
C H A P T E R 1 0
■
D E L I V E R I N G B U S I N E S S I N T E L L I G E N C E W I T H S S R S
300
Figure 10-10.
Viewing the overall Time to Admission measure’s average for all dimensions
Now drag two dimension objects onto the query pane, one for fields and one for rows. Under
the Branch object, drag and drop the BranchName field onto the Drop Column Fields Here section
of the query pane. Next, under Date of Admission, drag and drop Year, MonthName, and admitdate
to the Drop Row Fields Here section. Because this particular data store contains anomalies in
some patient admission history left over from a data conversion, you know that the years 2000
and 2001 contain data that you will not be interested in for this query. You can therefore access
the drop-down list on the Year header in the query pane and unselect 2000 and 2001. When
finished, the cube browser should look like Figure 10-11. You can now see the overall average
has dropped to 6.09 by removing the years you are not interested in and not the 14.095 that
included the years 2000 and 2001. In addition, you can see the gradual decline in admission
time from 2002 to 2005 at each branch level.
4983ch10.qxd 10/7/05 11:18 AM Page 300
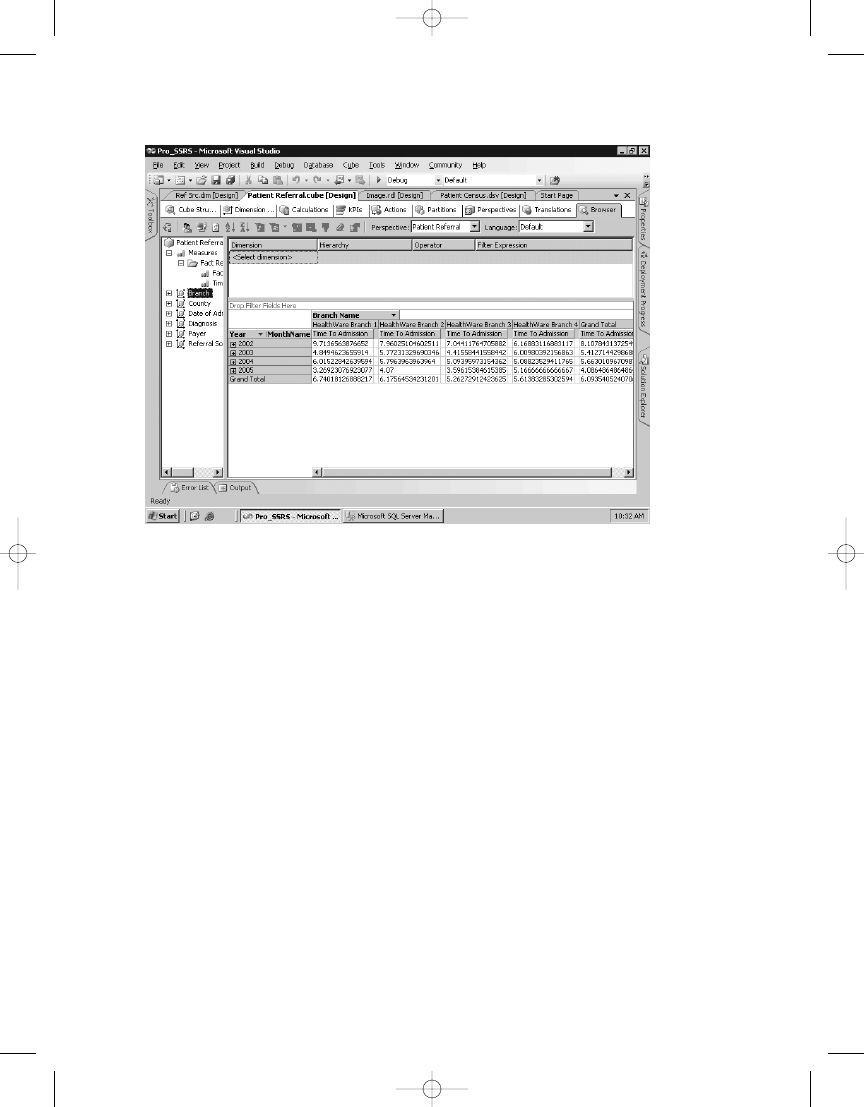
C H A P T E R 1 0
■
D E L I V E R I N G B U S I N E S S I N T E L L I G E N C E W I T H S S R S
301
You can drill down to the month and then to the actual admission day if you choose to do
so. However, you now know that you are indeed getting data from the cube, so it is time to move
on to SSRS and create the report you will deploy to the portal.
Using Analysis Service Cube with SSRS
Now that you have determined that the Patient Referral cube is working as it should, the next
step is to create an SSRS report. In the Pro_SSRS project, you will find two completed reports,
the Average Referral to Admission report and the Referral to Admission Chart report, that are
both based on the Patient Referral cube. We will not go through the procedure of building
these reports step by step; however, we will demonstrate the following through the Average
Referral to Admission report:
• Setting up a data source to use Analysis Services
• Using the graphical MDX query builder that is new to SSRS for SQL Server 2005
Setting Up the Analysis Services Data Source
With the Pro_SSRS project open, navigate to the Reports folder, and open the Average
Referrals to Admission report. Next, click the Data tab. In the Dataset list at the upper-left
corner of the Data tab, notice that there are two datasets for this report, Patient_Referral
and DateofAdmissionYear, as shown in Figure 10-12.
Figure 10-11.
Cube browser with year and branch
4983ch10.qxd 10/7/05 11:18 AM Page 301
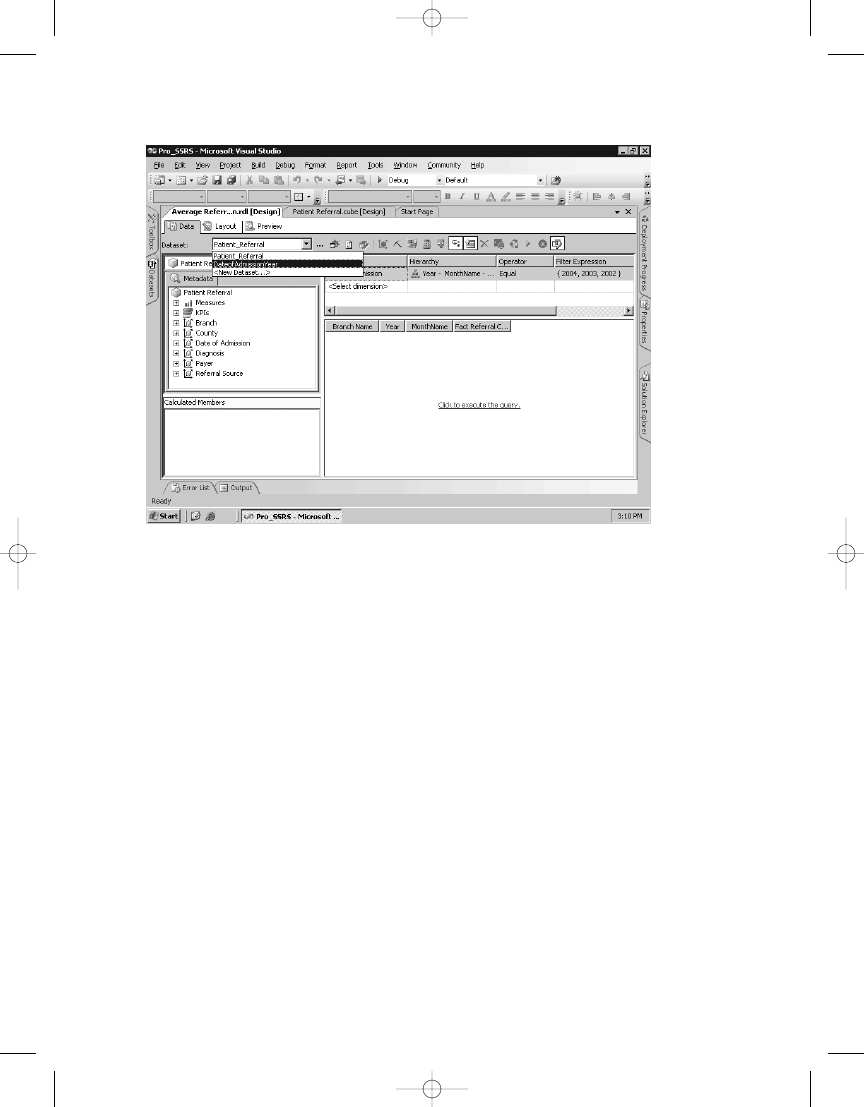
Figure 10-12.
Viewing the two datasets for the Average Referrals to Admission report
C H A P T E R 1 0
■
D E L I V E R I N G B U S I N E S S I N T E L L I G E N C E W I T H S S R S
302
Select the Patient_Referral dataset, and then click the ellipsis button to the right of the
Dataset drop-down list. The data source for this dataset is PatRef_DS. If you click the ellipsis
button on the Dataset drop-down list and then click the Edit button, you can see that the con-
nection string that points to the cube Patient Referral on server hwcvs26, one of the servers
used for the book. We did not set PatRef_DS to localhost, as we did with other data sources, so
that we could show you how to set up the dataset and how to change the connection string.
The type of data source is Microsoft SQL Server Analysis Services. You will need to change the
data source server from hwcvs26 to your SSAS server name or localhost if you are running SSAS
locally. You can do that easily by clicking the Edit button and changing the Server Name field
to your server in the Connection Properties dialog box, as shown in Figure 10-13.
4983ch10.qxd 10/7/05 11:18 AM Page 302
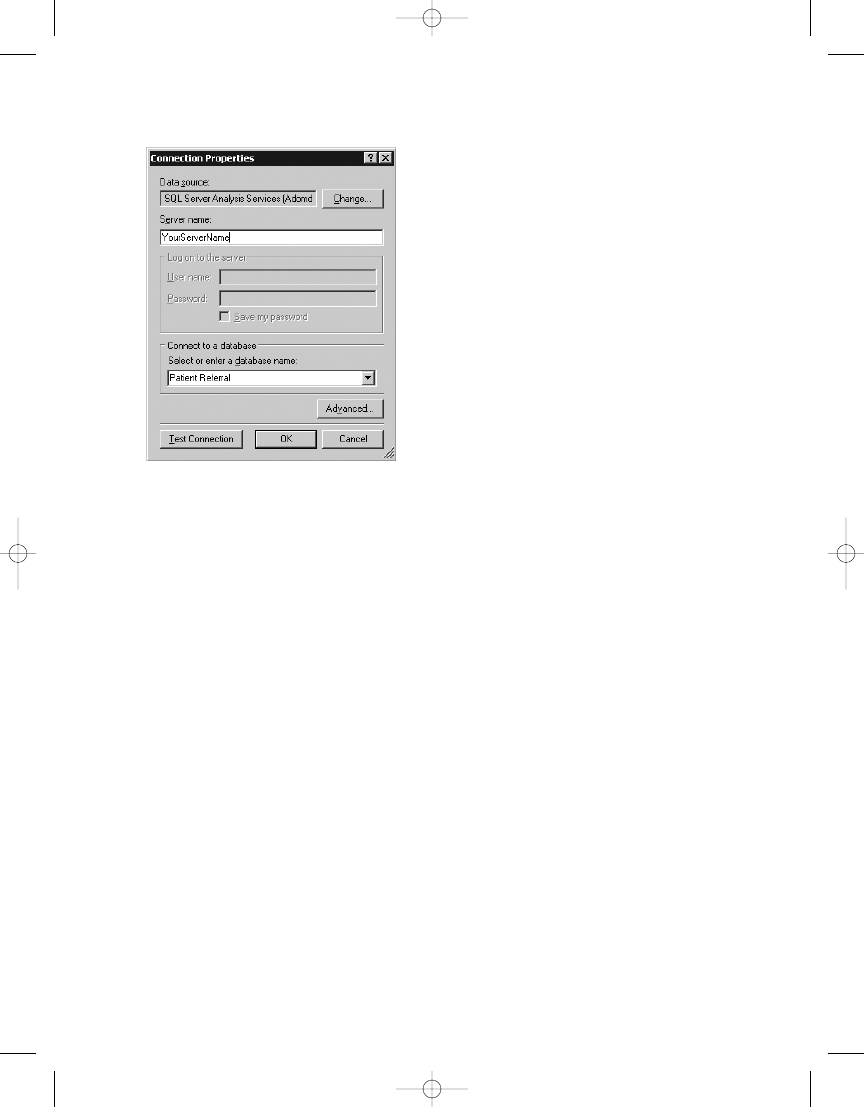
C H A P T E R 1 0
■
D E L I V E R I N G B U S I N E S S I N T E L L I G E N C E W I T H S S R S
303
With the datasets configured properly for your SSAS environment, you will next look at
how you build the MDX queries.
Working with the Graphical MDX Query Builder
One of the great new features in SSRS for SQL Server 2005 is the graphical MDX query builder.
MDX is a fairly large, complex language that is prone to syntactical errors. You must innately
understand it to truly deliver precision data from SSAS cubes. Having and using a graphical
query tool to form the base MDX query, in much the same way that developers use the graphi-
cal query designer for T-SQL, reduces common syntax errors and speeds development of the
query.
With the Average Referral to Admission report open to the Data tab, notice that you have
several dimensional elements listed: BranchName, Year, MonthName, Time To Admission, and
Fact Referral Count
. By default the report will open in the graphical design mode, as shown
in Figure 10-14, and not the generic query designer. The design modes are toggled with the
Design Mode button on the right of the toolbar. In the graphical design mode, the dimensional
elements were dragged and dropped directly in the window from the Metadata pane where the
elements are listed. If the Auto Execution button is selected, which it is by default, whenever
elements are dragged and dropped, the query executes, and the data results are displayed.
Figure 10-13.
Connection properties of the PatRef_DS data source
4983ch10.qxd 10/7/05 11:18 AM Page 303
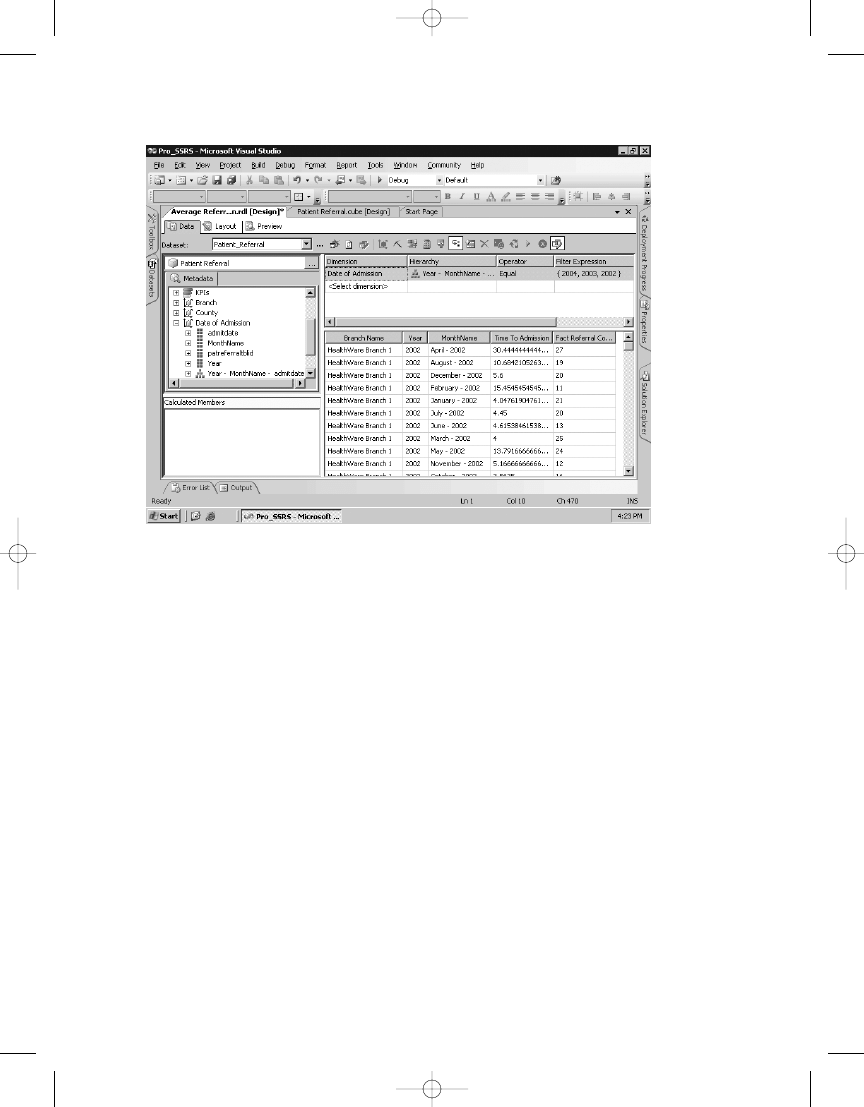
Figure 10-14.
Output from graphical query builder
Instead of a multidimensional view of the data, as you saw when you queried the same
cube in the Patient Referral cube browser, SSRS sees the data two-dimensionally, with rows
and columns. An SSRS report can access data from a cube; however, it is necessary to arrange
the data two-dimensionally because this is how the report will aggregate the data when it sums
and totals the measured values, in this case Time to Admission and Fact Referral Count. We
have also applied a filter to the query so that only the years from 2002 through 2005 will be
selected.
You can use several buttons on the toolbar to modify the properties of the query, such as
showing empty cells or adding calculated members. A calculated member is part of the MDX
query that is created by combining one or more elements into an value that can be used inde-
pendently as a new element. You could, for example, create calculated members to not only
show that the average time to admission for each dimensional elements such as BranchName
and Year but also show the minimum time to admission, using the MIN function, or the maximum
time to admission, using the MAX function. The calculated members would become part of the
overall query that could be used as new measures with data values returned at each dimensional
level.
With the graphical query built and working, let’s now look at the MDX that was created
behind the scenes. You can do this by clicking the Design Mode toolbar button. Figure 10-15
shows the MDX query that returns the selected dimensional elements and measures for the
report.
C H A P T E R 1 0
■
D E L I V E R I N G B U S I N E S S I N T E L L I G E N C E W I T H S S R S
304
4983ch10.qxd 10/7/05 11:18 AM Page 304
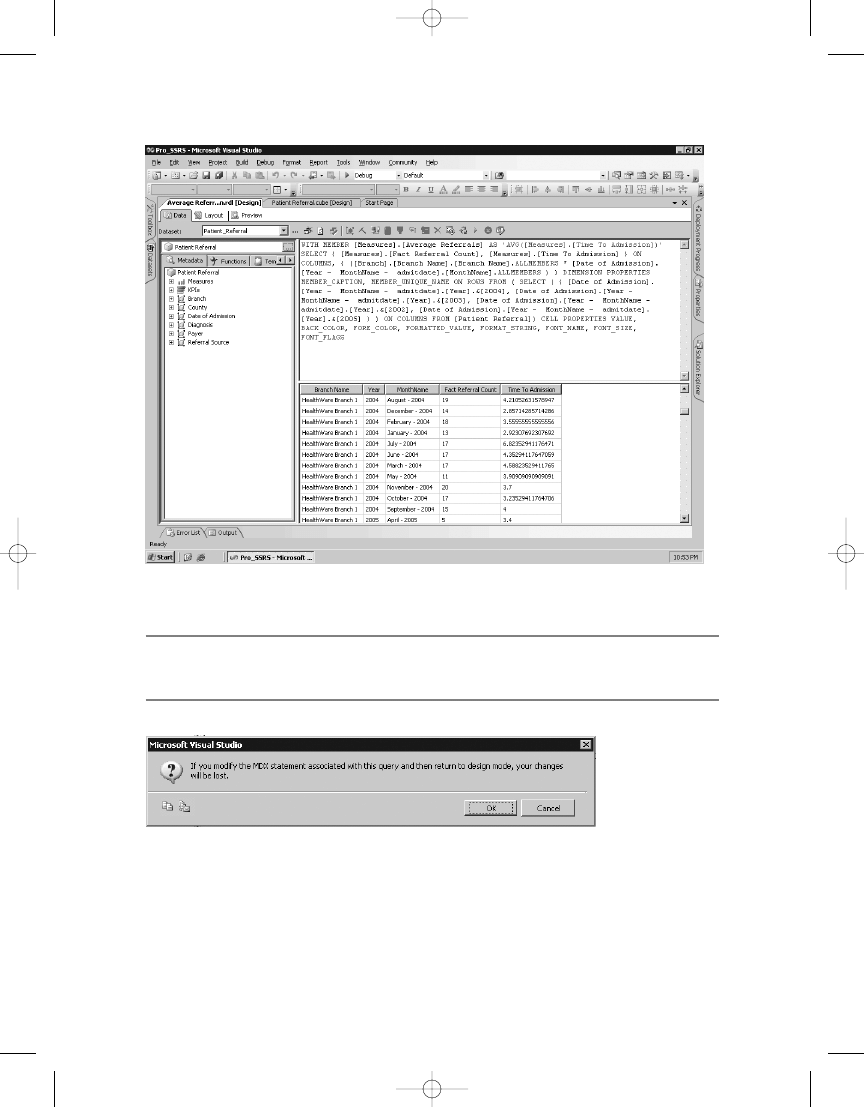
C H A P T E R 1 0
■
D E L I V E R I N G B U S I N E S S I N T E L L I G E N C E W I T H S S R S
305
■
Caution
If you modify the MDX query while in text mode and try to return to design mode, you could
potentially lose any changes you made to the query manually, as shown in Figure 10-16.
Because both reports, Average Time to Admission and Referral to Admission Chart, will be
displayed in a compact Web Part in SharePoint, which we will show how to do in the next section,
we intentionally sized the reports small, with 8-point Arial font and narrow cells. Figure 10-17
shows the Layout tab for the Average Time to Admission report.
Figure 10-15.
MDX query generated graphically
Figure 10-16.
Warning message displayed when altering MDX query
4983ch10.qxd 10/7/05 11:18 AM Page 305
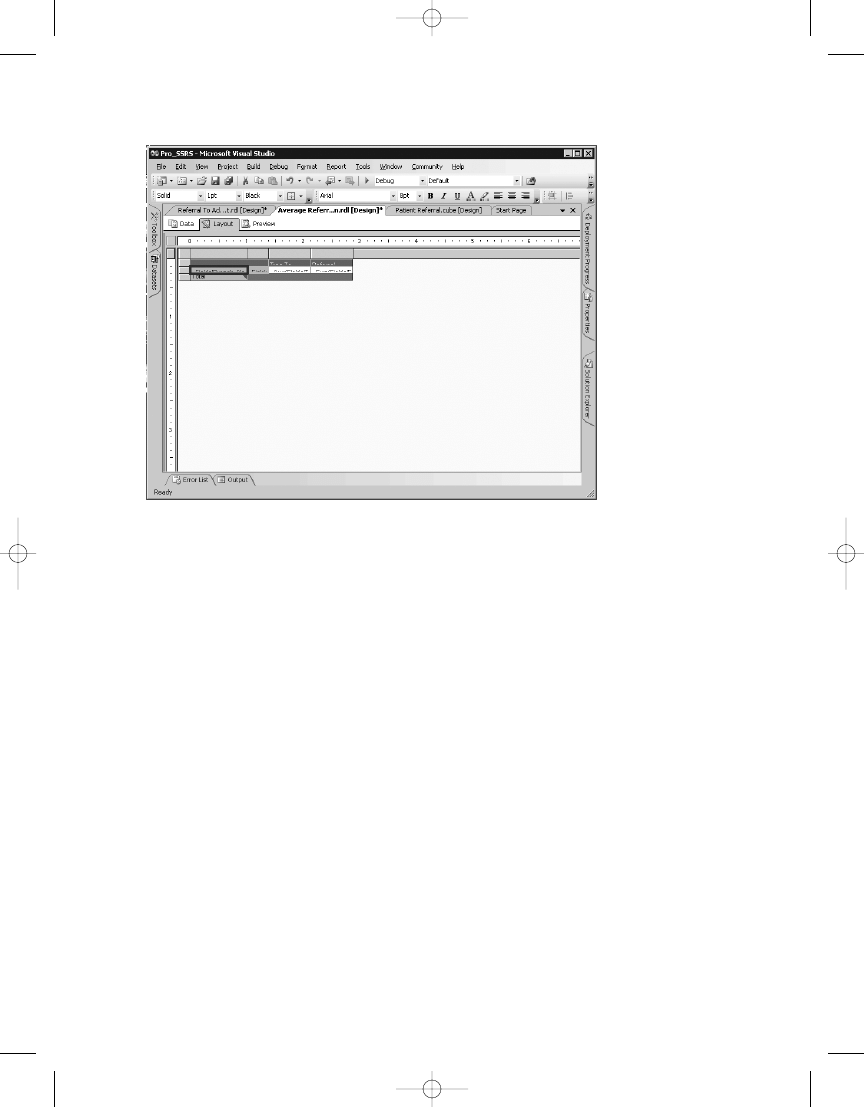
Figure 10-17.
Layout tab for Average Time to Admission report
Finally, let’s preview and then deploy both reports to the report server. With the Pro_SSRS
report project set to the correct target URL for both the server and folder for the project prop-
erties, you can right-click each report in Solution Explorer and select Deploy. If you are unsure
of how to configure the report’s target URL, refer to Chapter 3 where you initially configured
the Pro_SSRS report project. In our case, the target URL will be http://hwcvs26/ReportServer,
and the folder will be Pro_SSRS. Figure 10-18 shows the Average Time to Admission report
displayed in the browser with the URL you will use to place the report in SharePoint Portal
Server. The extra whitespace will be removed in the portal.
C H A P T E R 1 0
■
D E L I V E R I N G B U S I N E S S I N T E L L I G E N C E W I T H S S R S
306
4983ch10.qxd 10/7/05 11:18 AM Page 306
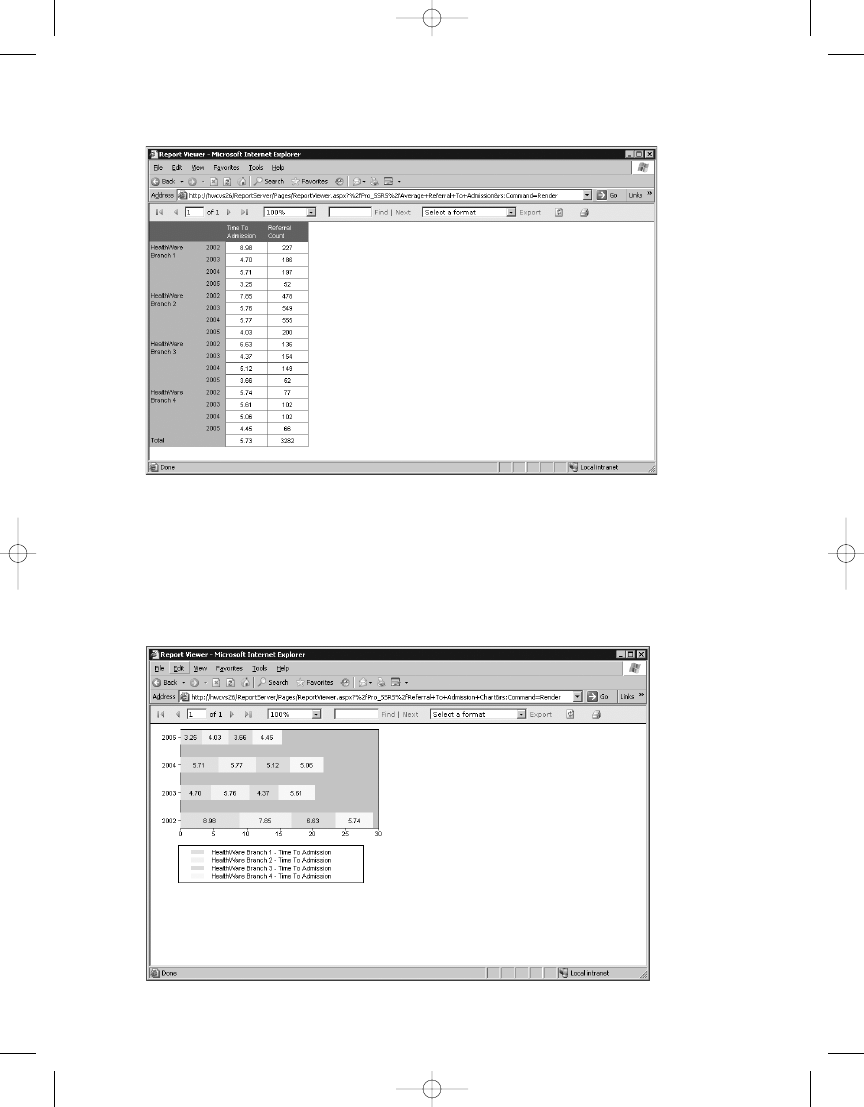
C H A P T E R 1 0
■
D E L I V E R I N G B U S I N E S S I N T E L L I G E N C E W I T H S S R S
307
Now let’s look at the Referral to Admission Chart report that is based on the same Patient
Referral cube but displays the data graphically using a stacked bar chart as opposed to the matrix
style of the Average Time to Admission report. Figure 10-19 shows the Referral to Admission Chart
in the browser.
Figure 10-18.
Previewing Average Time to Admission in a browser
t in a browser
4983ch10.qxd 10/7/05 11:18 AM Page 307

C H A P T E R 1 0
■
D E L I V E R I N G B U S I N E S S I N T E L L I G E N C E W I T H S S R S
308
Incorporating SSRS with SharePoint Portal Server
SharePoint Portal Server and Windows SharePoint Services (which are components of Microsoft
Office and Windows Server 2003, respectively) are important additions to the BI platform,
because they serve as an intranet portal site, providing document management, collaboration,
subscription services, and extensibility through custom Web Parts. Web Parts encapsulate Web
content and services, such as news feeds, shared documents, or even other Web sites. Microsoft
realized the need for custom SSRS Web Parts that link directly to reports and included these
Web Parts for SSRS for SQL Server 2000 Service Pack 2, and they are also included with SSRS
for SQL Server 2005. Prior to the release of the SSRS Web Parts, you could still add reports to
a SharePoint page, but the procedure was not as simple and lacked properties specific to
the configuration of the report URL. In the following sections, we will show how to use the
SharePoint Web Part to embed a link to the two SSRS reports created in the previous section,
Average Time to Admission and Referral to Admission Chart, that will become part of an over-
all health-care portal page.
■
Note
In our environment, we have a Windows SharePoint Services virtual server called
hwcvs21
where
we will create the Web Parts. Assuming you have a Windows SharePoint Services or SharePoint Portal Server
system in your domain, all that is required is to follow the installation procedure to add the SSRS Web Parts
to the SharePoint server. You just need to execute the following from a command prompt on the SharePoint
Server, ensuring that the paths to the
STSADM
utility and the
rswebparts.cab
file are correct for your envi-
ronment:
C:\Program Files\Common Files\Microsoft Shared\web server extensions\60\BIN\
STSADM.EXE -o addwppack -filename "C:\Program Files\Microsoft SQL Server\90\Tools\
Reporting Services\SharePoint\RSWebParts.cab"
.
Creating a Web Part Page
The first step to prepare to add the custom SSRS Web Parts is to create a Web Part Page by
navigating to the portal home page (http://hwcvs21/default.aspx in this case) and clicking
Create on the toolbar, as shown in Figure 10-20.
This will open the Create Page Web page, which lists the many types of pages you can cre-
ate. You are interested in the Web Pages link at the bottom of the page, which includes the Web
Part Page creation link. Click Web Part Page, and follow the steps to name the page and select
the layout. Enter Patient Referral as the name, and select the Header, Footer, 2 Columns, 4 Rows
option as the layout template, as shown in Figure 10-21. Then click Create.
4983ch10.qxd 10/7/05 11:18 AM Page 308
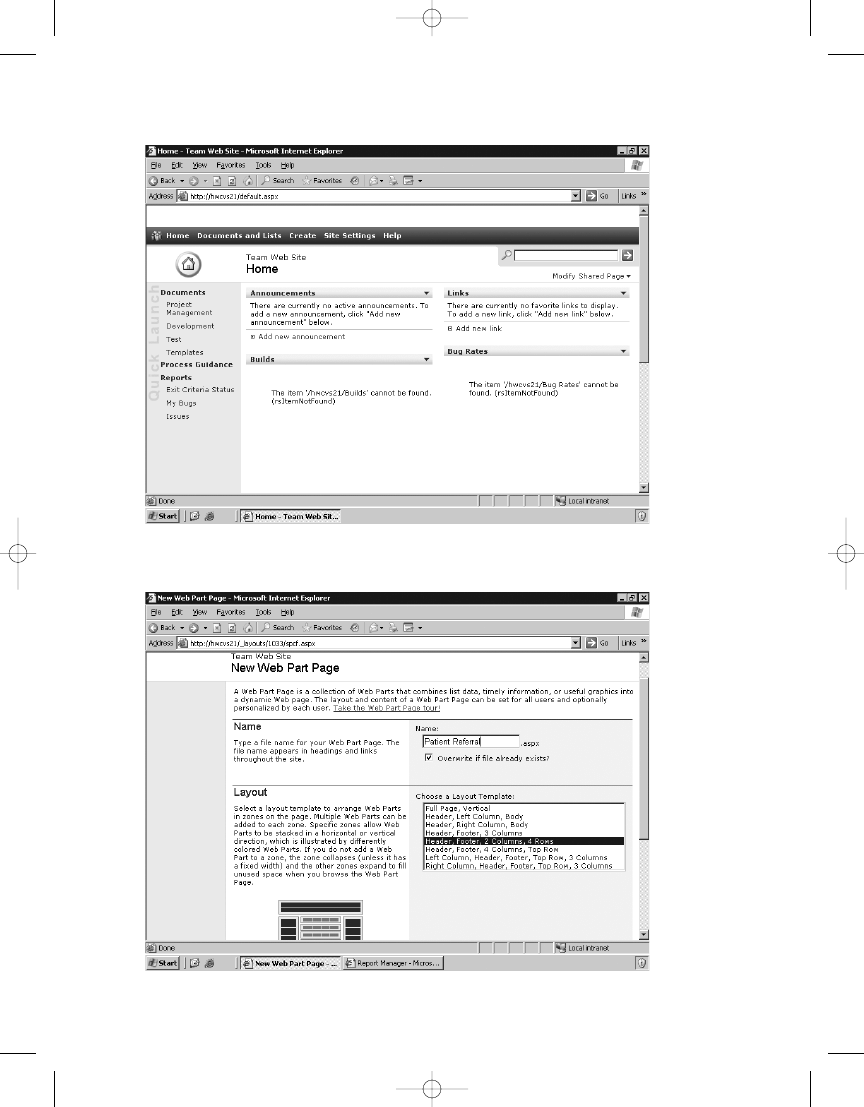
C H A P T E R 1 0
■
D E L I V E R I N G B U S I N E S S I N T E L L I G E N C E W I T H S S R S
309
Figure 10-20.
Viewing the SharePoint home portal page
eb Part Page
4983ch10.qxd 10/7/05 11:18 AM Page 309
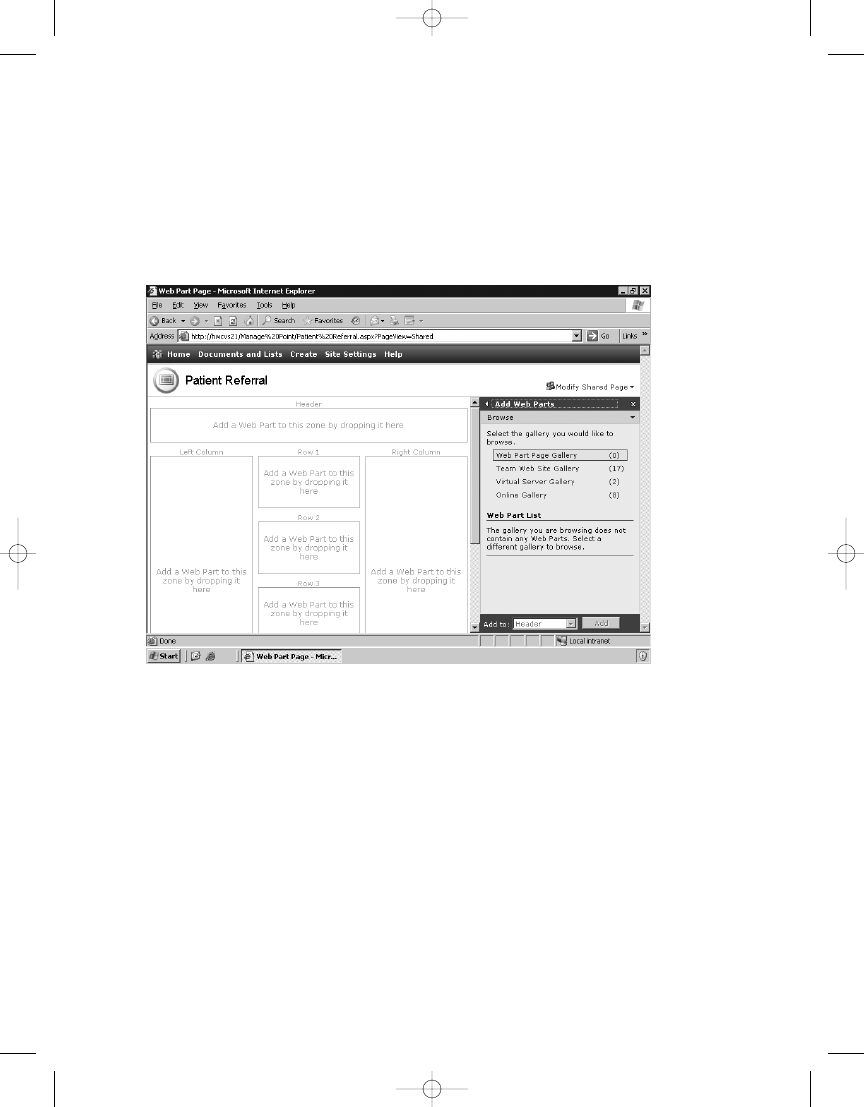
C H A P T E R 1 0
■
D E L I V E R I N G B U S I N E S S I N T E L L I G E N C E W I T H S S R S
310
Figure 10-22.
Blank Web Part Page ready to add SSRS Web Parts
We chose to save the Web Part Page in a document library called Manage Point; however,
you can choose to save the page in whichever document library you choose. The document
library is typically displayed as a link on the home page. As you can see in Figure 10-22, you
are taken to the design layout of the page where you can view all the available Web Parts that
are installed on the SharePoint server as well as the design area where the Web Parts will be
placed.
Adding Web Parts
Clicking the Virtual Server Gallery shows the two available SSRS Web Parts that were installed
from the RSwebparts.cab file, as shown in Figure 10-23. These two Web Parts are Report
Explorer and Report Viewer.
4983ch10.qxd 10/7/05 11:18 AM Page 310
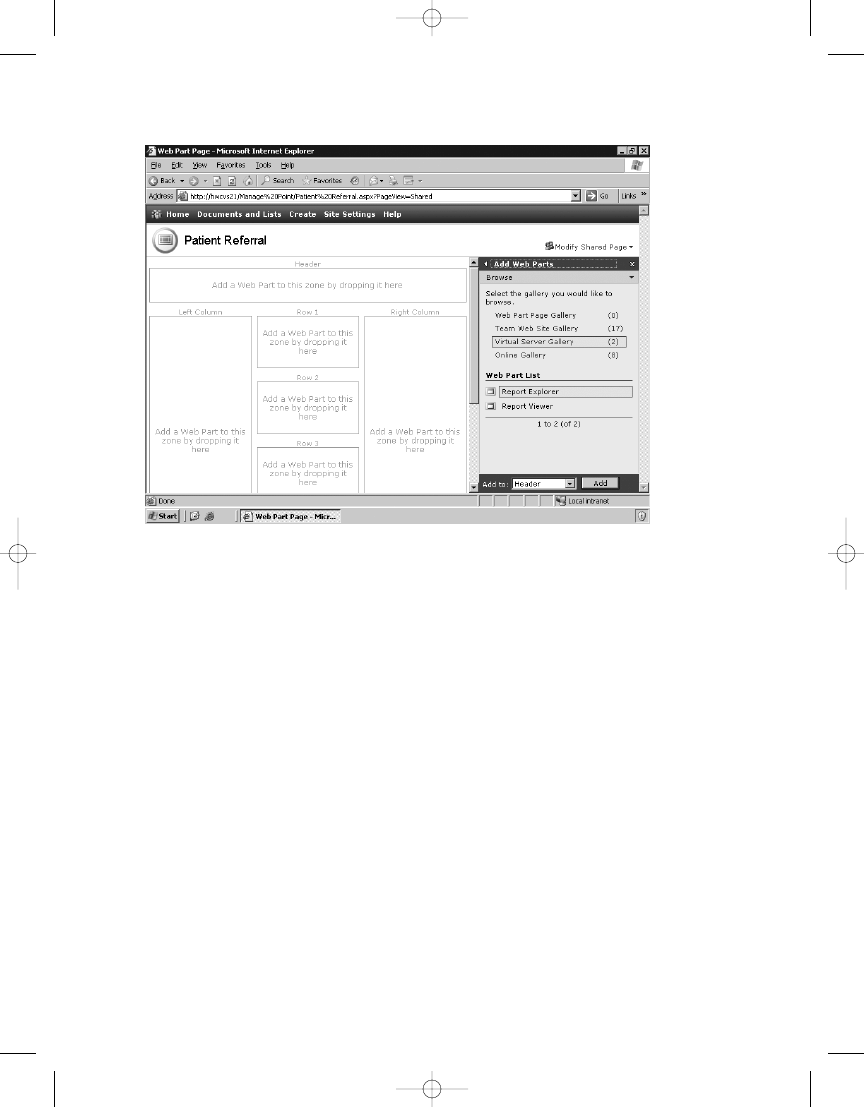
C H A P T E R 1 0
■
D E L I V E R I N G B U S I N E S S I N T E L L I G E N C E W I T H S S R S
311
Figure 10-23.
Report Explorer and Report Viewer Web Parts
You can use the Report Explorer Web Part to link directly to the Report Manager Web page
and to a specific folder. Add the Report Explorer Web Part to the top portion of the Patient
Referral page by dragging and dropping it directly into the Add a Web Part to This Zone by
Dropping It Here area. To modify the properties of the Report Explorer Web Part to link to the
report server URL, select the drop-down arrow on the Report Explorer window, and then click
Modify Shared Web Part. You can set several properties for the Report Explorer Web Part; the
two most important are the Report Manager URL and the Start Path properties. We have filled
in these property values for our server and start path in Figure 10-24. Once the values are
filled, click Apply; the Report Explorer displays the contents of the Pro_SSRS folder on the
report server. The two reports, Average Referral to Admission and Referral to Admission Chart,
are listed and can be executed from within the Report Explorer Web Part. The report, when
clicked, will open in a new browser.
4983ch10.qxd 10/7/05 11:18 AM Page 311
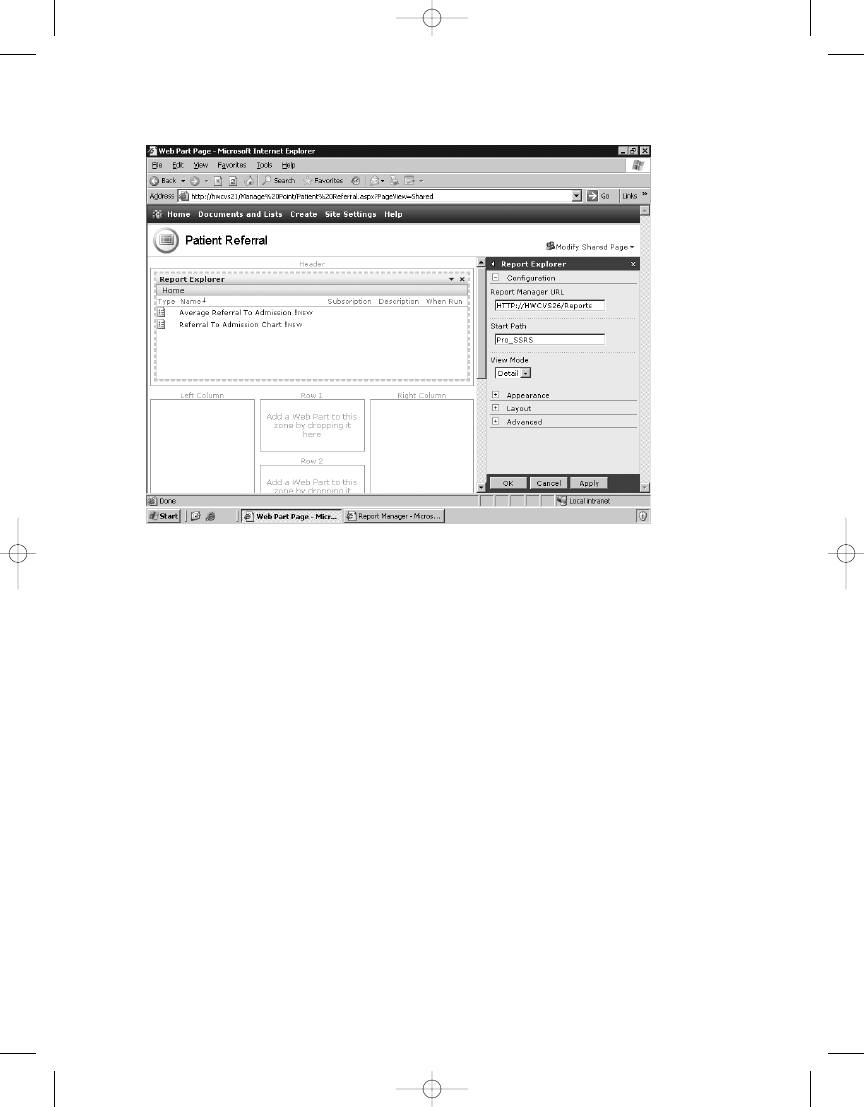
C H A P T E R 1 0
■
D E L I V E R I N G B U S I N E S S I N T E L L I G E N C E W I T H S S R S
312
Figure 10-24.
Report Explorer URL and Start Path properties
When you click OK to complete the modification, the full page with the Report Explorer
will be displayed. To add the other Web Part, the Report Viewer, you need to click Modify
Shared Page in the upper-right corner of the Patient Referral page, choose Add Web Parts, and
then click Browse. Next, click Virtual Server Gallery, and then drag one Report Viewer to the
left column on the page and one to the first zone in the first middle row so that it looks like
Figure 10-25.
4983ch10.qxd 10/7/05 11:18 AM Page 312
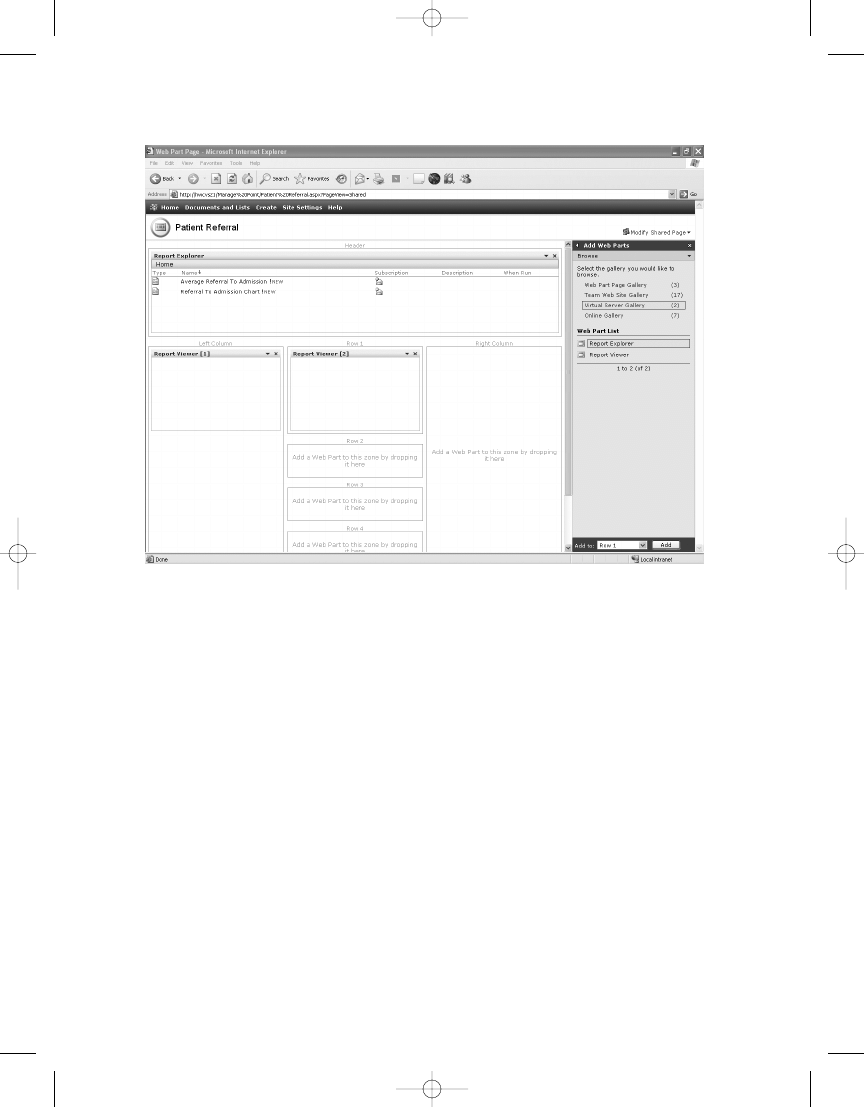
C H A P T E R 1 0
■
D E L I V E R I N G B U S I N E S S I N T E L L I G E N C E W I T H S S R S
313
Next, use the drop-down arrow on the Report Viewer [1] Web Part, and select Modify
Shared Web Part. Again, enter the Report Manager URL property, and this time enter the path
to the Average Referral to Admission report, remembering to include a slash (/) in the path, as
shown in Figure 10-26. Also, choose None for the Toolbar Size option. Finally, expand the
Appearance section, and set the Height and Width properties to 4 and 4.5 inches, respectively.
When you click Apply, the report expands to fit in the first column as it should.
Figure 10-25.
Adding Report Viewer Web Parts
4983ch10.qxd 10/7/05 11:18 AM Page 313
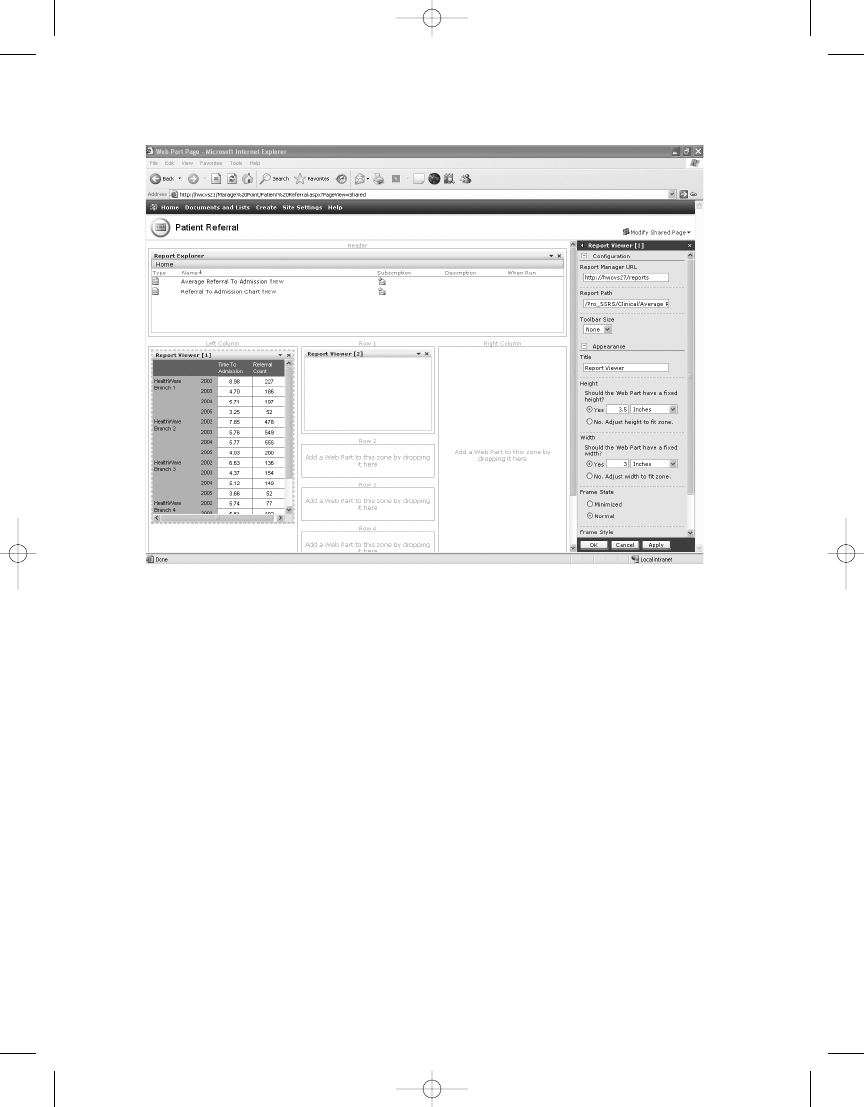
C H A P T E R 1 0
■
D E L I V E R I N G B U S I N E S S I N T E L L I G E N C E W I T H S S R S
314
Figure 10-26.
Setting the Report Viewer URL and Report Path properties
Leave the title as Report Viewer because even if you changed the title, SharePoint sees the
Report Viewer Web Part as a single item and will continually rename it sequentially as Report
Viewer [X], where X is the number of the individual Report Viewer control on the page. Since
you are adding two Report Viewer controls ultimately for the example, the names will be Report
Viewer [1] and Report Viewer [2]. This is a limitation of SharePoint.
Next, follow the same steps to add the Referral to Admission Chart report, replacing the
height and width to be 4.1 inches by 4.5 inches and set the toolbar to Small instead of None.
This will allow users to export the chart to Microsoft Excel if they so desire.
The end result appears in Figure 10-27.
4983ch10.qxd 10/7/05 11:18 AM Page 314
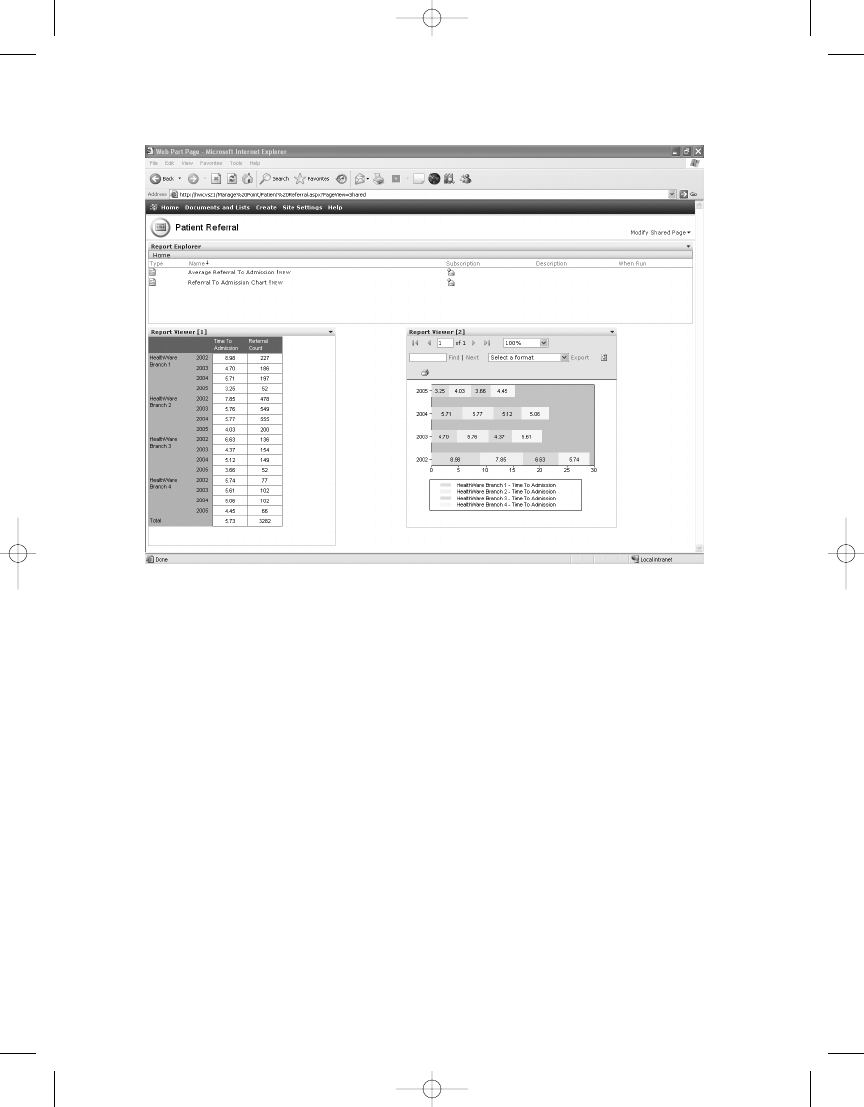
C H A P T E R 1 0
■
D E L I V E R I N G B U S I N E S S I N T E L L I G E N C E W I T H S S R S
315
One final feature of SSRS Web Parts is that they can be connected. In other words, you can
connect Report Explorer and Report Viewer so that when a report is clicked inside the Report
Explorer, it is displayed in the connected Report Viewer. We mentioned earlier when working
with Microsoft CRM that you can add the sample CRM reports to SharePoint to tie both tech-
nologies together in a single portal. We will show how to do that now and take advantage of
the connectable Web Parts.
To begin, modify the Patient Referral page that you have been working with by clicking
Modify Shared Page, clicking Add Web Parts, and then clicking Browse. On the Virtual Server
Gallery, drag another Report Explorer Web Part to the space beneath the first Report Explorer
you added originally so that the page looks like Figure 10-28.
Figure 10-27.
Web Parts added to SharePoint
4983ch10.qxd 10/7/05 11:18 AM Page 315
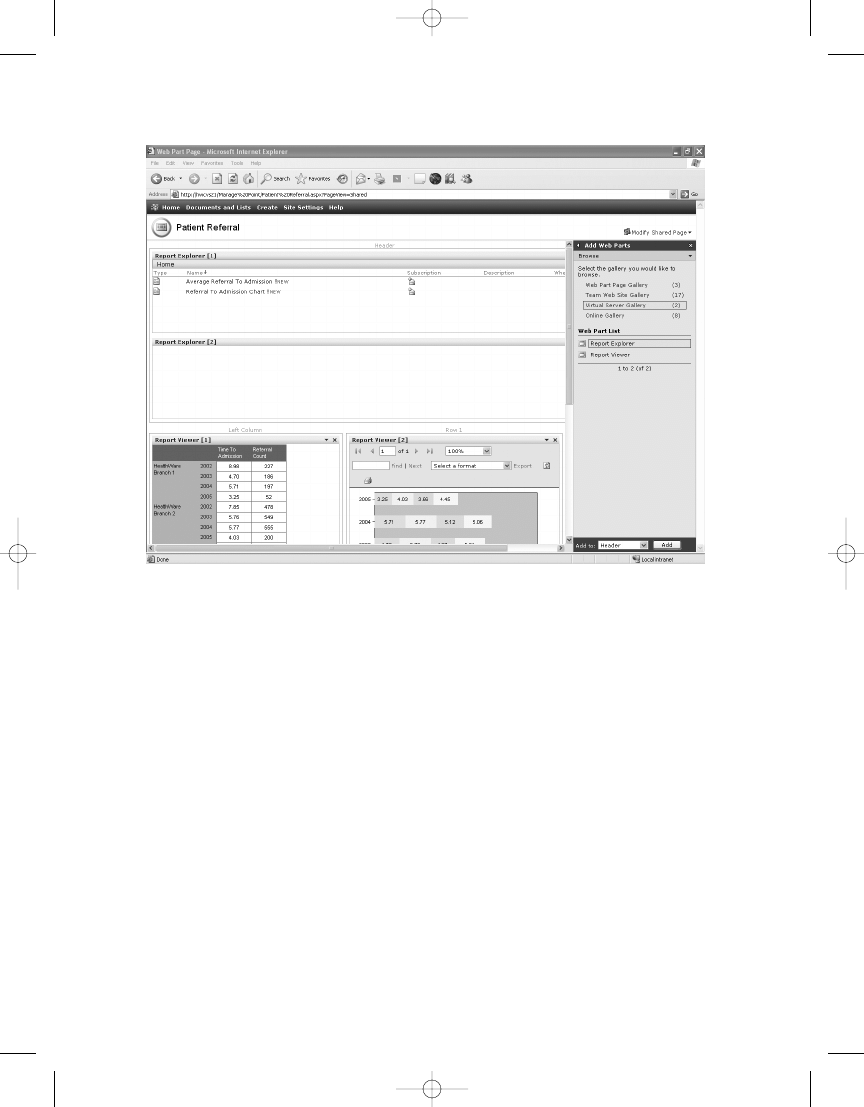
C H A P T E R 1 0
■
D E L I V E R I N G B U S I N E S S I N T E L L I G E N C E W I T H S S R S
316
Figure 10-28.
Adding a second Report Explorer
Next, modify the newly added Report Explorer Web Part, and add the link to the published
Microsoft CRM sample reports. Notice in Figure 10-29, if you leave the View mode of Report
Explorer set to Detail, you can see not only the reports, in this case Customer Account Details
and Lead Summary, but also the description of the reports if one exists.
4983ch10.qxd 10/7/05 11:18 AM Page 316
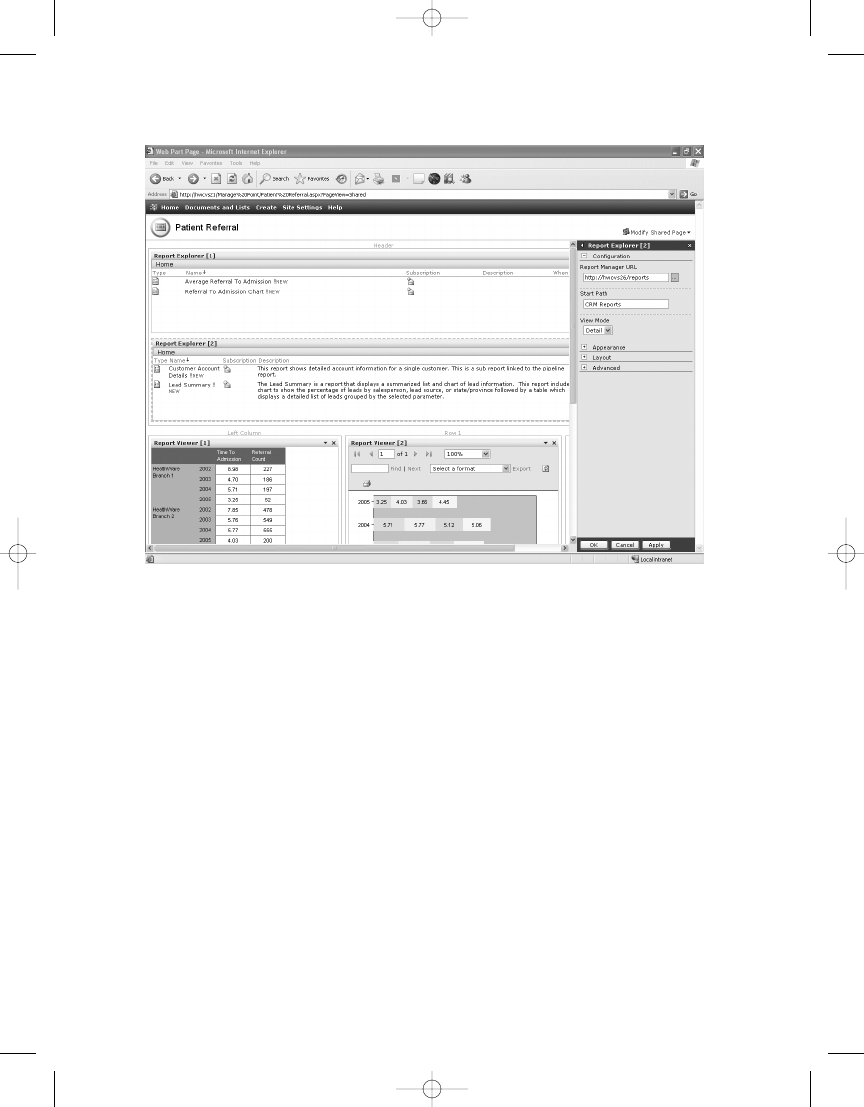
C H A P T E R 1 0
■
D E L I V E R I N G B U S I N E S S I N T E L L I G E N C E W I T H S S R S
317
The next step to join the Web Parts is to click Modify Shared Web Part in the drop-down list
on Report Viewer [1]. Once in design mode, the Connections property for the Report Viewer Web
Part is available, as shown in Figure 10-30. Report Viewer [2] has been minimized for a better
view. Notice that the Report Viewer can get a report from either Report Explorer [1] or Report
Explorer [2], as these both now exist on the page. Choose Report Explorer [1].
Figure 10-29.
Linking Report Explorer to CRM reports
4983ch10.qxd 10/7/05 11:18 AM Page 317
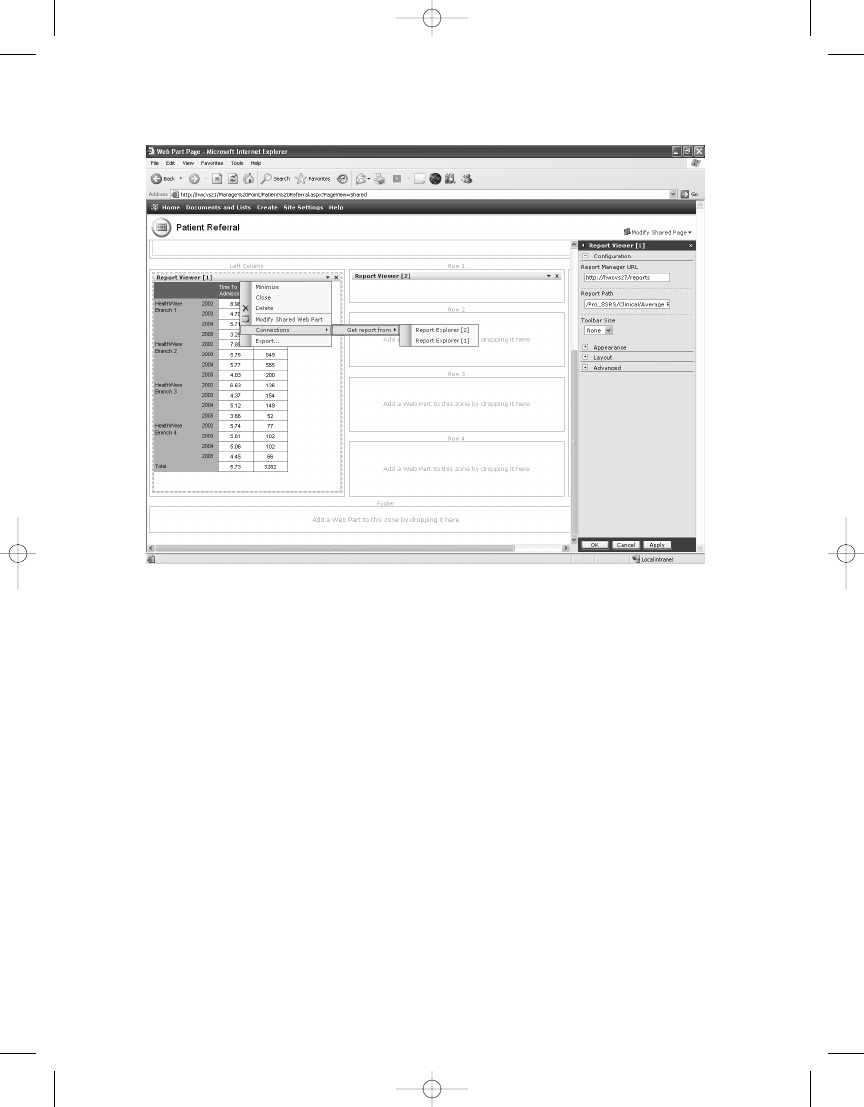
C H A P T E R 1 0
■
D E L I V E R I N G B U S I N E S S I N T E L L I G E N C E W I T H S S R S
318
Figure 10-30.
Adding a Report Explorer connection to Report Viewer
Follow the same steps to add a connection to Report Explorer [2] for Report Viewer [2].
When you click OK to refresh the page and return to Shared View mode from design mode,
you will notice that each Report Viewer still launches its default reports that were assigned to
it in previous steps; however, they now both have the ability to contain other reports that are
listed in each of the Report Explorer Web Parts. As Figure 10-31 shows, Report Viewer [2] will
contains the Lead Summary report launched from Report Explorer [2], and Report Explorer [1]
contains the Referral to Admission Chart report from Report Explorer [1]. Also, the Web Parts
do not automatically resize to fit the report they contain. It is possible to set the size of the Report
Viewer Web Part to automatically fit the zone it is in, but even this will not guarantee a perfect
fit for a report. When designing SSRS report for Web Parts, it is important to consider the size
and placement of the reports on the page.
4983ch10.qxd 10/7/05 11:18 AM Page 318
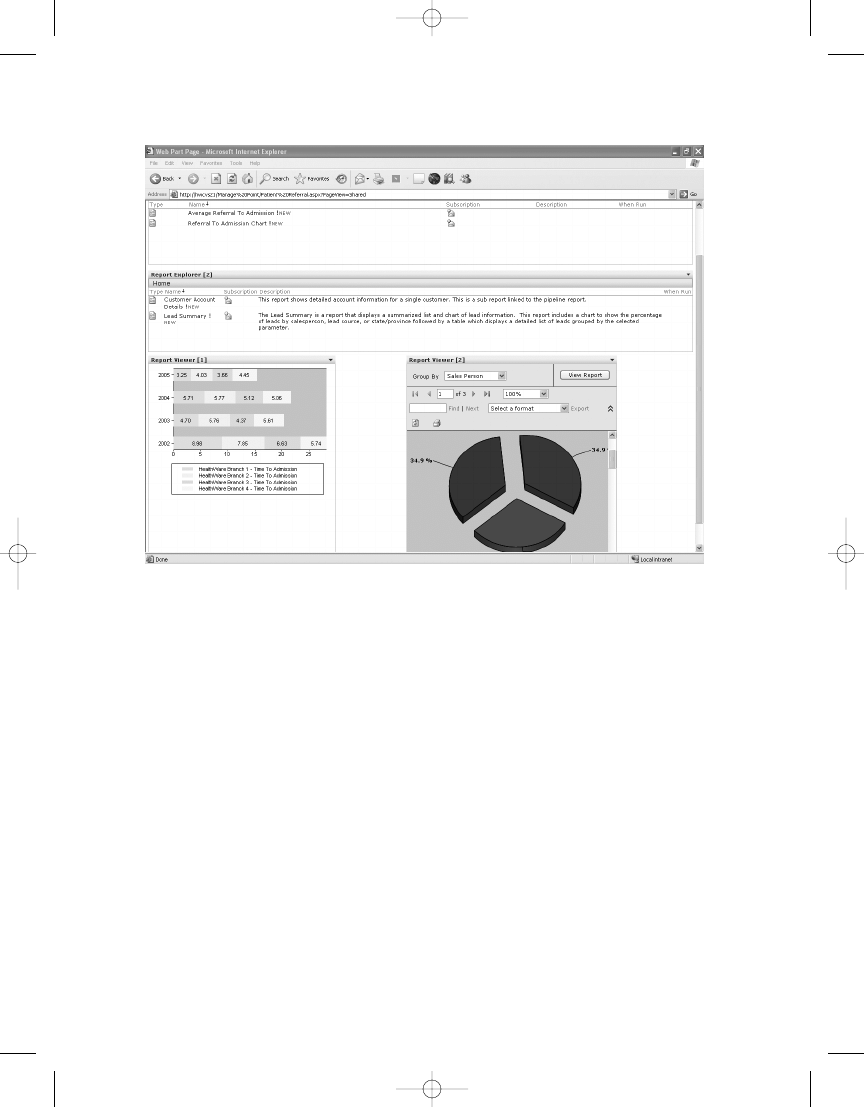
C H A P T E R 1 0
■
D E L I V E R I N G B U S I N E S S I N T E L L I G E N C E W I T H S S R S
319
Summary
In this chapter, we showed how to incorporate SSRS into a BI model, specifically covering the
business model of a software development company and health-care agency deploying a custom
BI portal. Understanding how to transform and analyze the data that drives your business will
help you make important business decisions. Delivering that data to decision makers is a pivotal
link in the BI chain. With SSRS, Microsoft has provided organizations with another tool that can
easily tap into and extend the reach of crucial data. From business applications such as Microsoft
CRM to custom project management solutions, SSRS easily utilizes many types of data and can
deliver it in a variety of formats. Working with other applications and products in the Microsoft
BI platform—such as SharePoint Portal Server, Analysis Services, and Office—SSRS will prove
to be an invaluable BI tool now and in the future.
Figure 10-31.
Launching reports to the Report Viewer Web Parts from Report Explorer
4983ch10.qxd 10/7/05 11:18 AM Page 319

4983ch10.qxd 10/7/05 11:18 AM Page 320

Performing Ad Hoc Reporting
Using Report Builder
I
f you follow newsgroups like we do, then you have most likely noticed the prodigious number
of postings asking whether SSRS offers a report builder application with enough functionality
to let users design their own reports without knowing the underlying data structure or being
proficient with full development environments such as Visual Studio or BIDS. When SSRS was
released for SQL Server 2000, such a tool, also known as ad hoc reporting, was available only in
third-party applications, such as ActiveViews. The alternative to purchasing a product for ad hoc
reporting was to create your own; in fact, Microsoft offered several white papers on the topic
with code samples and step-by-step guidelines. Fortunately for everyone, Microsoft decided
to include a full-blown ad hoc report builder in SSRS for SQL Server 2005. Further, Microsoft
decided to include it in the Workgroup and Standard editions of SQL Server, when it was origi-
nally slated to be included only in the Enterprise edition.
In this chapter, you will explore Report Builder and its components. As you will see, even
though the user compiling the report needs to do some design work, the administrator still
needs to design the report model that provides data to the Report Builder client application.
We will walk you through the process of using Report Builder from two vantage points—devel-
oping and publishing a report model based on user input and then creating your own ad hoc
reports based on that model. The three steps we will cover are gathering user feedback, creat-
ing and publishing the report model, and finally testing the report model by creating reports
with Report Builder.
Getting feedback: Since we have worked alongside developers for many years, we know that
one of the biggest problems with delivering a new application is that sometimes users get
the application and expect it to do more than it does, or expect it to do something in a dif-
ferent way. The expectation from a user’s vantage point is that the system should do exactly
what they need. But for a developer, if it doesn’t do it in version 1, it will have to do it in
version 2. You can avoid this conflict by implementing standard design practices, which
always take user feedback into consideration up front. This process is especially important
when the same application will be delivered to different companies with users from dif-
ferent backgrounds, each with their own interpretations of how a process should work. In
the past few decades, a system analyst would take information from groups of users and
translate this to a technical diatribe that the developer could slowly digest. Today, most
system analysis work is done directly by the developer, who interacts with users during
321
C H A P T E R 1 1
■ ■ ■
4983ch11.qxd 10/7/05 11:20 AM Page 321

C H A P T E R 1 1
■
P E R F O R M I N G A D H O C R E P O RT I N G U S I N G R E P O RT B U I L D E R
322
the design phase of the project. Before we cover how to build a report model to be used by
report designers, we will provide a sampling of some of the feedback we have received
about the kinds of reports users would like to see.
Building the report model: The report model is the heart of Report Builder. Report models
serve as semantic descriptions of the underlying data source. Because the report model
can simplify a potentially complex overall database schema by selecting individual tables,
fields, and values, it can be likened to a SQL Server view. Indeed, a key component of the
report model, as you will see in this chapter, is a data source view. Once DBAs or developers
have created a report model that contains the data to meet the requirements of the users,
they can publish it to the report server where it can be used by Report Builder, which is
the client-side report designer. All the data provided to Report Builder comes from pub-
lished report models. We will show how to create and publish models in this chapter based
on user feedback.
Using Report Builder: Report Builder is the design application used to create and publish
SSRS reports, without requiring a full development environment such as Visual Studio or
BIDS. Report Builder relies on prepublished report models as its data sources. As you will
see, the interface for Report Builder is intuitive; in fact, it is ideal for users who need to
quickly create reports based on predefined report templates. Report Builder not only
allows users to design reports but also serves as the publishing tool to deploy the completed
report directly to the report server.
Getting User Feedback
At this point in the book, you have built a report, Employee Service Cost, that breaks down the
cost of health-care visits at several levels. You designed this report using BIDS, and it contains
several grouping levels, interactive sorting, and drill-down functionality. The data source for
this report is a stored procedure that provides the desired fields from several tables in the
Pro_SSRS
database. Like the reports you will build with Report Builder, this stored procedure
and report were created based on feedback from users who needed it. One objective when
creating the stored procedure was to design it not only to address the requirements for one
report but to be versatile enough to be reused for other similar reports. We will cover this issue
when we show how to build a report model to meet the needs of the users and the report
designers who will be creating and publishing the reports with Report Builder.
In the health-care industry (namely, in post-acute care such as home health and hospice),
you have to follow many reporting requirements for state and federal agencies. From cost
reports to patient admission and discharge information, different reports are needed by differ-
ent departments for different reasons. One group of reports that is used by every department
is the patient census. This report shows all the patients who are currently admitted to the
health-care facility and who are receiving services. The report can be as simple as an alphabet-
ized listing of patient names or as detailed as all the demographic information about each patient,
such as where they live and who to contact in case of an emergency.
Since the patient census is the most frequently requested report for customization, we
will use it as the example in this chapter for the report model, making sure we provide enough
data to meet both current and future needs.
4983ch11.qxd 10/7/05 11:20 AM Page 322

C H A P T E R 1 1
■
P E R F O R M I N G A D H O C R E P O RT I N G U S I N G R E P O RT B U I L D E R
323
For the patient census report example, imagine that users have requested to see a daily
total of patients who have been admitted to the facility. Such patients all have common data
associated with them that is important when looking at a census. The information answers
these types of questions:
• What is the patient’s primary diagnosis?
• What branch office is the patient currently admitted to?
• What is the patient’s length of stay in the facility?
• How many active patients are in each branch currently?
• What is the patient’s address, phone number, and other key demographic information?
(This type of census report, often referred to as a face sheet, shows a lot of information about
a patient in a compact location.)
• If the patient was discharged, when did that occur and what was the reason? Is it
because they became well, or did they transfer to a hospital?
■
Note
The type of information we are discussing in this chapter is considered to be PI data, which, thanks
to HIPAA, needs to be tightly guarded and accessible only to those who are permitted to use it. Chapter 9
covers how to secure access to data delivered through SSRS.
You can answer all these questions and more with a single query, which can form the
foundation of the report model. So, in the Pro_SSRS database, you will join several tables into
a single data source view to provide the information needed to deliver the patient census. You
have used most of these tables already when developing other reports, but we will review the
database schema of the associated tables before showing how to build the report model.
These are the tables you will use in this chapter’s example:
• Admissions
• Branch
• Diag
• Discipline
• DocumentImage
• PatEMRDoc
• Employee
• PatDiag
• Dischg
• Patient
4983ch11.qxd 10/7/05 11:20 AM Page 323

C H A P T E R 1 1
■
P E R F O R M I N G A D H O C R E P O RT I N G U S I N G R E P O RT B U I L D E R
324
Each table contains specific information that is relevant to the individual patient’s admission
history, and together they will provide enough data to create many kinds of census reports for
many departments within the health-care agencies. You know the kinds of questions you will
need to answer, and the tables have been designed to deliver that information based on direct
feedback and requests for users. Now let’s move on to designing the query and building the
report model.
Introducing the Report Model
Just because you don’t understand the intricacies of putting all the parts of a car engine together
does not mean you can’t drive, right? The same can be said for report designers who will
design and publish reports using the ad hoc Report Builder. In this case, you have little need
to understand the pieces and parts of the database structure in order to build reports. It is
unavoidable, though, that someone must understand the database schema, just as mechanics
must understand brake pads and fan belts. Building a versatile report model, which the report
designer will use to create reports, will most likely fall under the authority of the DBA or data
analyst, who will have an intimate understanding of the data sources. In this section, we will
show how to use the feedback gathered from the report consumers to develop a report model
for the patient census reports that will serve to make the data easily accessible with logical and
intuitive field names.
You will perform the following procedures to create the report model for the Patient Census
report model:
1.
Add a report model project to the existing Pro_SSRS solution using BIDS.
2.
Create a data source.
3.
Create a data source view.
4.
Create the Patient Census report model based on the data source view.
5.
Publish the Patient Census report model to the SSRS server.
The process of building a report model consists of many individual steps, many of which
are controlled entirely by stepping through available wizards. A report model can be complex
or simple, based on your individual needs. For the sake of brevity, we will keep the sample
model as simple as possible; you will be able to answer the feedback questions for the patient
census, and you will be able to create and publish your own report model without any issues.
Adding a Report Model to BIDS
In this section, you will add a report model project to the Pro_SSRS solution that you have been
working with throughout the book. When you open the solution, you will notice an already
created report model called Patient Census Book. If you would like to publish the Patient
Census Book report model as it is in the project to your SSRS server and begin working with the
client-side Report Builder application, that is fine. (In that case, just skip to the “Using Report
Builder” section.) To follow the steps to create each piece of a report model, from adding data
sources and data source views to publishing the completed model, read on.
Open the Pro_SSRS solution you have been using thus far. In the Solution Explorer, right-
roject. As you can see in Figure 11-1, you
4983ch11.qxd 10/7/05 11:20 AM Page 324
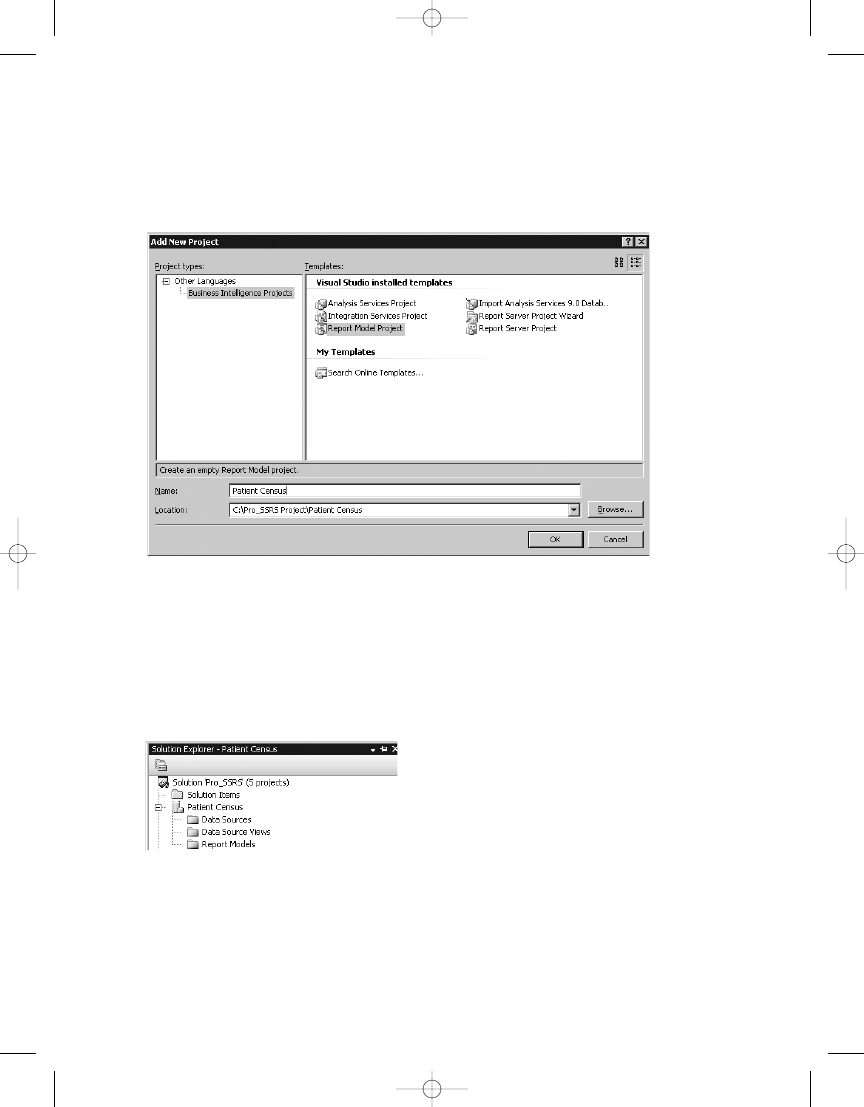
C H A P T E R 1 1
■
P E R F O R M I N G A D H O C R E P O RT I N G U S I N G R E P O RT B U I L D E R
325
Figure 11-1.
Adding a new report model project
Figure 11-2.
Viewing the new Patient Census report model
can use several available project templates. Choose the Report Model Project template, name it
Patient Census, add the appropriate location (in this case C:\Pro_SSRS_Project\Patient Census),
and click OK.
A report model project has three main components: data sources, data source views, and
report models, each one relying on the previous one. In other words, a data source view requires
a data source, just as a report model requires a data source view. If you have successfully added
the Patient Census report model project, you can expand the Patient Census project and see
these three components, as shown in Figure 11-2.
Adding a Data Source
Logically, the first step is to create a data source. Right-clicking the Data Sources folder in the
Solution Explorer and selecting Add ➤ New Data Source instantiates the Data Source Wizard,
ce for a report model. Figure 11-3 shows
4983ch11.qxd 10/7/05 11:20 AM Page 325
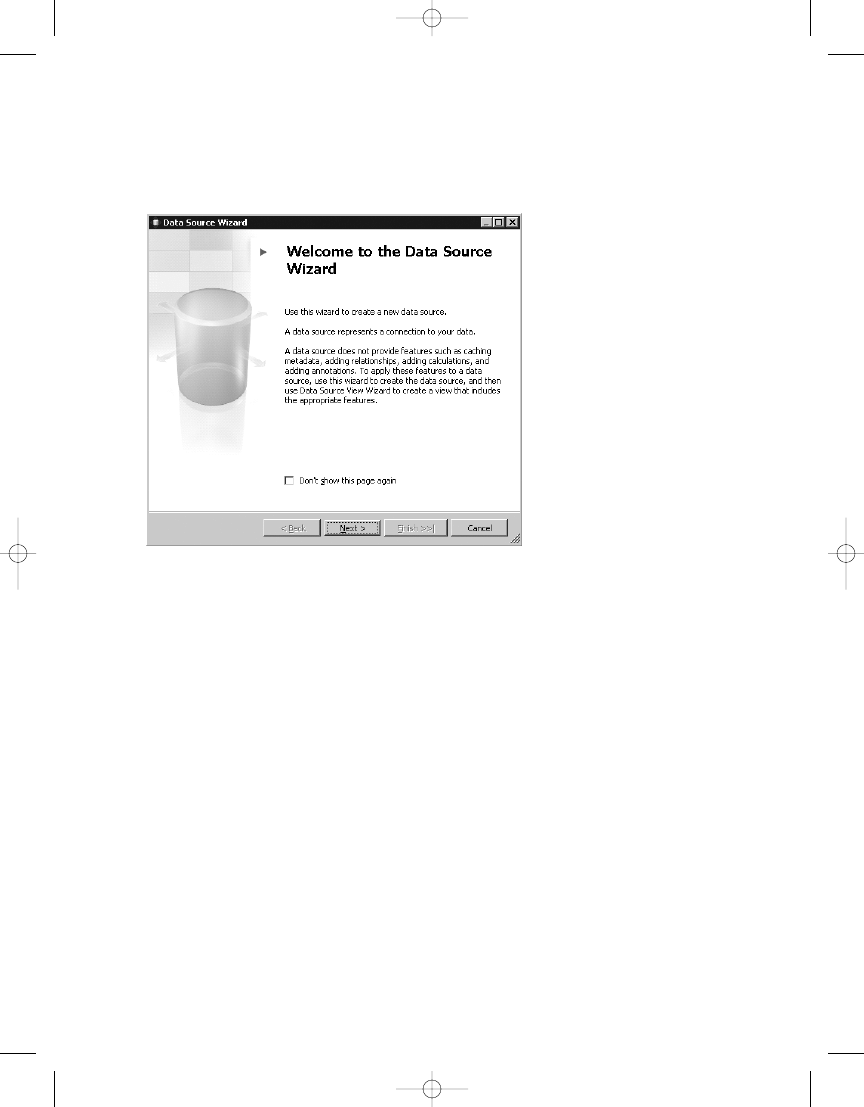
C H A P T E R 1 1
■
P E R F O R M I N G A D H O C R E P O RT I N G U S I N G R E P O RT B U I L D E R
326
the first page of the Data Source Wizard. Fortunately, you can select to not display the first
page every time you open the wizard by checking Don’t show this page again.
You have two options when creating a data source through the wizard, as shown in
Figure 11-4. You can either create a new one based on an existing or a new connection or create
a data source based on another object such as a data source already defined in another project.
For this example, choose to create a new data source based on a new connection, and click New
to open the Connection Manager.
In the Connection Manager, select localhost as the server name, leave the Use Windows
Authentication button checked, and change the database name to Pro_SSRS, as shown in
Figure 11-5. On the next and final screen of the wizard, leave the default data source name of
Pro_SSRS
, and click Finish to create the data source.
Figure 11-3.
Using the Data Source Wizard
4983ch11.qxd 10/7/05 11:20 AM Page 326
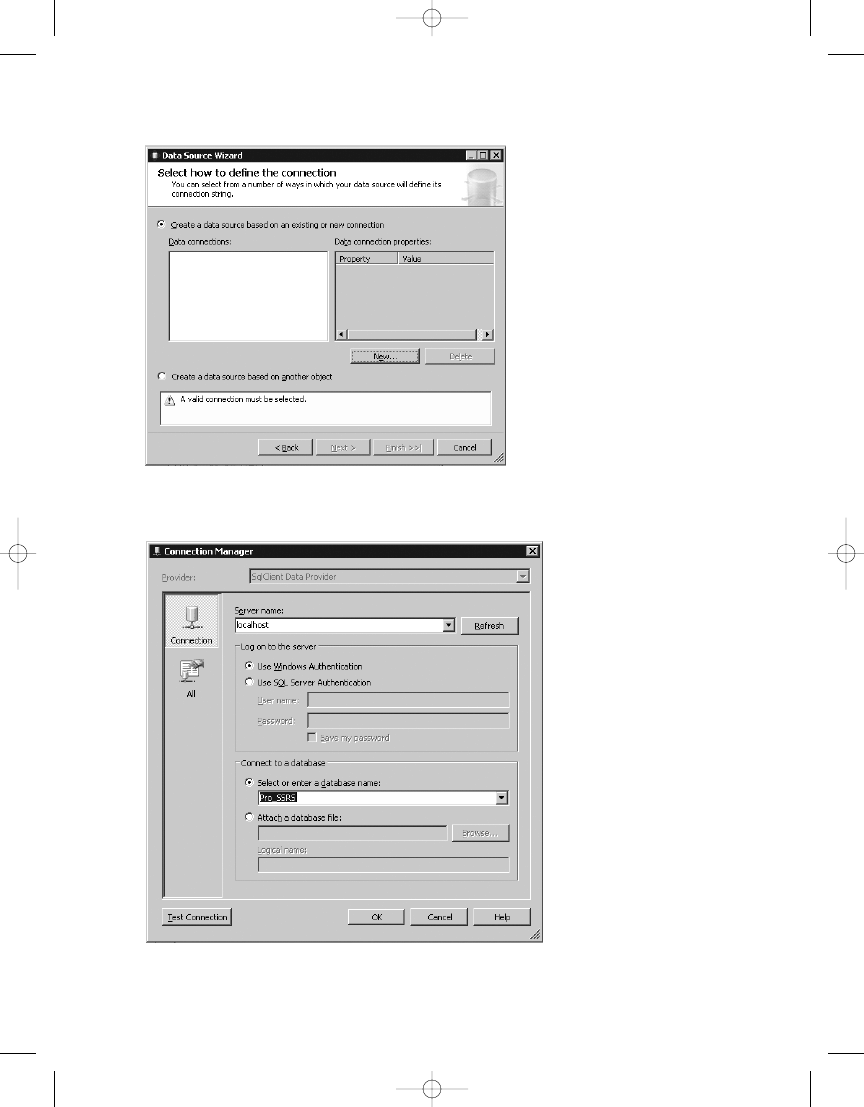
C H A P T E R 1 1
■
P E R F O R M I N G A D H O C R E P O RT I N G U S I N G R E P O RT B U I L D E R
327
Figure 11-4.
Defining a connection
Figure 11-5.
Setting the server name and database
4983ch11.qxd 10/7/05 11:20 AM Page 327
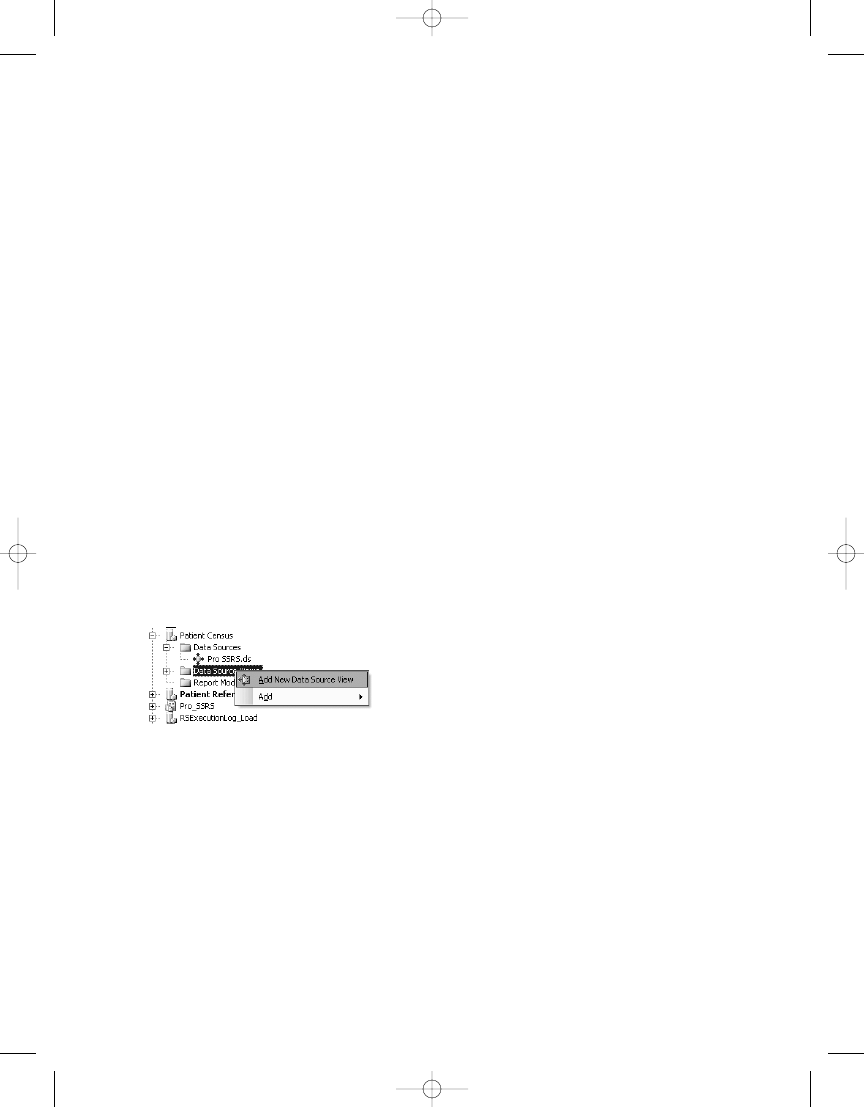
C H A P T E R 1 1
■
P E R F O R M I N G A D H O C R E P O RT I N G U S I N G R E P O RT B U I L D E R
328
Creating a Data Source View
You create data source views for a report model project from relational data sources, where you
have a list of tables that can be joined to form the basis of the data source view. In the Pro_SSRS
database, you know many related tables are joined by column ID fields; the Admissions table
joins to the Patient table via the PatID field, for example. Fields in both tables may be relevant
to a user designing a report; however, superfluous data may just confuse them. Part of your job
as the report modeler is to remove the complexity of the schema but also provide a model that
contains intuitive or “friendly” names and provides only the data that will be useful. Why
should you use Dscr for a diagnosis code, when you really should just make it Diagnosis Name,
for example? Since it is also possible to add objects to a data source view that are derived tables
made from custom queries, you will have more control over creating a custom data source view
and eliminate much of the work of removing the extraneous fields included in all the tables you
are using. This will become more evident to you as you step through the process. For now we
will show how to perform the following logical steps to keep the data source view and subse-
quent model simple but effective:
• Building a query instead of many multiple tables for the data source view
• Selecting only relevant and potentially useful fields for the report designers, based on
their requests
• Using friendly names for data source view fields and values
The first step in creating the view, like with the data source, is to open the wizard by
right-clicking the Data Source Views folder and selecting Add New Data Source, as shown in
Figure 11-6.
On the first page of the wizard (not the welcome page, on which you should immediately
check Don’t show this page again), select the Pro_SSRS data source you created earlier, and
then click Next to move to the Select Tables and Views page. As you can see in Figure 11-7, you
can choose from many tables.
Figure 11-6.
Adding a data source view to the project
4983ch11.qxd 10/7/05 11:20 AM Page 328
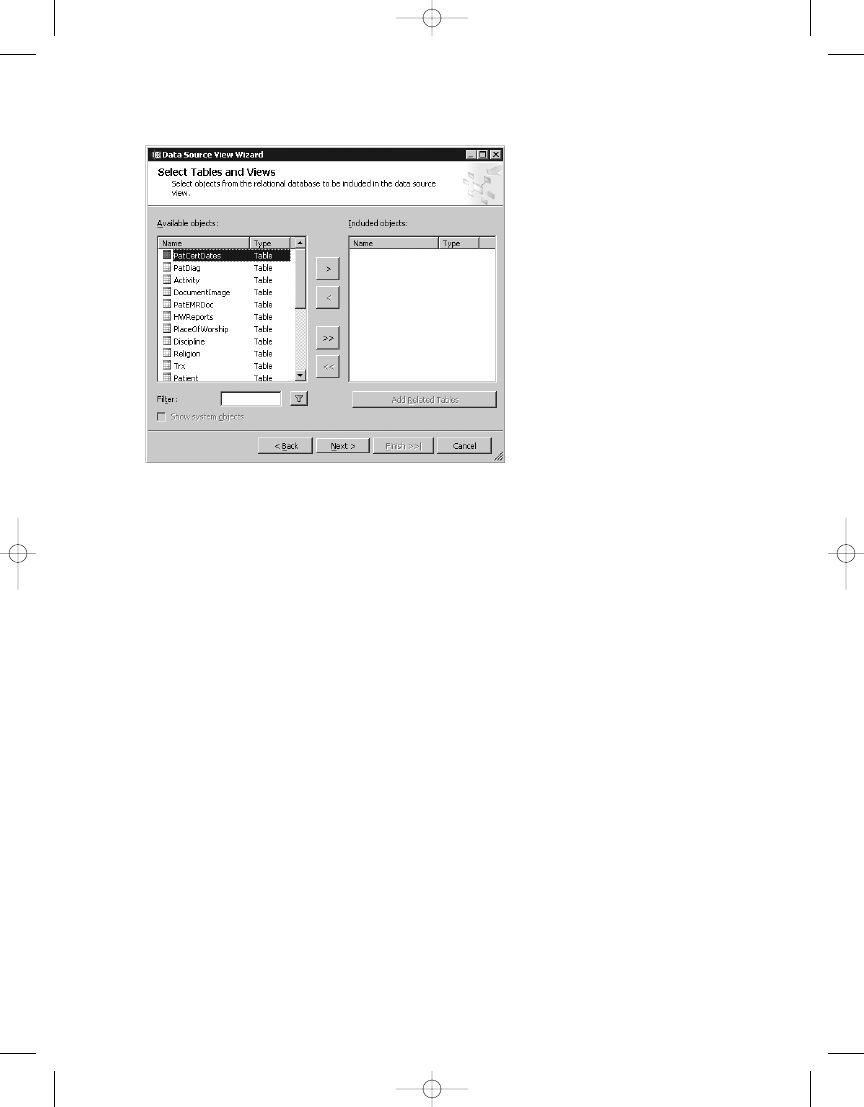
C H A P T E R 1 1
■
P E R F O R M I N G A D H O C R E P O RT I N G U S I N G R E P O RT B U I L D E R
329
You could add all the tables from the list of required tables for the patient census reports
you are going to create; however, knowing that you will have too many unnecessary fields to
work with, simply select Next and then Finish to close the wizard without including any objects.
This will create the Pro_SSRS data source view with no tables defined. Why, you may ask, did
you not select any relational objects, since this seems like a crazy way to start? The reason is
that you will add your own single object, called a named query, that is like a view in a SQL
Server database. It is an object derived from a query of other objects. Assuming you had chosen
one or more tables, you would have graphically defined the relationships for the tables based
on primary keys, if they existed or by using related column ID values, and these tables would
become the source for the report model. The end result is the same, whether you use real table
objects with relationships or you use named query tables that contain only the fields you want.
The difference is that this way you gain the benefit of one simple and concise table, instead of
using many tables with the potential downside of adding more data than is needed for the
model.
Once you have created the data source view, which defaults to a name of Pro SSRS based
on the data source, you can double-click to open it in the design environment. It will appear
empty, as it should. You can add the source query, or more accurately, the named query, by
clicking the New Named Query button on the toolbar, as shown in Figure 11-8.
Figure 11-7.
Related tables in the Pro_SSRS data source
4983ch11.qxd 10/7/05 11:20 AM Page 329
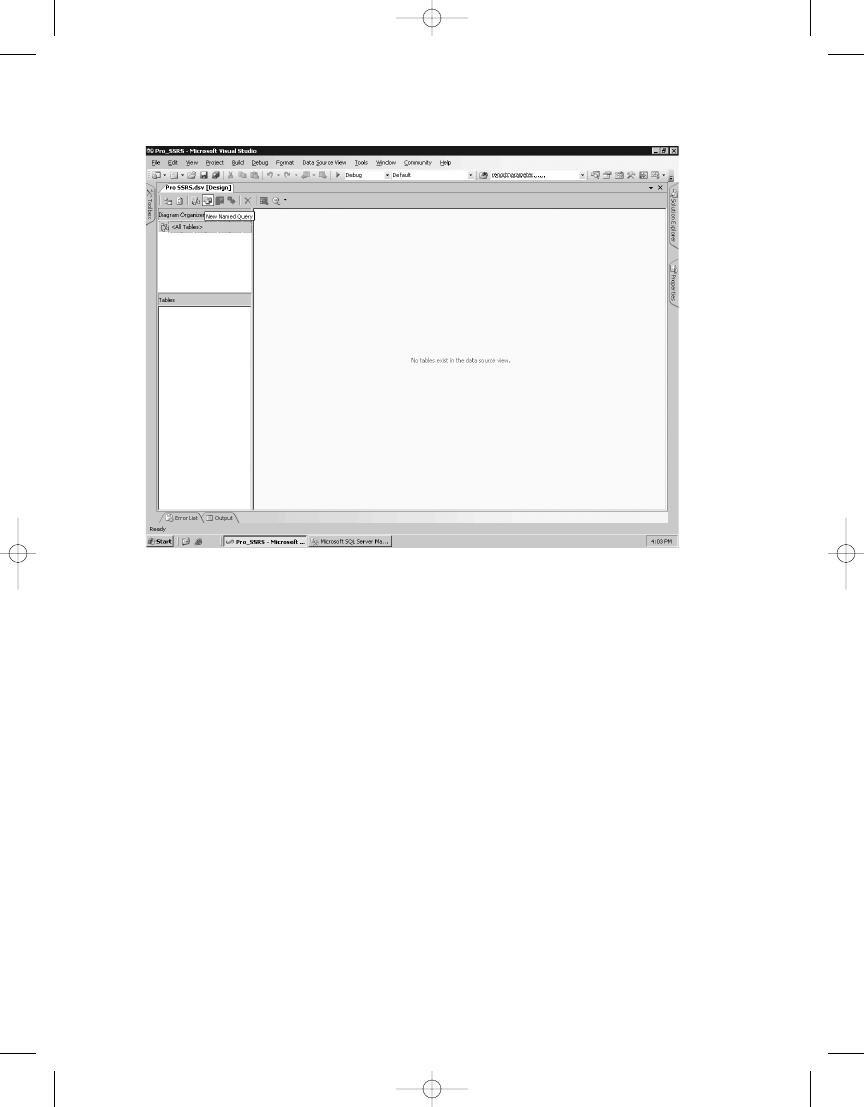
C H A P T E R 1 1
■
P E R F O R M I N G A D H O C R E P O RT I N G U S I N G R E P O RT B U I L D E R
330
In this case, you have already designed the query; however, Report Builder includes its
own graphical query builder, so it is possible to develop the query on the fly so to speak. The
graphical query designer is standard fare, with standard diagram, grid, SQL, and result panes.
Clicking the New Named Query button opens the Create Named Query window. In the SQL
pane, paste the preexisting Patient Census query from Listing 11-1, and click in the blank
diagram pane to automatically load the graphical representation of the query. If you need to
provide aliases for any fields, such as distinguishing the common LastName fields from the
employee and patient table, you can do that in the grid pane, as shown in Figure 11-9, which
also shows the query and all the joined tables. Alias the lastname field as Pat_LastName for patient
and as Emp_LastName for employee. Otherwise, if there were common references to lastname, the
default alias would have been ExprX where X is the number of common references. You can do
the same for the ubiquitous DSCR, used for descriptions, as in the Diag and PatEMR tables.
Listing 11-1.
Patient Census Query
SELECT
Admissions.PatProgramID, Employee.EmployeeID,
Employee.LastName AS Emp_LastName,
Employee.FirstName AS Emp_Firstname,
Discipline.Dscr AS Discipline, Branch.BranchName,
Patient.PatID, Patient.LastName AS Pat_LastName,
Patient.FirstName AS Pat_FirstName,
Figure 11-8.
Pro SSRS data source view
4983ch11.qxd 10/7/05 11:20 AM Page 330
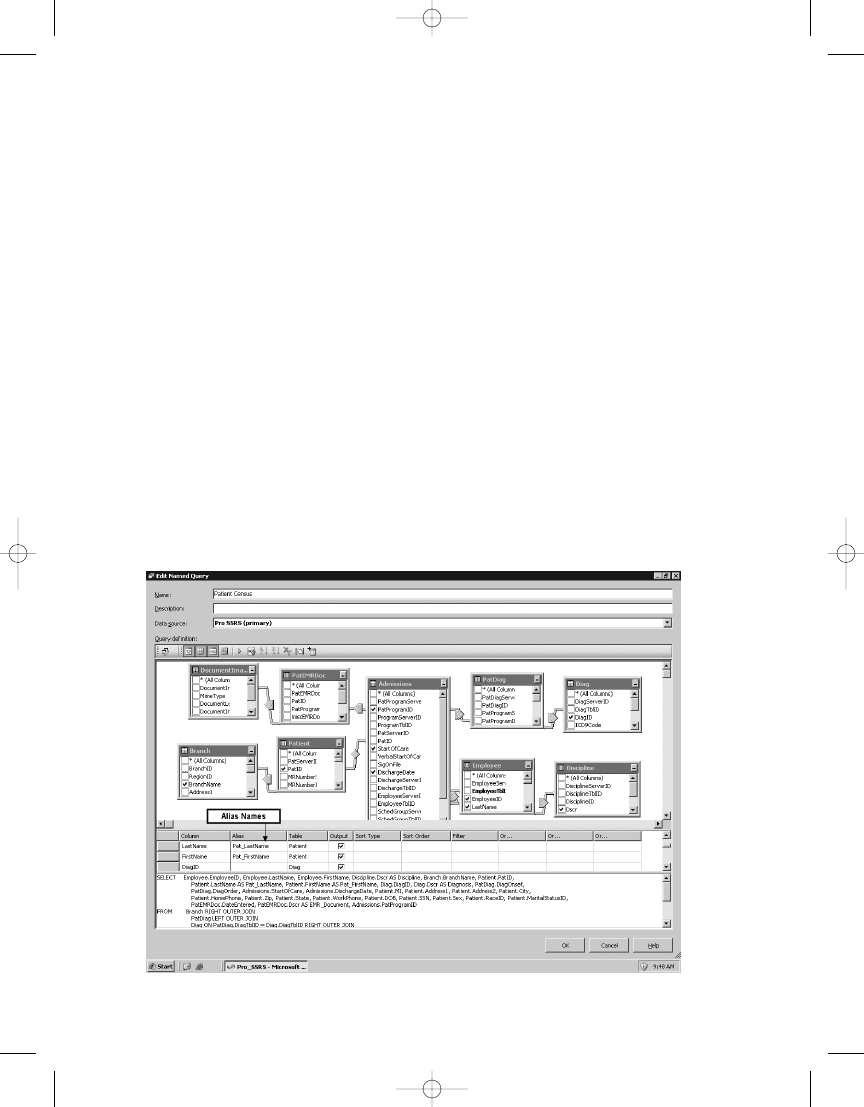
C H A P T E R 1 1
■
P E R F O R M I N G A D H O C R E P O RT I N G U S I N G R E P O RT B U I L D E R
331
Admissions.StartOfCare, Admissions.DischargeDate, Patient.MI,
Patient.Address1, Patient.Address2, Patient.City,
Patient.HomePhone, Patient.Zip, Patient.State, Patient.WorkPhone,
Patient.DOB, Patient.SSN, Patient.Sex, Patient.RaceID, Patient.MaritalStatusID,
PatEMRDoc.DateEntered, PatEMRDoc.Dscr AS EMR_Document,
Dischg.Dscr AS [Discharge Reason],
DATEDIFF(dd, Admissions.StartOfCare, Admissions.DischargeDate) + 1
AS [Length of Stay]
FROM
Admissions INNER JOIN
Patient ON Admissions.PatID = Patient.PatID INNER JOIN
Branch ON Branch.BranchID = Patient.OrigBranchID LEFT OUTER JOIN
PatDiag ON Admissions.PatProgramID = PatDiag.PatProgramID INNER JOIN
Diag ON PatDiag.DiagTblID = Diag.DiagTblID LEFT OUTER JOIN
Employee ON Admissions.EmployeeTblID = Employee.EmployeeTblID LEFT OUTER JOIN
Discipline ON Discipline.DisciplineTblID = Employee.DisciplineTblID
LEFT OUTER JOIN
PatEMRDoc ON Admissions.PatProgramID = PatEMRDoc.PatProgramID LEFT OUTER JOIN
DocumentImage ON DocumentImage.DocumentImageID = PatEMRDoc.DocumentImageID
LEFT OUTER JOIN Dischg ON Admissions.DischargeTblID = Dischg.DischgTblID
WHERE
(PatDiag.DiagOrder = 1) AND (PatDiag.DiagEnd IS NULL)
4983ch11.qxd 10/7/05 11:20 AM Page 331
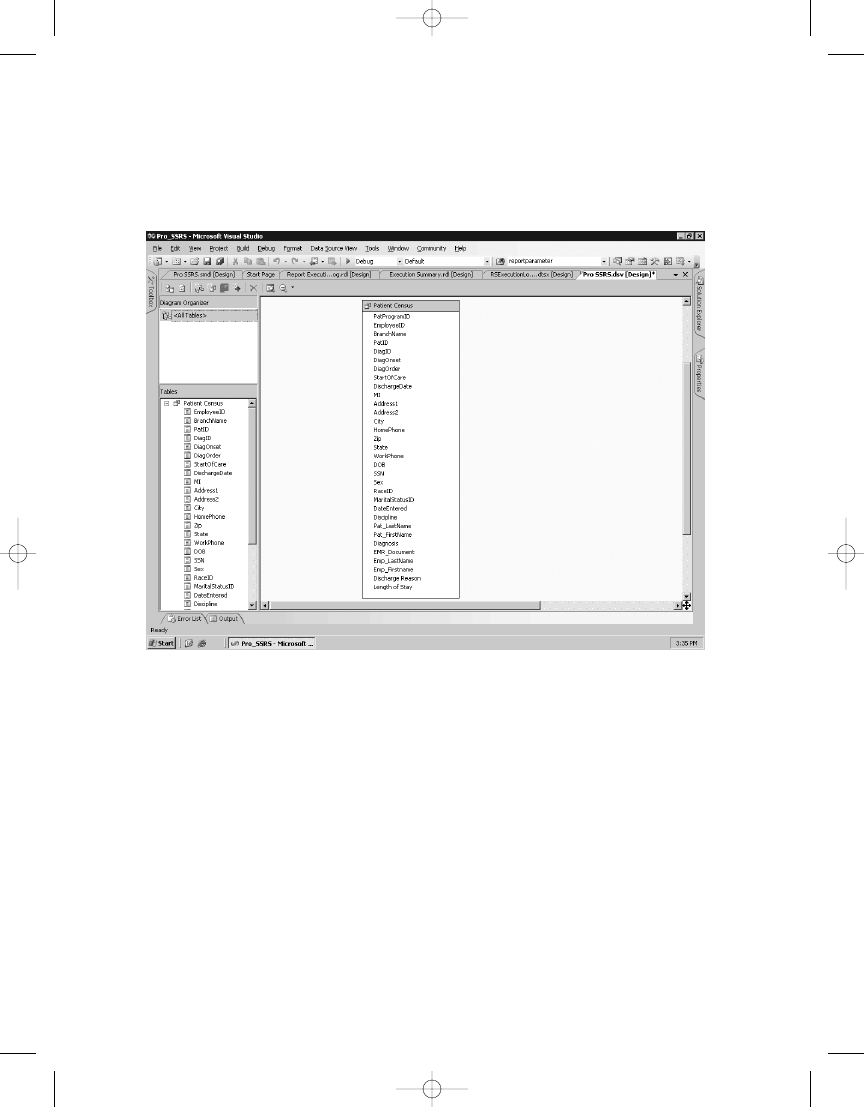
C H A P T E R 1 1
■
P E R F O R M I N G A D H O C R E P O RT I N G U S I N G R E P O RT B U I L D E R
332
Figure 11-10.
Data source view with one object
Finally, name the query Patient Census. When you click OK to complete the named query,
your simple data source view consists of one object, Patient Census, that contains the desired
fields for the model. You can see in Figure 11-10 that 32 fields will be supplied to the model.
The next step in the process is to add a logical primary key to the Patient Census named
query because the report modeler requires a primary key when it generates the model. Because
the query is driven from the Admissions table, which contains the PatProgramID field that you
know will contain unique values, you can use this field as the logical primary key for the Patient
Census query. The PatProgramID field, in the example database, controls the admission and
discharge records for a patient over time. It is typical that the same patient will be admitted to
two separate service lines, referred to as programs; hence, you have PatProgramID. Without the
PatProgramID
field, the records would not be unique with the patient’s identification number,
PatID
, alone.
To set the logical primary key for the Patient Census object to be PatProgramID, simply
right-click the PatProgramID field either in the Tables list or in the Patient Census diagram, and
select Set Logical Primary Key, as shown in Figure 11-11.
4983ch11.qxd 10/7/05 11:20 AM Page 332
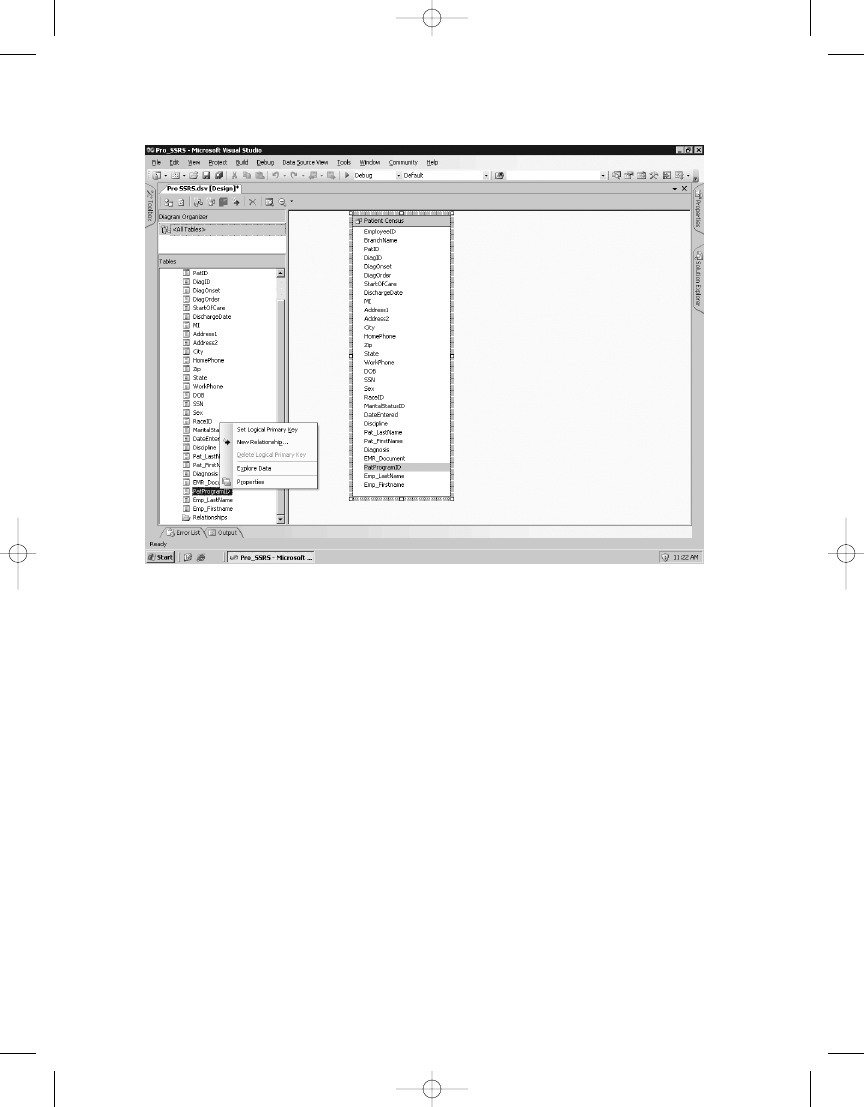
C H A P T E R 1 1
■
P E R F O R M I N G A D H O C R E P O RT I N G U S I N G R E P O RT B U I L D E R
333
At this point, you can save the data source view and then create the report model. Before
you do, however, let’s take a look at a really great feature in the design environment, which is the
ability to explore the data. Right-click anywhere in the Patient Census object—on EmployeeID,
for example—and select Explore Data. As you can see, many records are returned from the
entire Patient Census object, which you will use for the report you create later. However, also
notice the three additional tabs beside Table, as shown in Figure 11-12. The Pivot Table, Chart,
and Pivot Chart tabs show up here like finding a really valuable trumpet shell unexpectedly on
the beach. (Not that this will help you greatly when developing the report model, but we just
thought it was worth showing.)
Figure 11-11.
Setting the logical primary key
4983ch11.qxd 10/7/05 11:20 AM Page 333
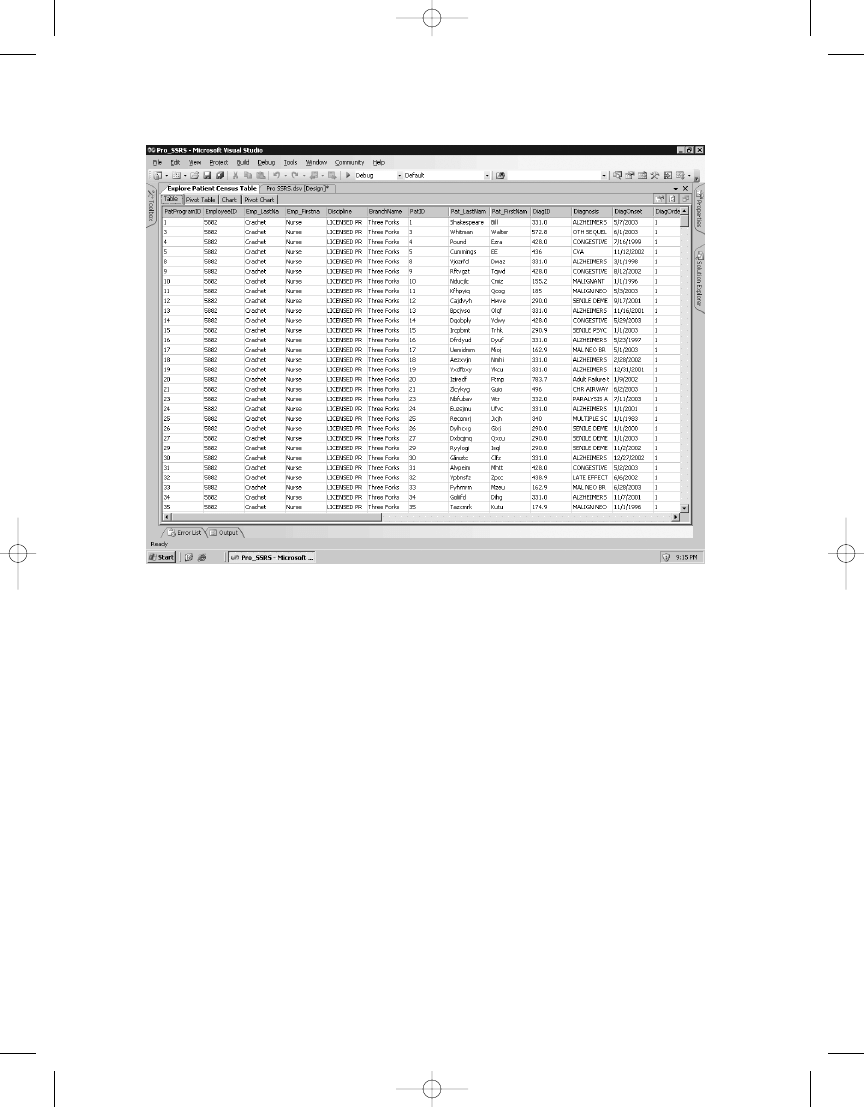
C H A P T E R 1 1
■
P E R F O R M I N G A D H O C R E P O RT I N G U S I N G R E P O RT B U I L D E R
334
Figure 11-12.
Additional tabs when exploring data
Now that you have determined that the Patient Census data source view is returning data as
you expected, you will save it and move on to the real heart of Report Builder, the report model.
Creating a Report Model
The report model will add a layer of separation between report designers and the underlying
data source, simplifying the process of designing reports by allowing them to focus on report
design and not query design. Now that you have the data source view, which is a requirement
for building a report model, you will now learn how to create the model. The process is straight-
forward, thanks to autogeneration methods that analyze the data source view in two passes
and produce the end result—a publishable report model that would have otherwise taken
much time and effort to produce its constituent elements, as you will see. The goal in this sec-
tion is to walk you through the wizard so you can pay attention to the generation methods and
finally deploy your completed model to the SSRS server.
You will again utilize the right-click procedure to initiate the Report Model Wizard from
the Report Models folder in Solution Explorer. After navigating past the first welcome page to
the Select Data Source View page, you are presented with the Pro SSRS data source view selec-
tion, as shown in Figure 11-13.
4983ch11.qxd 10/7/05 11:20 AM Page 334
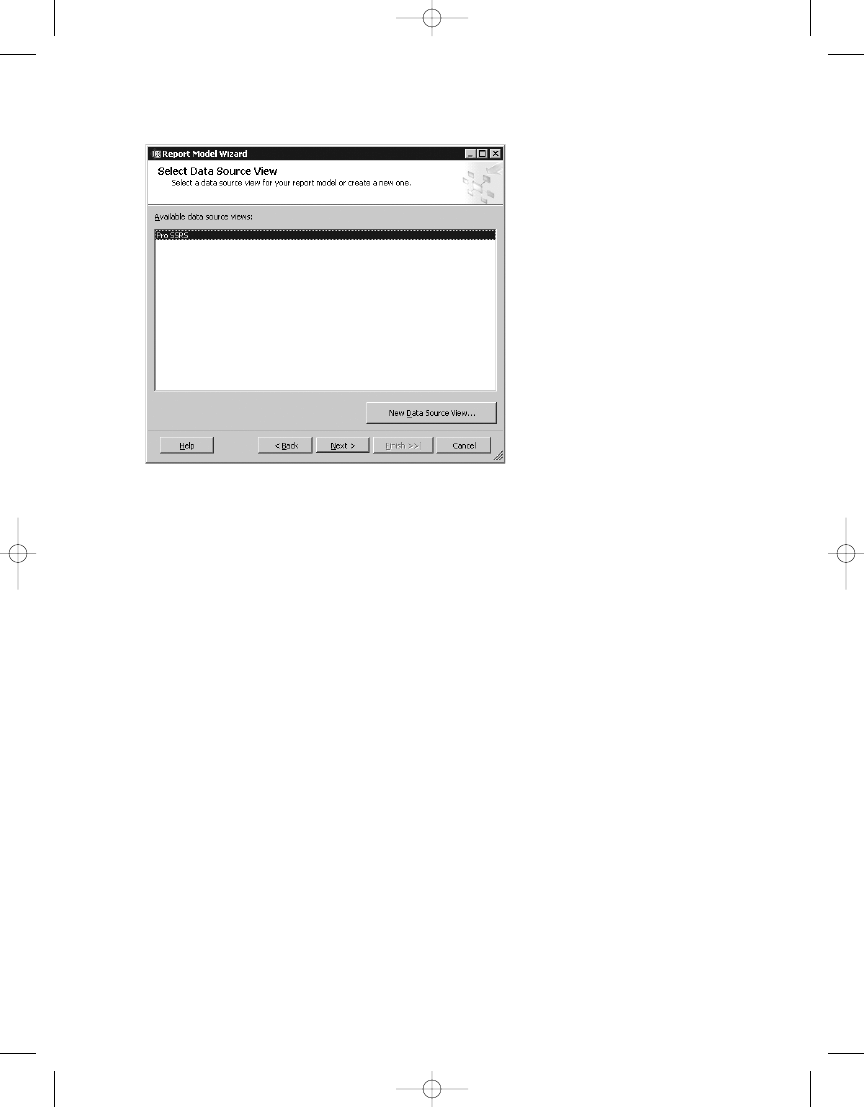
C H A P T E R 1 1
■
P E R F O R M I N G A D H O C R E P O RT I N G U S I N G R E P O RT B U I L D E R
335
After selecting Pro SSRS, click Next, where you can now select the report model generation
rules. You will see two sets of rules, one for each pass on the data source view. Several rules exist,
and most of them are selected by default. Many of the rules are self-explanatory; however, two
are not selected by default, Create Entities for Nonempty Tables and Create Attributes for Non-
empty Columns. These two rules instruct the generation process to create entities and attributes
only for tables that contain data. Entities are the report model’s table equivalent, and attributes
are conceptually the fields or columns defined within the entities.
The following are all the rules for the first pass of generating the model and are selectable
in the Report Model Wizard:
• Create Entities for All Tables
• Create Entities for Non-empty Tables
• Create Count Aggregates
• Create Attributes
• Create Attributes for Non-empty Columns
• Create Attributes for Auto-increment Columns
• Create Date Variations
• Create Numeric Aggregates
• Create Date Aggregates
• Create Roles
Figure 11-13.
Selecting a data source view
4983ch11.qxd 10/7/05 11:20 AM Page 335
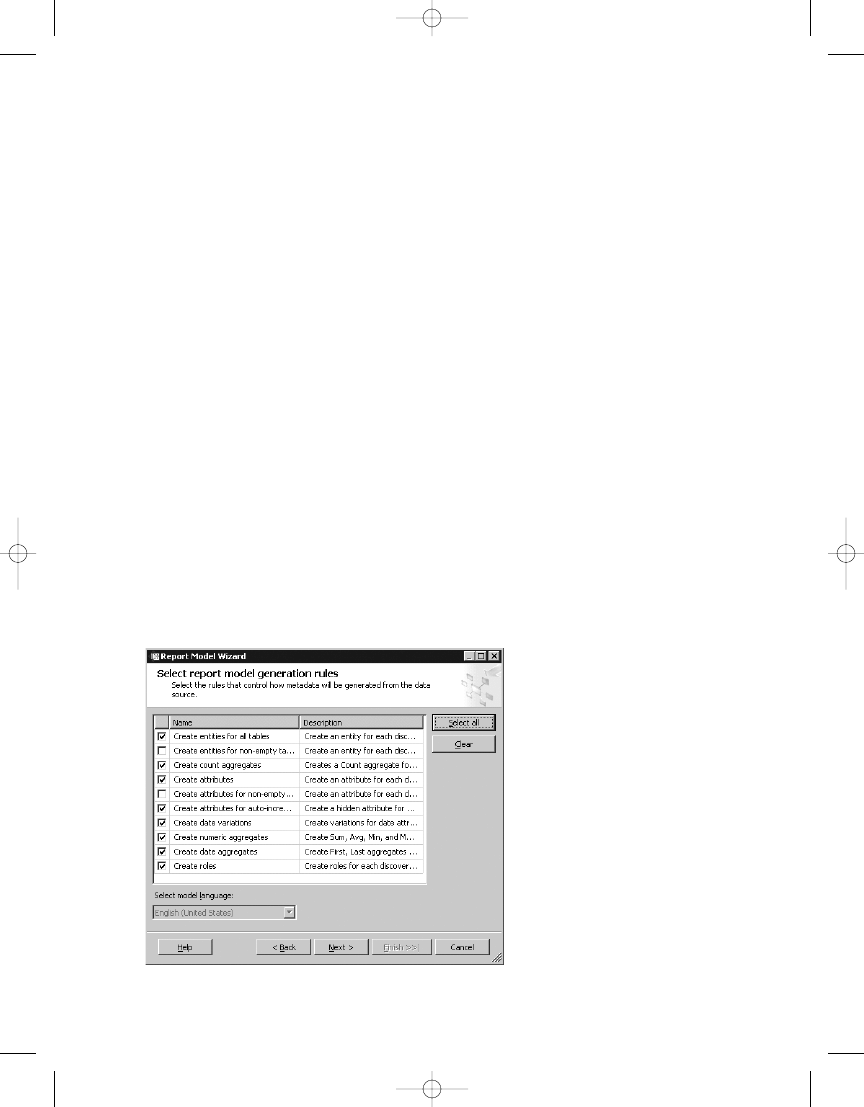
C H A P T E R 1 1
■
P E R F O R M I N G A D H O C R E P O RT I N G U S I N G R E P O RT B U I L D E R
336
The next set of rules are applied automatically during the second pass of the generation process:
• Lookup Entities
• Small Lists
• Large Lists
• Very Large Lists
• Set Identifying Attributes
• Set Default Detail Attributes
• Role Name Only
• Numeric/Date Formatting
• Integer/Decimal Formatting
• Float Formatting
• Date Formatting
• Discourage Grouping
• Dropdown Value Selection
We said that there are two passes during the autogeneration process for the model. The
first pass processes all rules up to Create Roles, and the second pass begins with Lookup Entities
and completes with Dropdown Value Selection. You will also see a helpful description for each
rule, as shown in Figure 11-14.
4983ch11.qxd 10/7/05 11:20 AM Page 336
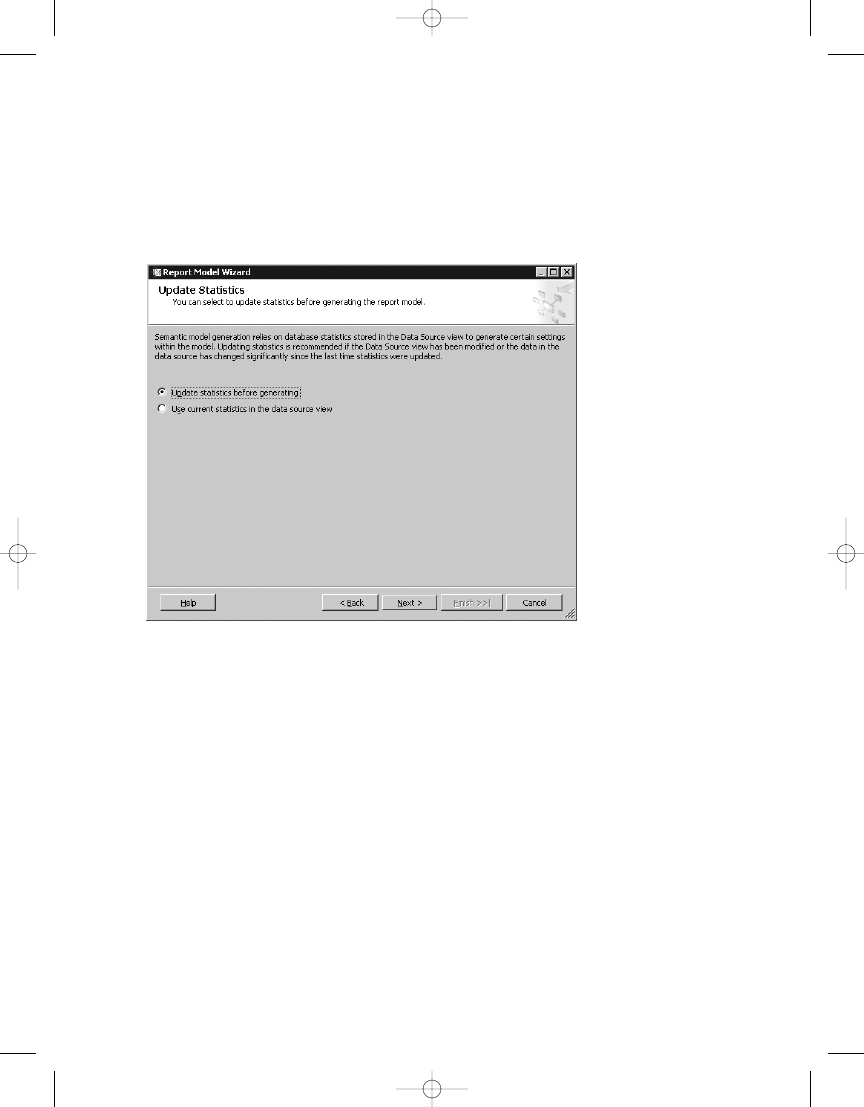
C H A P T E R 1 1
■
P E R F O R M I N G A D H O C R E P O RT I N G U S I N G R E P O RT B U I L D E R
337
For this example, leave the default selections, as these will give you features such as auto-
matic aggregations for any numbers and dates and also create date variations so that for every
DateTime data type in the data source view, you will have Day, Month, and Year created. You
can click Next and choose to update statistics before generating, as shown in Figure 11-15.
This is important if any data has changed significantly in the source tables.
Figure 11-15.
Update Statistics page
On the next page in the wizard, select Run to begin the two passes of the rules to generate
the model. Figure 11-16 shows the output after clicking Run, and the process has completed
successfully. You can see the details at each rule level of exactly what the rule did based on the
data in the data source view. Notice that for Create Date Variations, for example, the rule dis-
covered and created dates for DiagOnset, which is the date on which the patient was diagnosed
with a disease. Other attributes that were created were Sum, Avg, Min, and Max for the Length of
Stay
column. The length of stay, usually an average, is the amount of time between the patient
being admitted and being discharged from a long-term health-care facility. The DateDiff func-
tion calculates the length of stay.
4983ch11.qxd 10/7/05 11:20 AM Page 337
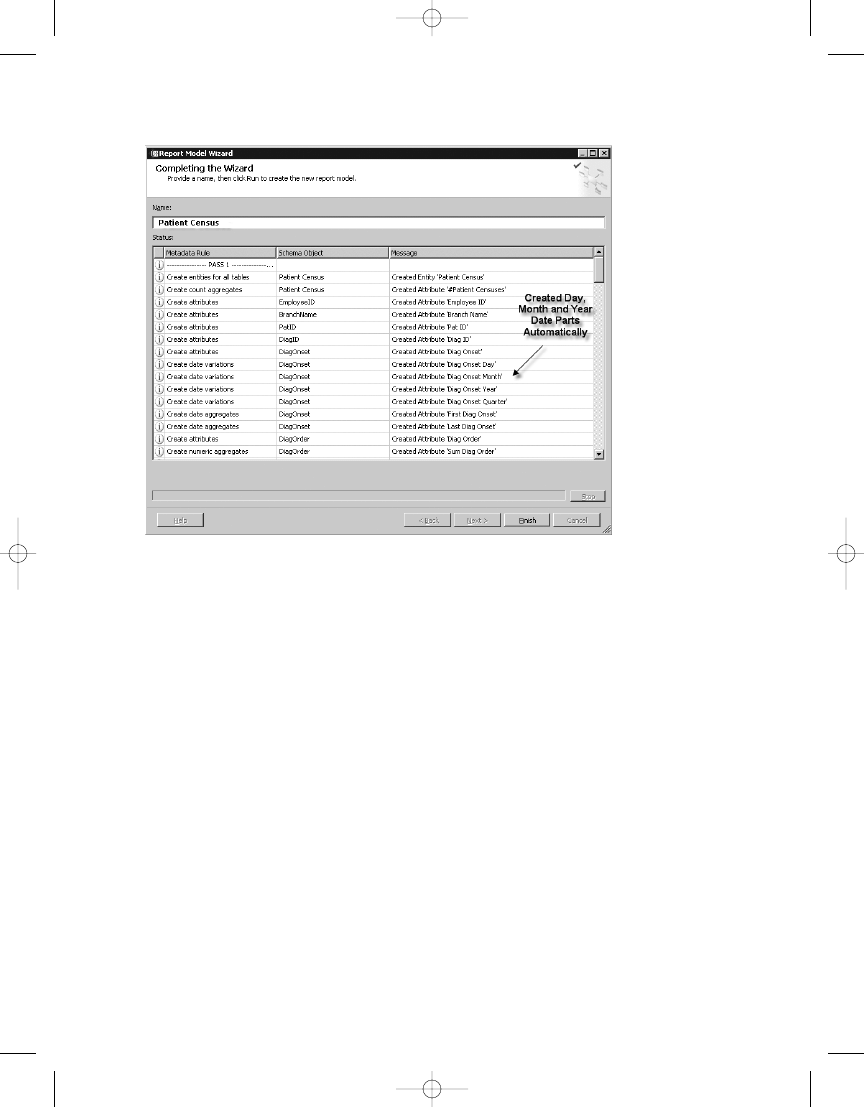
C H A P T E R 1 1
■
P E R F O R M I N G A D H O C R E P O RT I N G U S I N G R E P O RT B U I L D E R
338
After you click Finish in the Report Model Wizard, you can see the Patient Census model
has been created with the expected attributes. At this point, you can deploy the model directly
to the report server by right-clicking the model in the Solution Explorer and selecting Deploy.
You can control where the model will be deployed in the project’s properties pages, as shown
in Figure 11-17, by clicking Project ➤ Project Properties on the toolbar. In this case, the project
will be deployed to the Models folder on the report server, which has a target server URL of
http://localhost/ReportServer
. The data sources for the model will be published in the Data
Sources
folder.
Figure 11-16.
Rules completed successfully
4983ch11.qxd 10/7/05 11:20 AM Page 338
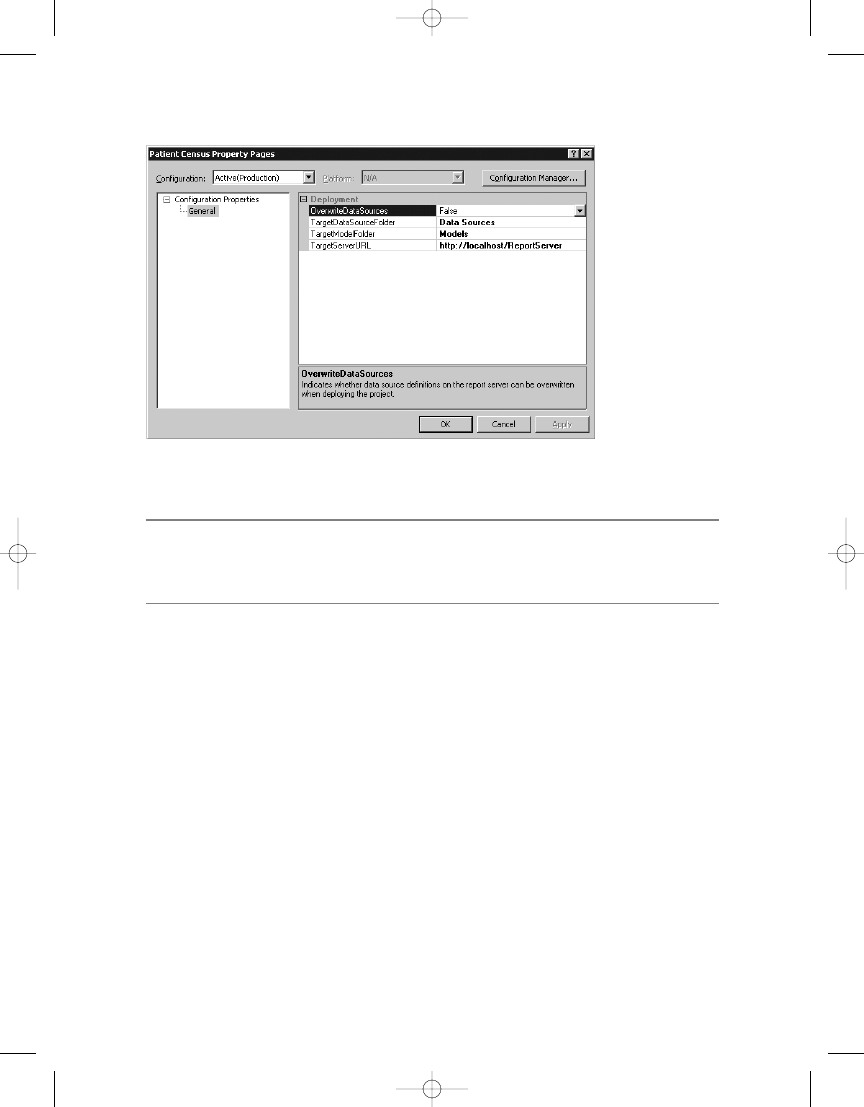
C H A P T E R 1 1
■
P E R F O R M I N G A D H O C R E P O RT I N G U S I N G R E P O RT B U I L D E R
339
Figure 11-17.
Project properties for the report model
■
Note
We should mention that report models are created with Semantic Model Definition Language
(SDML), which is an XML-style grammar similar to RDL. Where RDL defines reports and report properties,
SMDL defines models objects, such as the entities and attributes that you are creating here.
After you deploy the model, you can see in Report Manager the two folders that were
created, Data Sources and Models. The Data Sources folder contains the Pro_SSRS data source,
and the Models folder houses the Patient Census report model. Figure 11-18 shows the properties
of the Patient Census report model. Just as with a standard data source, it is possible to view
which reports have been created using the model.
4983ch11.qxd 10/7/05 11:20 AM Page 339
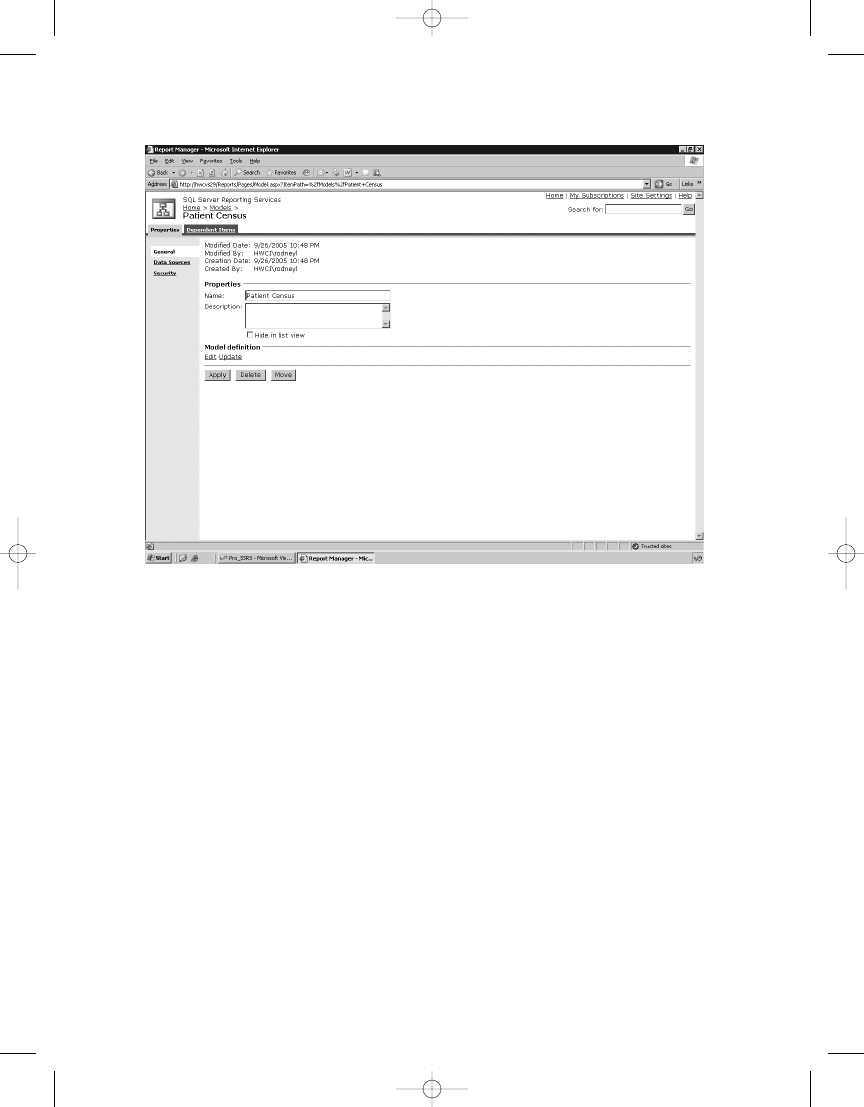
C H A P T E R 1 1
■
P E R F O R M I N G A D H O C R E P O RT I N G U S I N G R E P O RT B U I L D E R
340
Before you begin creating reports with Report Builder, it is important to note that users who
will need permissions to use Report Builder must have item-level role assignments for various
tasks associated with creating reports with Report Builder. SSRS includes a new Report Builder
role for this purpose, as shown in Figure 11-19. Users assigned to the Report Builder role have
all the required permissions to access the report models, folders, and published reports. To
publish reports, however, they will need to have the ability to manage report content before
they can successfully publish their reports to the report server. The Content Managers role has
all the required permissions for full report creation and publishing capabilities.
Figure 11-18.
Patient Census report model properties
4983ch11.qxd 10/7/05 11:20 AM Page 340
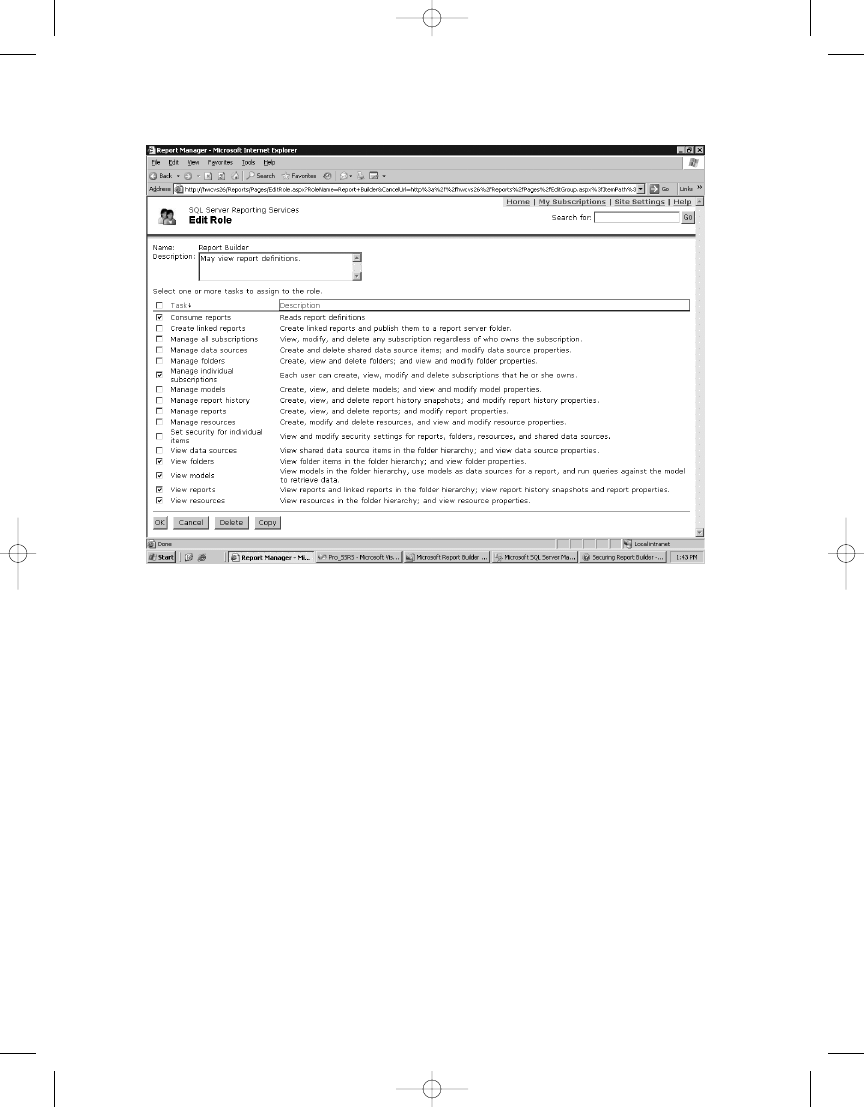
C H A P T E R 1 1
■
P E R F O R M I N G A D H O C R E P O RT I N G U S I N G R E P O RT B U I L D E R
341
Figure 11-19.
SSRS Report Builder role
Using Report Builder
To this point you have created all the requisite pieces for using Report Builder—you have cre-
ated the report model Patient Census and deployed it to the report server. It is now waiting to
be used as a source for the front-end Report Builder application. Report Builder provides some
of the same functionality of a full report development environment, such as BIDS or Visual
Studio, including the ability to drag and drop data elements to the design area with Matrix, Table,
and Chart data regions as well as the ability to deploy finished reports to the report server.
However, before you dive in, we should state that Report Builder serves the purpose of allowing
end users to design their own reports. It was designed to be intuitive and friendly, and because
it is not a full-featured IDE, it may at first seem limited.
In this section, you will explore Report Builder and uncover the features that are available
to the report designer such as adding functions, similar to adding expressions in BIDS, and
providing filtering, grouping, and sorting capabilities. The goal in this section is show you how
to create and deploy, step by step, the requested census reports from the Patient Census model
created earlier in this chapter.
To launch Report Builder, first open Report Manager by navigating to http://Servername/
Reports
. On the main toolbar of the Report Manager home page, you should see the Report
Builder button, as shown in Figure 11-20. Click the Report Builder button to initialize the Report
Builder installation if it is not already installed or to open the installed application.
4983ch11.qxd 10/7/05 11:20 AM Page 341
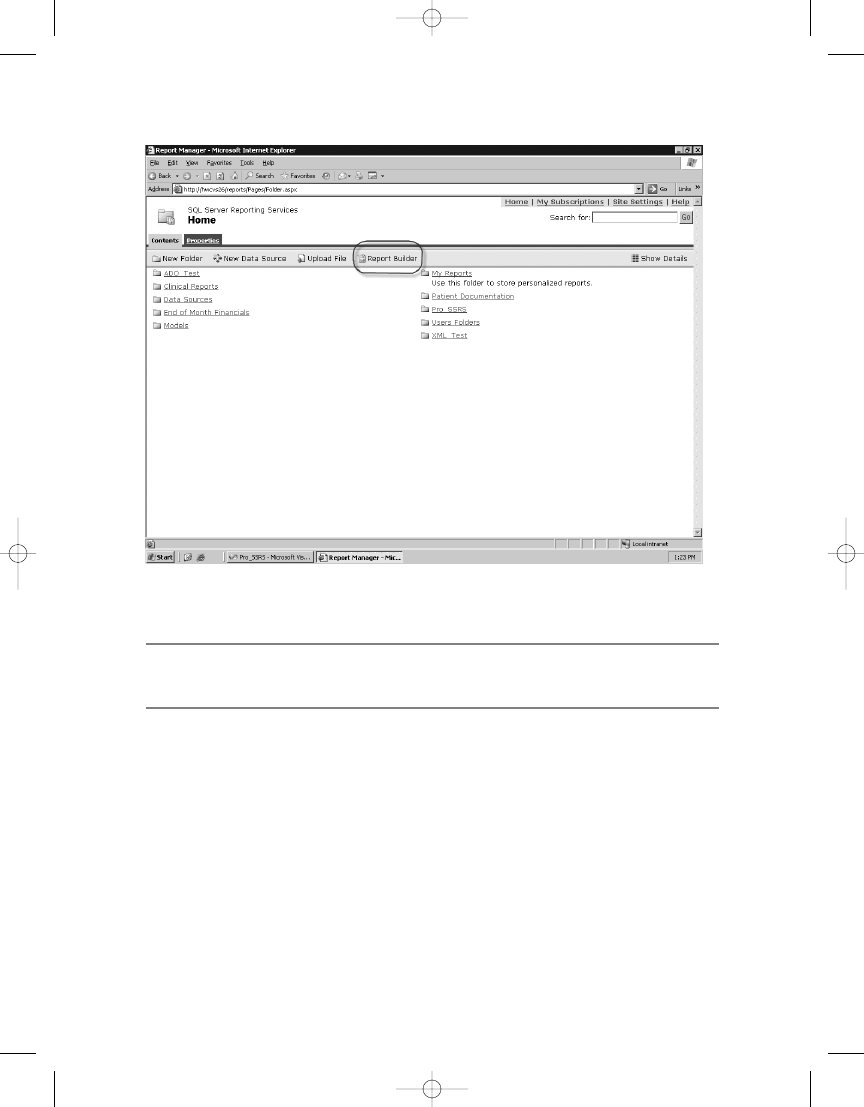
C H A P T E R 1 1
■
P E R F O R M I N G A D H O C R E P O RT I N G U S I N G R E P O RT B U I L D E R
342
■
Note
It is also possible to launch Report Builder directly from the
ReportServer
URL such as
https://mySSRSserver/ReportServer/ReportBuilder/ReportBuilder.application
.
Report Builder uses ClickOnce technology to install itself from the Web site. The code is
downloaded and installed to the local machine from the browser, assuming there are no issues
with missing prerequisites, one of which is .NET Framework 2.0. If this is not installed, it will
issue a warning message that Report Builder requires .NET Framework 2.0 before it can be
installed. If all the requirements are met, Report Builder initiates and completes installation.
Figure 11-21 shows the installation progress.
Figure 11-20.
Report Manager main toolbar with Report Builder button
4983ch11.qxd 10/7/05 11:20 AM Page 342
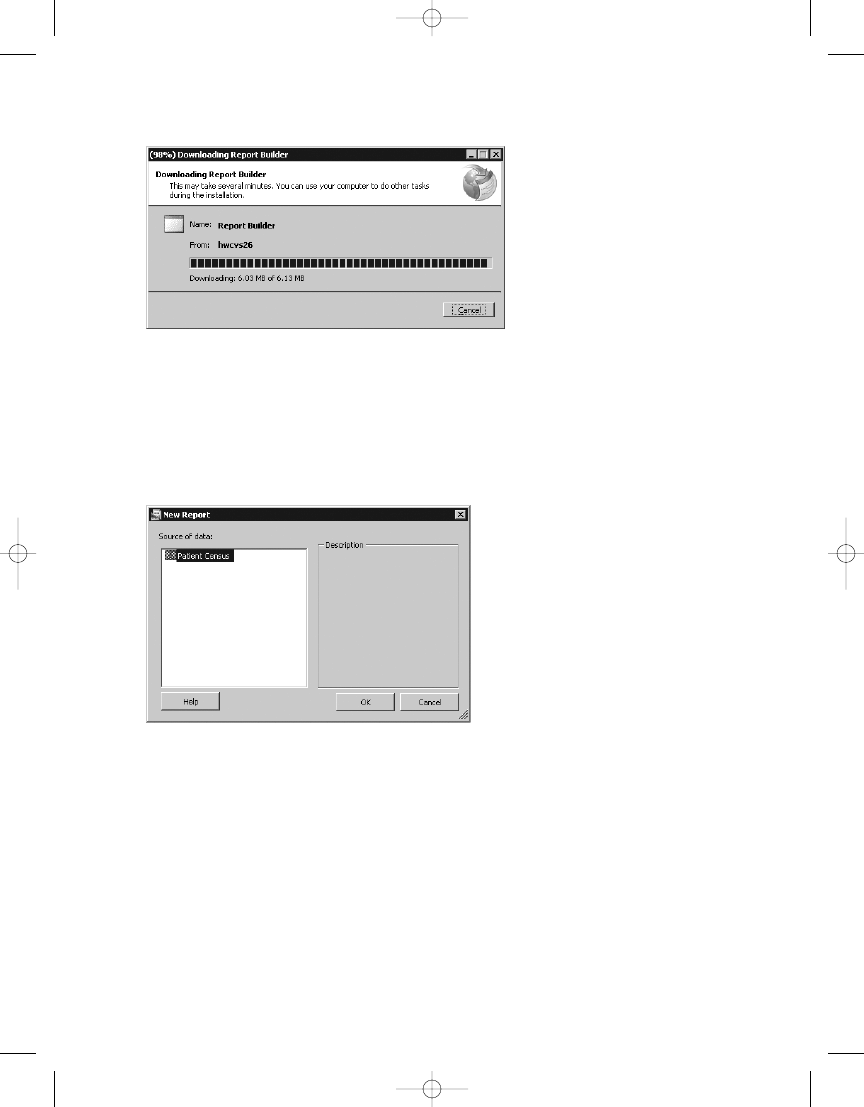
C H A P T E R 1 1
■
P E R F O R M I N G A D H O C R E P O RT I N G U S I N G R E P O RT B U I L D E R
343
Figure 11-21.
Report Builder installation progress
Figure 11-22.
Selecting the report model
After Report Builder is installed, it launches automatically. The first step to begin design-
ing a report is to select a source of data, as shown in Figure 11-22. The source will be a report
model, in this case the Patient Census report model you have already published. So, select it,
and click OK to continue.
At first glance, it is easy to see that Report Builder has the look and feel of other Microsoft
design products in the Office suite, such as FrontPage. You will see a simple design area, a Report
Data area, and a Report Layout area that contains templates that can be used for each report. The
three available templates are familiar versions of data regions available for SSRS reports: Table,
Matrix, and Chart. Each template has predefined areas such as a title, a total column, and a fil-
ter description column, as shown in the table report in Figure 11-23. You can also see the fields
of the Patient Census report model in the Report Data tab on the left.
4983ch11.qxd 10/7/05 11:20 AM Page 343
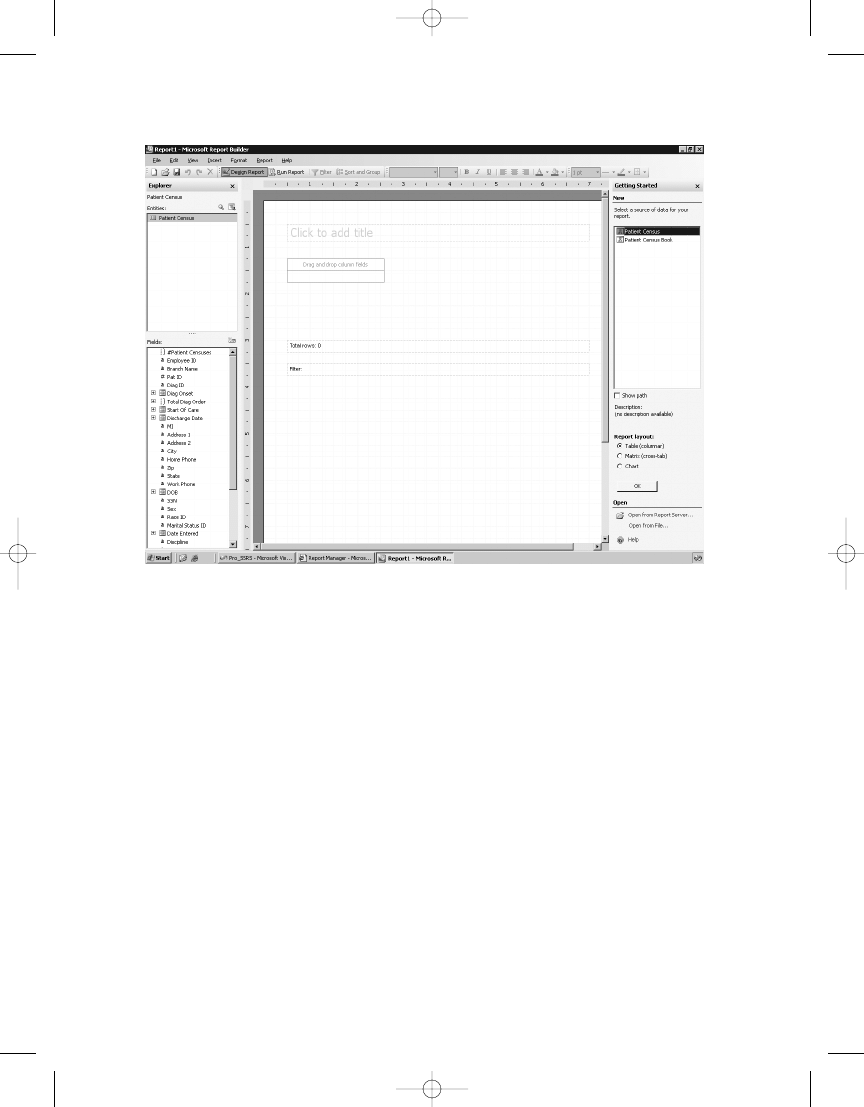
C H A P T E R 1 1
■
P E R F O R M I N G A D H O C R E P O RT I N G U S I N G R E P O RT B U I L D E R
344
Creating a Table Report
To address many of the report requests received from user feedback, you can use the table
report. One item to note, which may fall into the category of a limitation of Report Builder, is
that you can use only one data region per report. In other words, unlike the full IDE of BIDS,
users who build reports with Report Builder are limited to one Table, Matrix, or Chart data
region per report. You cannot add a second data region. In fact, reports are not only limited to
a single data region, but they are relegated to using the controls that have been defined for
each template. It is not possible to add textboxes, for example, or any other type of design element,
other than the data from the fields. You will work within this limitation to produce your first
report, a patient face sheet (as it is commonly called), which displays demographic informa-
tion about each patient. With the table report still open, you will drag several fields onto the
table where it says Drop Column Fields so that the report looks like Figure 11-24. The fields
that you will use are Branch Name, Pat ID, Pat First Name, Pat Last Name, Diagnosis, Start Of
Care
, Address 1, Address 2, City, State, and Zip. At this point, you can also add a title in the
Click to Add Title textbox. Notice also that as the fields are added, Pat Last Name, for example,
they become bold in the Fields tab on the left indicating they have already been used.
Figure 11-23.
Table report template in Report Builder
4983ch11.qxd 10/7/05 11:20 AM Page 344
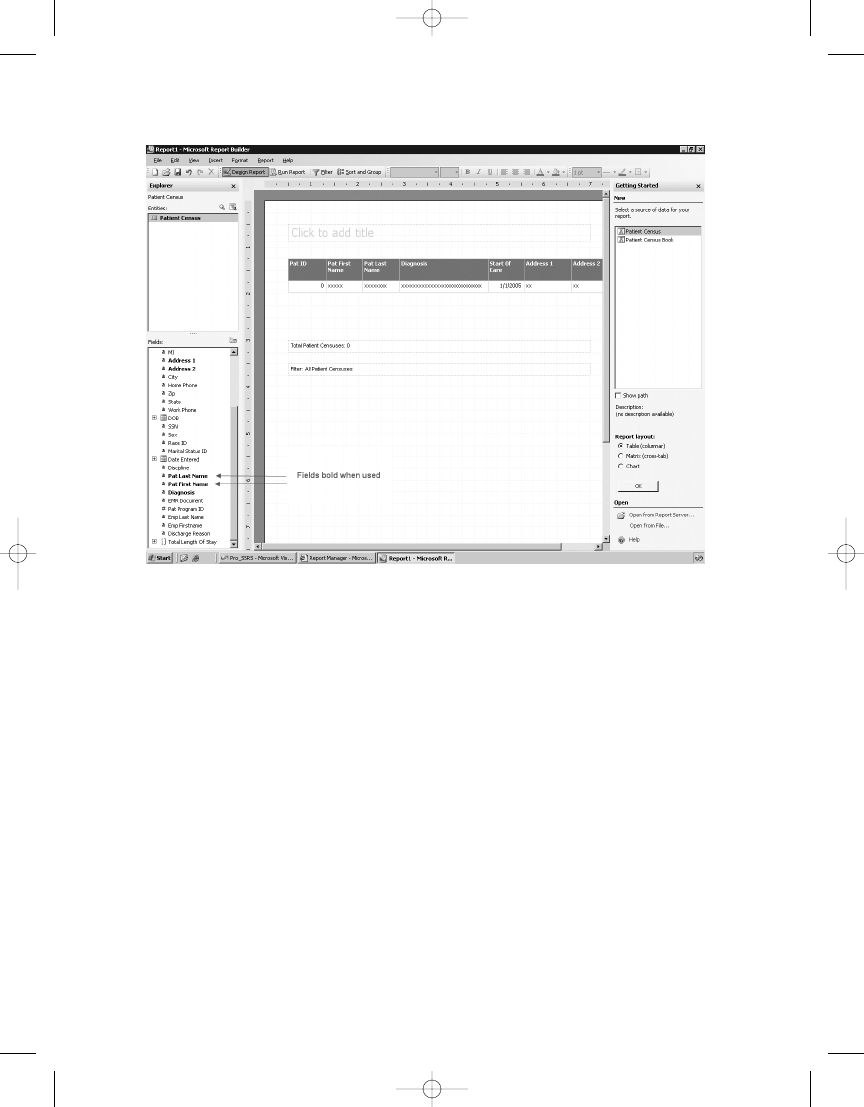
C H A P T E R 1 1
■
P E R F O R M I N G A D H O C R E P O RT I N G U S I N G R E P O RT B U I L D E R
345
Figure 11-24.
Table report with patient information
Once you have added all these fields to the report, you could click Run Report to preview
the report; however, at this point, you must perform some tasks to make the report fit on a printed
page. In its default page setup, the report is set to Portrait; however, the fields you have added
extend beyond 8.5 inches across. To fix this, right-click in the design area, and select Page Setup
so that the Page Setup dialog box appears, as shown in Figure 11-25. Set the Orientation prop-
erty to Landscape, and click OK.
4983ch11.qxd 10/7/05 11:20 AM Page 345
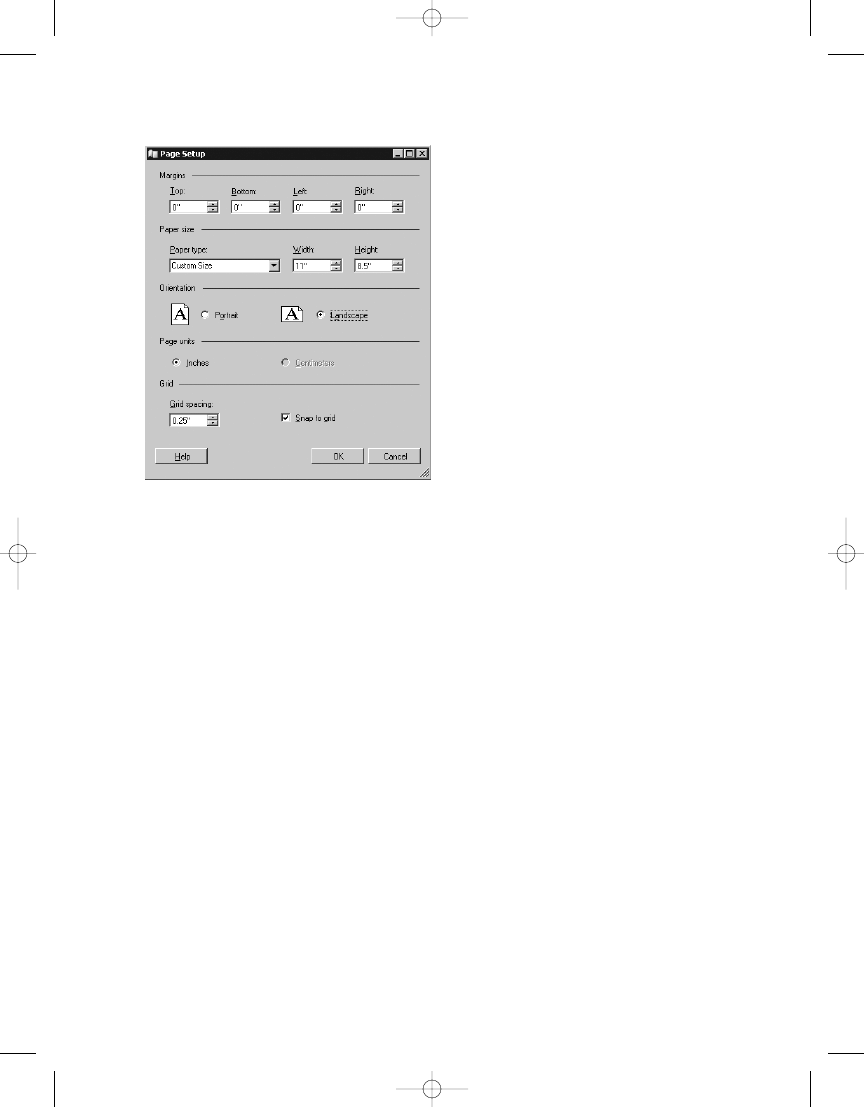
To make even more room, you can use a formula to combine the patient’s first and last
names. To do this, simply right-click the Pat First Name data cell, and select Edit Formula.
This will open the Define Formula window. Formulas in Report Builder are like expressions
in BIDS. Here is where you can combine report fields and built-in functions to produce the
desired value. Figure 11-26 shows the Define Formula dialog box with several available func-
tions. Notice the formula used to concatenate the Pat First Name and Pat Last Name fields,
which uses report data fields and an ampersand (&) to add a literal comma character to separate
the names. You can also use the RTRIM function to remove trailing spaces. You could have done
much of this work in the report model, where it most likely should have been done. However, we
had you leave the names this way so we could now demonstrate the use of a simple formula.
Once the formula is in place, rename the field to Patient Name, and click OK.
C H A P T E R 1 1
■
P E R F O R M I N G A D H O C R E P O RT I N G U S I N G R E P O RT B U I L D E R
346
Figure 11-25.
Setting the page orientation
4983ch11.qxd 10/7/05 11:20 AM Page 346
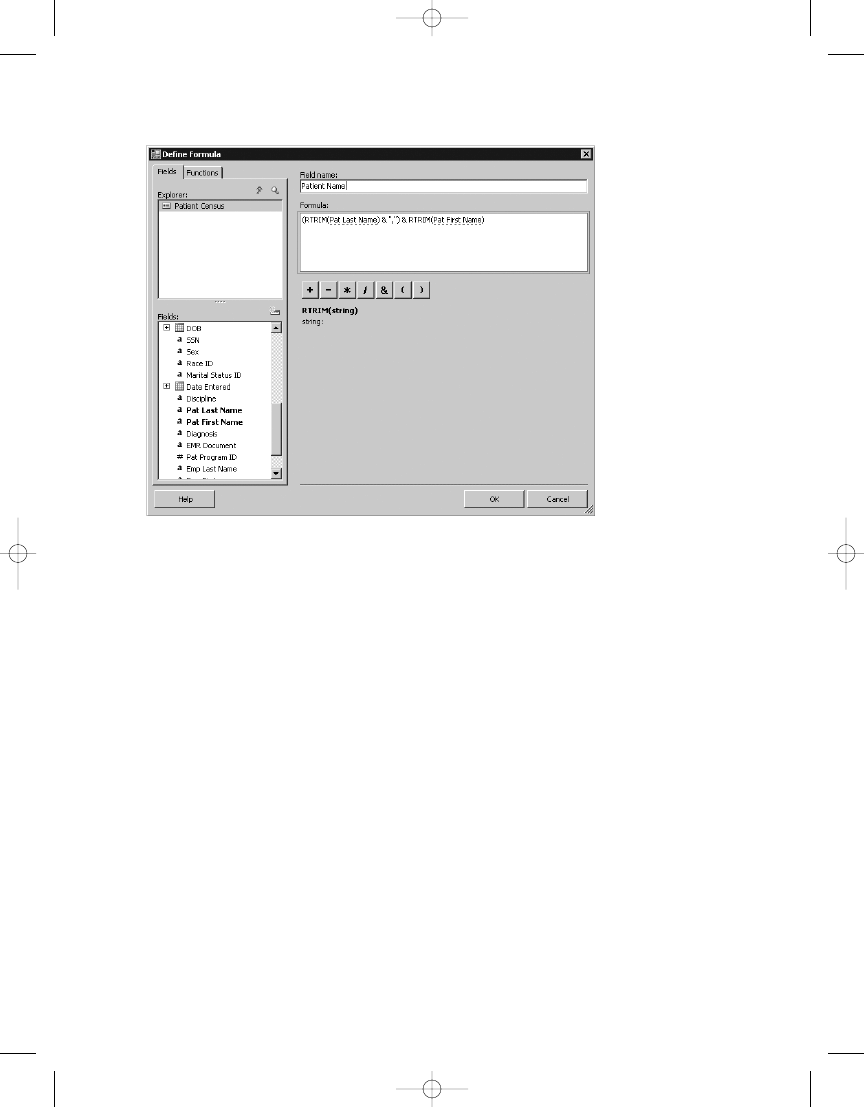
C H A P T E R 1 1
■
P E R F O R M I N G A D H O C R E P O RT I N G U S I N G R E P O RT B U I L D E R
347
Figure 11-26.
Define Formula window
Now that you have the patient’s full name combined, you can delete the Pat Last Name
field by clicking the data cell and pressing the Delete key. One task remains before previewing
the report, and that is to resize the fields so that each record will fit on a single line. Of the fields
you have used for the report, the Diagnosis and Address fields have the potential to be the
largest, as they are variable-length fields that usually contain between 20 and 50 characters.
For this example, size the Pat ID field to about .5 inches, expand the Diagnosis, Address 1, and
Address 2
fields to approximately 1.5 inches, and preview the report, as shown in Figure 11-27.
There will be as many x characters representing the data as there are characters found in the
largest value in the database field, which makes it easy to determine how much to resize each
column. The reason that the Address fields display NA is because this information was either
scrambled, in the case of the patient names, or modified to be NA to remove identifiable infor-
mation. Notice also in Figure 11-27 that each field automatically contains an interactive sorting
icon at the column heading level. Though clicking the icon will rerender the report, no actual
sorting will be performed until you configure it to do so. You will do that next.
4983ch11.qxd 10/7/05 11:20 AM Page 347
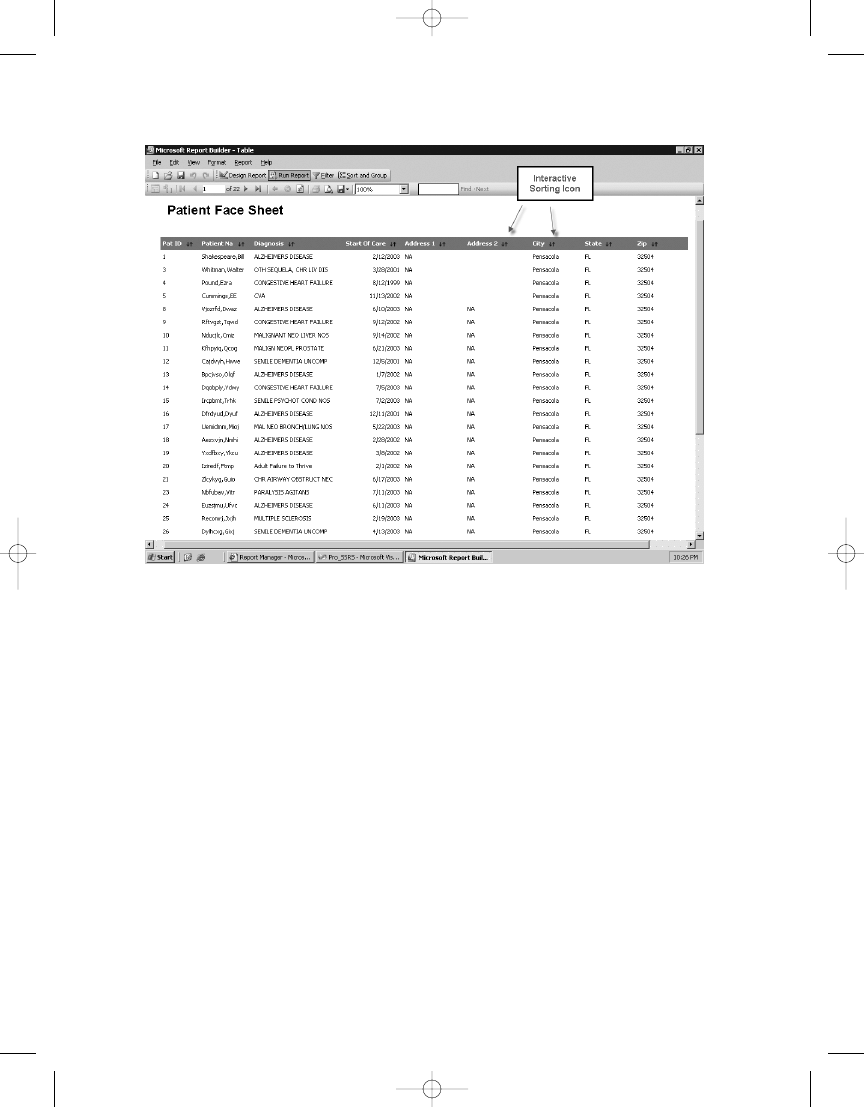
C H A P T E R 1 1
■
P E R F O R M I N G A D H O C R E P O RT I N G U S I N G R E P O RT B U I L D E R
348
Return to the design area of the report by clicking the Design Report button on the tool-
bar. Next, right-click the Pat ID data cell, and then select Sort and Group on the toolbar. This
will open the Sort dialog box. With the Patient Census group selected, choose to first sort by
Pat ID
, then by Patient Name, and finally by Diagnosis, as shown in Figure 11-28. You also
have the ability to put a page break after each group as a group option. Do not add a page
break at this time. Once you click OK, you can preview the report and see that the sorting for
each of the defined columns is working correctly.
We should mention one more thing about dragging fields to the table area of the report:
groups are automatically defined from left to right. In other words, dragging and dropping
fields to the right of another field keeps the field in the same group, in this case the Patient
Census group; however, if you have already dragged a field to the table and then drag another
one to the left of it, another group is created based on the name of the field that is dropped.
You can see this in Figure 11-29, where you dragged the Branch Name field to the left of the Pat
ID
field. If you are going through these steps, go ahead and drag the Branch Name field to the
report to see the automatic grouping.
Figure 11-27.
Previewing the Patient Face Sheet report
4983ch11.qxd 10/7/05 11:20 AM Page 348
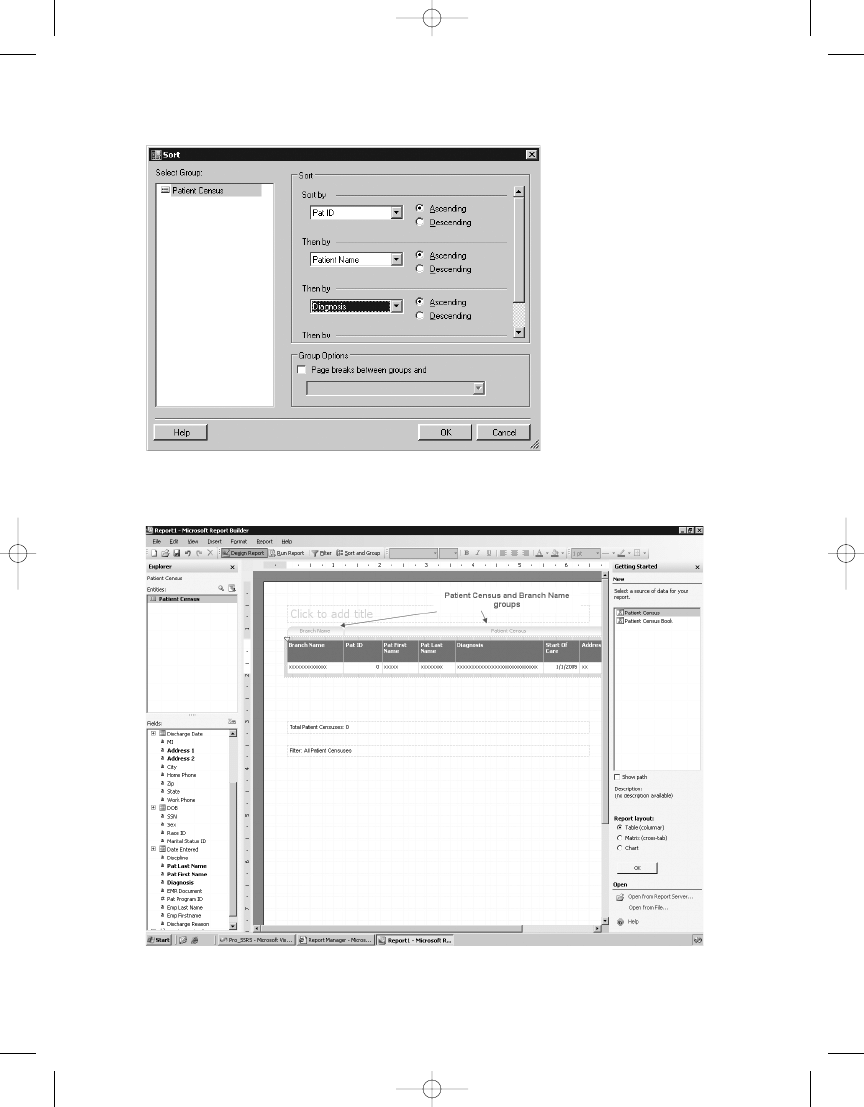
C H A P T E R 1 1
■
P E R F O R M I N G A D H O C R E P O RT I N G U S I N G R E P O RT B U I L D E R
349
Figure 11-28.
Sorting and grouping options
Figure 11-29.
Automatically created groups
4983ch11.qxd 10/7/05 11:20 AM Page 349
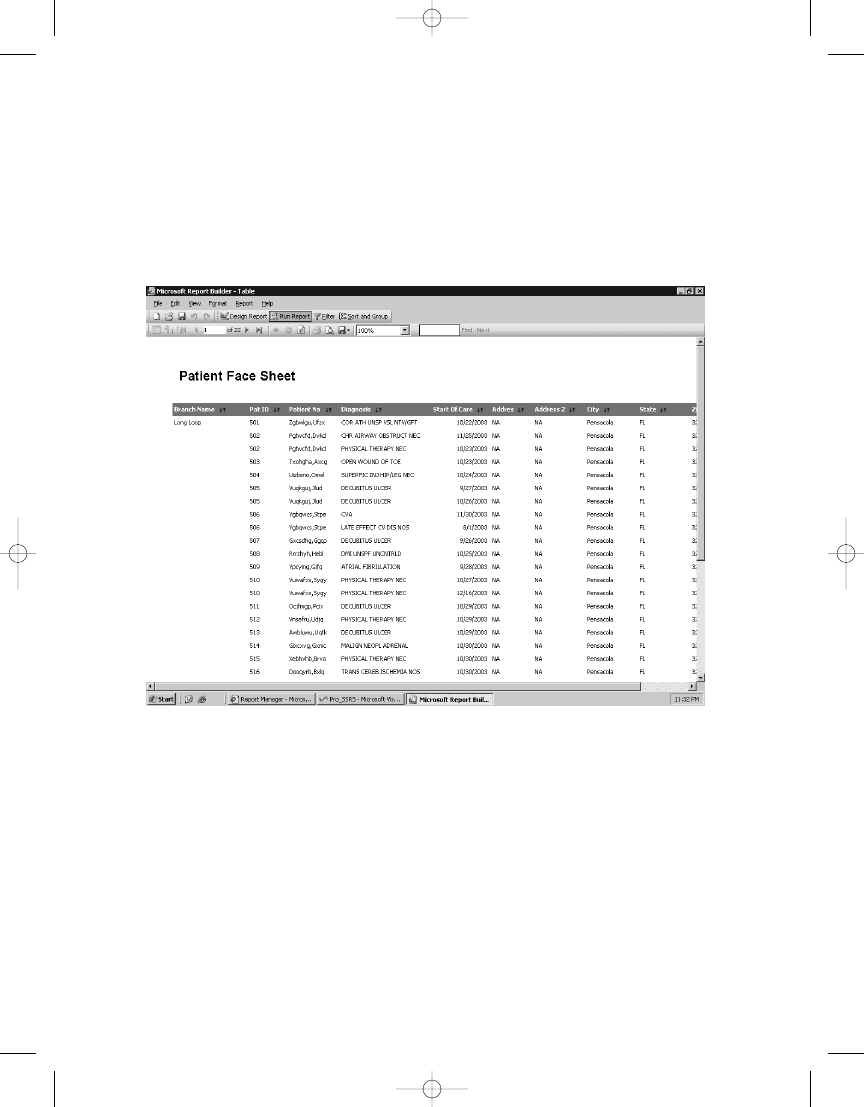
You can preview the report one last time before saving it to the report server. Notice in
Figure 11-30 that the newly added branch group hides duplicate values automatically and
groups each record from the Patient Census group under their assigned branch names. You
could, at this point, use standard formatting features such as adding a border or changing the
background color of cells or even the font size, color, and justification if you so desired, but
the base report meets your needs, so go ahead and deploy it.
C H A P T E R 1 1
■
P E R F O R M I N G A D H O C R E P O RT I N G U S I N G R E P O RT B U I L D E R
350
Figure 11-30.
Previewing new Branch Name group
Deploying the report to the report server is as simple as clicking the Save button on the
toolbar. After clicking Save, a Save Report dialog box appears that allows you to navigate to an
accessible folder on the report server; in this case, open Pro_SSRS to save the report. Name this
report Patient Face Sheet, as shown in Figure 11-31, and click the Save button.
You can navigate to the Report Manager later to make sure the report was saved success-
fully, but for now, you will move on to the next type of report you will learn how to create,
a matrix report.
4983ch11.qxd 10/7/05 11:20 AM Page 350
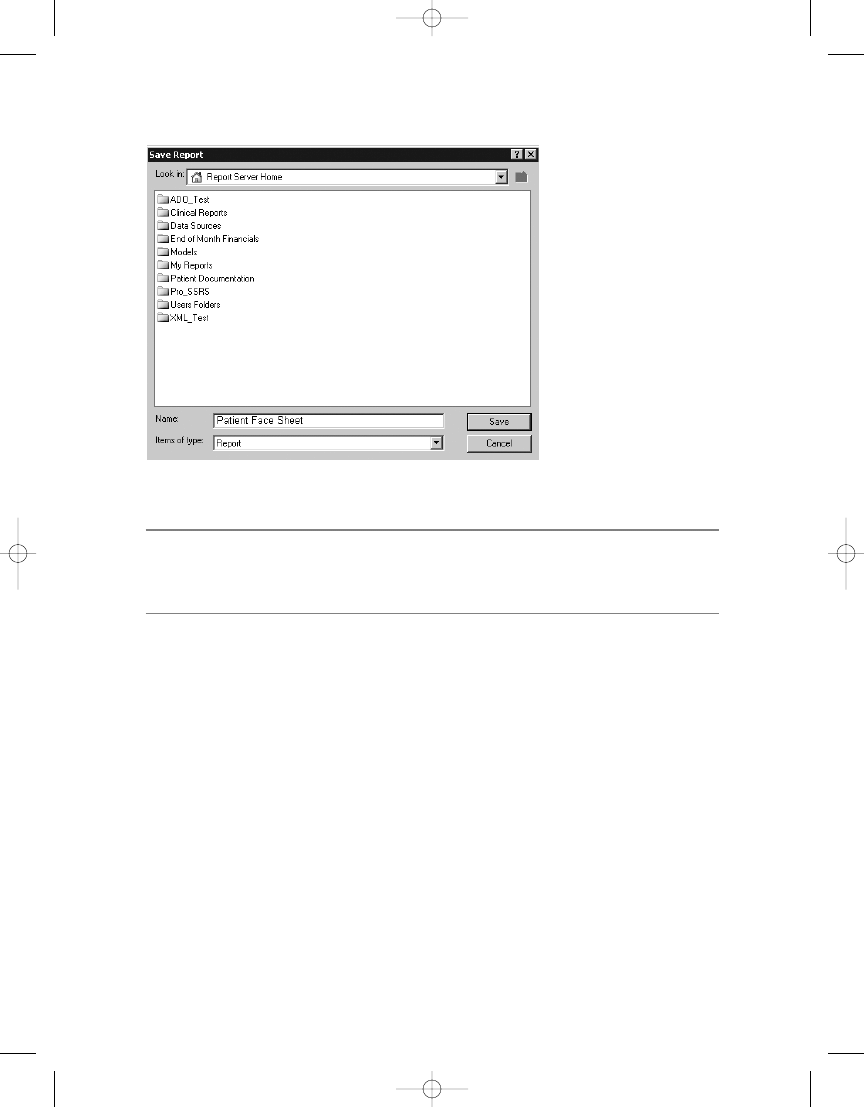
C H A P T E R 1 1
■
P E R F O R M I N G A D H O C R E P O RT I N G U S I N G R E P O RT B U I L D E R
351
■
Note
Though you will save the report to the report server and can load it back into Report Builder for
modification, it is possible to open a Report Builder RDL file from a file location as well. Opening a report
from a file is a choice in the task pane, accessible by selecting View ➤ Task Pane or by pressing Ctrl+F1.
Adding a Matrix Report
Unlike a table report, a matrix report displays aggregated values two-dimensionally with column
groups as well as row groups. The totals, whether they are sums, averages, or counts, intersect
at the grouping levels for columns and rows. This creates a cross-tab report similar to a pivot
table in Microsoft Excel. One of the requests for the report was to show the length of stay for
patients, from the time they were admitted to the time they were discharged. Also, it is a require-
ment that the discharge reason show on the report. You can combine these two requests
perfectly into a single matrix report.
So, return to the Report Builder design area, and click the matrix report in the Report Layout
tab. This opens a new blank matrix template where you can drag and drop fields onto the Matrix
data region, just as you did with the table report. The template is nothing more than a prede-
fined Matrix data region to which you will add several fields, as shown in Figure 11-32.
Figure 11-31.
Saving a report to the server
4983ch11.qxd 10/7/05 11:20 AM Page 351
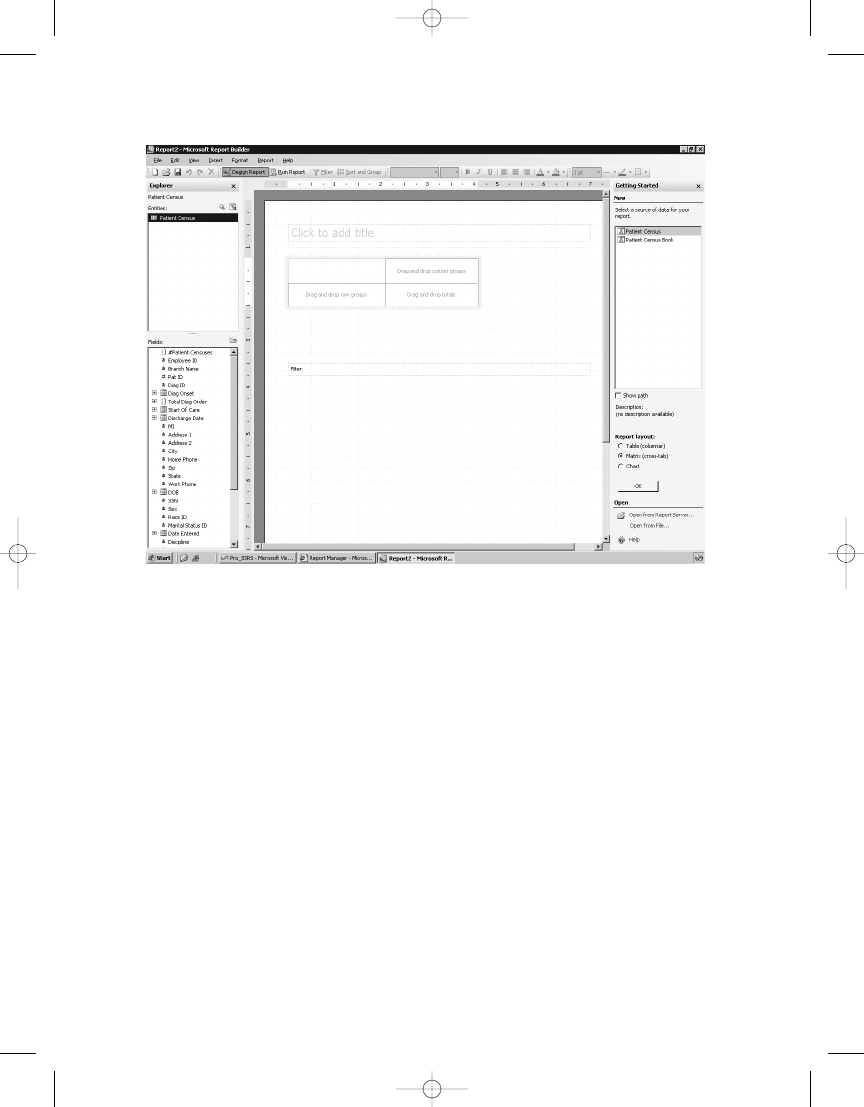
C H A P T E R 1 1
■
P E R F O R M I N G A D H O C R E P O RT I N G U S I N G R E P O RT B U I L D E R
352
Figure 11-32.
Blank matrix report
To the totals area, drag and drop the Avg Length of Stay under the Length of Stay attri-
bute that was calculated when the model was generated. For the row grouping, add the
Discharge Reason
field. Finally, drag the MaritalStatus ID field to the column grouping area
so that the matrix report resembles Figure 11-33. It will be necessary to resize the Discharge
Reason
field and center-justify the MaritalStatus ID field. You will also at this time add a title
to the report: Average Length of Stay.
4983ch11.qxd 10/7/05 11:20 AM Page 352
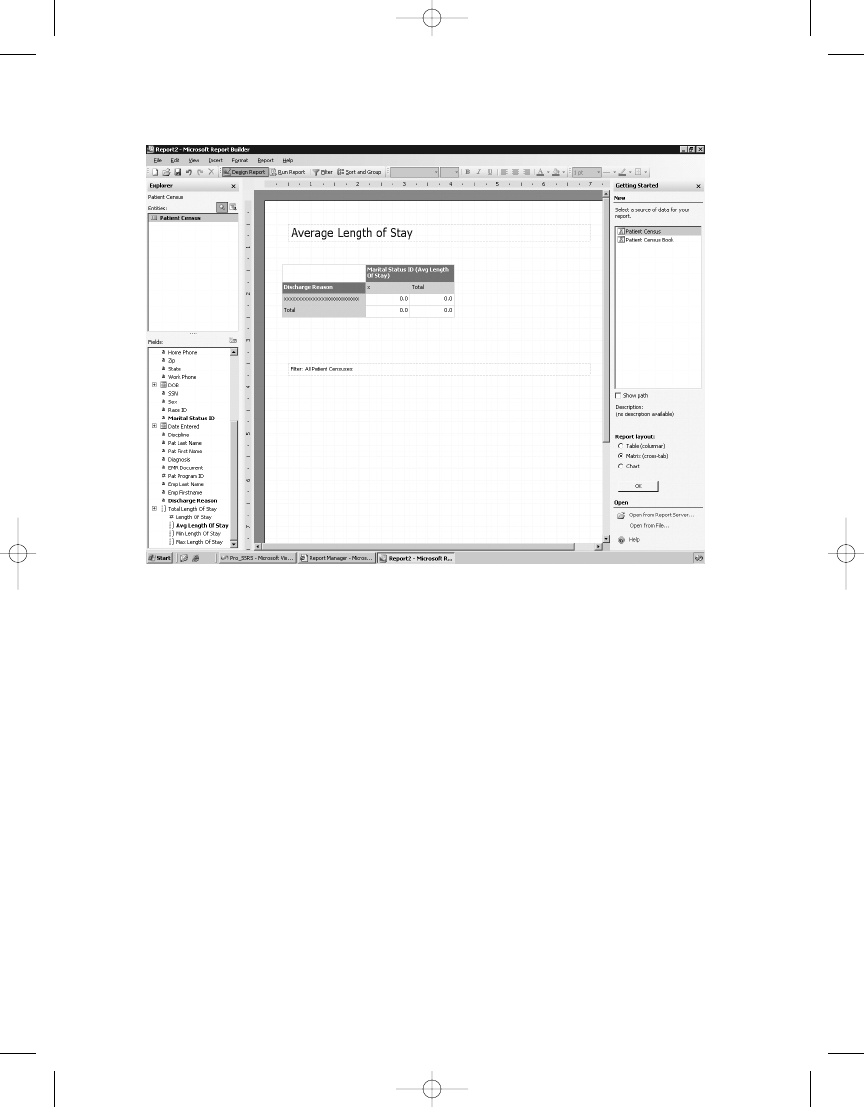
C H A P T E R 1 1
■
P E R F O R M I N G A D H O C R E P O RT I N G U S I N G R E P O RT B U I L D E R
353
Figure 11-33.
Matrix report with data
When previewed, the report is already taking shape, as shown in Figure 11-34; however,
you need to address some anomalies. First, the number format is not what you expected or
wanted. A general number, which by default is the data type assigned to the Avg Length of Stay
field, is not desired. You will need to add formatting to the number. Second, you will see rows
and columns with empty values. This is happening for two likely reasons. First, you are includ-
ing patients who have not been discharged yet, in other words, active patients. Second, marital
status is not a required field, so some records will not have values.
4983ch11.qxd 10/7/05 11:20 AM Page 353
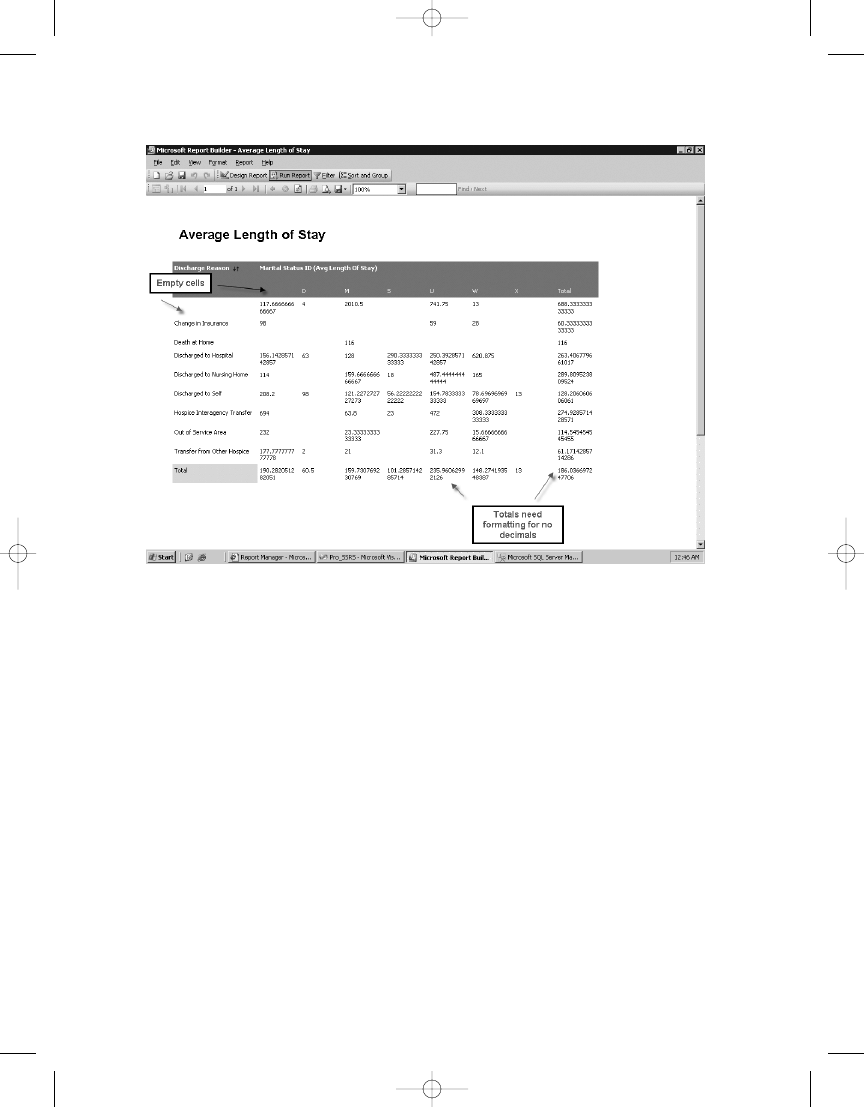
C H A P T E R 1 1
■
P E R F O R M I N G A D H O C R E P O RT I N G U S I N G R E P O RT B U I L D E R
354
Figure 11-34.
Initial preview of a matrix report
You can take care of the number formatting by returning to the design area, right-clicking
the last column, which is the total, and selecting Format. In the Format dialog box, change the
defined format from General to 1234.56, and change the decimal places from 2 to 0, as shown
in Figure 11-35. Then click OK.
4983ch11.qxd 10/7/05 11:20 AM Page 354
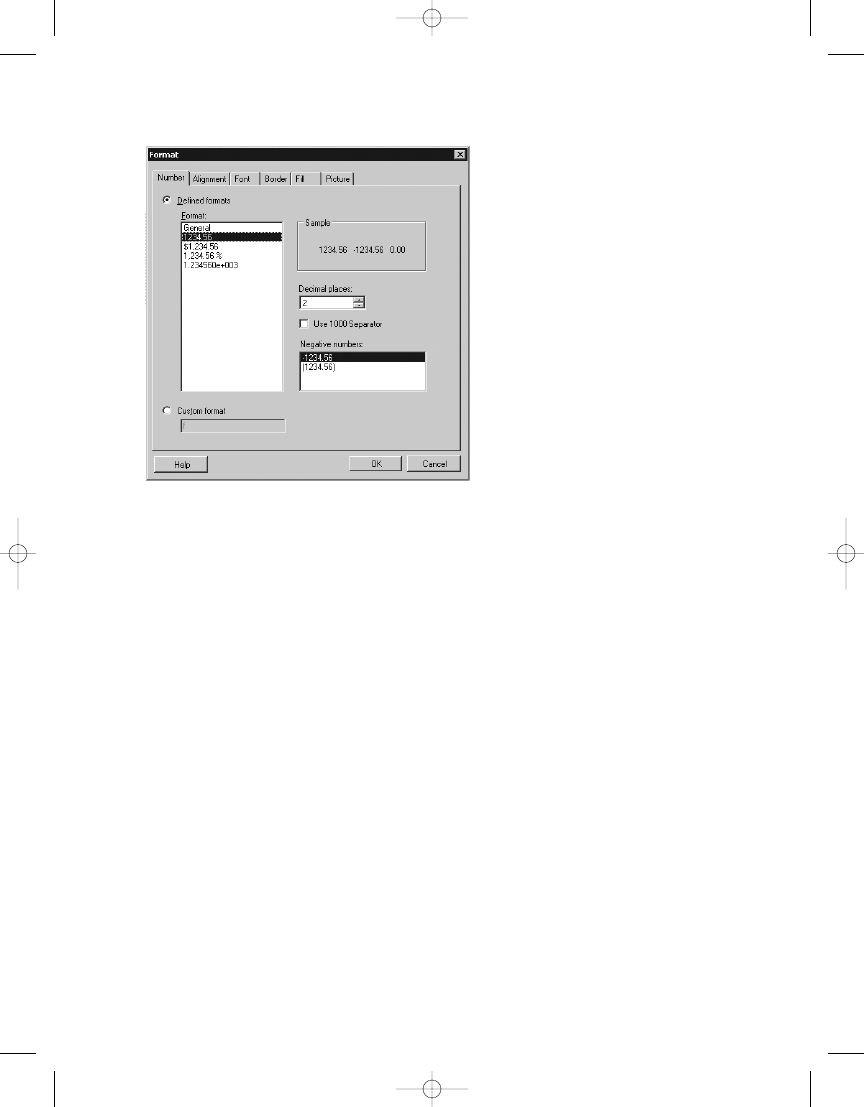
C H A P T E R 1 1
■
P E R F O R M I N G A D H O C R E P O RT I N G U S I N G R E P O RT B U I L D E R
355
To address the empty columns, add a filter to the report to limit the data to only discharged
patients with discharge reasons and to patients who have a marital status defined. The Filter
button on the toolbar will launch the Filter Data dialog box. In Figure 11-36 you can see that
you can add four filter conditions: where MaritalStatusID, Discharge Date, and Discharge Reason
are not empty and where the Discharge Year is greater than or equal to 2003. (We added the
last filter to demonstrate that it is possible to have the report prompt the user for a value as
a parameter that is tied to a filter.)
Figure 11-35.
Changing the number formatting
4983ch11.qxd 10/7/05 11:20 AM Page 355
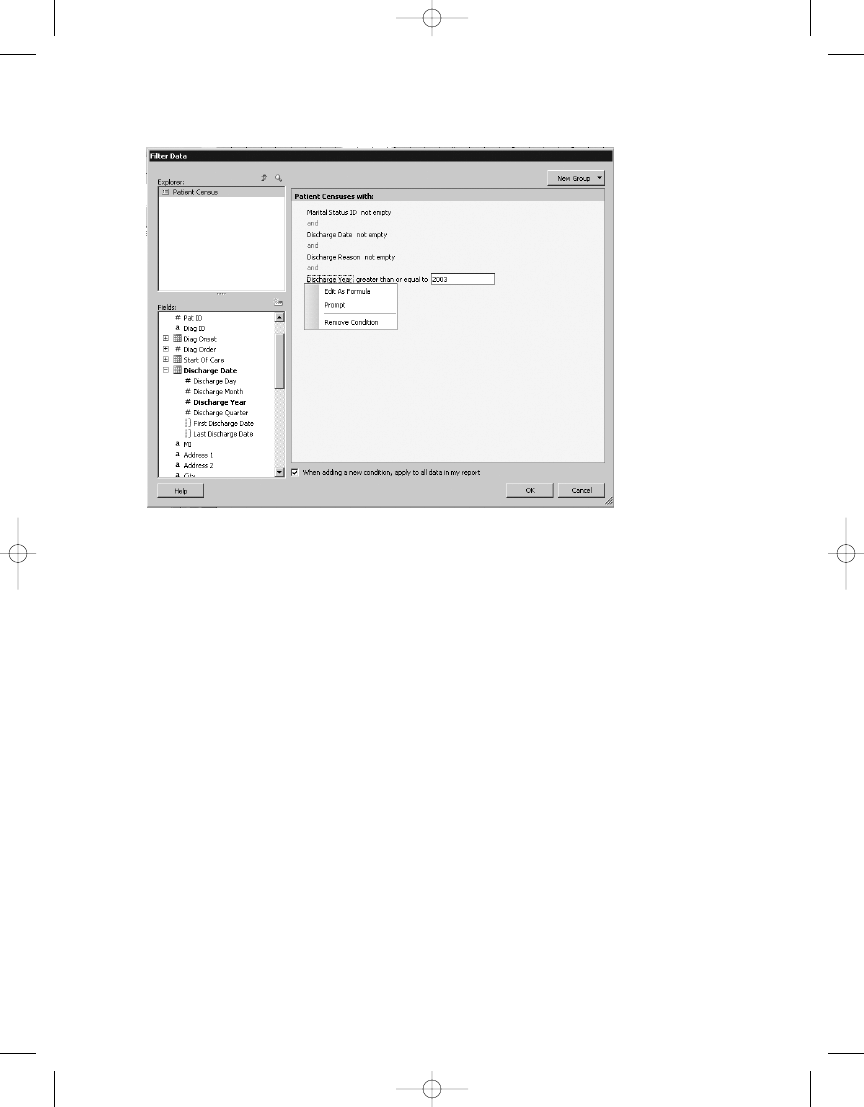
C H A P T E R 1 1
■
P E R F O R M I N G A D H O C R E P O RT I N G U S I N G R E P O RT B U I L D E R
356
Figure 11-36.
Setting up report filters
Now, when you preview the matrix report in Figure 11-37, you can see that the numbers
have been cleaned up and all empty fields are gone; also, you are prompted for the discharge
year. Save the report now to the Pro_SSRS folder on the report server, just as you did the table
report, and move on to create the final report, the chart.
4983ch11.qxd 10/7/05 11:20 AM Page 356
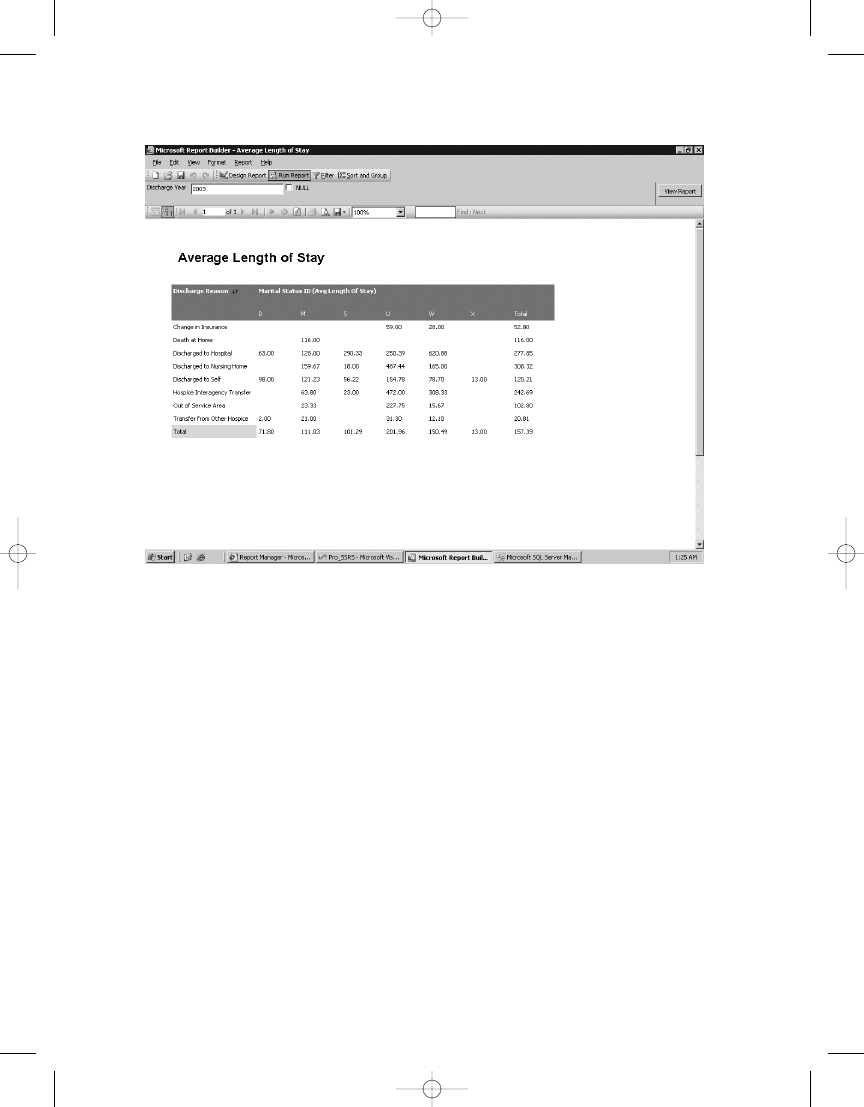
C H A P T E R 1 1
■
P E R F O R M I N G A D H O C R E P O RT I N G U S I N G R E P O RT B U I L D E R
357
Adding a Chart Report
The last report type available in Report Builder is the chart report. Thus far, you have created
and saved table and matrix reports to address many of the report requests for the Patient Cen-
sus report. Now, we will show one of the most important reports to answer the question of the
number of patients on the census, meaning they are currently receiving services and have not
been discharged. In the database you are using, a patient is considered active if their discharge
date is Null, or, in Report Builder vernacular, empty. The chart you create will be a simple bar
chart showing a count of active patients by their branch association.
Return to the design area of Report Builder, and click the chart report in the Report Layout
tab. The blank report template has a single Chart data region, as shown in Figure 11-38. As you
did with the two previous reports, table and matrix, you will add a title: Active Patient Census.
Figure 11-37.
Preview of matrix report
4983ch11.qxd 10/7/05 11:20 AM Page 357
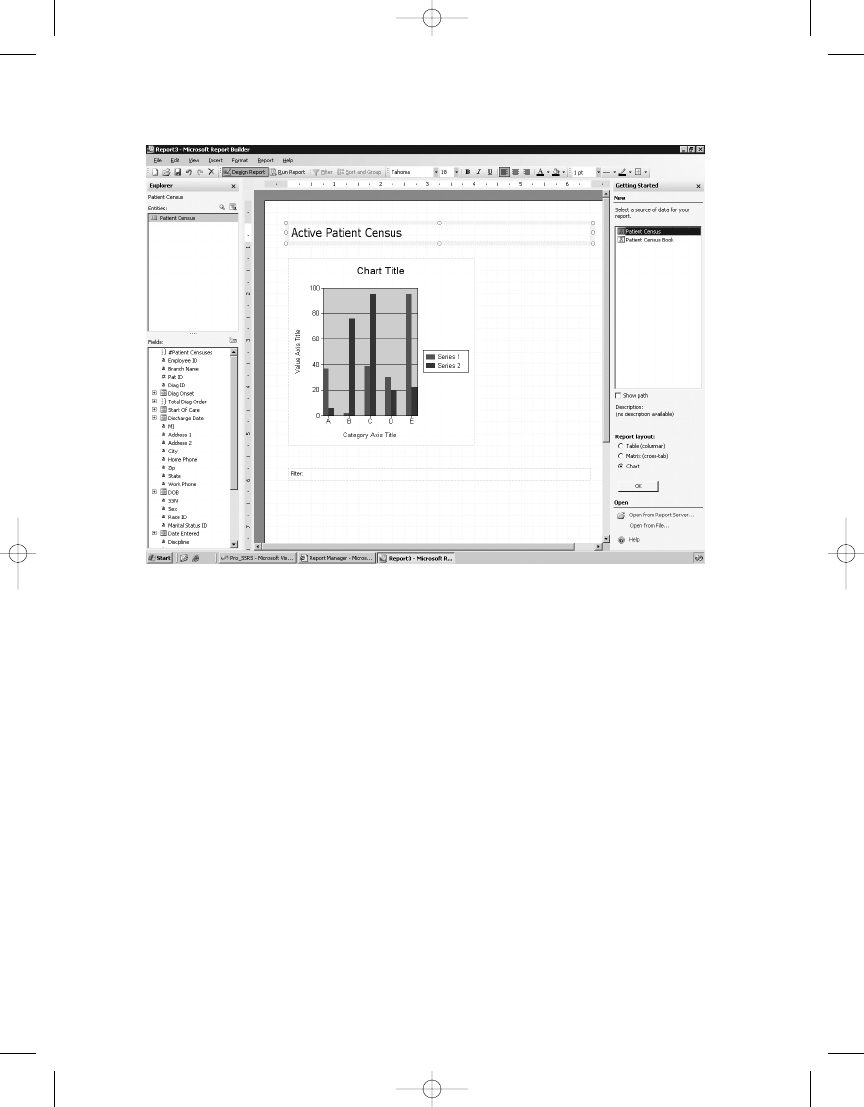
C H A P T E R 1 1
■
P E R F O R M I N G A D H O C R E P O RT I N G U S I N G R E P O RT B U I L D E R
358
Figure 11-38.
Chart report template
The chart has three areas to which you can drag and drop data: Series, Category, and Data.
You want to be able to show an active patient count, so you could drag the Pat ID field to the
Data area; however, because the Pat ID field is not seen as a field that can have an aggregated
function applied to it, unlike Avg Length of Stay, you cannot drag it directly to the Data area.
The chart simply won’t accept it to be dropped there. Since you know you will need both a count
value and a filter to get only active patients, you can take care of both at the same time by adding
a new field to the field list. Click the New Fields button in the Report Data tab, and name the
new field Patient Count, as shown in Figure 11-39. The formula you can use for the Patient
Count
field is COUNTDISTINCT(Pat ID). Notice that in the Define Formula dialog box that the Pat
ID
field, when added to the Formula textbox, has a dotted line beneath it indicating a link. You
can click the field and add a filter while defining the formula for the new field, which you will
do next.
Click the No Filter Applied link, and select Create New Filter to open the Filter Data dialog
box. You can see the filter you need to apply to show only active patients in Figure 11-40, where
you have set Discharge Date to “empty,” which will force only patients who do not have dis-
charge dates to be used in the formula. Call the filter Active Patients, and select OK. Once the
Patient Count
field is created and shows up on the Fields tab, you can drag and drop it in
the Data area of the chart.
4983ch11.qxd 10/7/05 11:20 AM Page 358
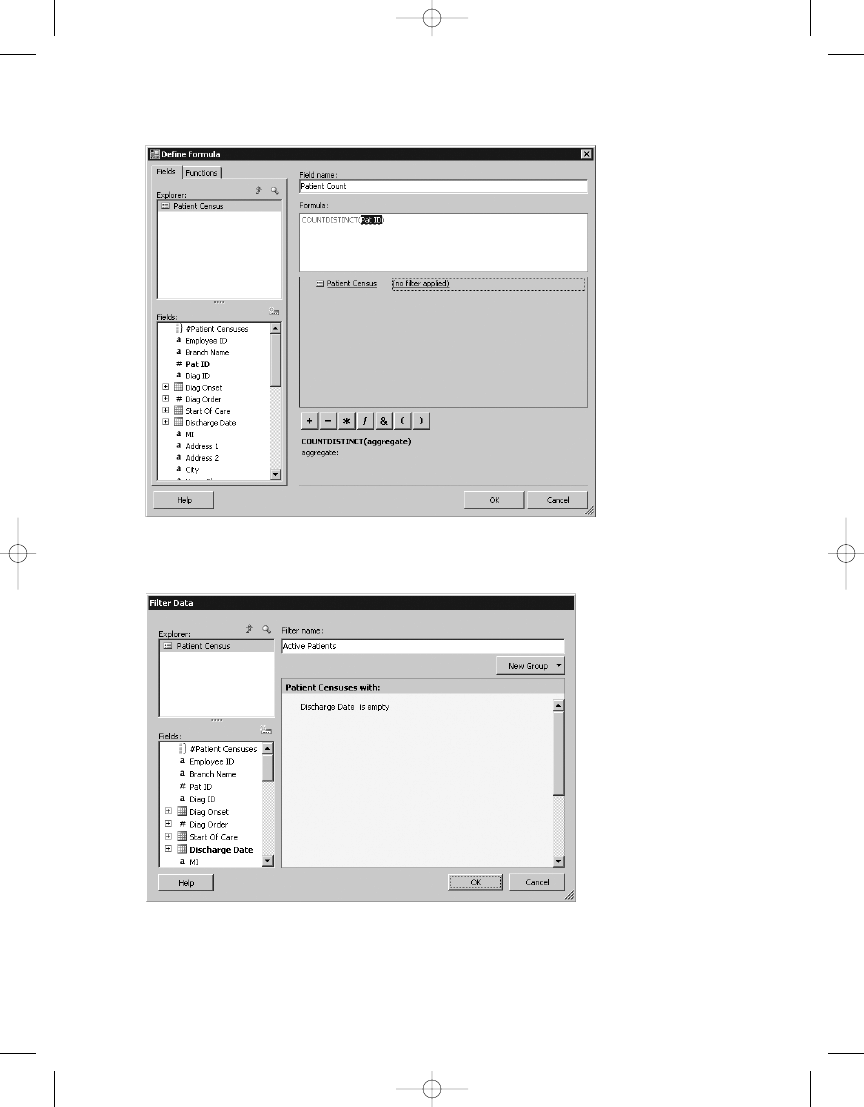
C H A P T E R 1 1
■
P E R F O R M I N G A D H O C R E P O RT I N G U S I N G R E P O RT B U I L D E R
359
Figure 11-39.
Defining formula for new field, Patient Count
Figure 11-40.
Adding the Active Patients filter
4983ch11.qxd 10/7/05 11:20 AM Page 359
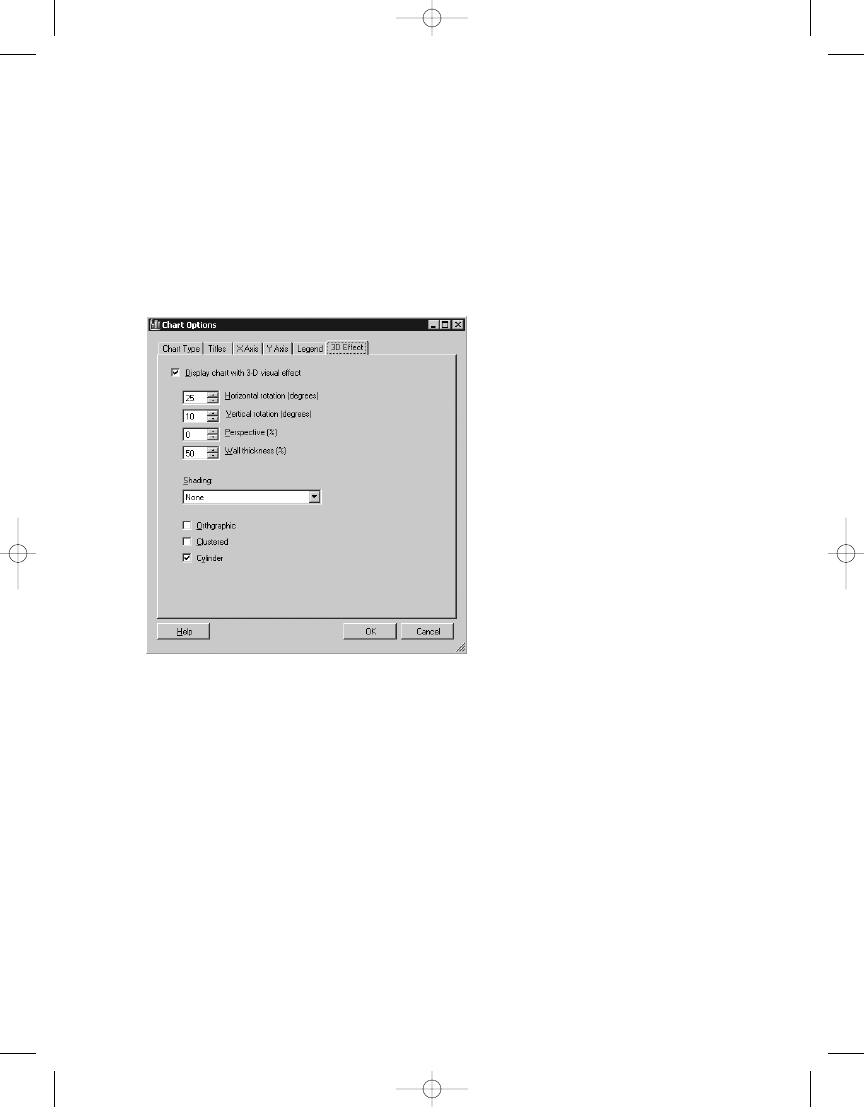
C H A P T E R 1 1
■
P E R F O R M I N G A D H O C R E P O RT I N G U S I N G R E P O RT B U I L D E R
360
Next, drag the Branch Name field to the Series area of the chart. You could add further series
items or categories to the chart, but to keep the chart simple and to address the request, you
will just apply some formatting to the chart by way of removing the chart title so that it does
not say Chart Title on the report. Leave the report title. To modify the chart properties, right-
click the chart, and select Chart Options. On the Titles tab, delete the text for the chart and the
Category X and ValueY titles. On the Legend tab, set the position to Bottom Center. Finally, on
the 3D tab, check the Display Chart with 3-D Visual Effect box, set Horizontal Rotation to 25,
set Vertical Rotation to 10, and select Cylinder as the shape, as shown in Figure 11-41.
Figure 11-41.
Setting 3D visual effects
The last task before previewing the report is to set the data labels on the chart. To do this,
right-click the chart, select Data Series, and then select Format Data Series–Patient Count. If
you would like to have the patient count value display on the bars of the chart, select Show
Point Labels. Make the position Bottom Center, set the angle to -10 degrees, and click the Font
button to set the font size to be 16. When you click OK to set the point labels and then preview
the report, you can see the chart with the active patient counts per branch. As patients are dis-
charged, they will drop from the active patient list because of the filter, and the chart will
automatically reflect the current census count. Figure 11-42 shows the completed chart. Now
you can save the chart report as Active Patient Census to the Pro_SSRS folder, as you did the
other two reports.
4983ch11.qxd 10/7/05 11:20 AM Page 360
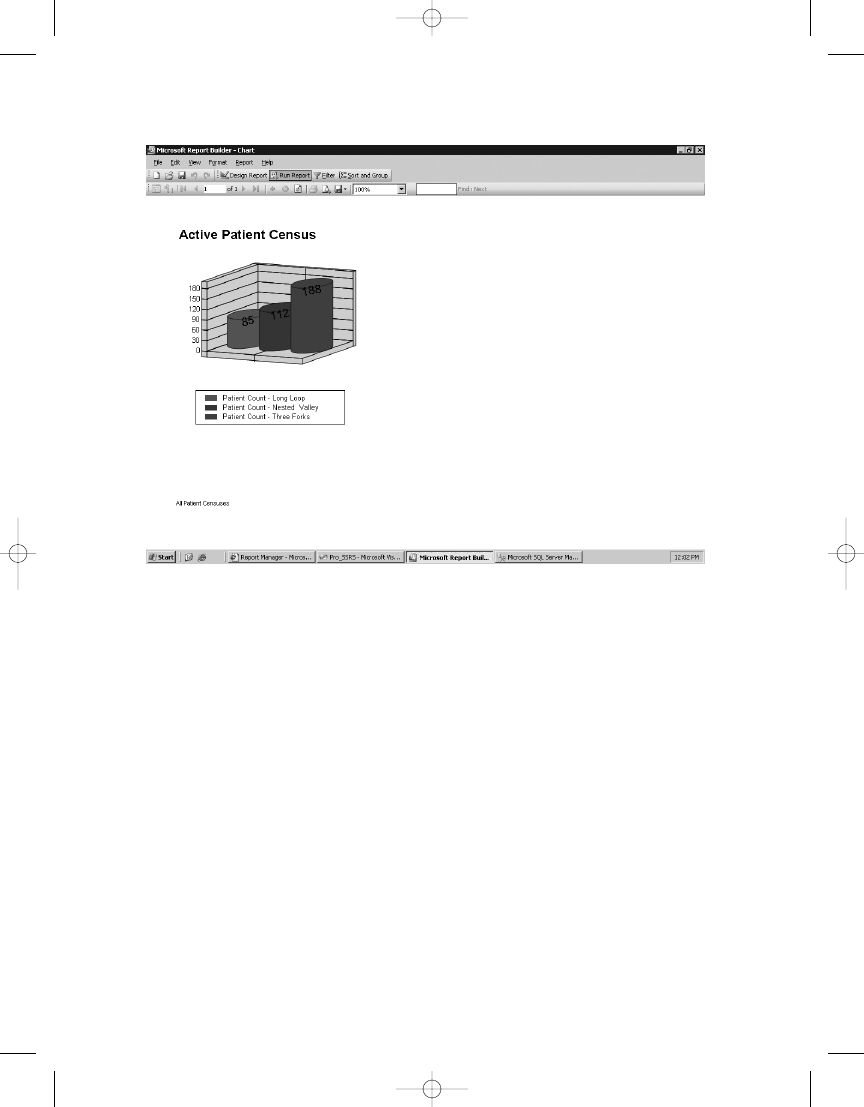
C H A P T E R 1 1
■
P E R F O R M I N G A D H O C R E P O RT I N G U S I N G R E P O RT B U I L D E R
361
Figure 11-42.
Preview of Active Patient Census chart report
The reports are deployed as standard RDL report files with the exception that their data
source is a report model and not a standard RDS data source object. You can see the three
newly published reports in Report Manager, as shown in Figure 11-43.
4983ch11.qxd 10/7/05 11:20 AM Page 361
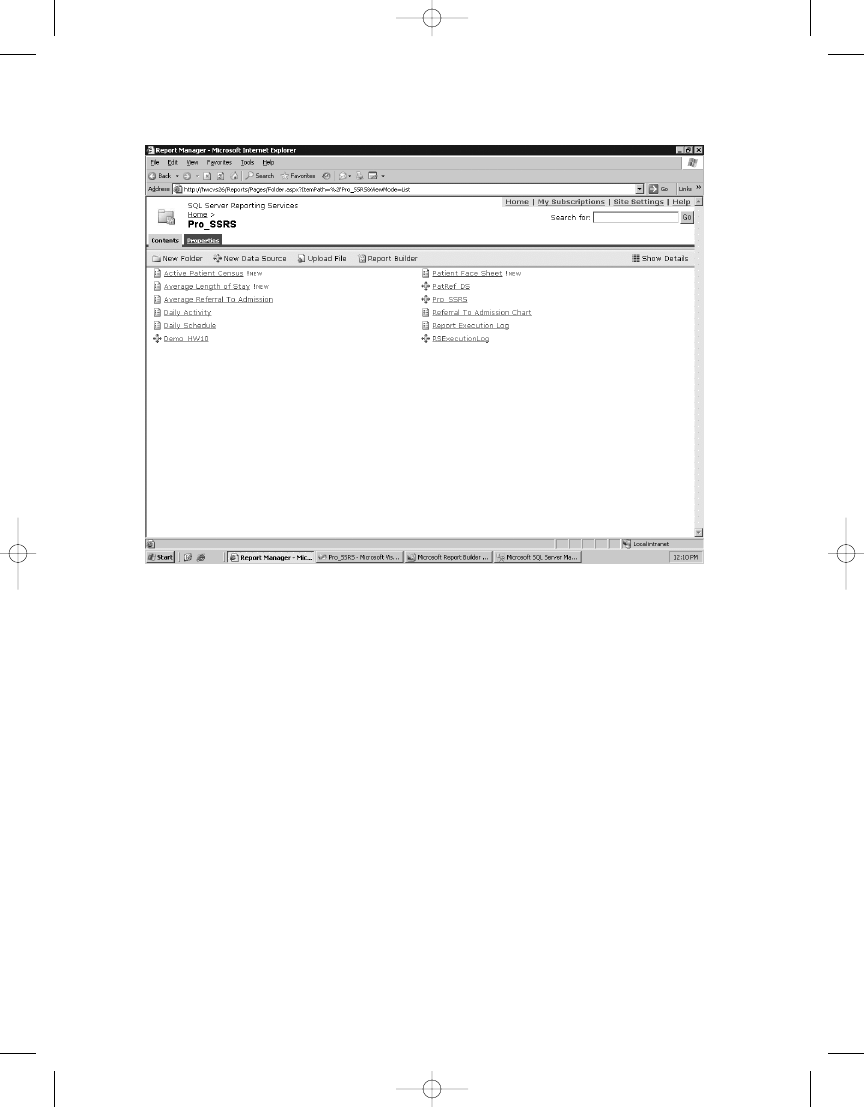
C H A P T E R 1 1
■
P E R F O R M I N G A D H O C R E P O RT I N G U S I N G R E P O RT B U I L D E R
362
Summary
Ad hoc reporting, giving users the ability to create their own reports on the fly, has been a highly
requested feature for SSRS, so much so that Microsoft decided to deliver its first incarnation in
SQL Server 2005. Though it lacks the true versatility of BIDS or Visual Studio, the functionality
serves its purpose as a front-end report builder. DBAs and data analysts still need to be involved
to produce the report model, which contains the metadata layer separating the report designer
from the complicated structure of the underlying data source. But Report Builder will con-
tinue to develop in complexity and features and will become better equipped to design more
sophisticated reports. In this chapter, you learned about some of its benefits and many of its
limitations, and you probably have come away with an answer to the question of whether Report
Builder is something your users will want. If so, then the good news is that it is included as
a standard feature.
Figure 11-43.
Report Builder reports published in Report Manager
4983ch11.qxd 10/7/05 11:20 AM Page 362

■
Symbols
& (ampersand), 346
& parameter, URL, 149
__ characters, 347
= (equal sign), 50
? parameter, URL, 149
■
A
AcctPeriodMonth parameter, 200
AcctPeriodYear parameter, 200
ACT (Application Center Test), 226
Active Directory, 46, 243
Active Directory Users and Computers
window, 262
Active Solution Configuration drop-down list,
183
ActivityDate field value, 219
ad hoc queries, 30
ad hoc reporting
getting user feedback, 322–324
overview, 321–322
Report Builder
adding chart report, 357–358
adding matrix report, 351–357
creating table report, 344–350
overview, 341–343
report model
adding data source, 325–326
adding report model to BIDS, 324–325
creating, 334–340
creating data source view, 328–334
overview, 324
Add New Data Source, 328
Add Reference dialog box, 243
Add Web Parts, 315
Add Web Reference, 185
Admissions table, 328
ampersand (&), 346
Analysis Service Cube, using with SSRS, 301
Analysis Services, 286, 294
Analysis Services 2005, 296
Analysis Services data source, setting up, 301,
303
APIs (application programming interfaces)
access method, 9
Application Center Test (ACT), 226
application programming interfaces (APIs)
access method, 9
application service provider (ASP), 249
Apress Web site, 18
AR Reconciliation report, 199
AR Reconciliation.rdl report definition file, 199
ASP (application service provider), 249
ASP.NET applications, 156
Attach Databases dialog box, 288
auditing reports
log file auditing, 278
overview, 277
SSRS auditing, 277
authenticating data sources, 262
Authentication type, 179
Authorization category, of Web Services
Methods, 163
autogeneration methods, 334
■
B
BI platform, Microsoft, 285
BIDS (Business Intelligence Development
Studio), 6
adding report model to, 324–325
adding reports, 40
basic IDE, setting up, 38–39
BIDS tool, 10
data sources and datasets, setting up, 41,
43, 45–46
expressions, 50–51
filters, setting up, 48, 50
overview, 36–37
Report Definition Language (RDL), 39–40
report deployment using, 181–183
setting parameters, 46–48
Binary Large Objects (BLOBs), 73
Blank value, 44
BLOBs (Binary Large Objects), 73
block layout, for reports, 84
Bookmark feature, 96
Border Style property, 87
Branch group, 112
Branch Name field, 348
Branch table, 18
Browse buttons, 187, 191
Browser role, 263
Build options, Configuration Manager, 182
Index
363
4983chIDX.qxd 10/7/05 11:43 AM Page 363

built-in functions, 346
built-in logging feature, 225
BUILTIN\administrator group, 270
business intelligence. See BIDS (Business
Intelligence Development Studio);
SharePoint Web parts; SSMS (SQL
Server Management Studio)
Business Intelligence Development Studio.
See BIDS (Business Intelligence
Development Studio)
■
C
caching, 209–211
calculated members, 304
CanGrow property, 62
CanShrink property, 62
CASE statement, 32–33
CAST function, 293
Certificate Services, Windows, 255
ChargeInfo table, 19
Chart data region, 69–70, 73, 114, 357
chart report, 357–358, 361
Chart report objects, 53
class variables, 236
class-level variable, 188
click event, 189
Run Server button, 158
runLocal button, 161
ClickOnce technology, 342
client components, 14
Code class, 128
Code element, 130
Code member, 128
Code tab, Report Properties dialog box, 127
code-behind feature, 132
CodeGroup section, rssrvpolicy.config file, 137
color format property, 103
Color property, 128
column ID fields, 328
Column_Group parameter, 229
ComboItem class, 167, 237
Command parameter, URL, 152
Command Type drop-down list, 105
command-line utilities tool, 10
comma-separated values (CSVs), 10
Configuration Manager, 182–183
configuration Property Pages, 182
Connect Using option, 212
Connection Manager, 326
Connections property, 317
content management (on SSRS report
server). See also subscription
management
creating snapshots for report history, 206,
208–209
executing reports and performing caching,
209, 211
overview, 198
setting up data source for report,
205
setting up shared schedules
configuring report to use shared
schedule, 200–202
creating shared schedule, 199–200
overview, 198–199
updating and uploading RDL file using
Report Manager, 202–205
Content Manager role, 263, 270
Content Managers role, 340
Corporate style, for report layout, 84
CostPerVisit method, Employee class,
141
CostPerVisitWS method, Employee class,
142–143
CostPerVisitXML method, Employee class,
141, 143
COUNT function, 26, SQL
CPU utilization, 232
Create Custom Schedule form, 224
Create Date Variations, 337
Create Named Query window, 330
Create Page Web page, 308
CREATE PROCEDURE command, 30
CreateEmpSvcCost.sql file, 30
CreateFieldInfo.sql file, 20
CreateReport method, 184, 192, 194
CreateSubscription method, 238–239
Credential parameters, 150, 152
credentials, 275
Credentials parameter, GetReportParameters
method, 166
cross-tab report, 351
Crystal Reports, 282, 286
CSVs (comma-separated values), 10
custom assemblies
debugging, 143–145
deploying, 136–140
overview, 132–133
troubleshooting project, 145–146
custom clients tool, 10
custom report viewer, 282
■
D
Daily Schedule report, 271
Data source connections category, Web
Services Methods, 163
Data Source value, 289
data source views, 325
Data Source Views folder, 328
Data Source Wizard, 325
data sources, 325
Data Sources folder, 325, 339
Data Transformation Services (DTS), 295
data warehouse database, 297
■
I N D E X
364
4983chIDX.qxd 10/7/05 11:43 AM Page 364

Database Details section, 288
data-driven subscriptions, 211, 268
creating, 219–221
designing subscription query, 217, 219
overview, 217
DataSet method, 135
Date control, 102
DateDiff function, 337
DateFrom parameter, 103
DATEPART function, 201
DateTime data type, 337
DateTo parameter, 103
default parameter values, 107, 293
default user interface, 148
Define Formula dialog box, 346, 358
Define Query Parameters dialog box, 105
Definition parameter, 185
Delete key, 347
Delivery Processor, 10
demilitarized zone (DMZ), 279
Deploy option
in BIDS and Visual Studio 2005, 181
in Configuration Manager, 182
in SQL Server BIDS, 175
deploying reports. See report deployment
deployment models
implementing for internal access,
282–283
implementing SSRS with Terminal
Services, 279, 281–282
overview, 278–279
Description parameter, 238
Description property, 185, 195
design process, 24
Design Report button, 348
Designer mode, 170
Diag table, 19
dimensional elements, 304
Directory Services, Microsoft, 45
DirectorySearcher, 243
DisciplineID field, 100
Display Estimated Execution Plan button,
SSMS, 27
DMZ (demilitarized zone), 279
DMZ-facing network cards, 280
DocMap parameter, HTML Viewer
command, 151
DocMapID parameter, HTML Viewer
command, 151
Document Map Label property, 90
document mapping, 90
hyperlink actions
adding URL links, 100
building URL link with report
parameters, 101–102
jumping to a report, 102–103
overview, 95–96
interactive sorting, 93, 95
overview, 90–91
visibility, 91–93
drill-through reports, 102
Drop Column Fields, 344
dsp parameter, URL, 152
dsu parameter, URL, 152
DTS (Data Transformation Services), 295
dynamic query, 46
■
E
e option, 261
Edit Capture Filter button, 253
Edit Expression dialog box, 130, 142
Edit Formula, 346
electronic medical record (EMR), 73
ellipsis button, 180
e-mail subscription, 211
embeddable SSRS controls, 5
embedded code, using with reports
accessing .NET assemblies from
embedded code, 131–132
ExceedMaxVisits function, 125–126, 128,
131
overview, 124
Emp_Svc_Cos database, 33
Emp_Svc_Cost stored procedure, 31, 41, 46,
53, 276
Employee assembly, 136
Employee class, 142
Employee Service Cost report, 155, 244
Employee table, 18
Employee_Cost field, 143
Employee_Cost textbox, 141
EmployeeID parameter, 133, 272
EmployeePay.xml file, 133, 138
EmployeeServiceCost.rdl file, 143
EmployeeServices.sql file, 25
employeetblID parameter, 274
EMR (electronic medical record), 73
encrypting data
overview, 250–251
securing network traffic using SSL
analyzing HTTP traffic, 251–254
applying SSL certificate, 255
capturing HTTPS traffic, 256–258
overview, 251
securing data storage in SSRS, 259–261
Encryption Key page, 260
encryption keys, 259
EndFind parameter, HTML Viewer
command, 151
enhanced expression builder, Reporting
Services, 5
equal sign (=), 50
Error List window, IDE, 38
Estimate_Cost field, 54
■
I N D E X
365
4983chIDX.qxd 10/7/05 11:43 AM Page 365

Estimated_Cost field, 61
EventType parameter, 238
ExceedMaxVisits function, 125–126, 128, 131
Excel 2002 and 2003, 9
Exchange Server, Microsoft, 243, 286
Execute permission, 33
execution category, Web Services Methods,
163
execution log database, 227
execution logging, 226
Execution permission, 131
Execution Plan tab, SSMS, 27
execution snapshot, 211
execution times, 27
ExecutionLog database, 227
ExecutionLog table, 226–227
expression builder application, 50
eXtensible Markup Language (XML), 9
ExtensionSettings object, 239
ExtensionSettings parameter, 238
extraneous fields, 328
■
F
FallbackPage parameter, HTML Viewer
command, 151
feedback, 321–324
Fields global collection, 273
Fields window, IDE, 38
FileStream class, 192
Filter Data dialog box, 358
filtering reports, 262, 273–274
filters, applying, 111
final report execution option, 211
find-and-replace method, 39
FindString parameter, HTML Viewer
command, 151
fn_MVParam function, 119
footers, adding to reports, 114
foreign key fields, 19
Form_Load event, 166
Format default value, 229
Format dialog box, 354
Format parameter, URL, 152
Forms constructor, 239
ForRendering parameter,
GetReportParameters method, 166
free-form container objects, 53
FullTrust permission, 131, 137
■
G
Get_Image, Image Start.rdl report, 73
GETDATE function, 219
GetImage parameter, HTML Viewer
command, 151
GetParameters class, 165, 170
GetParameters form, 163, 165, 170, 239
GetParameters_Load event, 166–167
GetParameters.cs form, 163
GetReportParameters method, 162, 166–167,
169
Global collection, 48
globally unique identifier (GUID) data type,
293
graphical design mode, 303
graphical MDX query builder, Reporting
Services, 5
graphical query builder, 330
graphical query designer, 22
Group On section, 60
group option, 348
Grouping and Sorting Properties dialog box,
60
GUID (globally unique identifier) data type,
293
■
H
headers, adding to reports, 114
Healthware namespace, 141
hide parameters, 109
High encryption, 281
history snapshot, 211
HistoryID parameter, GetReportParameters
method, 166
Home folder, 180
HTML (HyperText Markup Language), 9
HTML Viewer commands, 151
HTML viewer parameters, 150
HTMLOWC, 226
HTTP traffic, analyzing, 251–252, 254
HTTPS traffic, capturing, 256, 258
Hw_Analysis database, 297
HW_Reports report file, RDL, 295
HWC04 system, 233
HWCI\RN security group, 271
HWCVS26 SSRS installation, 260
HWUserLogin field, 221, 274
hyperlink actions, 98
adding Bookmark links, 99
adding formatting and tooltips, 103–104
adding URL links, 100–102
jumping to a report, 102–103
overview, 90, 95–96
HyperText Markup Language (HTML), 9
■
I
Icon parameter, HTML Viewer command,
151
IDE (integrated development environment),
12
IIF function, 201
IIS (Internet Information Services), 250
Image report objects, 53
Image Start.rdl report, Pro_SSRS project, 73
Import option, SSMS, 175
■
I N D E X
366
4983chIDX.qxd 10/7/05 11:43 AM Page 366

IN clause, 48, 116
initialization file, 227
Insert column, 59
instance-based methods, 141
integrated development environment (IDE),
12
Integrated Security and Accelerator (ISA)
server, Microsoft, 251
interactive sorting, 6, 90, 93, 95
interactivity in reports, 89–90
Internet Information Services (IIS), 250
Internet-facing server, 15
Internet-hosted deployment model, 251
Internet-hosted model, 281–282
IPSec protocol, 250
ISA (Integrated Security and Accelerator)
server, Microsoft, 251
ISA server, 282
ISNULL function, 32–33
Item parameter, 188
■
L
L2TP (Layer 2 Tunneling Protocol), 250
labels, printing, 78
LastName fields, 330
Layer 2 Tunneling Protocol (L2TP), 250
LDAP query, 46
.ldf extension, 288
Lead Conversion report, 291, 293
Lead Summary.rdl file, 289
LeadBase table, 291
Linked reports category, Web Services
Methods, 163
List data region, 53, 55, 57, 59, 95
List Properties dialog box, 55
List report objects, 53
List Start report, 53
<List> element, 58
ListChildren method, 188, 190
ListSchedules method, Report Server Web
service, 237
Load event, 237
LocalReport.DataSources.Add
property/method, ReportViewer, 156
LocalReport.ReportEmbeddedResource
property/method, ReportViewer, 156
log file auditing, 278
logical primary key, 332
login name value, 273
■
M
Manage Point library, 310
MatchData parameter, 238
Matrix data region, 67, 69
matrix report, 350–357
Matrix report objects, 53
Matrix Start.rdl report, 67
matrix template, 351
MAX function, 304
.mdf extension, 287
MDX query builder, 303–304, 307
MHTML (Mobile HTML), 10
Microsoft CRM
1.2 ReportPack Readme.htm file, 287
extending with SSRS
creating custom SSRS reports for
Microsoft CRM, 291
creating Lead Conversion report, 293
creating Sales Projections Chart report,
292–293
overview, 286–287
using report pack for Microsoft CRM
1.2, 287–291
overview, 285
Microsoft Directory Services, 45
Microsoft Exchange Server, 243, 286
Microsoft Project, 285
Microsoft SharePoint Portal Server (SPS), 6,
286, 306
Microsoft SQL Server Analysis Services, 302
Microsoft.Reporting.WinForms namespace,
158
MIME (Multipurpose Internet Mail
Extensions) type, 74
MIN function, 304
Mobile HTML (MHTML), 10
Models folder, on report server, 338
Modify Shared Page, 312, 315
Modify Shared Web Part, 311
Month parameter, 116
MSReportServer_ConfigurationSetting class,
246
MSReportServerReportManager_Configurati
onSetting class, 246
multicolumn report, creating for printing
labels, 78
multidimensional data, 298
Multipurpose Internet Mail Extensions
(MIME) type, 74
Multi-value checkbox, 47
multivalue parameters, 5, 47, 116–117,
119–120
My Reports feature, 263
My Reports folders, 265
■
N
Namespace management category, Web
Services Methods, 163
.NET class library property values, 293
.NET Framework 2.0, 342
network interface card (NIC), 251
Network Monitor utility, 251
New Fields button, 358
New Named Query button, 329
■
I N D E X
367
4983chIDX.qxd 10/7/05 11:43 AM Page 367

new table element, 99
NIC (network interface card), 251
No Filter Applied link, 358
Now( ) function, 96
NULL values, 44, 47, 106
■
O
Object Explorer, 179
ODBC provider, 45
Office Web Components (OWC), 9, 90,
228–229, 230–231
OLAP (Online Analytical Processing) Services,
4, 18, 296
OLE DB provider, 45
Online Analytical Processing (OLAP) Services,
4, 18, 296
openFileDialog control, 192
ORDER BY PATID clause, 26
organizational unit (OU), inside Active
Directory, 262
Orientation property, 345
OU (organizational unit), inside Active
Directory, 262
Overwrite parameter, 185
OverwriteDataSources property, 181
OWC (Office Web Components), 9, 90,
228–229, 230–231
■
P
Padding property, 87
page footers, 114
page headers, 114
Page Setup dialog box, 345
Param parameter, URL, 149
parameter input, 221
parameter values, 215
parameterized stored procedures, 17, 105
overview, 30–32
testing the procedure, 33–34
using case and ISNULL to evaluate
parameters, 32–33
parameterPanel control, FlowLayoutPanel,
163
parameters, multivalued, 116–120
Parameters dialog form, 172
Parameters page, 224
Parameters parameter
CreateSubscription method, 238
HTML Viewer command, 151
Parameters property, GetParameters class,
170
ParameterValue object, 239
ParameterValues parameter,
GetReportParameters method, 166
Parent parameter, 184
password option, 261
Pat ID data cell, 348
Patient Census object, 332–333
patient face sheet, 344
patient identifiable (PI) data, 250
Patient table, 18
Patient_Name field, 60–61
PatPhysician table, 20
PatProgramID field, 332
PDF (Portable Document Format), 9
Permissions property page, 33
PI (patient identifiable) data, 250
PickSchedule form, 239
PickSchedule_Load event, 236
PickSchedule_Load method, 237
PickSchedule.cs form, 242
PickScheduled class, 235
pipeline reports, 292
PivotTables, 228, 230, 351
point labels, 71
Point-to-Point Tunneling Protocol (PPTP),
250
Portable Document Format (PDF), 9
PPTP (Point-to-Point Tunneling Protocol),
250
Prefix parameter, URL, 149
Preview Report box, 84
printing labels, 78
private ReportingService2005 rs variable
definition, 188
Pro SSRS data source view selection, 334
Pro_SSRS data source, 328–329
Pro_SSRS database, 18, 33, 41, 295, 322
Pro_SSRS folder, 356
Pro_SSRS project, 267, 297
Pro_SSRS report project, 199
Pro_SSRS solution, 36, 53, 289, 324
Pro_SSRS.rds data source, 242
Pro_SSRS.rds file, 42, 126
ProcessingMode property/method,
ReportViewer, 156
Profiler trace, 20
Project, Microsoft, 285
project management report, 295
projects, BIDS, 36
Properties parameter, 185
Properties window, IDE, 38, 128, 223
Property[ ] objects, 185
Publisher class, 188
Publisher role, 263
Publisher.cs form, 191
■
Q
query design
creating advanced query, 24–30
creating simple query graphically, 21–24
overview, 21
query optimizer, 27
query parameters, 46
■
I N D E X
368
4983chIDX.qxd 10/7/05 11:43 AM Page 368

Query string textbox, 43
Query String window, 105
■
R
rc:Toolbar parameter value, 152
RDL (Report Definition Language), 1, 39–40
rdl file, 180
RDL files, 202, 205, 361
RDP (Remote Desktop Protocol), 250
.rds extension, 42
.rds file, 268
Rectangle data region, 63–64, 66
Rectangle report objects, 53
Rectangle Start report, 63
Recursive parameter, 188
References tab, Report Properties dialog box,
131, 145
RefreshReport property/method,
ReportViewer, 156
Registered Nurse folder, 268
Remote Desktop Protocol (RDP), 250
Remote Desktop session, 252
rendering access, URL, 148
rendering category, Web Services Methods,
163
rendering extension component, 9
Report Builder, 39, 322
adding chart report, 357–361
adding matrix report, 351–356
creating table report, 344–351
overview, 341–343
Report Builder button, Report Manager
home page, 341
Report Builder role, 263
Report Builder/Data modeler, 4
Report Data tab, 358
Report Definition Language (RDL), 1, 39–40
report delivery system, 294
report deployment
overview, 175–176
using BIDS and Visual Studio 2005,
181–183
using Report Manager, 176–178
using Report Server Web Service
accessing the Web service, 185–186
coding the form, 187–193
laying out the form, 186–187
overview, 184–185
running the application, 193–195
using SQL Server Management Studio
(SSMS), 179–180
Report Designer, 136
BIDS
adding a report, 40
expressions, 50–51
overview, 36–37
Report Definition Language (RDL), 39–40
setting parameters, 46–48
setting up a basic IDE, 38–39
setting up data sources and datasets,
41–46
setting up filters, 48–50
laying out a report. See also report objects
creating a multicolumn report for
printing labels, 78
overview, 51–52
setting up pagination, 52–53
using a report template, 77
overview, 35–36
report execution activity, 277
Report Execution Audit report, 277
Report Execution Log, 226–228
Report Explorer, 310, 315
Report Explorer Web Part, 311
Report Explorer Web Parts, 318
Report feature, 96
report fields, 346
Report file, 187
report filter, 212
Report history category, Web Services
Methods, 163
Report Layout tab, 351
report management. See also content
management (on SSRS report server)
controlling SSRS programmatically
overview, 234
with SOAP, 234–245
with WMI, 245–246
exploring management roles in SSRS
deployment, 197
overview, 197
performing execution auditing and
performance analysis
configuring SSRS logging, 226–231
monitoring performance, 231–233
overview, 225–226
using SSMS and SSRS, 222–225
Report Manager tool, 6, 10, 175
report deployment using, 176–178
updating and uploading RDL file using,
202–205
Report Manager URL property, 311, 313
Report Manager Web page, 311
report model
adding a data source, 325–326
adding to BIDS, 324–325
building, 322
creating, 334–340
creating data source view, 328–334
overview, 324–325
Report Models folder, Solution Explorer, 334
report objects
implementing a matrix, 67–69
implementing charts, 69–73
■
I N D E X
369
4983chIDX.qxd 10/7/05 11:43 AM Page 369

implementing images, 73–76
implementing lists, 53–59
implementing rectangles, 63–66
implementing tables, 59–63
overview, 53
report parameter, 46, 184, 238
Report parameter, GetReportParameters
method, 166
Report parameters category, Web Services
Methods, 163
Report Parameters dialog box, 101, 109, 274
report parameters form, 165
Report Parameters Properties box, 106
Report Parameters property dialog box, 46
Report Processor, 9
Report Properties dialog box, 52, 78
Report Properties, Visual Studio Report
menu, 127
report security
auditing reports, 277–278
deployment models
implementing for internal access,
282–283
implementing SSRS with Terminal
Services, 279–282
overview, 278–279
encrypting data. See also SSL (Secure
Sockets Layer), securing network
traffic using
overview, 250–251
overview, 249–250
setting up authentication and user access
to data
filtering report content with
User!UserID, 273–274
overview, 261–262
setting data source security, 275
setting SQL server permissions, 276
SSRS roles, 262–269
Report server, 186
Report server command parameters, 150–152
Report Server Configuration Manager, 213,
232, 257
Report Server E-mail option, 213
Report Server Virtual Directory, 257
Report Server Web Service, 148, 184, 234
report deployment using
accessing the Web service, 185–186
coding the form, 187–193
laying out the form, 186–187
overview, 184–185
running the application, 193–195
Report Viewer, 310, 314–315
building using Report Viewer control
creating viewer form, 157–159
overview, 155–156
rendering final report, 170–173
rendering report locally, 159–162
using the Report Server Web service,
163–169
building using webbrowser control,
153–155
local rendering, 149
server-side mode, 149
Report Viewer Web Part, 314, 318
Report Wizard, 82, 85
Report_Expressions_Default_Permissions
code group, 131
Report_Wizard_Query.sql, 82
reporting parameters, URL, 148
Reporting Services architecture
benefits of
overview, 2–4
SQL Server 2005 RS enhancements, 4–6
SSRS and business intelligence, 6
deploying SSRS securely, 14–15
exploring the SSRS architecture
client applications, 10–13
overview, 7–8
SSRS databases, 8
SSRS report server, 8–10
installing and configuring, 13–14
overview, 1
Reporting Services Configuration Tool, 14
Reporting Services Server type connection,
223
ReportingService object, 166
ReportingService2005 type, 236
ReportingServicesService.config file, 278
ReportName global collection value, 77
ReportParameter array, 171
ReportParameter[ ] objects, 166
reports. See also ad hoc reporting; report
model; report security; reports,
building; reports, rendering from
.NET applications
overview, 123–124
using custom assemblies with
adding assembly reference to report,
140–143
adding class library project, 133–136
debugging custom assemblies,
143–145
deploying custom assembly, 136–140
overview, 132–133
troubleshooting project, 145–146
using embedded code with
accessing .NET assemblies from
embedded code, 131–132
ExceedMaxVisits function, 125–131
overview, 124
reports, building
adding final touches, 114–115
overview, 81–82
■
I N D E X
370
4983chIDX.qxd 10/7/05 11:43 AM Page 370

with Report Wizard, 82–85
from scratch. See also document
mapping
adding interactivity, 89–90
adding subtotals, 88–89
formatting the output, 87–88
overview, 85–86
setting report parameters with stored
procedures, 105–110
adding charts, 112–114
applying filters, 111
working with multivalued parameters,
116–120
reports, rendering from .NET applications,
152–153. See also Report Viewer
implementing URL access, 149–153
credential parameters, 152
example URLs, 152–153
HTML Viewer commands, 151
overview, 149–150
report parameters, 151
Report server command parameters,
151–152
URL parameters and prefixes, 150
URL report access path format, 150
integrating SSRS 2005 with .NET
applications, 153–155. See also
Report Viewer, building using Report
Viewer control
building Report Viewer using
WebBrowser control, 153–155
overview, 147–149
Reports folder, 40
Reports project, 126, 242
ReportServer database, 8–9, 233, 250, 259
ReportServer log file, 278
reportServer textbox, 186
/reportserver virtual root folder, 150
reportserver.config file, 230
ReportServerService log file, 278
ReportServerTempDB database, 8
ReportServerWebApp log file, 278
ReportViewer control, 148, 156, 161
rich client printing, Reporting Services, 5
RN_DS data source, 267
role-based application, 14, SSRS
rs command-line utility, 12, 175
RS05 system, 233
RSActivate command-line utility, 259
rsactivate utility, 14
rsconfig command-line utility, 12, 233
rsconfig utility, 14
RSExecutionLog data source, 277
RSExecutionLog database, 8, 226
rs:Format parameter, 152
RSKeyMgmt utility, 259–260
rsreportserver.config file, 257, 259
_rsreportserver.config service config file, 258
rssrvpolicy.config policy configuration file,
138
rtrim function, 97, 274, 346
■
S
Sales Projections Chart report, 291–293
sample relational database, 18–21
Save option, Report Builder, 175
Save Report dialog box, 350
Schedule objects, 237
ScheduledID variable, 238
ScheduleReport method, 238, 242, 244
scheduling category, Web Services Methods,
163
Scheduling Processor, 10
second data region, 344
Section parameter, HTML Viewer command,
151
Secure Sockets Layer. See SSL
SecureConnectionLevel, 282
security. See report security
SecurityAction method, 135
SELECT clause, 26
Select Data Source View page, 334
SelfSSL utility, 255
server components, 13
server parameter, URL, 149
ServerReport.ReportPath property/method,
ReportViewer, 156
ServerReport.ReportServerUrl
property/method, ReportViewer, 156
Service_Type field, 69
ServiceLog CtgryID parameter, 109
ServiceLogCtgry table, 18
Services table, 18, 26
Services.ServiceTypeID field, 29
ServiceTypeID value, 30
Set Logical Primary Key, 332
Set Schedule, 223
setSchedule button, 242
shared data source, 41
Shared Schedule form, 199
shared schedules, 238
configuring report to use, 200–202
creating, 199–200
overview, 198–199
updating and uploading RDL file using
Report Manager, 202–205
Shared View mode, 318
SharePoint Portal Server (SPS), Microsoft, 6,
286, 306, 314
SharePoint Web parts, 6, 308
single data region, 344
Site Settings page, 264
Snapshot parameter, URL, 152
snapshots, for report history, 206–209
■
I N D E X
371
4983chIDX.qxd 10/7/05 11:43 AM Page 371

SOAP
controlling SSRS programmatically with
accessing existing shared schedule,
235–238
adding subscription functionality to
SSRS viewer, 234–235
delivering the report, 243–245
overview, 234
scheduling the report, 238–242
SOAP API, 147, 173
Solution Explorer, deploying reports using,
183
Solution Items folder, 133, 235
Sort dialog box, 348
Source_Type field, 228
sp_fieldinfo output, 20
sp_fieldinfo stored procedure, 20
SPS (Microsoft SharePoint Portal Server), 6,
286, 306
SPS (SharePoint Portal Server), Microsoft, 6,
286, 306, 314
SQL Analysis Services, building SSRS reports
for
overview, 296, 298, 301
setting up Analysis Services data source,
301–303
using Analysis Service Cube with SSRS,
301
working with graphical MDX query
builder, 303–307
SQL authentication, 242
SQL injection attacks, 277
SQL Queries folder, 23, 30
SQL Server 2000 Service Pack 2, Web Parts for,
308
SQL Server 2005, Reporting Services
enhancements
embeddable SSRS controls, 5
enhanced expression builder, 5
graphical MDX query builder, 5
interactive sorting, 6
multivalue parameters, 5
overview, 4
Report Builder/Data modeler, 4
rich client printing, 5
SQL Server Agent service, 200
SQL Server Analysis Services, Microsoft,
302
SQL Server instance, 233
SQL Server Integration Services (SSIS),
297
SQL Server Management Studio.
See SSMS
SQL server permissions, 276
SQL Server Reporting Services. See SSRS
SQL Server table, 217
SQL Server-based connection, 205
SSAS cubes, 303
SSIS (SQL Server Integration Services), 297
SSL (Secure Sockets Layer)
overview, 250
securing network traffic using
analyzing HTTP traffic, 251–254
applying SSL certificate, 255
capturing HTTPS traffic, 256–258
overview, 251
securing data storage in SSRS,
259–261
SSL bridging, 282
SSMS (SQL Server Management Studio), 6
report deployment using, 179–180
report management using, 222–225
testing performance with, 26–28
SSRS (SQL Server Reporting Services), 279.
See also content management (on
SSRS report server)
auditing, 277
BI reports, 296
building SSRS reports for SQL Analysis
Services
overview, 296, 298, 301
setting up the Analysis Services data
source, 301, 303
using Analysis Service Cube with SSRS,
301
working with graphical MDX query
builder, 303–304, 307
controlling programmatically
overview, 234
with SOAP, 235–245
with WMI, 245–246
extending Microsoft CRM with
creating custom SSRS reports for
Microsoft CRM, 291
creating Lead Conversion report, 293
creating Sales Projections Chart report,
292–293
overview, 286–287
using report pack for Microsoft CRM
1.2, 287–288, 291
implementing with Terminal Services, 279,
281–282
incorporating with SharePoint Portal
Server
adding Web Parts, 310, 313, 317–318
creating Web Part page, 308, 310
overview, 308
logging, 228–231
managing projects with, 294–295
overview, 285–286
report management using, 222–223, 225
securing data storage in, 259, 261
SSRS objects, configuring and testing
permissions for, 262
■
I N D E X
372
4983chIDX.qxd 10/7/05 11:43 AM Page 372

SSRS reports, 343
SSRS roles
assigning, 262
overview, 262–264
setting up, 262
testing role assignments, 267–269
SSRS Viewer RVC, 163, 235–236, 243–244
SSRS Web Parts, 315
SSRS Web service, 233
SSRS 2005 Report Server Web service, 162,
236, 245
SSRS Report Server Web service, 234
ssrsFolders TreeView control, 188, 191
SSRSWebService, 165, 186
standard subscriptions, 211
configuring, 214–216
creating, 213–214
overview, 211–212
standardization, 1
Start Capture button, 254
Start Path property, 311
StartFind parameter, HTML Viewer
command, 151
starting-point report, Pro_SSRS project, 86
StartItem property, 181
stepped layout, for reports, 84
stored procedures
parameterized
overview, 30–32
testing the procedure, 33–34
using case and ISNULL to evaluate
parameters, 32–33
setting report parameters with
adding charts, 112–114
applying filters, 111
overview, 105–110
Stored Procedures folder, 30
stress test, 232
string manipulation logic, 48
string split method, 165
String values, 103
StringMap table, 291
Stylesheet parameter, HTML Viewer
command, 151
subscription and delivery category, Web
Services Methods, 163
subscription management
data-driven subscriptions
creating, 219–221
designing subscription query,
217–219
overview, 217
overview, 211
standard subscriptions
configuring, 214–216
creating, 213–214
overview, 211–212
subscription query, 220
subtotals, in reports, 88–89
SUM function, 26
Sum function, 54, 61, 88
symmetrical key encryption process,
259
System.Data namespace, 135
System.DirectoryServices, 243
System.Management namespace, 246
Systems Management Server, 251
System.Security.Permissions namespace,
135
■
T
/T option, 255
Table data regions, 59–60, 63, 96
table report, 344, 346, 348, 350
Table report objects, 53
<TableCell> section, 62
Tables Start.rdl file, 59
table-valued function, 119
Tagged Image File Format (TIFF), 10
TargetDataSourceFolder property,
182
TargetFolder property, 37
TargetReportFolder property, 182, 199
TargetServerURL property, 37, 182
Task Manager, 232
TCP/IP (Transmission Control Protocol/
Internet Protocol) traffic, 250
Terminal Services
implementing SSRS with, 279,
281–282
overview, 250
in Windows Server 2003, 281
Test Connection button, 41
test environment, 233
Textbox Properties dialog box, 64
Textbox report object, 63
TIFF (Tagged Image File Format), 10
time-based parameters, 109
TO parameter, 244
TODAY function, 201
Toolbar parameter, HTML Viewer command,
151
Toolbar Size option, 313
Toolbox, IDE, 38
ToolTip property, Misc section, 104
tooltips, 103–104
Top10Diagnosis.sql file, 23
Transmission Control Protocol/Internet
Protocol (TCP/IP) traffic, 250
TreeView control, 186, 188, 190–191
Trusted Certificates list, 255
Trx table, 18, 26
TrxTypeID value, 28
T-SQL query, 298
■
I N D E X
373
4983chIDX.qxd 10/7/05 11:43 AM Page 373

■
U
UDFs (User-defined functions), 48
uniform resource locator (URL) access
method, 9
Unsigned parameter, Boolean datatype, 215
Update link, 204
Upload File option, Report Manager toolbar,
176
URL (uniform resource locator) access
method, 9
URL Credential parameters, 152
URL feature, 96
URL hyperlink action, 290
URL links, 100–102
URL parameters and prefixes, 150
Use Windows Authentication option, 41, 326
user feedback, 321–324
User global collection, 221
User parameter, 48
User-defined functions (UDFs), 48
Users Folders folder, 265
user-supplied parameters, 152
using statement, 158
■
V
Validate button, 219
ValidValue objects, 167
ValidValues property, ReportParameter
object, 167
Value parameter, URL, 149
varchar data type, 118
variable-length fields, 347
VB .NET function, 50
VB .NET Windows Forms, 132
verbose mode, 278
viewer application, URL, 148
ViewerParameters methods, parameters
variable, 170
ViewerRVC.cs form, 158, 161, 165, 170–171, 242
ViewerWBC.cs form, 154
Virtual Private Networks (VPNs), 15, 250, 282
Virtual Server Gallery, 310, 312, 315
virtualroot parameter, URL, 149
visibility, 90–93
Visit_Count field, 54, 61
Visual Studio 2005, report deployment using,
181–183
VPNs (Virtual Private Networks), 15, 250, 282
■
W
Web farm, 226
Web Pages link, 308
Web Part Page, 308
Web Parts, 308
Web Reference Name textbox, 165, 186
Web services methods, categories of, 163
webbrowser control, building Report Viewer
using, 153–155
WEP (Wireless Encryption Protocol), 250
WHERE clause, 28–29
Windows 2003 terminal server, 280
Windows authentication, 212
Windows Certificate Services, 255
Windows domain authentication policies,
283
Windows Form application, 148
Windows Forms application, 184, 194, 235
Windows Forms development, 5
Windows Forms-based user interface, 163
Windows integrated authentication, 242
Windows Integrated Security, 268, 275
Windows SharePoint Services (WSS), 6, 308
Windows Terminal Services, 279
Winforms.ReportParameters, 239
Wireless Encryption Protocol (WEP), 250
WMI, 245–246
WSS (Windows SharePoint Services), 6, 308
■
X
XML (eXtensible Markup Language), 9
■
Y
Year parameter, 116
■
Z
Zoom parameter, HTML Viewer command, 151
■
I N D E X
374
4983chIDX.qxd 10/7/05 11:43 AM Page 374

4983chIDX.qxd 10/7/05 11:43 AM Page 375

4983chIDX.qxd 10/7/05 11:43 AM Page 376

4983chIDX.qxd 10/7/05 11:43 AM Page 377

4983chIDX.qxd 10/7/05 11:43 AM
CONGRATULATIONS!
You are holding one of the very first copies of
Pro SQL Server 2005 Reporting Services
.
W
e believe this complete guide to SQL Server 2005 will prove so indispensable
that you will want to carry it with you everywhere. Which is why, for a limited
time, we are offering the identical eBook absolutely free—a $20 value—to customers
who purchase the book now. This fully searchable PDF will be your constant com-
panion for quick code and topic searches.
Once you purchase your book, getting the free eBook is simple:
1
Visit www.apress.com/promo/free.
2
Complete a basic registration form to receive a randomly
generated question about this title.
3
Answer the question correctly in 60 seconds, and you will
receive a promotional code to redeem for the free eBook.
For more information about Apress eBooks, contact pr@apress.com.
2560 Ninth Street • Suite 219 • Berkeley, CA 94710
Document Outline
- Pro SQL Server 2005 Reporting Services
- Table of Content
- Chapter 1 Introducing the Reporting Services Architecture
- Chapter 2 Report Authoring: Designing Efficient Queries
- Chapter 3 Using Report Designer
- Chapter 4 Building Reports.
- Chapter 5 Using Custom .NET Code with Reports
- Chapter 6 Rendering Reports from .NET Applications.
- Chapter 7 Deploying Reports
- Chapter 8 Managing Reports
- Chapter 9 Securing Reports
- Chapter 10 Delivering Business Intelligence with SSRS.
- Chapter 11 Performing Ad Hoc Reporting Using Report Builder
- Index
Wyszukiwarka
Podobne podstrony:
Apress Pro SQL Server 2005 Reporting Services (2006)
SQL Server 2005 typy danych
An Introduction To Olap In Sql Server 2005
Microsoft SQL Server 2005 Nowe mozliwosci
Microsoft SQL Server 2005 Nowe mozliwosci 2
SQL dla SQL Server 2005 Wprowadzenie
SQL Server 2005 Zaawansowane rozwiazania biznesowe 2
SQL Server 2005 Programowanie Od podstaw
więcej podobnych podstron