
15
C H A P T E R
O
L I G O P O L Y A N D
S
T R A T E G I C
B
E H A V I O R
O
L I G O P O L Y A N D
S
T R A T E G I C
B
E H A V I O R
15.1
Oligopoly
15.2
Collusion and Cartels
15.3
Other Oligopoly Models
15.4
Game Theory and Strategic Behavior
ligopoly is a market structure where a few
large firms dominate an industry. Examples
of oligopolistic markets include commercial
airlines, oil, automobiles, steel, breakfast
cereals, computers, cigarettes, tobacco, and sports
drinks. In all of these instances, the market is
dominated by anywhere from a few to several big
companies, although they may have many differ-
ent brands (e.g., General Motors, General Foods,
Dell Computers). In this chapter, we will learn
about the unique characteristics of firms in this
industry.
■
O
95469_15_Ch15_p387-412.qxd 29/12/06 12:52 PM Page 387
388
M O D U L E 3
Households, Firms, and Market Structure
WHAT IS OLIGOPOLY?
As we discussed in Chapter 13, oligopolies exist, by def-
inition, where relatively few firms control all or most of
the production and sale of a product (“oligopoly”
= few
sellers). The products may be homogeneous or differen-
tiated, but the barriers to entry are often high, which
makes it difficult for firms to enter into the industry.
Consequently, long-run economic profits may be earned
by firms in the industry.
MUTUAL INTERDEPENDENCE
Oligopoly is characterized by
mutual interdependence
among firms; that is, each firm shapes its policy with an
eye to the policies of competing firms. Oligopolists must
strategize, much like
good chess or bridge
players who are con-
stantly observing and
anticipating the moves
of their rivals. Oligopoly
is likely to occur when-
ever the number of firms
in an industry is so small
that any change in output or price by one firm apprecia-
bly impacts the sales of competing firms. In this situa-
tion, it is almost inevitable that competitors will respond
directly to these actions in determining their own policy.
WHY DO OLIGOPOLIES EXIST?
Primarily, oligopoly is a result of the relationship
between the technological conditions of production
and potential sales volume. For many products, a firm
cannot obtain a reasonably low cost of production
unless it is producing a large fraction of the market
output. In other words, substantial economies of scale
are present in oligopoly markets. Automobile and
steel production are classic examples of this. Because
of legal concerns such as patents, large start-up costs,
and the presence of pronounced economies of scale,
the barriers to entry are quite high in oligopoly.
MEASURING INDUSTRY CONCENTRATION
The extent of oligopoly power in various industries
can be measured by means of concentration ratios. A
concentration ratio indicates the proportion of total
industry shipments (sales) of goods produced by a
specified number of the largest firms in the industry,
or the proportion of total industry assets held by
these largest firms. We can use four-firm or eight-firm
concentration ratios; most often, concentration ratios
are for the four largest firms.
The extent of oligopoly power is indicated by the
four-firm concentration ratio for the United States
shown in Exhibit 1. Note that for breakfast cereals, to
take an example, the four largest firms produce 87
percent of all breakfast cereals produced in the United
States. Concentration ratios of 70 to 100 percent are
S E C T I O N
15.1
O L I G O P O LY
■
What is oligopoly?
■
What is mutual interdependence?
■
Are economies of scale a major barrier
to entry?
■
Why is it so difficult for the oligopolist to
determine its profit-maximizing price and
output?
mutual
interdependence
when a firm shapes its policy with
an eye to the policies of competing
firms
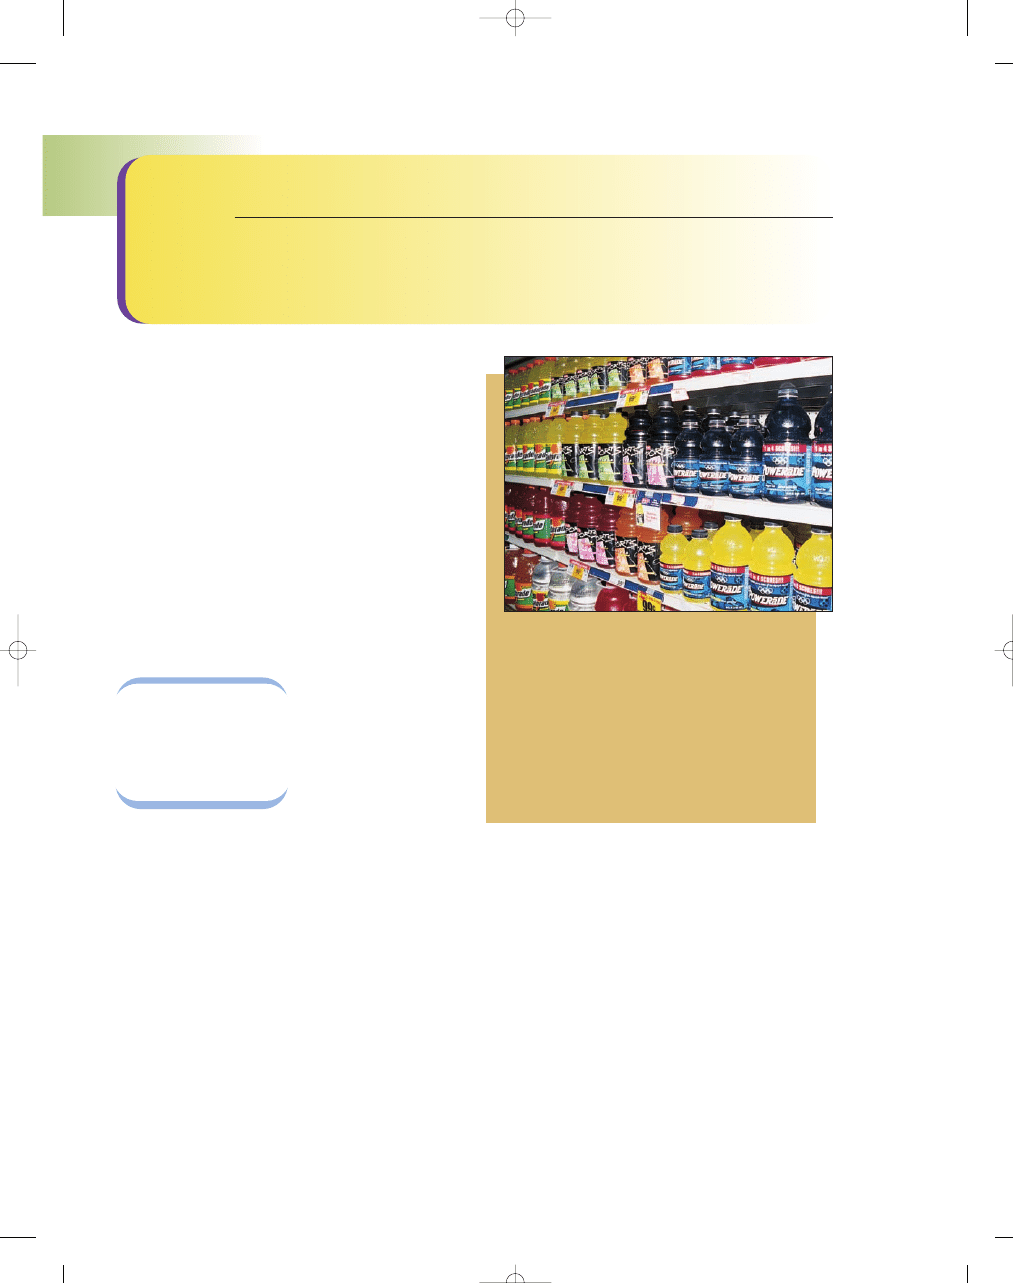
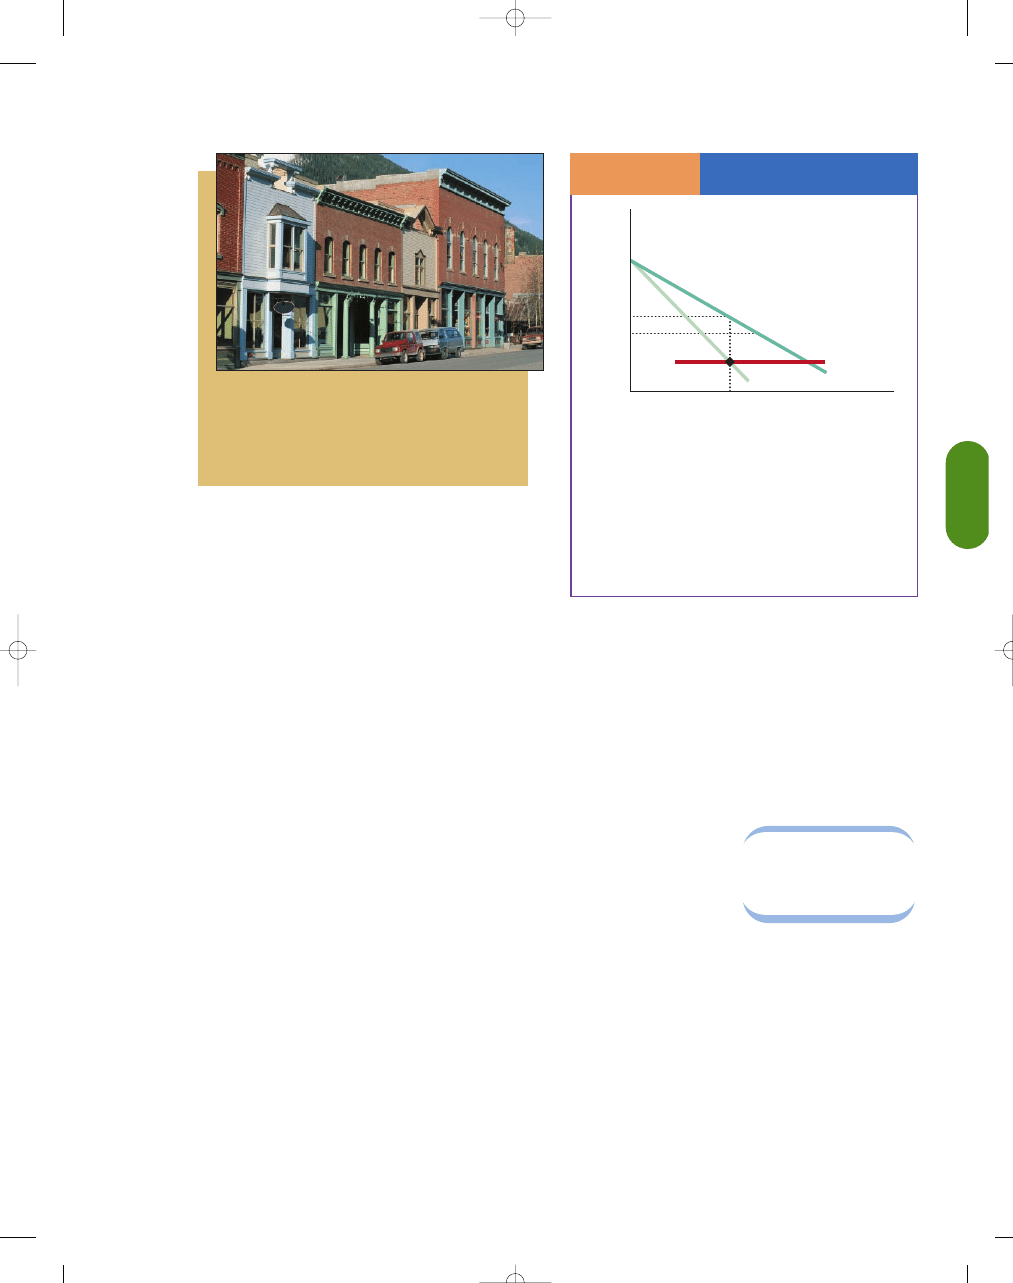
Central Florida can get pretty hot and humid in August when
football practices begin, especially if you are wearing football
pads. Back in 1965, researchers at the University of Florida
decided to work on a formula for a drink that would replace
body fluids lost during high activity. The drink was tried on
the University of Florida Gator football team so the sports
drink became known as Gatorade. Forty years later you can
choose from a number of sports drinks on the market, but
most of them are controlled by just a few firms (such as
Gatorade, which is now part of Pepsi).
©
Lon C
.
Diehl/Photo Edit
95469_15_Ch15_p387-412.qxd 29/12/06 12:52 PM Page 388
C H A P T E R 1 5
Oligopoly and Strategic Behavior
389
common in oligopolies. That is, a high concentration
ratio means that a few sellers dominate the market.
Concentration ratios, however, are not a perfect
guide to industry concentration. One problem is that
they do not take into consideration foreign competition.
For example, the U.S. auto industry is highly concen-
trated but faces stiff competition from foreign automo-
bile producers. The same is true for motorcycles and
bicycles.
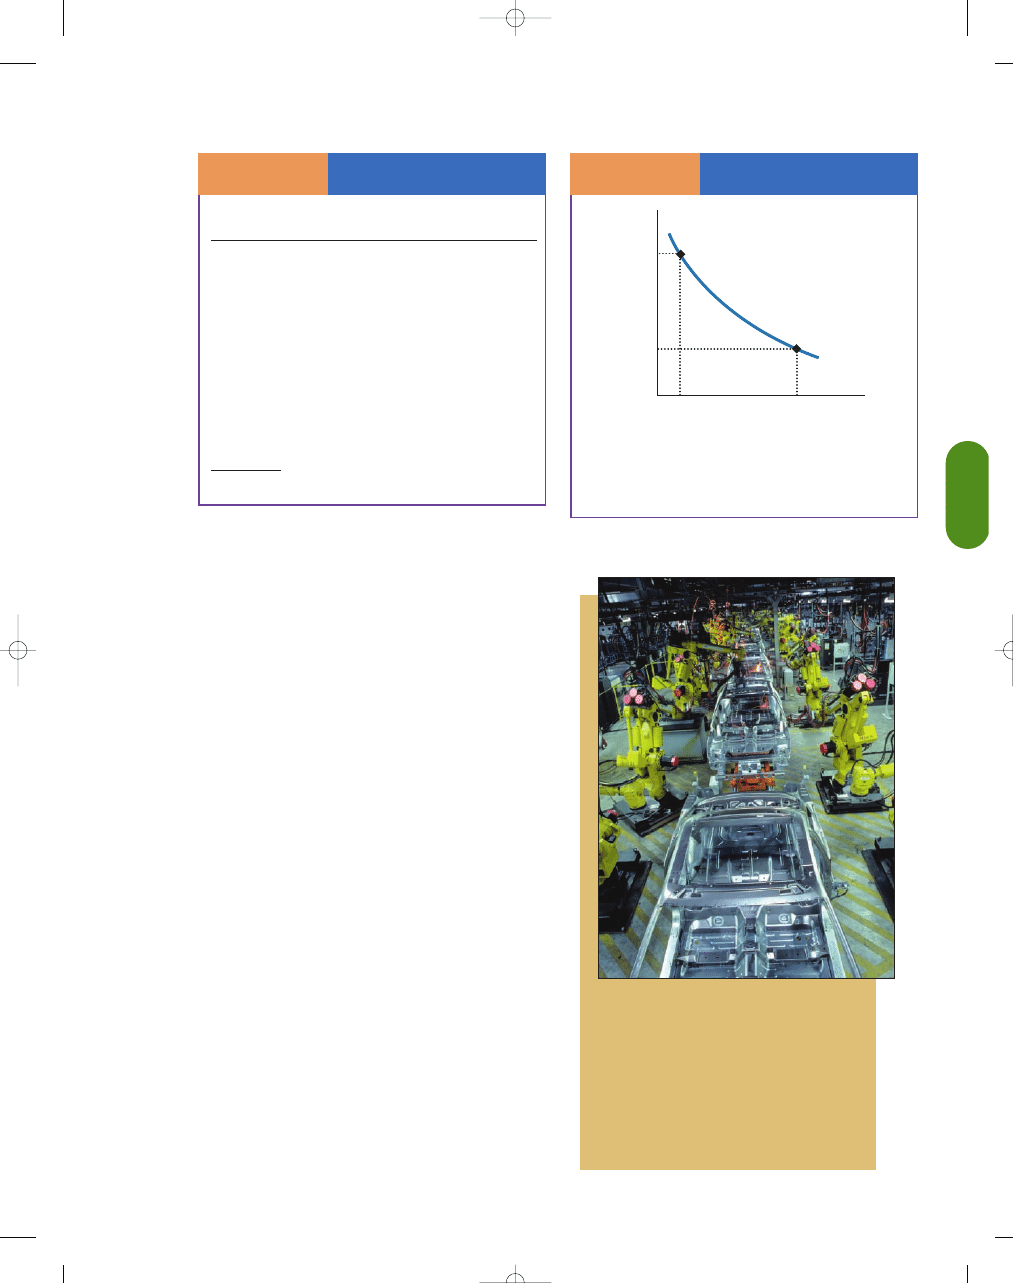
ECONOMIES OF SCALE AS A BARRIER TO ENTRY
Economies of large-scale production make operation on
a small scale during a new firm’s early years extremely
unprofitable. A firm cannot build up a large market
overnight; in the interim, average total cost is so high
that losses are heavy. Recognition of this fact discour-
ages new firms from entering the market, as illustrated
in Exhibit 2. We can see that if an automobile company
produces quantity Q
LARGE
rather than Q
SMALL
, it will be
able to produce cars at a significantly lower cost. If the
average total cost to a potential entrant is equivalent to
point A on the ATC curve and the price of automobiles
is less than P
1
, a new firm would be deterred from enter-
ing the industry.
EQUILIBRIUM PRICE AND QUANTITY
IN OLIGOPOLY
It is difficult to predict how firms will react in situa-
tions of mutual interdependence. No firm knows what
its demand curve looks like with any degree of cer-
tainty, and therefore it has a limited knowledge of its
marginal revenue curve. To know anything about its
Four-Firm Concentration
Ratios, U.S. Manufacturing
S E C T I O N
1 5 .1
E
X H I B I T
1
Share of Value of Shipments
Industry
by the Top Four Firms (%)
Tobacco products
96
Breweries
91
Motor vehicles
90
Electric lightbulbs
89
Small arms ammunition
89
Refrigerators
88
Breakfast cereals
87
Aircraft
85
Soaps, detergents
73
Tires
69
Motorcycles and bicycles
68
Lawn and garden equipment
65
Coffee and tea
58
Source: U.S. Census Bureau.
Economies of Scale
as a Barrier to Entry
S E C T I O N
1 5 .1
E
X H I B I T
2
0
P
1
P
2
Q
SMALL
Q
LARGE
Price
ATC
Quantity of Autos Produced
(per year)
A
B
Economies of large-scale production make operation
on a small scale more costly, ceteris paribus.
Do you think economies of scale are important in this
industry? Unlike home-cooked meals, few cars are
“homemade.” The barriers to entry in the auto
industry are formidable. A new entrant would have to
start out as a large producer (investing billions of
dollars in plant, equipment, and advertising) to com-
pete with existing firms, which have lower average
total costs per unit because of economies of large-
scale production.
©
Reuters/Lando
v
95469_15_Ch15_p387-412.qxd 29/12/06 12:52 PM Page 389

390
M O D U L E 3
Households, Firms, and Market Structure
demand curve, the firm must know how other firms
will react to its prices and other policies. In the absence
of additional assumptions, then, equating marginal
revenue and expected marginal cost is relegated to
guesswork. Thus, it is difficult for an oligopolist to
determine its profit-maximizing price and output.
S E C T I O N
*
C H E C K
1.
Oligopolies exist where relatively few firms control all or most of the production and sale of a product. The
products may be homogeneous or differentiated, but the barriers to entry are often very high and, consequently,
they may be able to realize long-run economic profits.
2.
When firms are mutually interdependent, each firm shapes its policy with an eye to the policies of competing firms.
3.
Economies of large-scale production make operation on a small scale extremely unprofitable. Recognition of this
fact discourages new firms from entering the market.
4.
Because in oligopoly the pricing decision of one firm influences the demand curve of competing firms, the
oligopolist faces considerable uncertainty as to the location and shape of its demand and marginal revenue
curves. Thus, it is difficult for an oligopolist to determine its profit-maximizing price and output.
1.
How can concentration ratios indicate the extent of oligopolies’ power?
2.
Why is oligopoly characterized by mutual interdependence?
3.
Why do economies of scale result in few sellers in oligopoly models?
4.
How do economies of scale result in barriers to entry in oligopoly models?
5.
Why does an oligopolist have a difficult time finding its profit-maximizing price and output?
6.
Why would an automobile manufacturer be more likely than the corner baker to be an oligopolist?
S E C T I O N
15.2
C o l l u s i o n a n d C a r t e l s
■
Why do firms collude?
■
What is joint profit maximization?
■
Why does collusion break down?
UNCERTAINTY AND PRICING DECISIONS
The uncertainties of pricing decisions are substantial in
oligopoly. The implications of misjudging the behavior
of competitors could prove to be disastrous. An execu-
tive who makes the wrong pricing move may force the
firm to lose sales or, at a minimum, be forced himself to
back down in an embarrassing fashion from an
announced price increase. Because of this uncertainty,
some believe that oligopolists change their prices less
frequently than perfect competitors, whose prices may
change almost continually. The empirical evidence,
however, does not clearly indicate that prices are in fact
always slow to change in oligopoly situations.
COLLUSION
Because the actions and profits of oligopolists are so
dominated by mutual interdependence, the tempta-
tion is great for firms to
collude
—to get together and
agree to act jointly in
pricing and other mat-
ters. If firms believe
they can increase their
profits by coordinating
their actions, they will
be tempted to collude. Collusion reduces uncertainty
and increases the potential for economic profits. From
society’s point of view, collusion creates a situation in
which goods very likely become overpriced and
underproduced, with consumers losing out as the
result of a misallocation of resources.
JOINT PROFIT MAXIMIZATION
Agreements between or among firms on sales, pricing, and
other decisions are usually referred to as cartel agree-
ments. A
cartel
is a collection of firms making an
agreement.
collude
when firms act together to restrict
competition
95469_15_Ch15_p387-412.qxd 29/12/06 12:52 PM Page 390
C H A P T E R 1 5
Oligopoly and Strategic Behavior
391
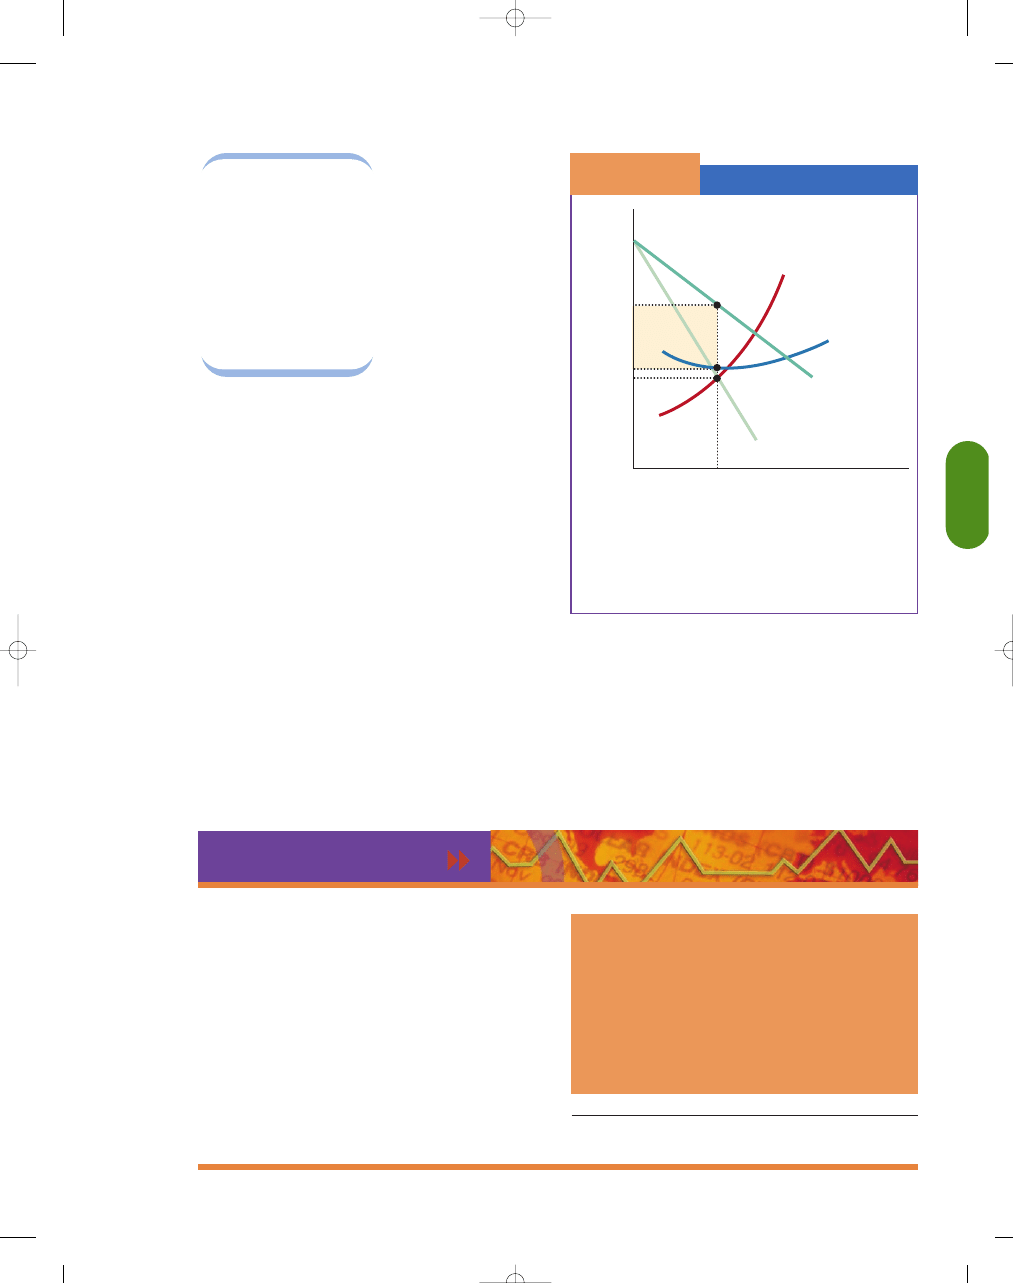
Cartels may lead
to what economists
call
joint profit maxi-
mization:
Price is
based on the marginal
revenue function,
which is derived from
the product’s total (or
market) demand sched-
ule and the various
firms’ marginal cost
schedules, as shown in
Exhibit 1. With outright
agreements—necessarily secret because of antitrust
laws (in the United States, at least)—firms that make
up the market will attempt to estimate demand and
cost schedules and then set optimum price and output
levels accordingly.
Equilibrium price and quantity for a collusive
oligopoly are determined according to the intersec-
tion of the marginal revenue curve (derived from
the market demand curve) and the horizontal sum
of the short-run marginal cost curves for the oli-
gopolists. As shown in Exhibit 1, the resulting
equilibrium quantity is Q* and the equilibrium
price is P*. Collusion facilitates joint profit maxi-
mization for the oligopoly. If the oligopoly is main-
tained in the long run, it charges a higher price,
produces less output, and fails to maximize social
welfare, relative to perfect competition, because P*
>
MC at Q*.
The manner in which total profits are shared
among firms in the industry depends in part on the
relative costs and sales of the various firms. Firms
with low costs and large supply capabilities will
obtain the largest profits, because they have greater
bargaining power. Sales, in turn, may depend in
large measure on consumer preferences for various
brands if there is product differentiation. With outright
cartel
a collection of firms that agree on
sales, pricing, and other decisions
joint profit
maximization
determination of price based on the
marginal revenue derived from the
market demand schedule and mar-
ginal cost schedule of the firms in
the industry
Collusion in Oligopoly
S E C T I O N
1 5 . 2
E
X H I B I T
1
0
P
*
Q
*
Price
MC
MARKET
ATC
MARKET
D
MARKET
ATC
MC
MR
Quantity
Total
Profit
In collusive oligopoly, the producers would restrict
joint output to Q∗, setting their price at P∗. The mem-
bers of the collusive oligopoly would share the profits
in the shaded area.
i n t h e n e w s
The Crash of an Airline Collusion
Mr. Crandall: I think it’s dumb as @#$% for !@#$%
∗
sake, . . . to sit here and
pound the @#$% out of each other and neither one of us making a #!@
!$&
∗
dime. I mean, you know, @!#$, what the @#$!, is the point of it.
Mr. Putnam: Do you have a suggestion for me?
Mr. Crandall: Yes, I have a suggestion for you. Raise your @#$&!$% fares
20 percent. I’ll raise mine the next morning. . . . You’ll make more money
and I will, too.
Mr. Putnam: We can’t talk about pricing!
Mr. Crandall: Oh @#$% we can talk about any @#$%&
∗
# thing we want to talk
about.
SOURCE: Staff, “American Air Accused of Bid to Fix Prices,” The Wall Street Journal,
February 24, 1983, pp. 2, 23.
CONSIDER THIS:
At the time of this conversation, Crandall was the president of American
Airlines and Putnam was the president of Braniff Airlines. According to
the Sherman Antitrust Act, it is illegal for corporate leaders to talk
about and propose price fixing with their competitors. Putnam turned
the tapes of this conversation over to the Justice Department. After
reviewing the tapes, the Justice Department ruled that attempts to fix
prices could monopolize the airline industry. American Airlines prom-
ised they would not engage in this type of activity again.
95469_15_Ch15_p387-412.qxd 29/12/06 12:52 PM Page 391
392
M O D U L E 3
Households, Firms, and Market Structure
collusion, firms may agree on market shares and the
division of profits. The division of total profits will
depend on the relative bargaining strength of each
firm, influenced by its relative financial strength,
ability to inflict damage (through price wars) on
other firms if an agreement is not reached, ability
to withstand similar actions on the part of other
firms, relative costs, consumer preferences, and bar-
gaining skills.
WHY ARE MOST COLLUSIVE
OLIGOPOLIES SHORT LIVED?
Collusive oligopolies are potentially highly profitable
for participants but detrimental to society.
Fortunately, most strong collusive oligopolies are
rather short lived, for two reasons. First, in the
United States and in some other nations, collusive
oligopolies are strictly illegal under antitrust laws.
Second, for collusion to work, firms must agree to
restrict output to a level that will support the profit-
maximizing price. At that price, firms can earn posi-
tive economic profits. Yet a great temptation is for
firms to cheat on the agreement of the collusive oli-
gopoly; and because collusive agreements are illegal,
the other parties have no way to punish the offender.
Why do they have a strong incentive to cheat?
Because any individual firm could lower its price
slightly and thereby increase sales and profits, as long
as it goes undetected. Undetected price cuts could
bring in new customers, including rivals’ customers.
In addition, nonprice methods of defection include
better credit terms, rebates, prompt delivery service,
and so on.
The OPEC Cartel
The most spectacularly successful example of a collusive oligopoly able to
earn monopoly-type profits is the Organization of Petroleum Exporting
Countries (OPEC) cartel. Although organized in 1960, it only became success-
ful as a collusive oligopoly in 1973.
OPEC began acting as a cartel in part because of political concern
over U.S. support for Israel. For 20 years before 1973, the price of crude
oil had hovered around $2 a barrel. In 1973, OPEC members agreed to
quadruple oil prices in nine months; later price increases pushed the cost
of a barrel of oil to more than $20. Prices then stabilized, falling in real
terms (adjusted for inflation) between 1973 and 1978 as OPEC sought the
profit-maximizing price and politics remained relatively calm. By the
early 1980s, however, prices were approaching $40 per barrel. Exhibit 2
illustrates the relative impact of the OPEC cartel on the supply and price
of oil.
The OPEC nations were successful with their pricing policies between
1973 and the early 1980s for several reasons. First, the worldwide demand for
petroleum was highly inelastic with respect to price in the short run. Second,
OPEC’s share of total world oil output had steadily increased, from around 20
percent of total world output in the early 1940s to about 70 percent by 1973,
when OPEC became an effective cartel. Third, the price elasticity of supply of
petroleum from OPEC’s competitors was low in the short run: Ability to
increase production from existing wells is limited, and it takes time to drill
new ones.
From the mid-1980s to the mid-1990s, OPEC oil prices hovered around
$20 per barrel because of increases in non-OPEC production and the uncertain
willingness of key suppliers (such as Saudi Arabia) to restrict supply.
Moreover, at the higher prices of the 1970s, long-run substitution possibilities
caused oil consumption to fall almost 5 percent per year, with conservation
and alternative energy easing the demand for OPEC oil. After adjusting for
inflation, oil prices during most of the 1990s was roughly the same as it was
before OPEC formed.
OPEC now controls less than one-third of world oil production and
surprisingly it still has some clout as a cartel. However, it is not just
OPEC. High oil prices still emerge because of growing world demand and
the political instability in the Middle East. By July 2006, oil prices had
reached $78 per barrel. However, in real terms (adjusted for inflation), a
barrel would have to reach $90 to beat the mark it set in 1980.
g l o b a l w a t c h
The Impact of the
OPEC Cartel
S E C T I O N
1 5 . 2
E
X H I B I T
2
0
P
1981
P
BEFORE 1973
Q
1981
Q
BEFORE 1973
Price of Oil
D
S
BEFORE 1973
S
1981
Quantity of Oil
95469_15_Ch15_p387-412.qxd 29/12/06 12:52 PM Page 392

C H A P T E R 1 5
Oligopoly and Strategic Behavior
393
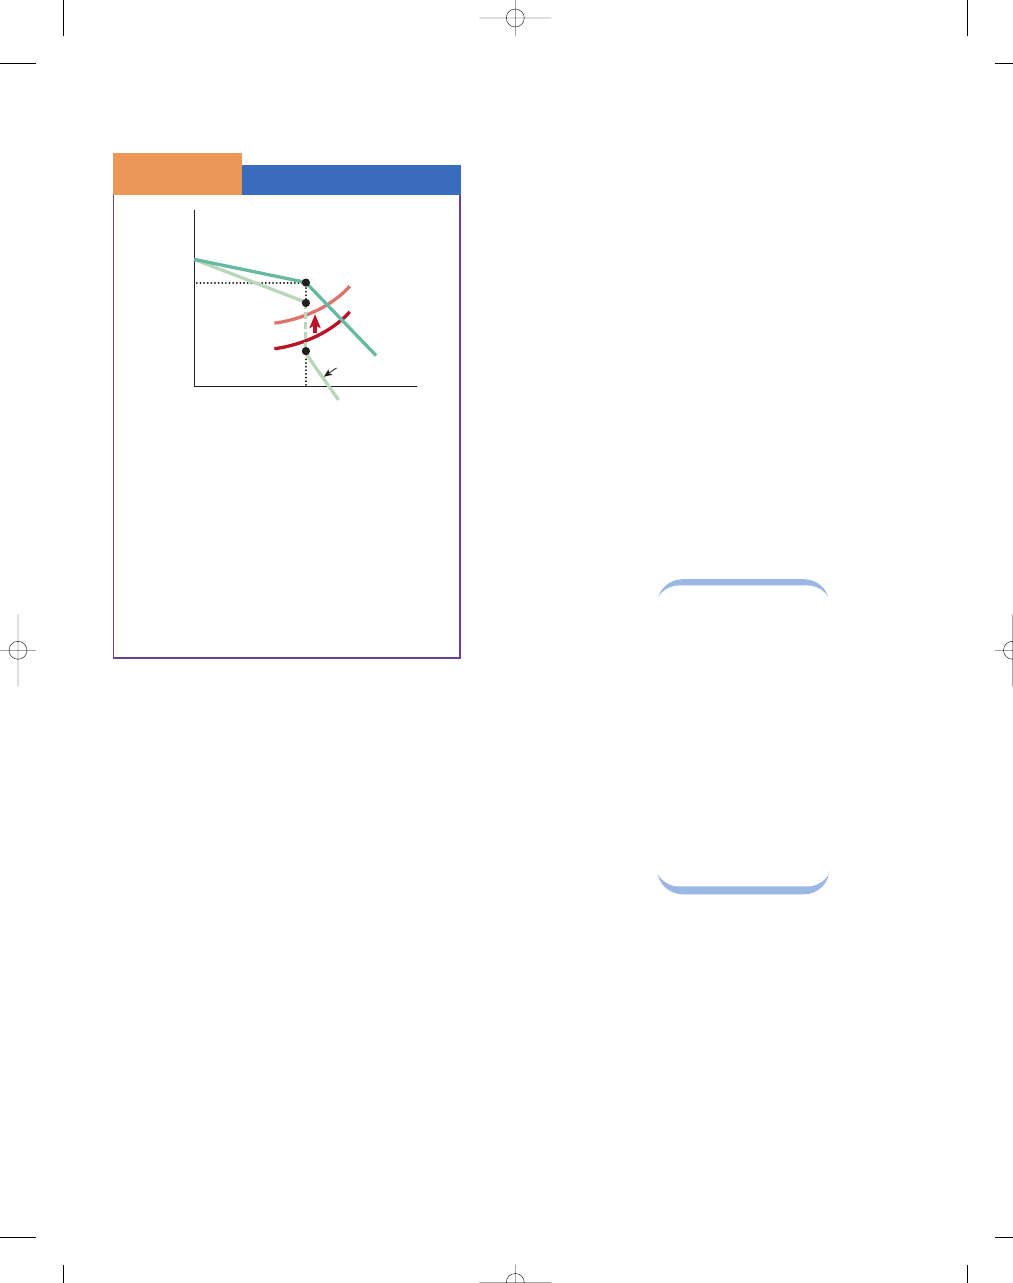
THE KINKED DEMAND CURVE
MODEL—PRICE RIGIDITY
As we have seen, collusion tends to be fragile in oli-
gopoly markets. Prices in some oligopolistic industries
tend to be quite stable, or rigid. That is, even if
demand or cost changes, firms will be reluctant to
change their prices. For example, if demand or costs
were to increase, a firm might be tempted to increase
its prices but may not because it fears that rivals will
not raise their prices and the firm will lose customer
sales. The firm may also be reluctant to lower its
prices in fear of setting off a round of price warfare.
That is, once the collusion outcome has been reached,
individual producers have an incentive to be cautious
about changing their output—or price.
This idea of price
rigidity in oligopoly is
the basis of the
kinked
demand curve
model.
According to the kinked
demand curve model,
each firm faces a
demand curve that is
kinked at the collusive
market price (P∗) and output (q∗). This kinked
demand curve, illustrated in Exhibit 1, is produced
by the greater tendency of competitors to follow
price reductions than price increases. A price reduc-
tion takes business away from other firms and forces
them to cut prices in order to protect their sales. A
price increase does not necessitate a readjustment
because other firms gain customers if one increases
its price. At the point of the kink, the MR curve is
discontinuous.
The profit-maximizing price, P∗, is indicated in
Exhibit 1 by the point at which the demand curve
changes slope. At prices higher than P∗, the firm’s
demand curve is very elastic. The reason for this elas-
ticity is that a price increase would significantly cut
revenues, as other rival firms fail to follow the price
increase, causing the firm to lose sales and market
share. If it lowers the price below P∗, reductions
would yield little additional business because most of
the other firms are presumed to follow price cuts.
That is, sales will only increase if the total market
quantity demanded increases due to the lower price.
Below P∗, the firm does not capture many rivals’
clients as rival firms match the price reduction, so the
demand curve tends to be relatively inelastic below P∗.
S E C T I O N
*
C H E C K
1.
A price leader sends a signal to competing firms about a price change. Competitors that go along with the pricing
decisions of the price leader are known as price followers.
2.
The mutual interdependence of oligopolists tempts them to collude in order to reduce uncertainty and increase
potential for economic profits.
3.
Joint profit maximization requires the determination of price based on the market demand for the product and the
marginal costs of the various firms.
4.
Most strong collusive oligopolies are rather short lived for primarily two reasons: (1) Collusive oligopolies are
strictly illegal under U.S. antitrust laws, and (2) there is a great temptation for firms to cheat on the agreement of
the collusive oligopoly.
1.
Why are collusive agreements typically unstable and short lived?
2.
Why is the temptation to collude greater when the industry’s demand curve is more inelastic?
S E C T I O N
15.3
O t h e r O l i g o p o l y M o d e l s
■
What is the kinked demand curve model?
■
What happens to the oligopolists’ profits if
entry is easy?
■
How can existing firms deter potential
entrants?
kinked demand
curve
indicates the price rigidity in oligo-
poly when competitors show a
greater tendency to follow price
reductions than price increases
95469_15_Ch15_p387-412.qxd 29/12/06 12:52 PM Page 393
394
M O D U L E 3
Households, Firms, and Market Structure
A slight decrease in price will not lead to a large
increase in quantity demanded because rivals will
lower their price to maintain their market share.
One important consequence of the kink in the
demand curve is that the firm may be slow to adjust
price in response to cost changes. Because of the kink
in the demand curve, the marginal revenue curve is dis-
continuous. Therefore, the MC curve can move up or
down over a substantial range without affecting the
optimum level of output or price. For example, as the
marginal cost increases from MC
1
to MC
2
in Exhibit 1,
the firm will continue to produce at the same price, P∗,
and at the same output, q∗.
The key feature of the kinked demand curve is
that the shape of the firm’s demand curve is depend-
ent on the action of competing firms. In the real
world, of course, when a firm raises its price, antici-
pating that other firms will also raise prices but they
do not, then the price-raising firm will face the
prospect of a major sales decline, and the firm that
initiated the price increase will usually retreat from
the price increase originally announced. The explana-
tion for the price rigidity comes from the idea that
firms do not want to engage in destructive price com-
petition. Game theory is useful in this situation. We
will discuss game theory in the context of prisoners’
dilemma in Section 15.4.
Not all oligopolies experience price rigidity. For
example, during the high inflationary periods of the
1970s, some oligopolists increased their prices fre-
quently. Oligopolists are more likely to experience
price rigidity in situations of excess capacity—during
a business downturn or a recession, for instance. In
such cases, firms are likely to match a price cut but
not a price hike—that is, they face a kinked demand
curve. Also, if an oligopolist believes that other firms
are faced with rising cost, then all the firms in the
industry would respond to the change in marginal
cost by adjusting their price and output accordingly
to maintain their collusive position.
PRICE LEADERSHIP
Over time, an implied understanding may develop in an
oligopoly market that a large firm is the
price leader,
sending a signal to competitors, perhaps through a
press release, that they
have increased their
prices. This approach
is not outright collusion
because no formal
cartel arrangement or
formal meetings are
used to determine price
and output; but this is
what is called tacit col-
lusion. Any competitor
that goes along with the
pricing decision of the
price leader is called a
price follower.
Price leadership
is most likely to
develop when one
firm, the so-called
dominant firm, produces a large portion of the total
output. The dominant firm sets the price that maxi-
mizes its profits and the smaller firms, which would
have little influence over price anyway, act as if they
are perfect competitors—selling all they want at that
price. In the past, a number of firms have been price
leaders: U.S. Steel and Bethlehem Steel, RJ Reynolds
(tobacco), General Motors (automobiles), Kellogg’s
(breakfast cereals), and Goodyear (tires). In the bank-
ing industry, various dominant banks have taken
turns being the dominant firm in announcing changes
in the prime interest rate—the interest rate that banks
charge large corporate clients. Because the prime rate
is widely cited in newspapers, it makes it easy for
The Kinked Demand Curve
S E C T I O N
1 5 . 3
E
X H I B I T
1
0
P
*
q*
Price
MC
2
MC
1
D
Marginal
Revenue
Quantity
If the firm increases its price from P *, most firms
will not follow, and its demand curve is said to
be relatively elastic (that is, a slight increase in
price will lead to a more than proportionate fall
in the quantity demanded). Conversely, below P *,
demand is relatively inelastic; a slight decrease in
price will not lead to a large increase in the quan-
tity demanded because rivals will also lower prices
to hold onto their market share. Even if the mar-
ginal cost increases from MC
1
to MC
2
, the firm will
produce the same at the same price, P *, and at the
same output, q*.
price leader
a large firm in an oligopoly that uni-
laterally makes changes in its prod-
uct prices that competitors tend to
follow
price follower
a competitor in an oligopoly that
goes along with the pricing decision
of the price leader
price leadership
when a dominant firm that pro-
duces a large portion of the indus-
try’s output sets a price that
maximizes its profits, and other
firms follow
95469_15_Ch15_p387-412.qxd 29/12/06 12:52 PM Page 394
C H A P T E R 1 5
Oligopoly and Strategic Behavior
395
other banks to follow the lead and avoid frequent
changes and competitive warfare.
WHAT HAPPENS IN THE LONG
RUN IF ENTRY IS EASY?
Mutual interdependence is, in itself, no guarantee of
economic profits, even if the firms in the industry
succeed in maximizing joint profits. The extent to
which economic profits disappear depends on the ease
with which new firms can enter the industry. When
entry is easy, excess profits attract newcomers. New
firms may break down existing price agreements by
undercutting prices in an attempt to establish them-
selves in the industry. In response, older firms may
reduce prices to avoid excessive sales losses; as a
result, the general level of prices will begin to
approach average total cost.
HOW DO OLIGOPOLISTS DETER
MARKET ENTRY?
If most firms reach a scale of plant and firm size great
enough to allow lowest-cost operation, their long-run
positions will be similar to that shown in Exhibit 2. To
simplify, we have drawn MC and ATC constant. The
equilibrium, or profit-maximizing, price in an estab-
lished oligopoly is represented by P∗. Typically, the rate
of profit in these industries is high, which would
encourage entry. However, empirical research indicates
that oligopolists often initiate pricing policies that
reduce the entry incentive for new firms. Established
firms may deliberately hold prices below the maximum
profit point at P∗, charging a price of, say, P
1
. This
lower than profit-maximizing price may discourage
newcomers from entering. Because new firms would
likely have higher costs than existing firms, the lower
price may not be high enough to cover their costs.
However, once the threat of entry subsides, the
market price may return to the profit-maximizing
price, P∗.
Similarly, if the price
is deliberately kept low
(below average variable
cost) to drive a competi-
tor out of the market, it
is called
predatory
pricing
. However, both
economists and the
courts have a difficult time deciding whether the price
is truly predatory. Even if the price is driven down
below average variable cost (recall from Chapter 13,
when price is below AVC, it is the shutdown point of a
firm), the courts still have to determine whether the
low price destroyed the rival and kept it out of busi-
ness. Did the firm significantly raise its prices once the
rival had been driven out of the industry? Microsoft,
American Airlines, and other companies have been
accused of predatory pricing but never convicted
because it is so difficult to distinguish predatory pricing
from vigorous competition.
Oligopolists may initiate pricing policies that reduce the entry
incentive for new firms, or they may try to drive a competitor
out of the industry. For example, it is possible that a small-
town drug store might be run out of town by Wal-Mart’s
“falling prices.”
©
Photodisc Green/Getty Images
Long-Run Equilibrium
and Deterring Entry
S E C T I O N
1 5 . 3
E
X H I B I T
2
0
P*
P
1
Price
D
MR
ATC
= MC
Quantity
q*
With barriers to entry, oligopolists may earn excess
profits in the long run. Theoretically, profit maxi-
mization occurs at P∗ and q∗ in the short run.
Empirical work, however, suggests that oligopolists
often actually charge a lower price than the short-
run profit-maximizing price (such as P
1
). This strategy
discourages entry because newcomers may have costs
higher than P
1
.
predatory pricing
setting a price deliberately low in
order to drive out competitors
95469_15_Ch15_p387-412.qxd 29/12/06 12:53 PM Page 395
396
M O D U L E 3
Households, Firms, and Market Structure
SOME STRATEGIES FOR NONCOLLUSIVE
OLIGOPOLIES
In some respects, noncollusive oligopoly resembles
a military campaign or a poker game. Firms take
certain actions not because they are necessarily
advantageous in themselves but because they
improve the position of the oligopolist relative to its
competitors and may ultimately improve its finan-
cial position. For example, a firm may deliberately
S E C T I O N
*
C H E C K
1.
In the kinked demand curve model, if one firm cuts its price, rivals will follow, but rival firms will not follow the
firm if it raises its price.
2.
When market entry is easy, excess profits attract newcomers. They may break down existing price agreements, causing
older firms to reduce their prices and, ultimately, drive the general level of prices toward average total cost.
3.
Firms in an oligopoly may deliberately hold prices below the short-run profit-maximizing point in order to discour-
age newcomers from entering the market.
1.
What explains the kink in the kinked demand curve?
2.
What impact does easy entry have on the profitability of oligopolies?
3.
Why are barriers to entry necessary for successful, ongoing collusion?
4.
Why might oligopolists charge less than their short-run profit-maximizing price when threatened by entry?
5.
A group of colluding oligopolists incurs costs of $10 per unit, and their profit-maximizing price is $15. If they know that
potential market entrants could produce at a cost of $12 per unit, what price are the colluders likely to charge?
6.
Why is price leadership also called tacit collusion?
S E C T I O N
15.4
G a m e T h e o r y a n d S t r a t e g i c B e h a v i o r
■
What is game theory?
■
What are cooperative and noncooperative
games?
■
What is a dominant strategy?
■
What is Nash equilibrium?
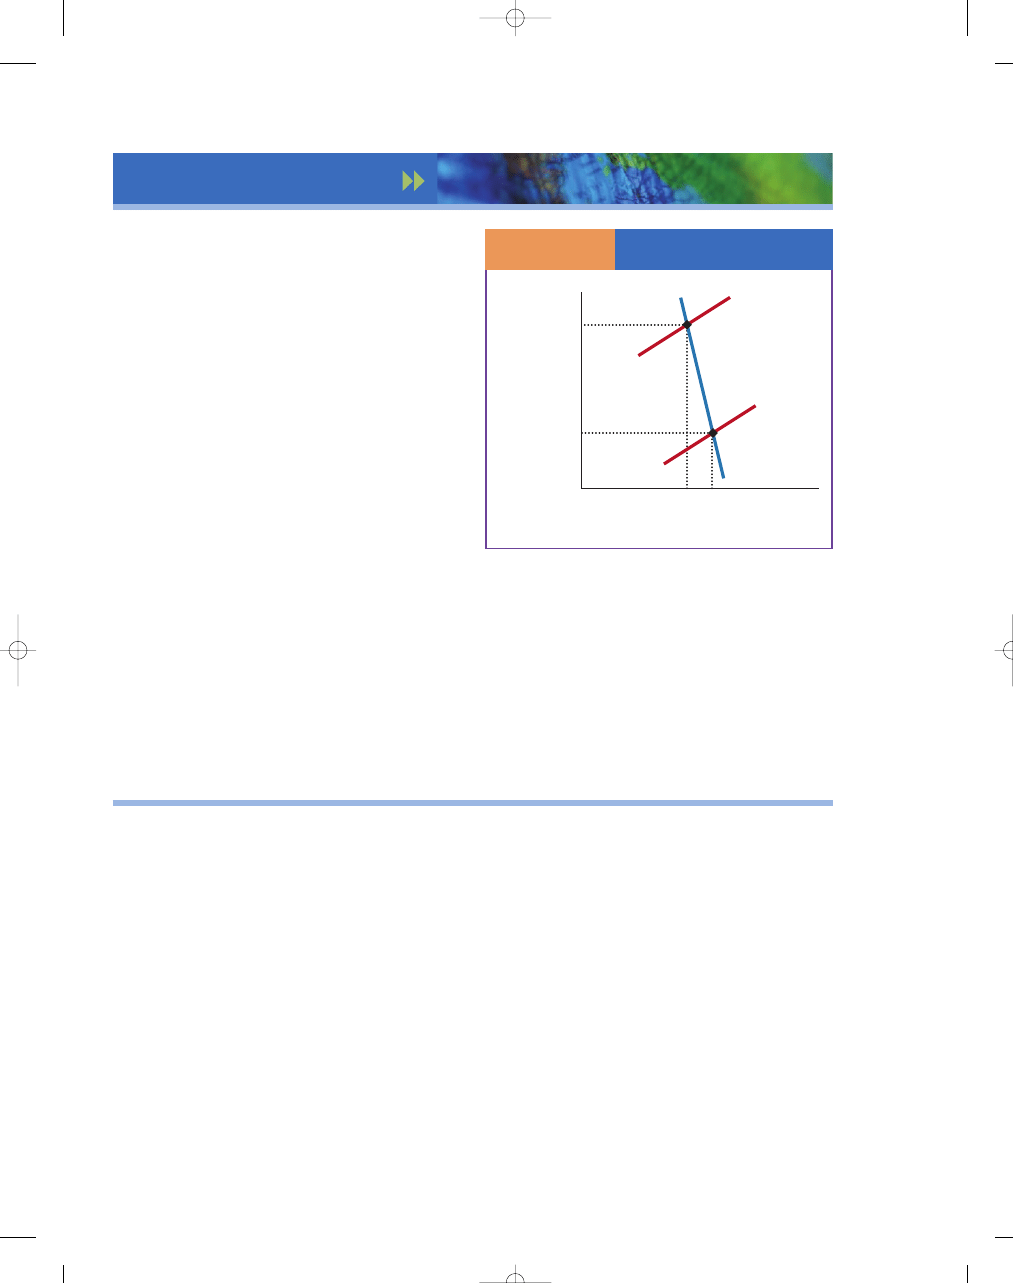
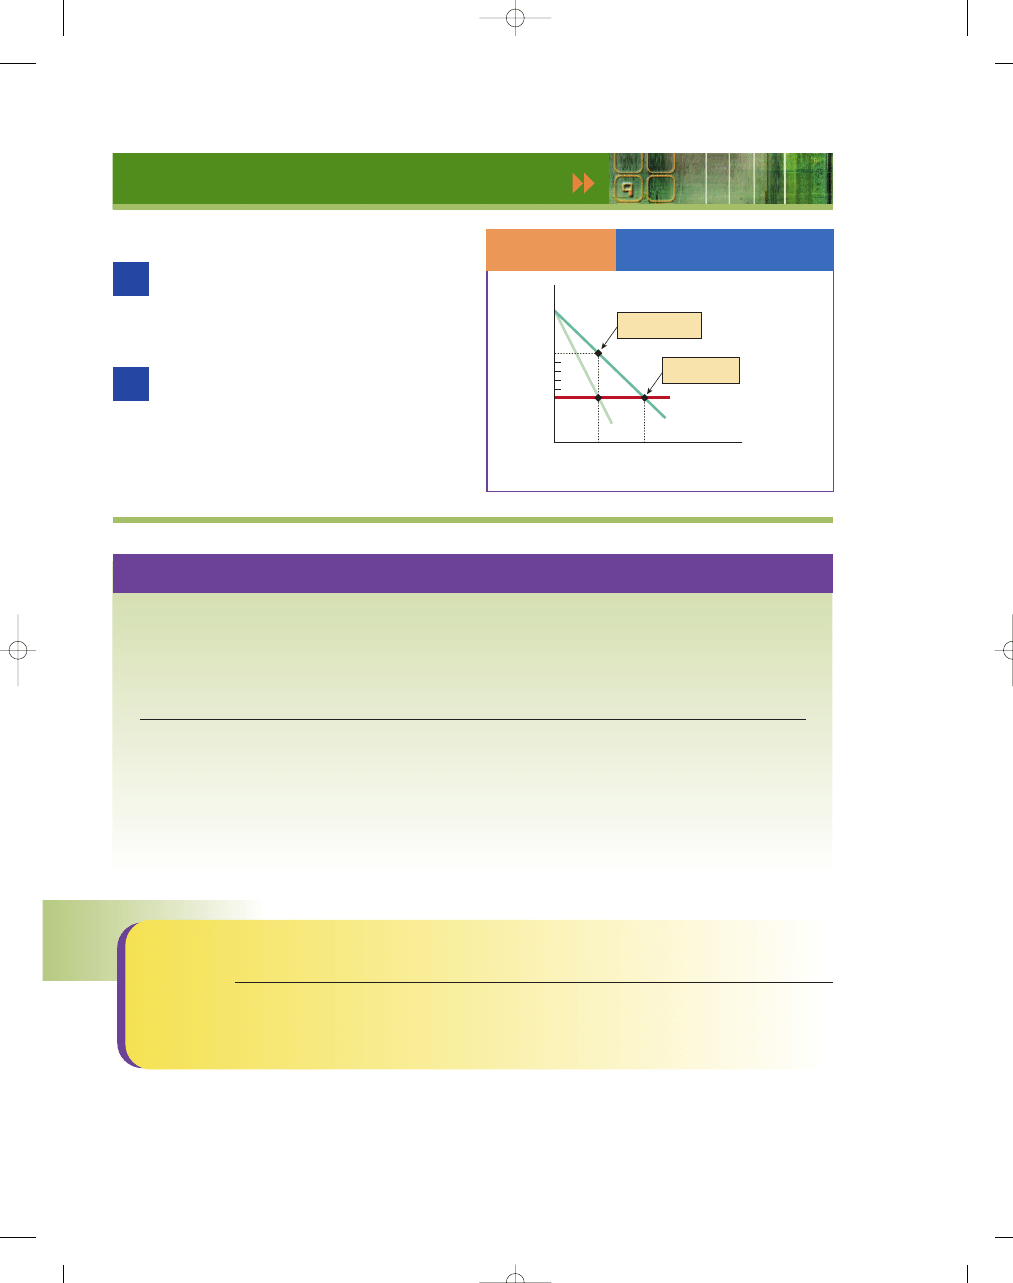
using what you’ve learned
Mutual Interdependence in Oligopoly
Suppose that Firm A is a member of a naive oligopoly, meaning that
neither Firm A nor its competitors recognize the mutual interde-
pendence that exists between them. Firm A decides to lower its price to cap-
ture a greater market share. What will happen to profits in this market in the
long run?
If an oligopolist believes that its rivals will not respond to pricing
policies, it will expect to capture market share by reducing price. In
response, rivals will cut prices as well, and if they do not understand the
mutual interdependence among firms in oligopoly, they will attempt to
undercut prices, as shown in Exhibit 3 in the movement from P
1
to P
2
, and so
on. This exchange would result in a price war, which could continue until eco-
nomic profits were zero and price equaled average cost.
Q
A
Mutual Interdependence
in Oligopoly
S E C T I O N
1 5 . 3
E
X H I B I T
3
0
P
1
P
2
P
3
P
4
P
5
P
q
2
q
1
Price
D
MR
ATC
= MC
Quantity
Price and output
when firms collude
Price and output
with no collusion
95469_15_Ch15_p387-412.qxd 29/12/06 12:53 PM Page 396

cut prices, sacrificing profits either to drive com-
petitors out of business or to discourage them from
undertaking actions contrary to the interests of
other firms.
WHAT IS GAME THEORY?
Some economists have suggested that the entire
approach to oligopoly equilibrium price and output
should be recast. They replace the analysis that
assumes that firms attempt to maximize profits with
one that examines firm behavior in terms of a strate-
gic game. This point of view, called
game theory
,
stresses the tendency of
various parties in such
circumstances to act in
a way that minimizes
damage from oppo-
nents. This approach
involves a set of alter-
native actions (with
respect to price and output levels, for example); the
action that would be taken in a particular case
depends on the specific policies followed by each
firm. The firm may try to figure out its competitors’
most likely countermoves to its own policies and then
formulate alternative defense measures.
COOPERATIVE AND NONCOOPERATIVE GAMES
Games, in interactions between oligopolists, can
either be cooperative or noncooperative. An example
of a
cooperative game
would be two firms that
decide to collude in order to improve their profit
maximization position. However, as we discussed ear-
lier, enforcement costs are usually too high to keep all
firms from cheating on collusive agreements.
Consequently, most games are
noncooperative
games
, in which each firm sets its own price without
consulting other firms.
The primary difference
between cooperative
and noncooperative
games is the contract.
For example, players in
a cooperative game can
talk and set binding
contracts, while those in
noncooperative games
are assumed to act inde-
pendently, with no communication and no binding
contracts. Because antitrust laws forbid firms to col-
lude, we will assume that most strategic behavior in
the marketplace is noncooperative.
THE PRISONERS’ DILEMMA
A firm’s decision makers must map out a pricing strat-
egy based on a wide range of information. They must
also decide whether their strategy will be effective and
whether it will be affected by competitors’ actions. A
strategy that will be optimal regardless of the oppo-
nents’ actions is called a
dominant strategy
. A
famous game that has a dominant strategy and
demonstrates the basic problem confronting noncol-
luding oligopolists is known as the
prisoners’
dilemma
.
Imagine that a bank robbery occurs and two sus-
pects are caught. The suspects are placed in separate
cells in the county jail
and are not allowed to
talk with each other.
Four results are possi-
ble in this situation:
both prisoners confess,
neither confesses,
Prisoner A confesses
but Prisoner B doesn’t,
or Prisoner B confesses
but Prisoner A doesn’t.
In Exhibit 1, we see the
payoff matrix
, which
summarizes the possi-
ble outcomes from the
C H A P T E R 1 5
Oligopoly and Strategic Behavior
397
game theory
firms attempt to maximize profits
by acting in ways that minimize
damage from competitors
cooperative game
collusion by two firms in order to
improve their profit maximizations
noncooperative
game
each firm sets its own price without
consulting other firms
dominant strategy
strategy that will be optimal regard-
less of opponents’ actions
prisoners’ dilemma
the basic problem facing noncollud-
ing oligopolists in maximizing their
own profit
payoff matrix
a summary of the possible out-
comes of various strategies
A pitcher wants to throw a pitch that will surprise this
batter. The batter knows that the pitcher wants to fool
him. So what does the pitcher throw, knowing the batter
expects the pitcher to fool him? Is this a game with strate-
gic interaction?
©
Br
and X Pictures/J
upiter Images
95469_15_Ch15_p387-412.qxd 29/12/06 12:53 PM Page 397
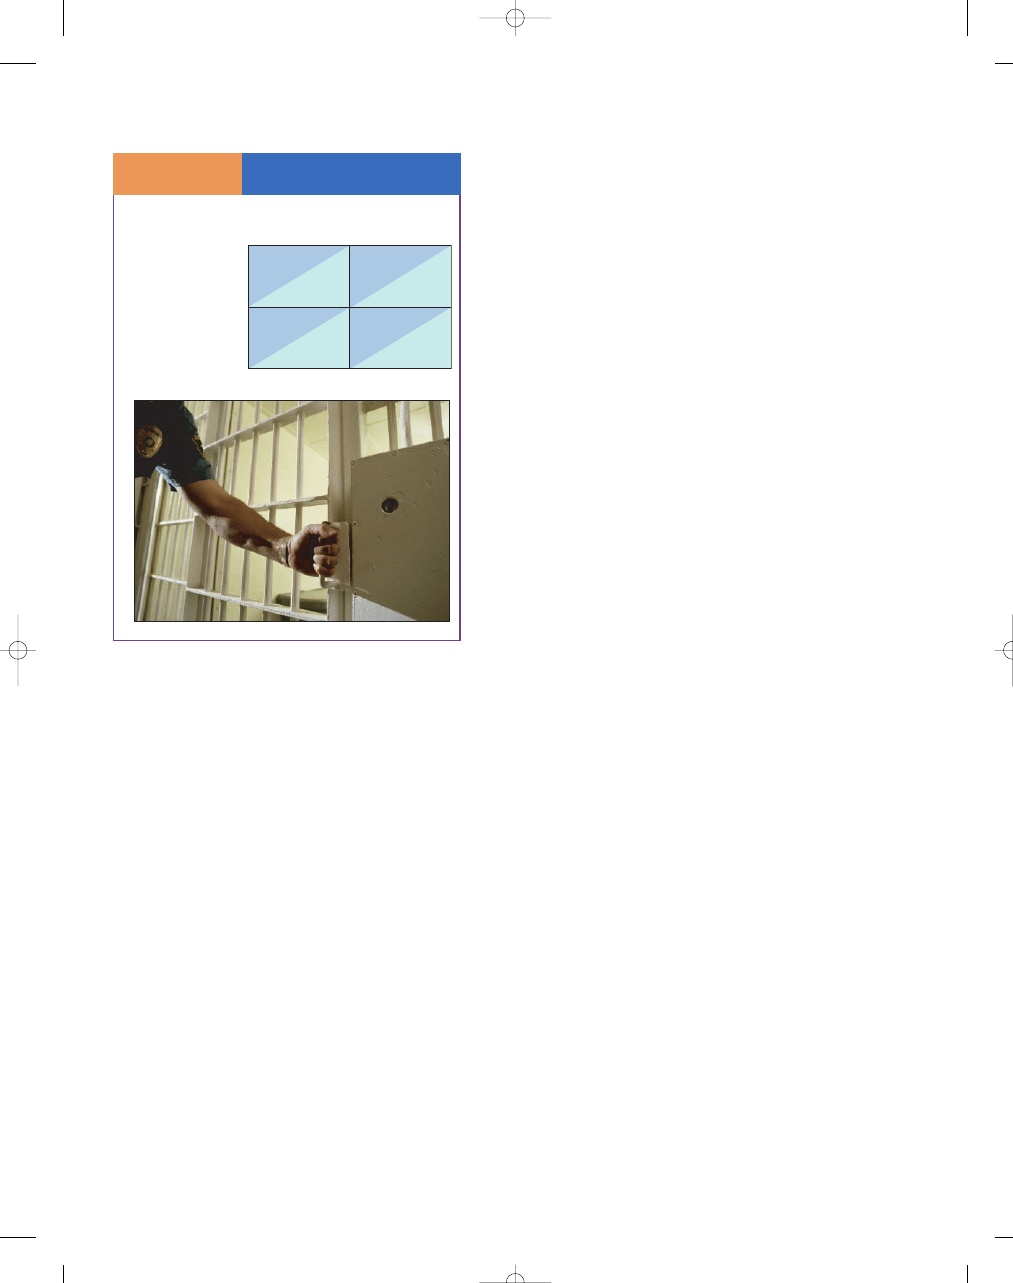
various strategies. Looking at the payoff matrix, we
can see that if each prisoner confesses to the crime,
each will serve two years in jail. However, if neither
confesses, each prisoner may only get one year
because of insufficient evidence. Now, if Prisoner A
confesses and Prisoner B does not, Prisoner A will get
six months (because of his cooperation with the
authorities and his evidence) and Prisoner B six
years. Alternatively, if Prisoner B confesses and
Prisoner A does not, Prisoner B will get six months
and Prisoner A six years. As you can see, then, the
prisoners have a dilemma. What should each pris-
oner do?
Looking at the payoff matrix, we can see that if
Prisoner A confesses, it is in the best interest for
Prisoner B to confess. If Prisoner A confesses, he will
get either two years or six months, depending on what
Prisoner B does. However, Prisoner B knows the temp-
tation to confess facing Prisoner A, so confessing is
also the best strategy for Prisoner B. A confession
would mean a lighter sentence for Prisoner B—two
years rather than six years.
It is clear that both would be better off confessing
if they knew for sure that the other was going to
remain silent, because that would lead to a six-month
sentence for each. However, in each case, can the
prisoner take the chance that the co-conspirator will
not talk? The dominant strategy, although it may not
lead to the best outcome, is to confess. That is, the
prisoners know that confessing is the way to make the
best of a bad situation. No matter what the counter-
part does, the maximum sentence will be two years
for each, and each understands the possibility of
being out in six months. In summary, when the pris-
oners follow their dominant strategy and confess,
both will be worse off than if each had remained
silent—hence, the “prisoners’ dilemma.”
Firms in oligopoly often behave like the prisoners
in the prisoners’ dilemma, carefully anticipating the
moves of their rivals in an uncertain environment. For
example, should a firm cut its prices and try to gain
more sales by luring customers away from its com-
petitors? What if the firm keeps its price stable and
competitors lower theirs? Or what if the firm and its
competitors all lower their prices? What if all of the
firms decide to raise their prices? Each of these situa-
tions will have vastly different implications for an oli-
gopolist, so it must carefully watch and anticipate the
moves of its competitors.
PROFITS UNDER DIFFERENT PRICING STRATEGIES
To demonstrate how the prisoners’ dilemma can shed
light on oligopoly theory, let us consider the pricing
strategy of two firms. In Exhibit 2, we present the
payoff matrix—the possible profits that each firm
would earn under different pricing strategies. Assume
that each firm has total production costs of $1 per
unit. When both firms set their price at $10 and each
sells 1,000 units per week, then each earns a profit of
$9,000 a week. If each firm sets its price at $9, each
sells 1,100 units per week for a profit of $8,800 [($9
– $1)
× 1,100]. However, what if one firm charges
$10 and the other firm charges $9? The low-price
firm increases its profits through additional sales. It
now sells, say, 1,500 units for a profit of $12,000,
while the high-price firm sells only 600 units per week
for a profit of $5,400.
When the two firms each charge $9 per unit, they
are said to have reached a Nash equilibrium (named
after Nobel Prize–winning economist and mathemati-
cian John Nash). At a Nash equilibrium, each firm is
said to be doing as well as it can given the actions of
its competitor. For example, if each firm believes the
other is going to charge $9, then the best strategy for
both firms is to charge $9. In this scenario, if Firm A
charges $9, the worse possible outcome is a profit of
$8,800. However, if Firm A prices at $10 and Firm B
prices at $9, Firm A will have a profit of only $5,400.
Hence, the choice that minimizes the risk of the worst
398
M O D U L E 3
Households, Firms, and Market Structure
The Prisoners’ Dilemma
Payoff Matrix
S E C T I O N
1 5 . 4
E
X H I B I T
1
©
Stephen Mar
ks/The Image Bank/Getty Images
2 years
(A)
6 months
(A)
6 years
(B)
2 years
(B)
6 years
(A)
6 months
(B)
1 year
(A)
1 year
(B)
Prisoner B
Confesses
Confesses
Prisoner A
Doesn’t
Confess
Doesn’t Confess
95469_15_Ch15_p387-412.qxd 29/12/06 12:53 PM Page 398

C H A P T E R 1 5
Oligopoly and Strategic Behavior
399
scenario is $9. The same is true for Firm B; it too min-
imizes the risk of the worst scenario by choosing to
price at the Nash equilibrium, $9. In this case, the
Nash equilibrium is also the dominant strategy. The
Nash equilibrium takes on particular importance
because it is a self-enforcing equilibrium. That is,
once this equilibrium is established, neither firm has
an incentive to move.
In sum, we see that if the two firms were to col-
lude and set their price at $10, it would be in their
best interest. However, each firm has a strong incen-
tive to lower its price to $9 if this pricing strategy goes
undetected by its competitor. However, if both firms
defect by lowering their prices from the level of joint
profit maximization, both will be worse off than if
they had colluded, but at least each will have mini-
mized its potential loss if it cannot trust its competi-
tor. This situation is the oligopolists’ dilemma.
ADVERTISING
Advertising can lead to a situation like the prisoners’
dilemma. For example, perhaps the decision makers
of a large firm are deciding whether to launch an
advertising campaign against a rival firm. According
to the payoff matrix in Exhibit 3, if neither company
advertises, the two companies split the market, each
making $100 million in profits. They also split the
market if they both advertise, but their net profits are
smaller, $75 million, because they would both incur
advertising costs that are greater than any gains in
additional revenues from advertising. However, if one
advertises and the other does not, the company that
advertises takes customers away from the rival.
Profits for the company that advertises would be
$125 million, and profits for the company that does
not advertise would be $50 million.
The Profit Payoff Matrix
S E C T I O N
1 5 . 4
E
X H I B I T
2
Advertising
S E C T I O N
1 5 . 4
E
X H I B I T
3
Firm
(A)
$9,000
Firm
(A)
$12,000
Firm
(B)
$5,400
Firm
(B)
$8,800
Firm
(A)
$8,800
Firm
(A)
$5,400
Firm
(B)
$12,000
Firm
(B)
$9,000
Firm B
′s Pricing Strategy
Firm A
′s Pricing Strategy
Charge $10
Charge $10
Charge $9
Charge $9
Firm (A)
$75 M
Firm (B)
$75 M
Firm (A)
$50 M
Firm (B)
$125 M
Firm (B)
$100 M
Firm (B)
$50 M
Firm (A)
$125 M
Firm (A)
$100 M
Firm B
′s Decision
Firm A
′s Decision
Advertises
Doesn’t Advertise
Advertises
Doesn’t Advertise
95469_15_Ch15_p387-412.qxd 29/12/06 12:53 PM Page 399

400
M O D U L E 3
Households, Firms, and Market Structure
The dominant strategy—the optimal strategy
regardless of the rival’s actions—is to advertise. In this
game, both firms will choose to advertise, even
though both would be better off if no one advertised.
But one company can’t take a chance and not adver-
tise, because if its competitor then elects to advertise,
the competitor could have a big year, primarily at the
expense of the firm that doesn’t advertise.
NETWORK EXTERNALITIES
In our discussion of supply and demand (Chapter 4), we
assumed that demand was a function of the price of the
good (a change in quantity demanded) and the determi-
nants of demand (the shifters that cause changes in
demand). For example, the amount of ice cream we are
willing and able to buy is a function of the price of ice
cream, the price of related goods—substitutes like
yogurt and complements like hot fudge—income, the
number of buyers, tastes, and expectations. However,
we did not mention that for some goods, the quantity
demanded depends on how many other people pur-
chase the good. This factor is called a
network
externality.
A
positive network externality
occurs
when a consumer’s
quantity demanded for a
good increases because a
greater number of con-
sumers purchase the
same good. A
negative
network externality
occurs if the consumer’s
quantity demanded for a
good increases because
fewer consumers are
purchasing the same
good. In other words,
sometimes an individ-
ual’s demand curve is
influenced by the other
people purchasing the
good.
Positive Network Externalities
Many examples of network externalities can be found
in the communications area, such as with fax machines,
telephones, and the Internet. Imagine you had a tele-
phone, but nobody else did; it would be relatively
worthless without others with whom to talk. It is also
true that if you were the only one to own a compact disc
player, it would make little sense for manufacturers to
make discs and your CD player would be of little value.
The software industry has many examples of
positive network externalities. For example, it is a
lot easier to coordinate work if everyone is using the
same software on their computer. It is also a lot
easier (less costly) to get help if you need it because
many people are familiar with the product, which
may be a lot easier (less costly) than calling the sup-
port line to your software package. Another exam-
ple is fax machines—others have to have one. In
short, our demand increases as the number of users
increases.
Another type of
positive network exter-
nality is called the
bandwagon effect,
where a buyer wants
the product because
others own it. In recent
years, we watched
people get on the band-
wagon in the toy industry with Cabbage Patch Dolls,
Beanie Babies, Tickle Me Elmo, and Furbies, among
others. It can happen in the clothing industry too
(e.g., Tommy Bahama or Ugg boots).
Negative Network Externalities
Other goods and services are subject to negative net-
work externalities, which may be a result of the snob
effect. The snob effect is a negative network external-
ity where a consumer wants to own a unique good.
For example, a rare baseball card of Shoeless Joe
Jackson, a Model T car (a tin lizzy) a Vincent Van
Gogh painting, a Rolex watch, or an expensive sports
car may qualify as snob goods where the quantity that
a particular individual demanded of a good increases
when fewer other people own it. Firms seek to achieve
a snob effect through marketing and advertising,
knowing that if they can create a less elastic demand
curve for their product they can raise prices.
Negative network externalities can arise from
congestion too. For example, if you are a member of
a health club, a negative network externality may
occur because too many people are in the gym work-
ing out at the same time. Even though I may prefer
a ski resort with shorter lift lines, others may view
these goods as a positive externality and would
increase their quantity demanded if more people
were in the gym, on the beach, or at the ski slopes.
Perhaps they do not want to work out alone, hang
out on a lonely beach, or ride up on the chair lift by
themselves. That is, whether it is a positive or nega-
tive network externality may depend on the con-
sumer’s tastes and preferences.
network externality
when the number of other people
purchasing the good influences
quantity demanded
positive network
externality
increase in a consumer’s quantity
demanded for a good because a
greater number of other consumers
are purchasing the good
negative network
externality
increase in a consumer’s demand for
a good because fewer consumers are
purchasing the same good
bandwagon effect
a positive network externality in
which a consumer’s demand for a
product increases because other
consumers own it
95469_15_Ch15_p387-412.qxd 29/12/06 12:53 PM Page 400
C H A P T E R 1 5
Oligopoly and Strategic Behavior
401
Switching Costs
Along with the possible advantages of joining a larger
network from capturing positive network externali-
ties, you may also encounter costs if you leave—
switching costs.
For example, costs are associated
with switching to new software. For example, if you
were well-versed in WordPerfect, it would be costly to
switch to Microsoft
Word. Network exter-
nalities and switching
costs are two of the
reasons that eBay and
Amazon.com have done
so well. The first firm
in a market, where everybody in its large customer
base is familiar with the operation, gains huge advan-
tage. Other potential competitors recognize this
advantage and, as a result, are leery of entering into
the business.
In short, in industries that see significant posi-
tive network effects, oligopoly is likely to be present.
That is, a small number of firms may be able to
secure most of the market. Consumers tend to
choose the products that everyone else is using.
Thus, behavior may allow these firms to increase
their output and achieve economics of scale that
smaller firms cannot obtain. Hence, the smaller
firms will go out of business or be bought out by
larger firms.
switching costs
the costs involved in changing from
one product to another brand or in
changing suppliers
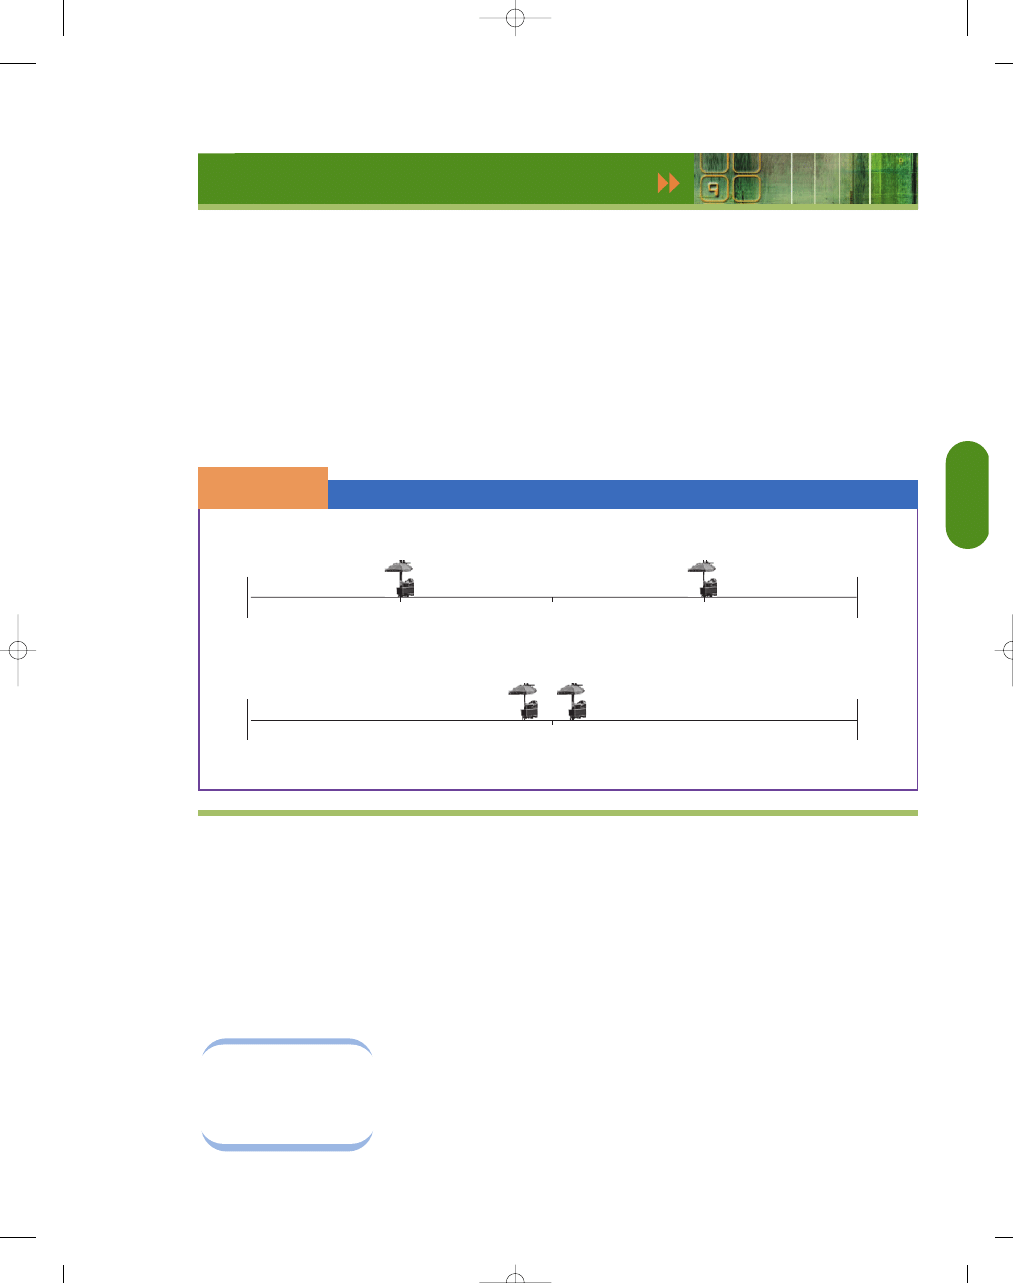
using what you’ve learned
Nash at the Beach
Two ice cream vendors on the beach are selling identical ice cream at the
same price. The demanders are uniformly distributed along the beach. To
minimize transportation costs, each vendor might strategically set up at the
1
/
4
-mile mark and
3
/
4
-mile mark, each with an advantage of being halfway to
its rival. However, the situation in Exhibit 5 is not a stable equilibrium,
because if vendor A thinks vendor B is going to stay put, then vendor A will
move to the right, closer to vendor B, and capture three-fourths of the
market, and vendor B will have the remaining one-fourth. Vendor B would
then want to move to the left of vendor A. They would continue to leap frog
until they reached the center. That is, a Nash equilibrium will lead to both
vendors locating in the middle—doing the best they can given what the
competitor is doing.
Recall the discussion of the median voter model in Chapter 8, where the
prediction was that the candidates will pick a political position in the middle
of the distribution of voters. The ice cream vendor model helps us understand
this phenomenon as well as why fast-food restaurants, car dealerships, and
motels are often found in close proximity to each other.
Vendors at the Beach
S E C T I O N
1 5 . 4
E
X H I B I T
4
0
1
1
4
–
1
2
–
3
4
–
mile
mile
mile
mile
0
1
1
2
–
mile
mile
Vendor
A
Vendor
A
Vendor
B
Vendor
B
95469_15_Ch15_p387-412.qxd 29/12/06 12:54 PM Page 401

402
M O D U L E 3
Households, Firms, and Market Structure
S E C T I O N
*
C H E C K
1.
Game theory stresses the tendency of various parties to minimize damage from opponents. A firm
may try to figure out its competitors’ most likely countermoves to its own policies and then
formulate alternative defense measures.
2.
Players in cooperative games can talk and set binding contracts, while those in noncooperative games
are assumed to act independently with no communications and no binding contracts.
3.
The prisoners’ dilemma is an example of a noncooperative game.
4.
A dominant strategy is optimal regardless of the opponents’ actions.
5.
At a Nash equilibrium, each player is said to be doing as well as it can, given the actions of its
competitor.
1.
How is noncollusive oligopoly like a military campaign or a poker game?
2.
What is the difference between cooperative and noncooperative games?
3.
How does the prisoners’ dilemma illustrate a dominant strategy for noncolluding oligopolists?
4.
What is a Nash equilibrium?
5.
In the prisoners’ dilemma, if each prisoner believed that the other prisoner would deny the crime,
would each choose to deny the crime?
I n t e r a c t i v e S u m m a r y
Fill in the blanks:
1. Oligopolies exist when only a (n)
firms control all or most of the production and sale of
a product.
2. In oligopoly, products may be either homogeneous or
.
3. In oligopoly,
to entry are often
high, preventing competing firms from entering the
market.
4. In oligopoly, firms can earn long-run
profits.
5. Oligopoly is characterized by mutual
among firms. Oligopolists must
because the number of firms in the industry is so
small that changes in one firm’s price of output will
affect the sales of competing firms.
6. In oligopoly, barriers to entry in the form of large
start-up costs, economies of scale, or
are usually present.
7. The economy of large-scale production
new firms from entering a market,
because high initial average total costs impose heavy
losses on new entrants.
8. Mutual interdependence means that no firm
knows with
what its demand
curve looks like. The demand curve and the
profit-maximizing price and output will depend
on how others
to the firm’s
policies.
9. Because they are mutually interdependent, oligopolists
are tempted to get together and agree to act jointly, or
to
, in order to reduce uncertainty
and raise profits.
10. From society’s point of view, collusion creates a situa-
tion where goods are priced too
and outputs too
.
11. International agreements between firms regarding
sales, pricing, and other decisions are called
agreements.
12. Although collusive oligopolies may be profitable for
participants, they are often short lived because firms
have a great temptation to
on
their fellow colluders.
13. In oligopoly, an understanding may develop under
which one large firm will play the role of price
, sending signals to competitors
that they have changed their prices.
14. Competitors that go along with the pricing decisions
of a price leader are called price
.
15. Collusive behavior is no guarantee of economic
profits in the
run.
95469_15_Ch15_p387-412.qxd 29/12/06 12:54 PM Page 402

C H A P T E R 1 5
Oligopoly and Strategic Behavior
403
16. Without
to entry, new firms will
be attracted by the economic profits earned when
firms act to maximize joint profits.
17. New firms will lower
and break
down existing pricing agreements. Price competition
will result in prices approaching the level of average
total .
18. Oligopolists may charge a price lower than the
profit-maximizing price to
new
firms from entering the market. This strategy will be
effective when new firms face
costs than existing firms in the industry do.
19. The idea of price
in oligopoly is
the basis of the kinked demand curve model.
20. The kinked oligopoly firm’s demand curve is
produced by the greater tendency of competitors
to follow price
than price
.
21. Under the assumptions of the kinked demand curve
model, a firm’s demand curve is
elastic for price increases than for price decreases.
22. The kinked demand curve model implies that firms
may be slow to adjust price in response to changes in
.
23. In some respects,
oligopoly resem-
bles a military campaign or poker game.
24. Oligopoly interdependence is often analyzed in terms
of theory.
25. Collusion is an example of a
game.
26. In
, each firm sets its policy with-
out consulting other firms.
27. The primary difference between cooperative games
and noncooperative games lies in the players’ ability
to make
.
28. In game theory, a strategy that will be optimal regard-
less of one’s opponents’ actions is called a
strategy.
29. In the traditional prisoners’ dilemma, a
matrix is used to illustrate the various possibilities
and results for the two parties.
30. A
equilibrium is reached in game
theory when each firm is doing as well as it can, given
the actions of its competitor.
31. A Nash equilibrium is
, because
once it is established, neither firm has an incentive to
change behavior.
32. A
externality occurs when a con-
sumer’s quantity demanded increases because a
greater number of consumers purchase the same
good.
33. Positive network externalities are particularly
common in the area of
.
34. The
effect refers to the case
where a buyer wants a product because others also
own it.
35. Congestion can cause
network
externalities by overcrowding.
36. Switching costs can give an advantage to the
firms in an industry.
A
nswers:
1.
few
2.
differentiated
3.
barriers
4.
economic
5.
interdependence; strategize
6.
patents
7.
discourages
8.
certainty; react
9.
collude
10.
high; low
11.
cartels
12.
cheat
13.leader
14.followers
15.
long
16.
barriers
17.
prices; costs
18.
discourage; higher
19.
rigidity
20.
reductions; increases
21
.
more
22.
marginal cost
23.
noncollusive
24.
game
25.
cooperative
26.
noncooperative games
2
7
.
contracts
28.
dominant
29.
payoff
30.
Nash
31.
self-enforcing
32.
positive network
33.
communications
34.
bandwagon
35.
negative
36.
first
K e y Te r m s a n d C o n c e p t s
mutual interdependence 388
collude 390
cartel 391
joint profit maximization 391
kinked demand curve 393
price leader 394
price follower 394
price leadership 394
predatory pricing 395
game theory 397
cooperative game 397
noncooperative game 397
dominant strategy 397
prisoners’ dilemma 397
payoff matrix 397
network externality 400
positive network externality 400
negative network externality 400
bandwagon effect 400
switching costs 401
95469_15_Ch15_p387-412.qxd 29/12/06 12:54 PM Page 403

404
M O D U L E 3
Households, Firms, and Market Structure
S e c t i o n C h e c k A n s w e r s
15.1 Oligopoly
1. How can concentration ratios indicate the extent of
oligopolies’ power?
Concentration ratios indicate the fraction of total
industry output produced by the largest firms in
the industry, which is a guide to their ability to
increase prices. However, they are imperfect indica-
tors; for instance, they do not reflect foreign
competition.
2. Why is oligopoly characterized by mutual interde-
pendence?
Because an oligopoly includes few sellers, any change
in output or price by one of them is likely to appre-
ciably impact the sales of competing firms. Each of
the sellers recognizes this fact, so what each firm
should do to maximize its profits depends on what
other firms do. Their choices and policies therefore
reflect this mutual interdependence.
3. Why do economies of scale result in few sellers in oli-
gopoly models?
Where substantial economies of scale are available
relative to market demand, reasonably low costs of
production cannot be obtained unless a firm produces
a large fraction of the market output. If each firm, to
produce at low costs, must supply a substantial frac-
tion of the market, the industry has room for only a
few firms to produce efficiently.
4. How do economies of scale result in barriers to entry
in oligopoly models?
Low-cost entry must take place on a large scale in
industries with substantial economies of scale.
Therefore, existing firms could be profitable at
their current prices and outputs without leading to
entry. The great increase a large-scale entrant
would cause in market output and the resulting
decrease in market price could make that
entrant unprofitable at those lower post-entry
prices, even if current firms are profitable at current
prices.
5. Why does an oligopolist have a difficult time finding
its profit-maximizing price and output?
An oligopolist has a difficult time finding its profit-
maximizing price and output because its demand
curve is dramatically affected by the price and output
policies of each of its rivals. This difficulty causes a
great deal of uncertainty about the location and shape
of its demand and marginal revenue curves, because
they depend on what policies rivals actually adopt.
6. Why would an automobile manufacturer be
more likely than the corner baker to be an
oligopolist?
The automobile industry realizes substantial
economies of scale relative to market demand, so
lower-cost automobile production can be obtained
by a firm that produces a substantial fraction of the
market output. As a result, the automobile industry
only has room for relatively few efficient-scale pro-
ducers. In contrast, the bakery industry does not
have substantial economies of scale relative to
market demand, so the industry has room for a
large number of efficient-scale bakeries.
15.2 Collusion and Cartels
1. Why are collusive agreements typically unstable and
short lived?
Collusive agreements are typically unstable and short
lived because they are strictly illegal under antitrust
laws in the United States and many other countries
and because firms experience a great temptation to
cheat on collusive agreements by increasing their
output and decreasing prices, which undermines any
collusive agreement.
2. Why is the temptation to collude greater when the
industry’s demand curve is more inelastic?
The more inelastic the demand curve, the greater the
increase in profits from colluding to jointly restrict
output below its current level and raise prices in the
industry; and hence the greater the temptation to
collude.
15.3 Other Oligopoly Models
1. What explains the kink in the kinked demand curve?
The kink is produced by the greater tendency of com-
petitors to follow price reductions than price
increases. If a price increase is not met by rivals, a
competitor would lose a substantial number of sales
to rivals, resulting in a relatively elastic demand for
price increases. If, on the other hand, a price decrease
is met by rivals, a competitor would not be able to
take a substantial number of sales from rivals, result-
ing in a more inelastic demand curve for price
decreases.
2. What impact does easy entry have on the profitability
of oligopolies?
Economic profits in oligopolistic industries will attract
entrants, if entry is easy. Entrants may break down
existing price agreements by cutting prices in an
attempt to establish themselves in the industry, forcing
95469_15_Ch15_p387-412.qxd 29/12/06 12:54 PM Page 404

C H A P T E R 1 5
Oligopoly and Strategic Behavior
405
existing firms to reduce their prices and suffer reduced
market shares and thus undermining the profitability
of the oligopoly.
3. Why are barriers to entry necessary for successful,
ongoing collusion?
Because easy entry erodes economic profits where
they are positive, barriers to entry are necessary for
oligopolists to continue to earn economic profits in
the long run.
4. Why might oligopolists charge less than their short-
run profit-maximizing price when threatened by entry?
When entry threatens to undermine the economic
profits of an oligopolistic industry, firms in the indus-
try may lower their prices below the level that would
maximize their short-run profits in order to deter
entry by making it less profitable.
5. A group of colluding oligopolists incurs costs of $10
per unit, and their profit-maximizing price is $15. If
they know that potential market entrants could pro-
duce at a cost of $12 per unit, what price are the col-
luders likely to charge?
If the colluding oligopolists are afraid of attracting
entrants who will expand market output and reduce
market prices and the colluders’ profits, they might
price below their short-run profit-maximizing price in
order to make it unprofitable for new entrants. In this
case, colluding oligopolists might well charge $12 or
just below rather than the $15 they would otherwise
charge.
6. Why is price leadership also called tacit collusion?
Price leadership, where one (typically dominant) firm
signals how it intends to change its price and other
firms follow suit, does not involve explicit agreements
to restrict output and raise price. However, it can
potentially be used to coordinate firms’ behavior to
achieve the same ends.
15.4 Game Theory and Strategic Behavior
1. How is noncollusive oligopoly like a military cam-
paign or a poker game?
Noncollusive oligopoly is like a military campaign, a
poker game, or other strategic games in that firms
take certain actions, not because they are necessarily
advantageous in themselves, but because they improve
the position of the oligopolist relative to its competi-
tors, with the intent of improving its ultimate posi-
tion. Firm actions take into account the likely
countermoves rivals will make in response to those
actions.
2. What is the difference between cooperative and non-
cooperative games?
Noncooperative games are those where actions are
taken independently, without consulting others; coop-
erative games are those where players can communi-
cate and agree to binding contracts with each other.
3. How does the prisoners’ dilemma illustrate a domi-
nant strategy for noncolluding oligopolists?
The prisoners’ dilemma illustrates a dominant strategy
for noncolluding oligopolists because it is in each
player’s interest to make the same choice regardless of
the choice of the other player. Where a strategy is
optimal regardless of opponents’ actions, that strategy
will dominate (be chosen over) others.
4. What is a Nash equilibrium?
A Nash equilibrium is one where each firm is doing as
well as it can, given the actions of its competitors. It
is self-enforcing because once it is established, there is
no incentive for any firm to change its policies or its
actions.
5. In the prisoners’ dilemma, if each prisoner believed
that the other prisoner would deny the crime, would
each choose to deny the crime?
The prisoners’ dilemma illustrates a dominant
strategy in which it is in the interest of each of the
two prisoners to confess, regardless of whether the
other prisoner confesses—Prisoner A gets a lighter
sentence if he confesses (2 years) than if he does
not (6 years) if Prisoner B confesses, but he also
gets a lighter sentence if he confesses (6 months)
than if he does not (1 year) when Prisoner B does
not confess; and the same is true for Prisoner B.
The result is that, given the payoff matrix, each
prisoner will confess regardless of what he expects
the other prisoner will do.
95469_15_Ch15_p387-412.qxd 29/12/06 12:54 PM Page 405

95469_15_Ch15_p387-412.qxd 29/12/06 12:54 PM Page 406

True or False
1. Under oligopoly, individual firms produce only an infinitesimal share of total output.
2. The auto industry is an example of oligopoly.
3. Under oligopoly, as in perfect competition and monopolistic competition, firms cannot earn economic profits in
the long run.
4. When firms in an oligopolistic industry collude, in the long run they fail to maximize social welfare.
5. When firms collude to set prices, their individual demand curves become relatively more elastic.
6. Although they are difficult to establish, most collusive oligopolies last indefinitely.
7. The new diamond industry in northern Canada will not threaten the economic profits earned by members of the
international diamond cartel.
8. By the year 2050 the moon travel business consists of three international firms that create the International Moon
Cartel, which restricts output and raises prices. Because this industry is an oligopoly, the existing firms’ economic
profits will be guaranteed for the long run.
9. Collusion tends to be quite durable in oligopoly markets.
10. In the kinked demand curve model, other firms are assumed to match price reductions because price reductions take
business away from rivals, forcing them to cut price to protect their sales.
11. In the kinked demand curve model, an oligopoly firm’s marginal revenue is discontinuous (has a gap in it).
12. The kinked demand curve model illustrates how costs can change for some oligopolists without leading to a change
in price, even without collusion.
13. Oligopolists are less likely to experience price rigidity when they have excess capacity than when they are near
full capacity.
14. Firms always cooperate in repeated games.
15. All network externalities act to increase consumer demands for products.
16. The area of communications often exhibits positive network externalities.
17. The bandwagon effect can apply to the “hot” toy during the Christmas shopping season.
18. Whether a good is subject to positive or negative network externalities from congestion can depend on a consumer’s
preferences.
19. Switching costs can be a significant barrier to new entrants in an industry.
20. When significant positive network effects are present, oligopoly is a common market structure.
Multiple Choice
1. Which of the following is not a characteristic of oligopoly?
a. A few firms control most of the production and sale of a product.
b. Firms in the industry make price and output decisions with an eye to the decisions and policies of other firms in
the industry.
c. Competing firms can enter the industry easily.
d. Substantial economies of scale are present in production.
2. Under oligopoly, a few large firms control most of the production and sale of a product because
a. economies of scale make it difficult for small firms to compete.
b. diseconomies of scale make it difficult for small firms to compete.
C
H A P T E R
1 5
S T U D Y
G U I D E
407
95469_15_Ch15_p387-412.qxd 29/12/06 12:54 PM Page 407
c
average total costs rise as production expands.
d. marginal costs rise as production expands.
3. In an oligopoly such as the U.S. domestic airline industry, a firm such as United Airlines would
a. carefully anticipate Delta, American, and Southwest’s likely responses before it raised or lowered fares.
b. pretty much disregard Delta, American, and Southwest’s likely responses when raising or lowering fares.
c. charge the lowest fare possible in order to maximize market share.
d. schedule as many flights to as many cities as possible without regard to what competitors do.
4. One of the reasons that collusive oligopolies are usually short lived is that
a. they are unable to earn economic profits in the long run.
b. they do not set prices where marginal cost equals marginal revenue.
c. they set prices below long-run average total costs.
d. parties to the collusion often cheat on one another.
5. In a collusive oligopoly, joint profits are maximized when a price is set based on
a. its own demand and cost schedules.
b. the market demand for the product and the summation of marginal costs of the various firms.
c. the price followers’ demand schedules and the price leader’s marginal costs.
d. the price leader’s demand schedule and the price followers’ marginal costs.
6. During the 1950s, many profitable manufacturing industries in the United States, such as steel, tires, and autos, were
considered oligopolies. Why do you think such firms work hard to keep imports from other countries out of the U.S.
market?
a. Without import barriers, excess profits in the United States would attract foreign firms, break down existing price
agreements, and reduce profits of U.S. firms.
b. Without import barriers, foreign firms would be attracted to the United States and cause the cost in the industry
to rise.
c. Without import barriers, foreign firms would buy U.S. goods and resell them in the United States, causing profits
to fall.
d. Without import barriers, prices of goods would rise, so consumers would buy less of the products of these
firms.
7. Over the past 20 years, Dominator, Inc., a large firm in an oligopolistic industry, has changed prices a number of times.
Each time it does so, the other firms in the industry follow suit. Dominator, Inc., is a
a. monopoly.
b. perfect competitor.
c. price leader.
d. price follower.
8. In the kinked demand curve model, starting from the initial price, the demand curve assumed to face a firm is rela-
tively _________________ for price increases and relatively _________________ for price decreases.
a. elastic; elastic
b. elastic; inelastic
c. inelastic; elastic
d. inelastic; inelastic
9. The kinked demand curve model illustrates
a. how price rigidity could characterize some oligopoly firms, despite changing marginal costs.
b. how price increases and price decreases can elicit different responses from rival firms, in oligopoly.
c. why price rigidity may be more common when firms have excess capacity than when operating near capacity.
d. the importance of expectations about rival behavior in oligopoly.
e. all of the above.
408
95469_15_Ch15_p387-412.qxd 29/12/06 12:54 PM Page 408

10. Which of the following areas illustrates positive network externalities?
a. telephones
b. software
c. fax machines
d. the Internet
e. all of the above
Problems
1. Which of the following markets are oligopolistic?
a. corn
b. funeral services
c. airline travel
d. hamburgers
e. oil
f.
breakfast cereals
2. Which of the following are characteristic of oligopolistic industries?
a. a large number of firms
b. few firms
c. a high degree of product differentiation
d. high barriers to entry
e. free entry and exit
f.
mutual interdependence
3. Suppose Farmer Smith from Kansas and Farmer Jones from Missouri agree to restrict their combined output
of wheat in an attempt to increase the price and profits. How likely do you think the Smith–Jones cartel is to
succeed? Explain.
4. Explain how the joint profit-maximizing price of colluding firms under oligopoly is determined? How about
output?
5. Explain how the long-run equilibrium under oligopoly differs from that of perfect competition.
6. Two firms compete in the breakfast cereal industry producing Rice Krinkles and Wheat Krinkles cereal, respec-
tively. Each manufacturer must decide whether to promote its product with a large or small advertising budget.
The potential profits for these firms are as follows (in millions of dollars):
Describe the nature of the mutual interdependence between the two firms. Is a Nash equilibrium evident?
Small
Advertising
Budget
Small
Advertising
Budget
Large
Advertising
Budget
Firm A
Wheat Krinkles Cereal
Firm B Rice Krinkles Cereal
Large
Advertising
Budget
Firm (A)
$50 M
Firm (A)
$140 M
Firm (B)
$20 M
Firm (B)
$50 M
Firm (A)
$30 M
Firm (A)
$150 M
Firm (B)
$150 M
Firm (B)
$100 M
409
95469_15_Ch15_p387-412.qxd 29/12/06 12:55 PM Page 409

7. Suppose Pepsi is considering an ad campaign aimed at rival Coca-Cola. What is the dominant strategy if the payoff
matrix is similar to the one shown in Exhibit 3 in Section 15.4?
8. Suppose your professor announces that each student in your large lecture class who receives the highest score
(no matter how high) on the take-home final exam will get an A in the course. The professor points out that if
the entire class colludes successfully everyone could get the same score. Is it likely that everyone in the class
will get an A?
9. Important differences exist between perfect competition and oligopoly. Show your understanding of these differences
by listing the following terms under either “perfect competition” or “oligopoly.”
Perfect Competition
Oligopoly
allocative efficiency
large economies of scale
–––––––––––––––––––
–––––––––––––––––––
many small firms
productive efficiency
–––––––––––––––––––
–––––––––––––––––––
high barriers to entry
horizontal demand curve
–––––––––––––––––––
–––––––––––––––––––
few large firms
mutual interdependence
–––––––––––––––––––
–––––––––––––––––––
downward-sloping
no control over price
demand curve
–––––––––––––––––––
–––––––––––––––––––
10. One of the world’s most successful cartels has been the Central Selling Organization (CSO), which controls about
three-quarters of the world’s diamonds. This collusive oligopoly has kept diamond prices high by restricting
supply. The CSO has also promoted the general consumption of diamonds through advertising and marketing.
New supplies of diamonds have been found in Canada and Russia. These new mines, which are outside
the direct control of the CSO, want to sell their diamonds on the open market.
a. What would you predict will happen in the market for diamonds if these new mines do not cooperate with
the cartel?
b. What do you think will happen to CSO diamond advertising?
11. The U.S. Justice Department has been worried that the nation’s four largest air carriers—Delta, Northwest, American,
and United—use low prices to limit competition at the busiest airports. Predatory pricing exists when the dominant
carrier at an airport matches the low prices of any new low-fare competitor and sells more low-fare seats. The major
carrier holds these low prices until the new competition folds. The dominant carrier recovers any short-term losses
with increased fares once the competition is eliminated.
The government thinks that this pricing response is an anticompetitive strategy. The dominant carriers claim that
this response is simply a part of competition. Which is it? How would each of the following pieces of information
affect your decision as to whether it is an anticompetitive strategy or a competitive response? Check the appropriate
column.
Anticompetitive
Competitive
Strategy
Response
Large, unrecoverable start-up costs for new airlines.
________
________
Many airlines serve the airport.
________
________
Dominant airline drops price below average variable cost.
________
________
Dominant airline flights have excess capacity
before the new airline enters the market.
________
________
The following payoff matrix shows the possible sentences that two suspects, who are arrested on suspicion of car theft,
could receive. The suspects are interrogated separately and are unable to communicate with one another.
410
95469_15_Ch15_p387-412.qxd 29/12/06 12:55 PM Page 410
Use the following information to answer the question below.
12. For the information given in the payoff matrix above:
a. If there is a dominant strategy?
b. What is the dominant strategy? How do you know?
c. Is there a Nash equilibrium? How do you know?
Suspect 2
Confess
Confess
Suspect 1
Don’t
Confess
Don’t Confess
1
6 years
1
1 year
1
2 years
2
2 years
2
10 years
1
10 years
2
1 year
2
6 years
411
95469_15_Ch15_p387-412.qxd 29/12/06 12:56 PM Page 411

95469_15_Ch15_p387-412.qxd 29/12/06 12:56 PM Page 412
Wyszukiwarka
Podobne podstrony:
Exploring Economics 4e Chapter 09
Exploring Economics 4e Chapter 18
Exploring Economics 4e Chapter 30
Exploring Economics 4e Chapter 07
Exploring Economics 4e Chapter 11
Exploring Economics 4e Chapter 22
Exploring Economics 4e Chapter 17
Exploring Economics 4e Chapter 13
Exploring Economics 4e Chapter 10
Exploring Economics 3e Chapter 15
Exploring Economics 4e Chapter 14
Exploring Economics 4e Chapter 27
Exploring Economics 4e Chapter 25
Exploring Economics 4e Chapter 29
Exploring Economics 4e Chapter 23
Exploring Economics 4e Chapter 31
Exploring Economics 4e Chapter 26
Exploring Economics 4e Chapter 24
Exploring Economics 4e Chapter 32
więcej podobnych podstron