
Distributed Worm Simulation with a Realistic Internet Model
Songjie Wei, Jelena Mirkovic, Martin Swany
Computer & Information Sciences
University of Delaware
Newark, DE 19716
(weis, sunshine, swany@cis.udel.edu)
Abstract
Internet worm spread is a phenomenon involving millions
of hosts, who interact in complex and diverse environment.
Scanning speed of each infected host depends on its
resources and the defenses at work in its network.
Aggressive worms further interact with the underlying
Internet topology
− the dynamics of the spread is
constrained by the limited bandwidth of network links,
and high-volume scan traffic leads to BGP router failure
thus affecting global routing. Worm traffic also interacts
with legitimate background traffic competing for (and
often winning) the limited bandwidth resources. To
faithfully simulate worm spread and other Internet-wide
events such as DDoS, flash crowds and spam we need a
detailed Internet model, a packet-level simulation of
relevant event features, and a realistic model of
background traffic on the whole Internet. The memory and
CPU requirements of such simulation exceed a single
machine’s resources, creating a need for distributed
simulation. We propose a design and present
implementation of a distributed worm simulator, called
PAWS. PAWS runs on Emulab testbed, which facilitates
its use by other researchers. We validate PAWS in a
variety of scenarios, and evaluate costs and benefits of
distributed worm simulation.
1. Introduction
First step in designing early detection and response
techniques for Internet worms must be the understanding
of this threat. We need high-fidelity simulators that
faithfully replicate each worm copy’s behavior and
reproduce all the elements interacting with the spreading
worm. A simulator’s fidelity has to be three-fold:
(1) Internet-level fidelity. Worm spread dynamics depend
on the underlying Internet fabric such as Autonomous
System (AS) and router topology, link bandwidth and
routing table information. Worms also affect global
Internet by causing router failure under heavy scan
traffic and thus introducing routing changes.
(2) Packet-level fidelity. Worm spread is affected by the
host diversity (infected hosts will spread the worm
with different speed based on their hardware and OS
specifics), network diversity (networks will have
different ratios of live and vulnerable hosts), scanning
techniques and presence of worm defenses. To
capture all these effects we must simulate worm
spread at the packet level.
(3) Background-traffic fidelity. Both the worm traffic and
the worm defenses interfere with legitimate
background traffic. We need to simulate realistic
background traffic to gauge the damage of the worm
spread, and evaluate the benefit and collateral damage
of any proposed defense. Recent work on measuring
the available bandwidth of inter-AS links [8] offers
starting data for estimating legitimate traffic load on
those links, and simulating legitimate traffic at an
aggregate level. It is currently unclear if packet-level
simulation of background traffic is necessary for
accurate worm spread simulation, but it may be
needed for detailed evaluation of worm defenses.
Some substantial work will be needed to develop
background traffic’s connection-level models which
are representative of Internet traffic patterns, and
incorporate them in packet-level worm simulators.
Mathematical models of worm propagation [14, 15, 17]
are built upon epidemiological equations that describe
spread of real-world diseases. These models offer valuable
insight into the infection dynamics and can be simulated
efficiently, but they cannot capture effects of different
scanning and infection techniques, and the interactions of
the worm with the Internet topology, protocols, and
security mechanisms. Mathematical models that are easily
applicable to random scanning techniques require
considerable work and multiple approximations to be
extended to sophisticated scanning techniques, such as
subnet scanning [18].
Single-node worm spread simulators [10, 11, 12, 13]
require a set of simplifications and approximations, to be
able to run at a reasonable speed on a single machine.
They ignore or simplify the specifics of the Internet
topology, congestion created by the worm spread, and the
diversity of network fabric. These simplifications are
necessary to reduce simulation’s memory requirements
and accommodate them at a single-machine. Further,
packet-level simulation of worm scans requires a large
number of CPU cycles, making simulation length
prohibitive. Current single-machine worm simulators
avoid packet-level simulation of worm scans, instead
simulating most or all worm scans at a fluid-level using
mathematical models of the worm spread.
Some notable success was achieved with distributed worm
simulation [9]. Using PDNS (a distributed version of NS-2
simulator) and GTNetS, Perumalla et al. simulated worm
propagation among 1.28 million vulnerable nodes at a
dedicated 128-CPU cluster. In another paper on
distributed simulation of Internet events [26] the authors
note that PDNS and GTNetS can simulate about 95K
packet transmissions per wall-clock second (PTS) at a
single machine and 5.5M packet transmissions on a
dedicated 136-CPU cluster. This is an excellent result,
given that both PDNS and GTNetS simulate connection-
level behavior such as TCP 3-way handshake and
congestion control mechanism, and thus must keep and
update connection state for each packet transmission.
We note two main problems with the approach used in [9]
for worm spread simulation:
(1) To achieve reasonable simulation speed (5.5M PTS)
one needs a powerful 100+ node cluster. Not every
researcher has access to such a cluster, yet many
researchers work in the worm detection and response
field and need a high-fidelity worm simulator that can
run in reasonable time on multiple common PCs to
validate their ideas.
(2) Packet-level simulation in [9] generates a network
message for each packet sent to a different simulation
node which incurs huge overhead when simulating
worm scans. Instead, these transmissions can be
aggregated and sent in a single network message at
the end of a simulated time unit.
We further note that work in [9] does not replicate a
realistic Internet topology or background traffic and thus
cannot faithfully evaluate congestion effects caused by the
spreading worm.
In this paper we present a design and implementation of a
distributed worm simulator called PAWS. Our simulator
runs on multiple common PCs that synchronize over a
TCP/IP network. We replicate a realistic Internet topology
at the Autonomous System level, and the background
traffic at the aggregate, inter-AS link level. Link
bandwidth and background traffic values are inferred
using Pathneck [8] measurements of Internet bottlenecks
as a starting point for estimation. PAWS is implemented
in the Emulab testbed [1] which facilitates its use by other
researchers, and is extensible to support different scanning
techniques and host and network diversity.
PAWS is a dedicated worm spread simulator - it simplifies
certain worm spread behavior to achieve higher simulation
speed. Worm scans are simulated as single packet
transmissions, without connection-level semantics. While
this is a correct model for UDP worms, TCP worms need
several packet transmissions for successful infection and
will perform TCP SYN retransmissions in case of dropped
scans. We believe that TCP connection establishment and
payload transmission only influence the speed of worm
scan generation in case of successful and unsuccessful
infection. These features can be modeled by setting two
per-host parameters and avoiding TCP stack simulation
for each scan. TCP SYN retransmissions will increase a
number of scans in the Internet but should not increase
congestion effects due to very small size of TCP SYN
packets (20 Bytes). PAWS currently does not replicate
TCP SYN retransmission behavior but will be extended to
do so as a part of our future work. PAWS further deploys
time-discrete packet-level simulation
− worm scans that
need to be transmitted from one simulation node to
another over the network, during one time unit, are
grouped together and sent in a single network message.
This minimizes network traffic and overhead of network
communication, while having a very small effect on
fidelity. PAWS replicates AS level Internet topology using
Routeviews data [3] and simulates background traffic at
an aggregate, inter-AS link level. Routing path of each
worm scan through ASes is replicated and bandwidth
consumption on inter-AS links is simulated to capture
congestion effects.
PAWS can currently simulate propagation of a random
scanning worm in a 10M vulnerable population using 8
Emulab machines and achieving 4.7M packet
transmissions per wall-clock second. Note that PAWS
simulates 8 times more vulnerable nodes than work
presented in [9], with comparable performance, using 8
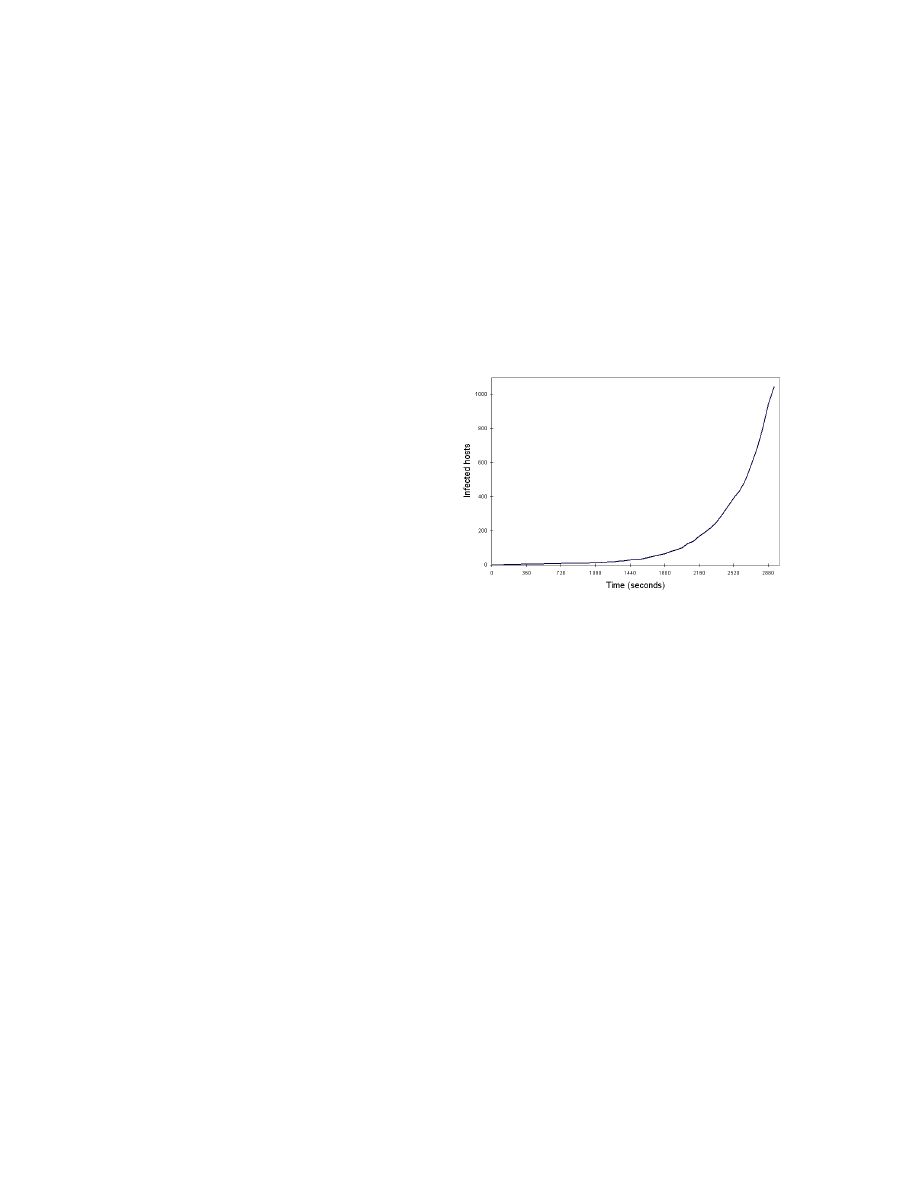
common PCs. PAWS simulation of Code Red v2-like
worm propagating with a 10M vulnerable population is
shown in Figure 1.
Figure 1: Code Red v2 worm propagating in 10M
vulnerable population
2. Related Work
The closest work to PAWS is described in [9], and the
differences between PAWS and [9] are given in the
introduction. We here briefly survey other work on worm
simulation and modeling.
Worm models: Staniford et al. [14] use SIR
epidemiological model of worm spread to evaluate
effectiveness of various worm scanning techniques. Zou et
al. [15] present a “two-factor'' model that extends SIR
epidemiological model to capture the effects of human
countermeasures and the congestion due to the worm
spread. Shen et al. [16] provide a discrete-time worm
model that considers patching and cleaning effect and can
model worms with local scanning techniques. All these
approaches abstract specifics of the Internet topology,
change in the size of vulnerable population as the worm
spreads, and the effect of the individual host and network
defenses (except for patching, in case of [16]) on the
spread.
Single-machine simulation with AS-level topology: Savage
et al. [13] model Internet topology at the AS level, along
with epidemiological worm spread model, to measure the
effectiveness of different containment strategies and
deployment patterns. Wagner et al. [12] model delay and
bandwidth differences between vulnerable hosts by

dividing all Internet hosts into four groups, then modeling
interactions between and within groups. This approach
achieves better Internet-level fidelity than prior simulators
but the division of hosts into four same-bandwidth same-
latency groups heavily approximates the underlying
Internet topology. The simulation cannot model individual
host or network actions, congestion at routers and the scan
traffic received by a given host or a network. Liljenstam et
al. [10, 11] describe an add-on worm propagation model
for SSFNet simulator. This model adds simulation of
countermeasures at router level to the simple
epidemiological model, and simulates those actions
assuming a single router per AS. A realistic AS topology
from Route Views project [3] is used in a scaled-down
form, due to single-machine memory constraints. Worm
scans are simulated using hybrid packet/fluid level
simulation. Riley et al. [25] developed a packet-level
worm simulator GTNetS that captures connection-level
semantics of TCP worm propagation, and can simulate
worms with different payload size, infection delay,
scanning rate, number of parallel scanning threads, etc.
GTNetS captures congestion effects due to worm spread
but uses a simple Internet topology replicating only the
bandwidth of first-hop links that connect to “the core”.
[25] experiments do not model background traffic, and
cannot simulate more than several thousands of vulnerable
hosts.
3. PAWS Design
We next explain various models deployed in PAWS.
3.1. Internet Topology and Routing Model
Worm spread features depend heavily on the underlying
Internet characteristics such as connectivity, topology,
bandwidth, link utilization, etc. It is necessary to faithfully
model the Internet to achieve high-fidelity worm spread
simulation. On the other hand, because of the Internet’s
heterogeneity and rapid change [2], there will be a limit on
the number and level of Internet details we can replicate in
a simulation.
PAWS currently models the Internet on the Autonomous
System (AS) level. We obtain global connectivity data
from Route Views[3] project, which provides BGP table
snapshots of a small number of participating ASes.
AS_PATH information from these snapshots can be used
to infer peering relationships between ASes and the
ownership of IP addresses and build an AS-connectivity
map. We note here that this map is the subset of the real
AS topology as some peering relationships will not be
reflected in Route Views data if neither of the peers
participates in Route Views.
To faithfully model Internet routing, one could attempt to
discover and then simulate all the routers in the Internet,
loading the corresponding routing tables obtained from the
real routers into the simulation. This approach is not
reasonable, because (i) it is impossible to discover router-
level topology of the whole Internet
1
, (ii) very few routing
tables are publicly accessible and (iii) routing table
information changes dynamically. PAWS currently
applies the Dijkstra’s algorithm on the AS map to compute
the shortest routing paths between ASes, assuming the
constant cost per AS hop. In the future work we plan to
improve this model by (i) using the available BGP data
from Route Views to partially populate BGP tables, and (ii)
inferring the remaining routing information by using AS
customer-provider-peer relationships and rules for sharing
BGP information as described in [22, 23].
To take the most advantage of parallel simulation, nodes
have to evenly divide the processing and communication
load. For simple worm spread scenarios that include
uniform distribution of vulnerable hosts and defenses, a
node’s processing load depends on the size of IP address
space assigned to it. We develop a heuristic to split IP
address space evenly among simulation nodes, which
results in uneven distribution of ASes among nodes due to
high variance of AS IP size.
PAWS models hop-by-hop Internet routing to account for
inter-AS bandwidth consumption. A scan sent from an
infectious to a susceptible host traverses all the
intermediate ASes. To minimize a node’s network
communication load our heuristic assigns neighboring
ASes to the same simulation node, up to a node’s IP size
limit. This means that most of the ASes assigned to a
simulation node form a connected graph, which minimizes
the number of network messages generated by scans.
Grouping all worm scans sent from one simulation node to
another within a time unit in a single network message
further reduces communication cost.
We distribute routing information across simulation nodes;
each node only stores routing tables of the ASes it
simulates. When a worm scan is generated, the simulation
node determines the destination AS for the given IP
address using shared data which maps IP ranges to ASes.
The node then uses its view of routing tables to calculate
the path to the destination AS and the bandwidth
consumption on this path. Scans to invulnerable hosts will
increase bandwidth consumption but will be dropped at
source simulation node. Successful scans will be either be
delivered to another simulation node via a network
message (if the AS path traverses more than one
simulation node) or will generate a function call on the
same simulation node.
Worm spread events produce huge volume of probes,
which frequently lead to serious network congestion. To
simulate this phenomenon, we need to model the limited
bandwidth of each inter-AS link in our map. We also
should take into account the portion of this bandwidth
consumed by legitimate user traffic and the interaction of
1
There are some published router-level topologies of large ASes
[21] and there are several Internet mapping efforts [5, 20].
Authors of [24] build a detailed router-level map of US
backbone ISPs along with inferred bandwidth and delay
information. However, a large portion of the Internet is still not
mapped.

this traffic with the worm traffic. There is currently no
available data on AS-to-AS link bandwidth and there is
scarce data on bandwidth utilization provided by Pathneck
[8] project for a small number of inter-AS links.
Following a philosophy that large ASes will have bigger
links than small ASes, and that AS size is proportional to
its connection degree, we classify ASes into three
categories by their connection degree, and then attempt to
infer link bandwidth values for each category using
bottleneck information obtained by Pathneck project as a
starting point. Some ASes, like AS 1 and AS 701, have
thousands of peers and contain huge portions of the IP
address space. These ASes are part of the Internet
backbone and they likely have high-bandwidth links to
other large ASes, to route high-volume transit traffic. On
the other end of the AS connectivity chart, ASes like
14364 and 14369 have a single connection to a better-
connected AS. These ASes are stub networks whose links
only carry their customers’ traffic and thus have small
bandwidth.
According to the discussion in [4, 6], there is a power-law
distribution pattern on AS vertex degree. We first classify
the ASes into three categories based on the connection
degree: small ASes with less than 3 peers, medium ASes
with 4–300 peers, and large ASes with more than 300
peers. We next determine likely bandwidth values for
links between any two AS categories. Since we have three
different categories of ASes, there are six link categories
and thus six bandwidth values used in PAWS Internet
model.
We use the data from Pathneck [8] project to aid our
choice of bandwidth values. Pathneck project provides
measurements of an upper bound on the available
bandwidth on bottleneck links between ASes. This bound
is measured by sending a train of packets on a path, and
measuring packet interarrival times at routers along the
path. The measurements provide only an instantaneous
sample of the upper bound of the available bandwidth.
The real available bandwidth fluctuates as traffic patterns
change, and so does the upper bound. Pathneck tool can
further provide an accurate available bandwidth
measurement only for links preceding a bottleneck, as
only those links can be filled with measurement traffic.
After the packet train passes through a bottleneck, it is
slowed down and only partially fills the remaining links.
Pathneck provides a lower bound on the available
bandwidth for links following the bottleneck link. Note
that some links will have no records in Pathneck data as
they have not been traversed by a measurement train,
while other links may have multiple records since they
have been traversed by multiple measurement trains.
We divide Pathneck-supplied data into 6 bins, based on
the category of the ASes on a link’s endpoints. We further
select the maximum value x from a bin, and choose a
bandwidth limit y, where y is the smallest value from the
list of possible link bandwidths (OC1, OC3, etc), that
satisfies y≥ x requirement. Table 1 shows the chosen
bandwidth values for different link categories:
Category BW1
(Mbps)
Type1 BW2
(Mbps)
Type2 BW3
(Mbps)
Type3
1-1 155.52 OC3 32.064
J3 100.00
Fast
Ethernet
1-2,
2-1 622.08 OC12 34.368
E3 155.52 OC3
1-3,
3-1 622.08 OC12 34.368
E3 466.56 OC9
2-2 1866.24 OC36 89.472 DS3-C 466.56
OC9
2-3, 3-2 1866.24
OC36
89.472
DS3-C
622.08
OC12
3-3 9953.28 OC192 9953.28 OC192 9953.28 OC192
Table 1: Selected bandwidth values for inter-AS links
In this paper we have examined two approaches to
modeling the background traffic on inter-AS links, starting
from the information provided by Pathneck data. The first
approach averages the available bandwidth samples for a
given AS-to-AS link, calculating value x
i
. We then assume
that the legitimate user traffic occupies the remaining
bandwidth on this link: z
i
= y – x
i
, where y is our
bandwidth limit estimate for this link’s category. The
second approach models the legitimate traffic amount on a
link as an exponentially distributed random variable,
whose parameters are obtained from the bins for a given
link’s category. We chose an exponential model since bin
samples appear to be heavy tailed, following an
exponential-like distribution.
3.2. Congestion Model
With the above Internet model, we simulate the bandwidth
saturation and traffic congestion, which occur at
aggressive worm propagation. If y
j
is bandwidth of a link j,
z
j
is the legitimate traffic on this link, and w
j
is the worm
scan traffic on this link, then for each individual worm
packet: (i) if y
j
≥ z
j
+w
j
the worm packet can pass through
the link, and if y
j
< z
j
+w
j
the worm packet passes through
the link with probability of y
j
/(z
j
+w
j
). A worm packet
reaches the destination if and only if it is not dropped on
any link along the routing path between two ASes.
3.3. Vulnerable Host Model
Each AS “owns” a set of IP ranges and each IP from
these ranges may correspond to a physical host. PAWS
uses per-AS ratio of “live” hosts, and generates a data
structure to store both the basic information and the run-
time status of each live host. This information specifies
host features that may affect worm propagation, such as
the type of OS and applications running on this host,
how much resources it has (CPU speed, memory,
bandwidth), whether this host has vulnerabilities that
may be attacked by the worm, etc. The run-time status
of a host includes its status (vulnerable, infected,
patched, etc.) how many times it has been scanned and
if infected, how many scans it has sent out and how
many new hosts it has infected.

3.4. Worm Model
PAWS builds a worm description file for each specific
worm, containing the following customizable parameters:
(1) vulnerable ratio, (2) scanning rate, (3) infection delay
which defines time between receipt of a worm probe by a
vulnerable host, and the first scan sent from this host, (4)
worm scan size and (5) scanning strategy. PAWS
currently implements random and subnet scanning, but
due to its modular design it can be easily extended with
new scanning strategies.
3.5. Worm Scan Model
The simulation of worm spread on PAWS is a time-
discrete procedure. Every time unit, each infected host
produces a list of target IP addresses to scan. The target
addresses are generated based on both the scanning
strategy of that specific worm and the features (hardware,
network connection, bandwidth) of the infected hosts.
Each worm scan is time-stamped and buffered as an event.
At the end of a time unit, those events are carried out
together. To enhance simulation performance, scans to
invulnerable IP addresses are sent to other simulation
nodes individually, but their effects (the used bandwidth
and the possible congestion caused) are simulated and the
congestion information is exchanged between simulation
nodes.
4. PAWS Implementation
Emulab testbed [1] at the University of Utah provides
publicly available resources for real-machine testing,
simulation and emulation. Emulab real-machine testbed
features 212 PCs that can be interconnected and
configured using a user-friendly, web-based interface
and ns-compatible scripts or Java GUI. We chose to
implement PAWS on Emulab testbed [1] to make it
easily accessible to other researchers. While simulation
code will run on any machine with a C compiler, our
scripts are specifically tailored to Emulab environment.
Emulab PCs come in different CPU speeds. To
maximize the simulation speed we use only PCs with
850MHz CPU (pc850). The hardware and software
information of pc850 machine is shown in Table 2. One
machine is a master node that synchronizes the
simulation and the remaining machines are slaves that
carry out the simulation. All the nodes are connected on
a 100M LAN. Both the latency and the loss rate of this
LAN are set to zero.
Type:
pc850
Processor:
PIII
Speed:
850 MHZ
RAM:
256 MB
Disk Size:
39.00 GB
OS:
RHL-STD
Table 2: Emulab node hardware specification
4.1. Inter-Node Communication
In Emulab PAWS implementation, simulation nodes
communicate and exchange data in two ways. First
communication method is via a shared project directory
which is NFS-mounted. This provides easy means of
sharing data needed by all the slave nodes. This data is
stored in the following files:
• Per-AS information file containing per-AS IP range list
• Inter-AS routing file containing inter-AS routing paths.
• Worm description file containing the information
described in worm model section.
• Vulnerable host list file containing IPs of all the
vulnerable hosts simulated on a specific simulation node.
• PAWS configuration file containing all the other
simulation-related information, such as a number of
simulation nodes, their names, distribution of the AS
map and simulation tasks among the nodes, etc..
Another method for inter-node communication in PAWS
is through stream sockets. During the initialization stage,
each node sets up a stream socket and connects to all other
simulation nodes. During the simulation, TCP packets are
used for worm scan propagation and status reports
exchange among the nodes.
4.2. Dynamic Update Interval (Time Unit Scaling)
A significant portion of the simulation time is used for
inter-node communication, mostly for worm scan
propagation and for the broadcasting IPs of newly infected
hosts. An obvious design approach is that at the end of
each time unit, all the simulator nodes communicate and
synchronize with each other, so that they reach a
consistent view of the simulated network. However, some
time units will contain very few events of interest (for
instance in the early stage of the worm spread, or when the
worm reaches saturation) and do not warrant heavy
message exchange. PAWS optimizes network
communication by exchanging inter-node messages at
specific intervals whose size is a multiple of simulation
time units and is dynamically adjusted using time-unit
scaling, according to the formula
⎥⎥
⎤
⎢⎢
⎡
⋅
=
m
c
N
i
where i is the new value of update interval, N is size of the
vulnerable population, m is the number of newly infected
hosts in the previous time unit, and c is a constant. For
example, if c equals to 1000, and during the last time unit,
0.01% of the vulnerable population became infected, next
update interval will occur after 10 time units.
5. Experiments
To validate correctness of PAWS, we simulate two well-
known worm spread events: Code Red v2 (July 19
th
, 2001)
[27] and SQL Slammer (January 25
th
, 2003) [7].
5.1. Simulation of CodeRed v2
During the outbreak of CodeRed v2 worm, more that
359,000 infected hosts were observed by CAIDA [8]. In
our simulation, we set the Code Red vulnerable population
N=360,000. Each infected host tries to infect a different
list of randomly generated IP addresses at an observed
peak rate of roughly 6 probes per second. Initially there
are 2 infected hosts at time 0. We reproduce AS-level map
from July 19
th
, 2001, 10am UTC in this simulation.
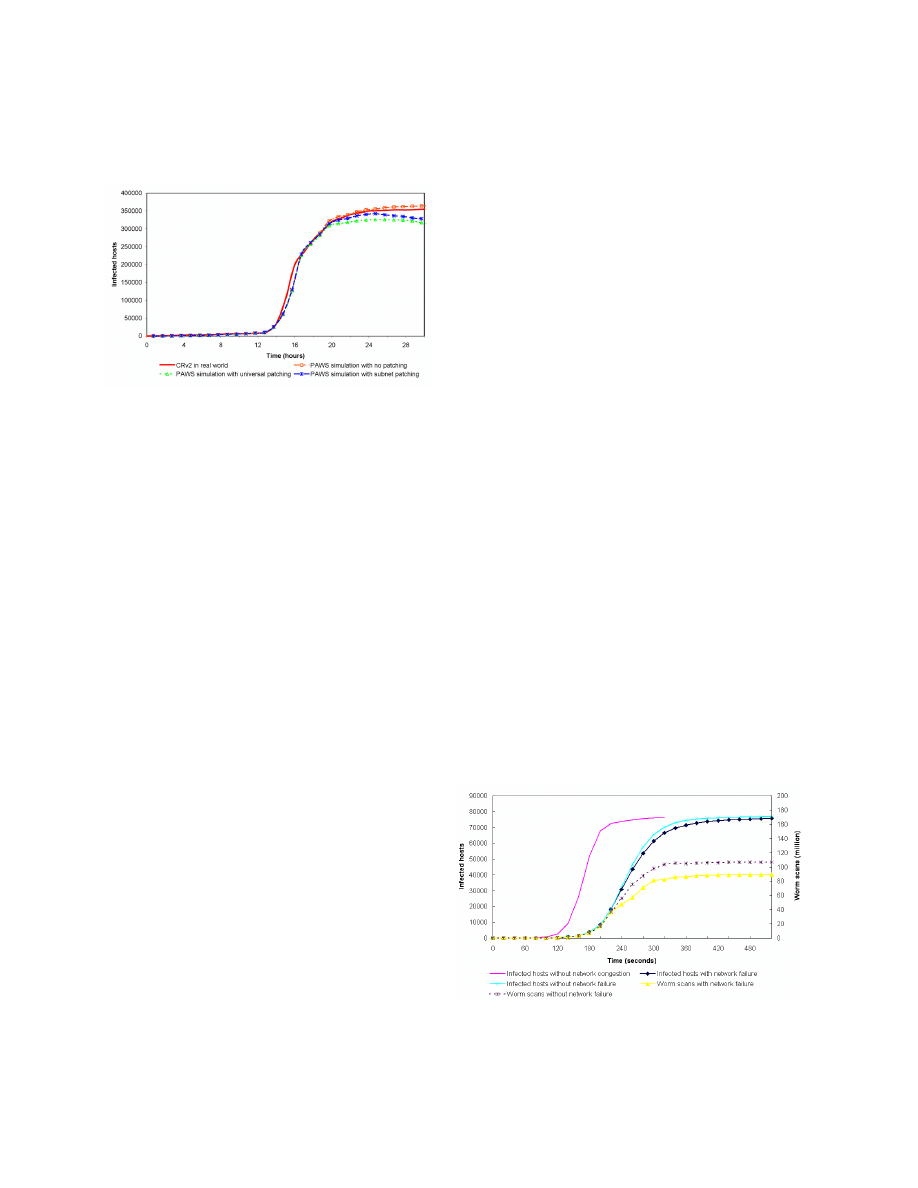
Figure 2: Simulation of CRv2
Figure 2 shows simulated number of infected hosts (lines
with marks) compared with the measured number during
worm propagation (line without marks) published in [8].
We simulate three worm spread events:
• CRv2 propagation without patching: worm propagates
without any defenses applied. Once a vulnerable host is
infected, it starts to probe others with a constant speed.
• CRv2 propagation with universal patching: Patching is
a good defense to fight slow-propagating worms. In this
experiment we set the initial patching rate of a host at
32/100,000 per second. AS the worm spread progresses,
the user awareness increases and the patching rate
increases linearly. Patching starts 16 hours after the
worm breakout. The initial patching rate, speed of the
linear increase and start time for patching are estimated
from the graph depicting measured host deactivation
after Code Red v2 spread [27]
• CRv2 propagation with subnet patching: This
experiment simulates an organized patching of all the
machines in a subnet administered by a single
organization. We use a constant patching rate of
1/100,000 per second per subnet and define the subnet
as an IP range belonging to an AS, no greater than 2
16
hosts. All the machines inside a selected subnet are
patched within the same time unit. For subnets larger
than 2
16
addresses, PAWS patches a randomly selected
portion of 2
16
hosts. Patching starts 16 hours after the
worm breakout.
From Figure 2, we see that “no-patching” case generates
the best match with the real worm. Further, two patching
scenarios, especially subnet patching, generate the decline
in the number of infected hosts after the worm reaches its
peak which resembles the effect measured at one Internet
subnetwork during CRv2 re-emergence and shown in [7].
5.2. Simulation of SQL Slammer
SQL Slammer [7] propagated on January 25, 2003,
starting from 05:30am UTC and infected more than 90%
of vulnerable hosts within 10 minutes. Total of 75,000
infected hosts are observed. In the simulation, we use
75,000 as the vulnerable population size, and the average
scan rate of is 4,000 probes per second. We replicate
routing at the worm spread start using Route Views data.
Figure 3 shows Slammer simulation results. In addition to
congestion-constrained worm spread (line with cross
marks), we also simulate the occurrence of router failures
due to large volume of scan traffic (line with square
marks), assuming a single router per AS peer. When the
traffic on an inter-AS link is two times bigger than its
bandwidth value, PAWS simulates router failure by
removing this inter-AS link. In both simulation runs
congestion builds up as the worm spreads, causing
dropped scans and slowing down propagation. For
comparison, we show the worm propagation with
unlimited bandwidth (line without marks). We note here
that the propagation can be “slowed down” more by
choosing smaller bandwidth values and thus increasing
congestion effects. The simulation with three different
bandwidth value assignments in Table 1 is shown in
Figure 4. We note that the worm propagation is slowed by
about 5 minutes by using significantly lower bandwidth
values than in Figure 3.
Figure 3 also shows the number of scans in the Internet for
worm propagation with and without the router failure. We
note that we drop around 18 million scans due to router
failures when the network is fully congested. The curve
with network failure reaches 80 million of scans around
300 seconds which matches the measured Slammer scan
activity in [7].
Among the three bandwidth assignments shown in Table 1,
we believe the values in column 6 are most reasonable and
nearest to the real applications of current Internet. Many
small ASes are owned by universities or institutes, who
normally use 100Mbps Fast Ethernet network, while
major ISPs with medium size ASes tend to provide OC-
9/OC-12 services. OC-192 techniques are used for
backbone network with 10Gbps data rate.
Figure 3: Simulation of Slammer
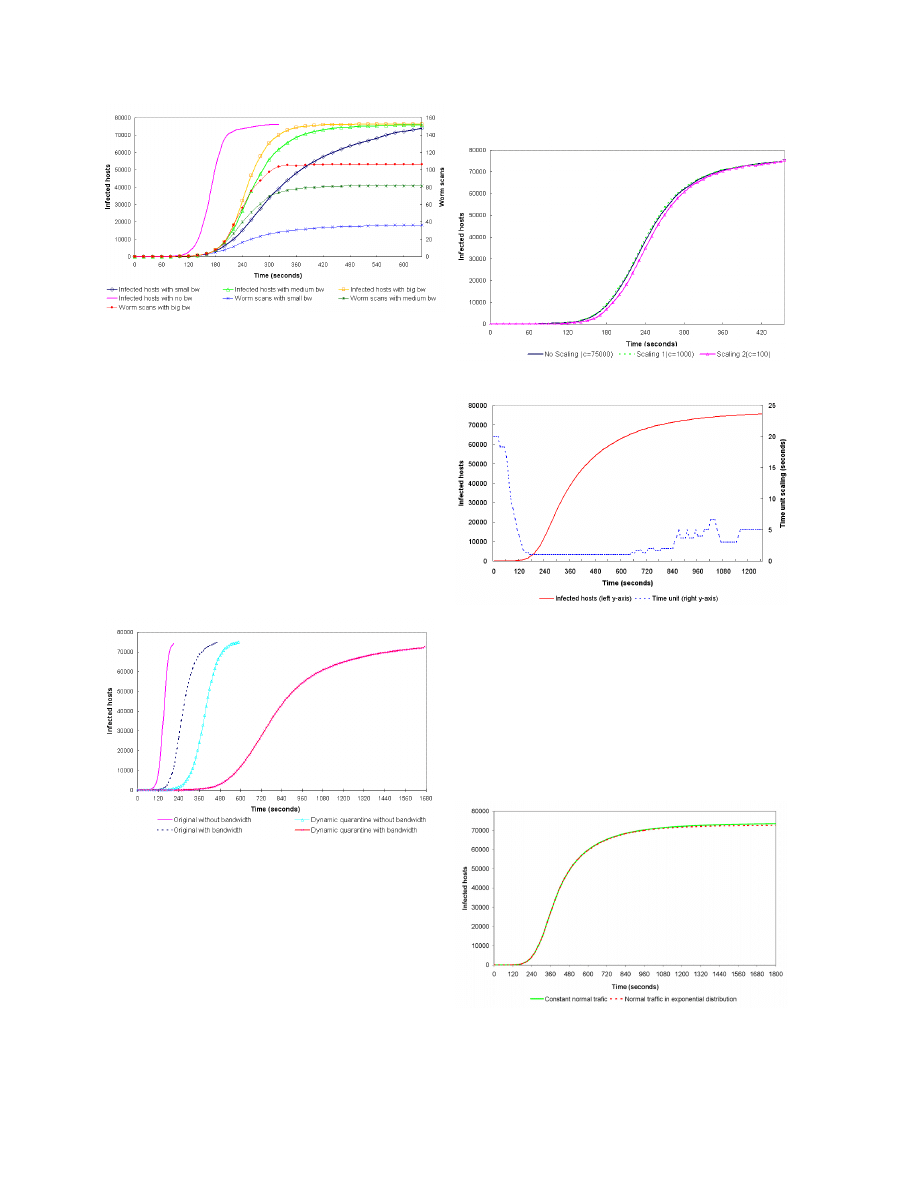
Figure 4: Simulation with different bandwidth values
assignments in Table 1
Zou et al [28] analyzed the effect of dynamic quarantine
as a worm defense. To demonstrate PAWS ability to
provide accurate evaluation of defense system
performance, we have also implemented dynamic
quarantine approach. We further replicate the experiment
from [28] where the quarantine rate of infectious hosts is
2
.
0
1
=
λ
per second and the quarantine rate of susceptible
hosts is
2
.
0
2
=
λ
per second. The quarantine time T is 10
seconds. In figure 5, we show the simulation result with
and without network congestion. We note that our
simulation result without considering bandwidth and
congestion match the result in [28]. With bandwidth
consideration, the dynamic quarantine significantly slows
down the worm. The bandwidth values in Table 1 column
6 are used for this experiment.
Figure 5 Simulation of Slammer with dynamic
quarantine defense
5.3. Effect of Time-Unit Scaling
We measure the loss of simulation fidelity due to time-unit
scaling, and show the results in Figure 6 depicting the
number of infected hosts by Slammer with and without
time-unit scaling. In these simulations we used bandwidth
values from Table 1, column 4. Time-unit scaling slows
slightly worm propagation in the early stage, but the
propagation “catches up” with the no-scaling curve (solid
lines) during the exponential stage of the spread. The
difference between curves is very small, while the gain in
simulation time is almost 30%. Figure 7 shows the value
of the scaled interval (dashed line) as simulation
progresses.
Figure 6: Time-unit scaling effect on simulation fidelity
Figure 7: Value of the scaled interval
Slammer in case of constant and random traffic
assignment. Simulations use the link bandwidth values
from Table 1, column 4. Two curves are identical, which
indicates that the worm spread is not very sensitive to the
amount of the background traffic present in the Internet.
We attribute that to the fact that Slammer was very
aggressive UDP worm which easily prevailed over the
small amount of well-behaved background traffic.
Aggressive TCP worms may exhibit greater sensitivity to
background traffic values.
Figure 8: Slammer propagation with constant and
random assignment of background traffic values
6. PAWS Performance
Two major PAWS’ activities during worm propagation
are processing and transmitting of worm scans. Worm
scan processing encompasses the operation of sending a
worm scan from each infected host and receiving and
processing this scan on the target host. This is the major
task of a worm simulator and consumes most of the
CPU time. As there are more infected machines in the
simulation, PAWS scan processing overhead grows.
Higher distribution degree reduces the processing
overhead on individual simulation nodes and thus
decreases scan processing time for the simulation.
Transmission activity encompasses the transfer of a
worm scan from the source (an infected host) to the
destination (the targeted host). Most of the time, source
and destination hosts are not collocated on the same
simulation node, and transferring worm scans leads to
network communication that produces additional
simulation delay. As there are more scans in the
simulation, transmission overhead grows as the scan
message must be split into several network packets.
Higher distribution degree also increases
communication among simulation nodes and the overall
scan transmission time.
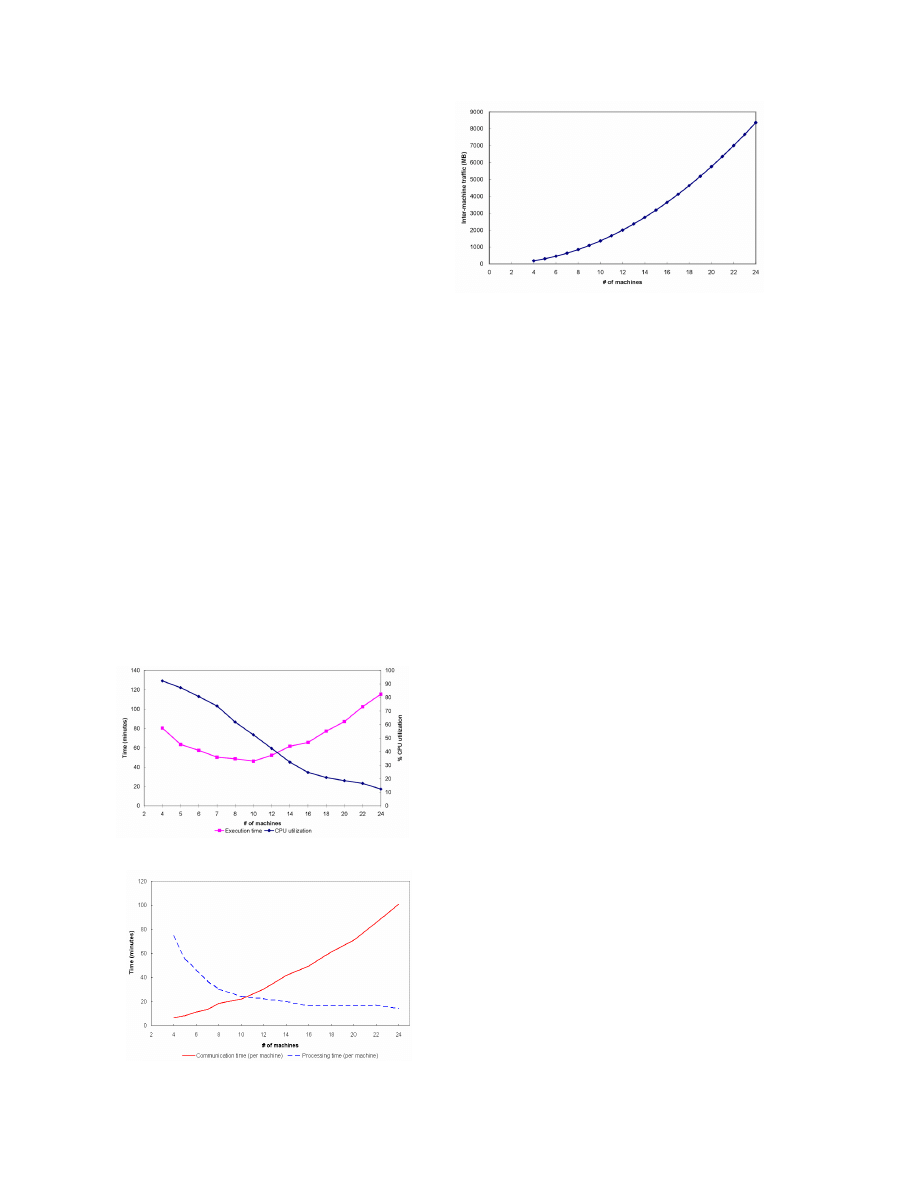
These two opposite factors influence the overall
simulation time. In Figure 9 we show the simulation
time and the CPU utilization for a varying number of
simulation nodes, simulating the first twenty hours of
CodeRed v2 propagation. Figure 10 shows the exact
time used for communication and processing on single
node with different number of simulation nodes. The
volume of inter-node traffic increases with the number
of simulation nodes, which is shown in Figure 11
.
Figure 9: Simulation time and CPU load
Figure 10: Communication and processing time
Figure 11: Inter-node traffic
Execution time is smallest with 10 nodes for this
simulation (first twenty hours of CodeRed v2
propagation), and benefits of using multiple simulation
machines balance the cost of inter-node communication.
As we use more than 10 nodes, the inter-node
communication increases yielding higher execution time.
When using less than 10 nodes, per-node processing
load is the key overhead factor. Please note that the
scanning strategy used by CodeRed v2 is a simplest one
(random scan), and no monitoring or defense is
simulated. For more complex experiments or
sophisticated worm simulations, the scan processing
time should increase, shifting the minimum shown in
Figure 9 to the right and to higher values. The CPU
utilization decreases as the number of simulation nodes
grows, because a large portion of the CPU time is spent
initiating and waiting for inter-node communication. In
the future work, we will investigate approaches to
reduce and simplify the inter-node communication and
thus get better usage of CPU resources.
7. Conclusion
We present a design and implementation of a distributed
worm simulator, PAWS, that runs on common PCs and
achieves largest packet-level simulation of worm spread to
date. PAWS simulates a realistic Internet model and
background traffic load, enabling investigation of
congestion effects of the worm spread and its interactions
with the background traffic. PAWS further supports a
variety of user-customizable parameters that enable testing
of various host and network diversity models, worm
scanning strategies and Internet topologies. PAWS’
modular design, variety of features, high-fidelity and
Emulab-based implementation make it a useful tool for
worm researchers.
References
[1] B. White, J. Lepreau, L. Stoller, R. Ricci, S.
Guruprasad, M. Newbold, M. Hibler, C. Barb, and A.
Joglekar, “An Integrated Experimental Environment for
Distributed Systems and Networks,” OSDI 2002.
[2] S. Floyd and V. Paxson, “Difficulties in Simulating the
Internet,” IEEE/ACM Transactions on Networking, Vol.9,
No.4, pp. 392-403, August, 2001.

[3] University of Oregon Route Views Project,
http://www.Route Views.org
[4] H. Chang, S. Jamin, W. Willinger, “On Inferring AS-
level connectivity from BGP Routing Tables,”
Proceedings of SPIE ITCom 2001.
[5] B. Cheswick and H. Burch, “The Internet Mapping
Project,” http://research.lumeta.com/ches/map/
[6] H. Tangmunarunkit, R. Govindan, S. Jamin, S.
Shenker, W. Willinger, “Network Topology Generator:
Degree-Based vs. Structural, Proceedings of SIGCOMM
2002.
[7] D. Moore, V. Paxson, S. Savage, C. Shannon, S.
Staniford, N. Weaver, “Inside the Slammer Worm,”
Security and Privacy, 1(4):33-39, July 2003.
[8] Ningning Hu, Li Erran Li, Zhuoqing Morley Mao,
Peter Steenkiste, Jia Wang, “Locating Internet Bottlenecks:
Algorithms, Measurements, and Implications,”
Proceedings of SIGCOMM 2004.
[9] K.S. Perumalla, S. Sundaragopalan, “High-Fidelity
Modeling of Computer Network Worms,” Annual
Computer Security Applications Conference (ACSAC),
December 2004.
[10] M. Liljenstam, Y. Yuan, B. J. Premore, “A Mixed
Abstraction Level Simulation Model of Large-scale
Internet Worm Infestations," International Symposium on
Modeling, Analysis and Simulation of Computer and
Telecommunication Systems (MASCOTS 2002).
[11] M. Liljenstam, D. Nicol, V. Berk, and R. Gray,
”Simulating Realistic Network Worm Traffic for Worm
Warning System Design and Testing,” Proceedings of the
2003 ACM Workshop on Rapid Malcode (WORM 2003).
[12] A. Wagner, T. Dübendorfer, B. Plattner and R.
Hiestand, “Experiences with Worm Propagation
Simulations,” In Proceedings of the 2003 ACM Workshop
on Rapid Malcode, 2003.
[13] D. Moore, C. Shannon, G. M. Voelker and S. Savage,
“Internet Quarantine: Requirements for Containing Self-
Propagating Code,” INFOCOM, 2003.
[14] S. Staniford, V. Paxson and N. Weaver, “How to 0wn
the Internet in Your Spare Time,” Proceedings of the 11th
USENIX Security Symposium, 2002.
[15] C. C. Zou, W. Gong and D. Towsley, “Code Red
Worm Propagation Modeling and Analysis,” In
Proceedings of the 9th ACM conference on Computer and
communications security, 2002.
[16] Z. Shen, L. Gao and K. Kwiat, “Modeling the Spread
of Active Worms,” In Proceedings of INFOCOM 2003.
[17]
J.O. Kephart and S.R. White, “Measuring and Modeling
Computer Virus Prevalence,” Proceedings of the 1993 IEEE
Symposium on Research in Security and Privacy, Oakland, CA,
May 1993.
[18] C. C. Zou, W. Gong, D. Towsley and L. Gao,
“Monitoring and Early Detection for Internet Worms,”
In Proceedings of 10th ACM Conference on Computer
and Communication Security, 2003.
[19] S. Floyd and E. Kohler, “Internet Research Needs
Better Models,” Proceedings of Hotnets-I. October 2002.
[20] M. Dodge, “An Atlas of Cyberspaces,” http://www.
cybergeography.org/atlas/more_isp_maps.html.
[21] R. Haynal, “Major Internet Backbone MAPs,” http://
navigators.com/isp.html.
[22] F. Wang and L. Gao, “Inferring and Characterizing
Internet Routing Policies,“ ACM SIGCOMM Internet
Measurement Conference 2003
[23] L. Gao, “On Inferring Autonomous System
Relationships in the Internet ,” IEEE Global Internet, Nov
2000.
[24] M. Liljenstam, J. Liu, and D. Nicol, “Development of
an Internet Backbone Topology for Large-Scale Network
Simulations,” Proceedings of 2003 Winter Simulation
Conference.
[25] G. F. Riley, M. I. Sharif and W. Lee, “Simulating
Internet Worms,” Proceedings of the 12th Annual Meeting
of the IEEE/ACM International Symposium on Modeling,
Analysis, and Simulation of Computer and
Telecommunication Systems (MASCOTS), 2004.
[26] R. Fujimoto, K. Perumalla, A. Park, H. Wu, M.
Ammar and G. Riley, “Large-Scale Network Simulation
−
How Big? How Fast?,” IEEE/ACM International
Symposium on Modeling, Analysis and Simulation of
Computer Telecommunication Systems (MASCOTS),
October 2003.
[27] D. Moore, C. Shannon, J. Brown, “Code-Red: a Case
Stud On the Spread and Victims of an Internet Worm,”
Proceedings of the Internet Measurement Workshop, 2002.
[28] C.C. Zou, W. Gong, D. Towsley, “Worm Propagation
Modeling and Analysis under Dynamic quarantine
defense,” Proceeding of ACM CSS Workshop on Rapid
Malcode (WORM’03), October 2003.
Wyszukiwarka
Podobne podstrony:
Multiscale Modeling and Simulation of Worm Effects on the Internet Routing Infrastructure
Idealism and realism international relations
więcej podobnych podstron