
BIOLOGY
STANDARD LEVEL
PAPER 2
Wednesday 7 May 2003 (afternoon)
1 hour 15 minutes
M03/410/S(2)+
IB DIPLOMA PROGRAMME
PROGRAMME DU DIPLÔME DU BI
PROGRAMA DEL DIPLOMA DEL BI
c
223-144
8 pages
INSTRUCTIONS TO CANDIDATES
y Write your candidate number in the box above.
y Do not open this examination paper until instructed to do so.
y Section A:
answer all of Section A in the spaces provided.
y Section B:
answer one question from Section B. Write your answers on answer sheets.
Write your candidate number on each answer sheet, and attach them to this
examination paper and your cover sheet using the tag provided.
y At the end of the examination, indicate the numbers of the questions answered in the candidate
box on your cover sheet and indicate the number of sheets used in the appropriate box on your
cover sheet.
Candidate number
SECTION A
Answer all questions in the spaces provided.
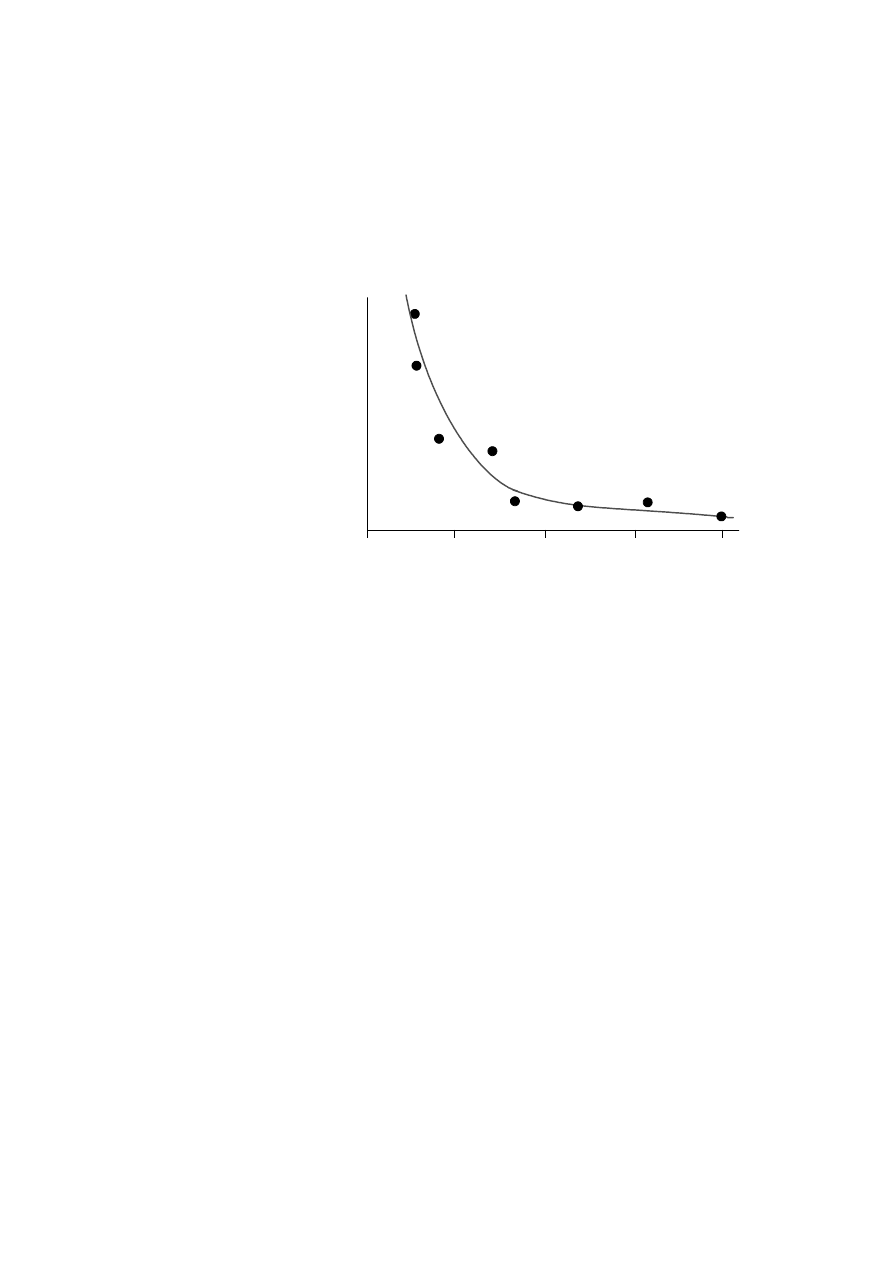
1.
A study was carried out to determine the relationship between the diameter of a molecule and its
movement through a membrane. The graph below shows the results of the study.
Relative ability to move
through a membrane
High
Low
0
0.4
0.8
1.2
1.6
Molecular diameter / nm
[Source: Knox, et al., Biology, McGraw Hill, Sydney, 1994, page 65]
[2]
(a)
From the information in the graph alone, describe the relationship between the diameter of a
molecule and its movement through a membrane.
. . . . . . . . . . . . . . . . . . . . . . . . . . . . . . . . . . . . . . . . . . . . . . . . . . . . . . . . . . . . . . . . . . . . . . . . .
. . . . . . . . . . . . . . . . . . . . . . . . . . . . . . . . . . . . . . . . . . . . . . . . . . . . . . . . . . . . . . . . . . . . . . . . .
. . . . . . . . . . . . . . . . . . . . . . . . . . . . . . . . . . . . . . . . . . . . . . . . . . . . . . . . . . . . . . . . . . . . . . . . .
. . . . . . . . . . . . . . . . . . . . . . . . . . . . . . . . . . . . . . . . . . . . . . . . . . . . . . . . . . . . . . . . . . . . . . . . .
(This question continues on the following page)
– 2 –
M03/410/S(2)+
223-144
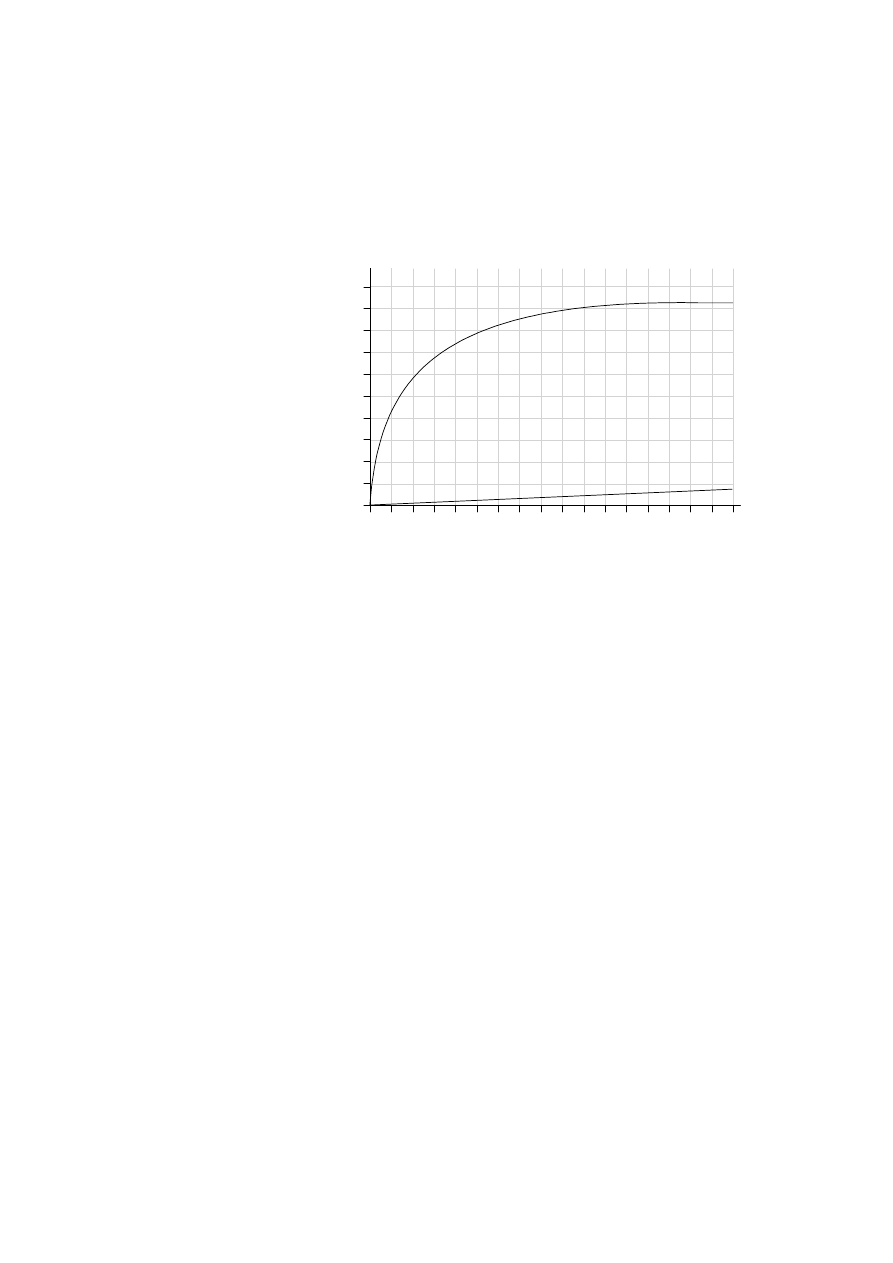
(Question 1 continued)
A second study was carried out to investigate the effect of passive protein channels on the
movement of glucose into cells. The graph below shows the rate of uptake of glucose into
erythrocytes by simple diffusion and facilitated diffusion.
Rate of glucose uptake /
3
1
mmol cm cells hr
−
−
0 1 2 3 4 5 6 7 8 9 10 11 12 13 14
500
250
0
50
100
150
200
300
350
400
450
15 16 17
facilitated diffusion
simple diffusion
External concentration of glucose /
3
mmol dm
−
(b)
Identify the rate of glucose uptake at an external glucose concentration of 4
by
3
mmol dm
−
[1]
[1]
(i)
simple diffusion.
. . . . . . . . . . . . . . . . . .
(ii)
facilitated diffusion.
. . . . . . . . . . . . . . . . . .
[3]
(c)
(i)
Compare the effect of increasing the external glucose concentration on glucose uptake
by facilitated diffusion and by simple diffusion.
. . . . . . . . . . . . . . . . . . . . . . . . . . . . . . . . . . . . . . . . . . . . . . . . . . . . . . . . . . . . . . . . . . . . .
. . . . . . . . . . . . . . . . . . . . . . . . . . . . . . . . . . . . . . . . . . . . . . . . . . . . . . . . . . . . . . . . . . . . .
. . . . . . . . . . . . . . . . . . . . . . . . . . . . . . . . . . . . . . . . . . . . . . . . . . . . . . . . . . . . . . . . . . . . .
. . . . . . . . . . . . . . . . . . . . . . . . . . . . . . . . . . . . . . . . . . . . . . . . . . . . . . . . . . . . . . . . . . . . .
. . . . . . . . . . . . . . . . . . . . . . . . . . . . . . . . . . . . . . . . . . . . . . . . . . . . . . . . . . . . . . . . . . . . .
. . . . . . . . . . . . . . . . . . . . . . . . . . . . . . . . . . . . . . . . . . . . . . . . . . . . . . . . . . . . . . . . . . . . .
[2]
(ii)
Predict, with a reason, the effect on glucose uptake by facilitated diffusion of increasing
the external concentration of glucose to 30
.
3
mmol dm
−
. . . . . . . . . . . . . . . . . . . . . . . . . . . . . . . . . . . . . . . . . . . . . . . . . . . . . . . . . . . . . . . . . . . . .
. . . . . . . . . . . . . . . . . . . . . . . . . . . . . . . . . . . . . . . . . . . . . . . . . . . . . . . . . . . . . . . . . . . . .
. . . . . . . . . . . . . . . . . . . . . . . . . . . . . . . . . . . . . . . . . . . . . . . . . . . . . . . . . . . . . . . . . . . . .
. . . . . . . . . . . . . . . . . . . . . . . . . . . . . . . . . . . . . . . . . . . . . . . . . . . . . . . . . . . . . . . . . . . . .
– 3 –
M03/410/S(2)+
223-144
Turn over
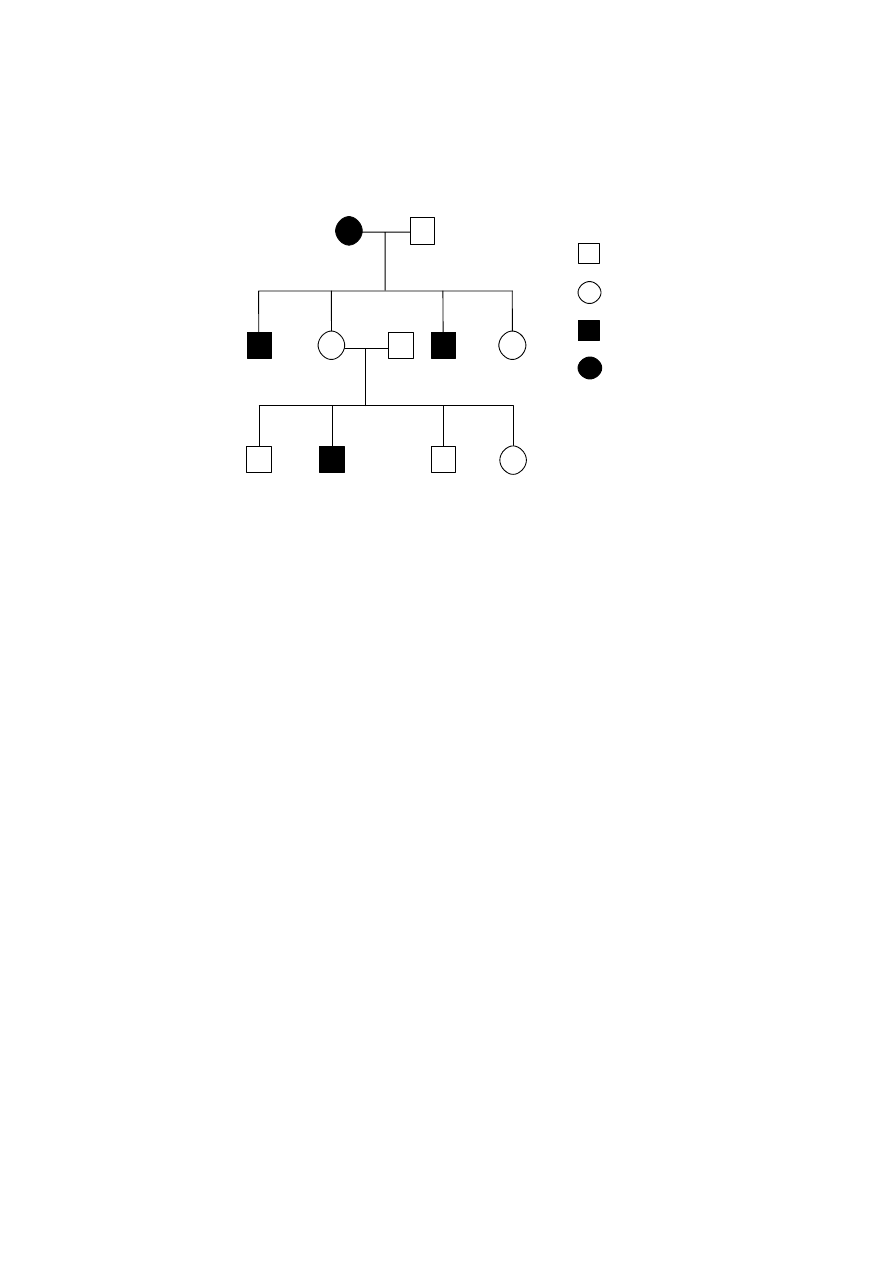
2.
The diagram below shows the pedigree of a family with red green colour-blindness, a sex-linked
condition.
male with condition
Key
normal male
normal female
female with condition
3rd generation
1
2
1
2
3
4
5
1
2
3
4
2nd generation
1st generation
[1]
(a)
Define the term sex-linkage.
. . . . . . . . . . . . . . . . . . . . . . . . . . . . . . . . . . . . . . . . . . . . . . . . . . . . . . . . . . . . . . . . . . . . . . . . .
. . . . . . . . . . . . . . . . . . . . . . . . . . . . . . . . . . . . . . . . . . . . . . . . . . . . . . . . . . . . . . . . . . . . . . . . .
[2]
(b)
Deduce, with a reason, whether the allele producing the condition is dominant or recessive.
. . . . . . . . . . . . . . . . . . . . . . . . . . . . . . . . . . . . . . . . . . . . . . . . . . . . . . . . . . . . . . . . . . . . . . . . .
. . . . . . . . . . . . . . . . . . . . . . . . . . . . . . . . . . . . . . . . . . . . . . . . . . . . . . . . . . . . . . . . . . . . . . . . .
. . . . . . . . . . . . . . . . . . . . . . . . . . . . . . . . . . . . . . . . . . . . . . . . . . . . . . . . . . . . . . . . . . . . . . . . .
. . . . . . . . . . . . . . . . . . . . . . . . . . . . . . . . . . . . . . . . . . . . . . . . . . . . . . . . . . . . . . . . . . . . . . . . .
[1]
(c)
(i)
Determine all the possible genotypes of the individual (2nd generation–1) using
appropriate symbols.
. . . . . . . . . . . . . . . . . . . . . . . . . . . . . . . . . . . . . . . . . . . . . . . . . . . . . . . . . . . . . . . . . . . . .
[1]
(ii)
Determine all the possible genotypes of the individual (3rd generation–4) using
appropriate symbols.
. . . . . . . . . . . . . . . . . . . . . . . . . . . . . . . . . . . . . . . . . . . . . . . . . . . . . . . . . . . . . . . . . . . . .
– 4 –
M03/410/S(2)+
223-144
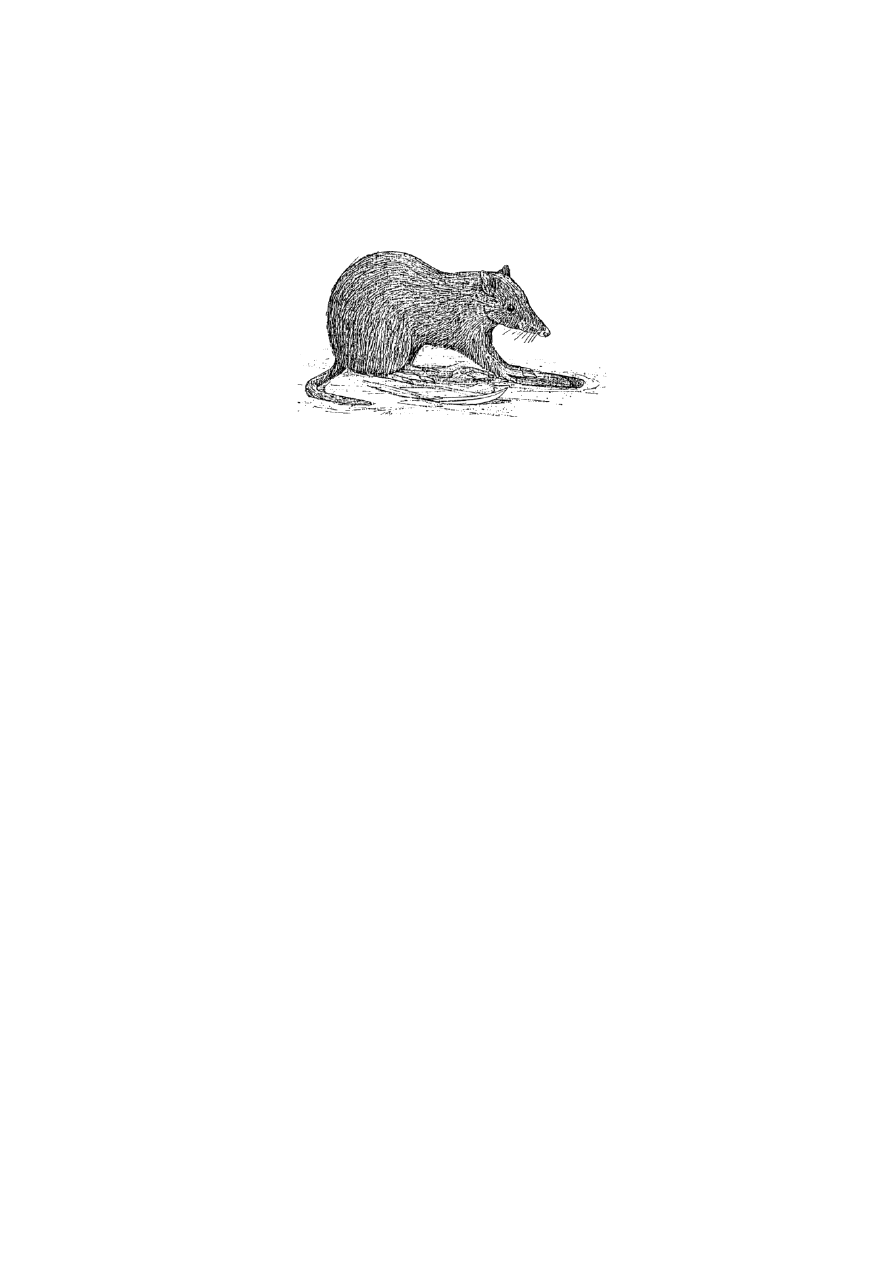
3.
On a field trip a group of students was asked to estimate the size of the population of a small,
nocturnal ground dwelling mammal, the long-nosed bandicoot (Perameles nasuta). The bandicoot
feeds on invertebrates and plant material found by digging pits 5 cm deep in the ground with its
front legs.
[Source: J Smith & P Smith, Fauna of the Blue Mountains, Kangaroo Press, Sydney, 1990]
[1]
(a)
(i)
State the name of an appropriate technique to estimate the population size of P. nasuta.
. . . . . . . . . . . . . . . . . . . . . . . . . . . . . . . . . . . . . . . . . . . . . . . . . . . . . . . . . . . . . . . . . . . . .
[3]
(ii)
Describe this method of estimating the population size of P. nasuta.
. . . . . . . . . . . . . . . . . . . . . . . . . . . . . . . . . . . . . . . . . . . . . . . . . . . . . . . . . . . . . . . . . . . . .
. . . . . . . . . . . . . . . . . . . . . . . . . . . . . . . . . . . . . . . . . . . . . . . . . . . . . . . . . . . . . . . . . . . . .
. . . . . . . . . . . . . . . . . . . . . . . . . . . . . . . . . . . . . . . . . . . . . . . . . . . . . . . . . . . . . . . . . . . . .
. . . . . . . . . . . . . . . . . . . . . . . . . . . . . . . . . . . . . . . . . . . . . . . . . . . . . . . . . . . . . . . . . . . . .
. . . . . . . . . . . . . . . . . . . . . . . . . . . . . . . . . . . . . . . . . . . . . . . . . . . . . . . . . . . . . . . . . . . . .
. . . . . . . . . . . . . . . . . . . . . . . . . . . . . . . . . . . . . . . . . . . . . . . . . . . . . . . . . . . . . . . . . . . . .
. . . . . . . . . . . . . . . . . . . . . . . . . . . . . . . . . . . . . . . . . . . . . . . . . . . . . . . . . . . . . . . . . . . . .
[2]
(b)
Deduce, with reasons, the trophic level of P. nasuta in food chains.
. . . . . . . . . . . . . . . . . . . . . . . . . . . . . . . . . . . . . . . . . . . . . . . . . . . . . . . . . . . . . . . . . . . . . . . . .
. . . . . . . . . . . . . . . . . . . . . . . . . . . . . . . . . . . . . . . . . . . . . . . . . . . . . . . . . . . . . . . . . . . . . . . . .
. . . . . . . . . . . . . . . . . . . . . . . . . . . . . . . . . . . . . . . . . . . . . . . . . . . . . . . . . . . . . . . . . . . . . . . . .
. . . . . . . . . . . . . . . . . . . . . . . . . . . . . . . . . . . . . . . . . . . . . . . . . . . . . . . . . . . . . . . . . . . . . . . . .
– 5 –
M03/410/S(2)+
223-144
Turn over

4.
The diagram below shows possible pathways for the breakdown of glucose in various cells.
Glucose
(oxygen present)
Process R
A
C + D
D + E
B
Process Q
(no oxygen present)
[1]
[1]
(a)
State the names of processes Q and R.
Q:
. . . . . . . . . . . . . . . . . . . . . . . . . . . . . . . . . . . . . . . . . . . . . . . . . . . . . . . . . . . . . . . . . . . . .
R:
. . . . . . . . . . . . . . . . . . . . . . . . . . . . . . . . . . . . . . . . . . . . . . . . . . . . . . . . . . . . . . . . . . . . .
[1]
[1]
(b)
Deduce the names of substances A and D.
A:
. . . . . . . . . . . . . . . . . . . . . . . . . . . . . . . . . . . . . . . . . . . . . . . . . . . . . . . . . . . . . . . . . . . . .
D:
. . . . . . . . . . . . . . . . . . . . . . . . . . . . . . . . . . . . . . . . . . . . . . . . . . . . . . . . . . . . . . . . . . . . .
[1]
(c)
State the organelle in which process R takes place.
. . . . . . . . . . . . . . . . . . . . . . . . . . . . . . . . . . . . . . . . . . . . . . . . . . . . . . . . . . . . . . . . . . . . . . . . .
– 6 –
M03/410/S(2)+
223-144

[3]
5.
(a)
Explain how the skin and mucous membranes prevent entry of pathogens into the body.
. . . . . . . . . . . . . . . . . . . . . . . . . . . . . . . . . . . . . . . . . . . . . . . . . . . . . . . . . . . . . . . . . . . . . . . . .
. . . . . . . . . . . . . . . . . . . . . . . . . . . . . . . . . . . . . . . . . . . . . . . . . . . . . . . . . . . . . . . . . . . . . . . . .
. . . . . . . . . . . . . . . . . . . . . . . . . . . . . . . . . . . . . . . . . . . . . . . . . . . . . . . . . . . . . . . . . . . . . . . . .
. . . . . . . . . . . . . . . . . . . . . . . . . . . . . . . . . . . . . . . . . . . . . . . . . . . . . . . . . . . . . . . . . . . . . . . . .
. . . . . . . . . . . . . . . . . . . . . . . . . . . . . . . . . . . . . . . . . . . . . . . . . . . . . . . . . . . . . . . . . . . . . . . . .
. . . . . . . . . . . . . . . . . . . . . . . . . . . . . . . . . . . . . . . . . . . . . . . . . . . . . . . . . . . . . . . . . . . . . . . . .
[2]
(b)
Explain why antibiotics are used to treat bacterial but not viral diseases.
. . . . . . . . . . . . . . . . . . . . . . . . . . . . . . . . . . . . . . . . . . . . . . . . . . . . . . . . . . . . . . . . . . . . . . . . .
. . . . . . . . . . . . . . . . . . . . . . . . . . . . . . . . . . . . . . . . . . . . . . . . . . . . . . . . . . . . . . . . . . . . . . . . .
. . . . . . . . . . . . . . . . . . . . . . . . . . . . . . . . . . . . . . . . . . . . . . . . . . . . . . . . . . . . . . . . . . . . . . . . .
. . . . . . . . . . . . . . . . . . . . . . . . . . . . . . . . . . . . . . . . . . . . . . . . . . . . . . . . . . . . . . . . . . . . . . . . .
– 7 –
M03/410/S(2)+
223-144
Turn over

SECTION B
Answer one question. Up to two additional marks are available for the construction of your answer. Write
your answers on the answer sheets provided. Write your candidate number on each answer sheet, and attach
them to this examination paper and your cover sheet using the tag provided.
[3]
6.
(a)
Outline the advantages of using light microscopes in comparison with electron microscopes.
[6]
(b)
Distinguish between the structure of plant and animal cells.
[9]
(c)
Explain how the structure and properties of phospholipids help to maintain the structure of cell
membranes.
[6]
7.
(a)
Describe the significance of water to living organisms.
[4]
(b)
Outline the role of condensation and hydrolysis in the relationship between amino acids and
dipeptides.
[8]
(c)
Explain the use of two named enzymes in biotechnology.
[4]
8.
(a)
Draw a diagram of the human digestive system.
[6]
(b)
Describe the role of enzymes in the process of digestion of proteins, carbohydrates and lipids
in humans.
[8]
(c)
Explain how blood glucose concentration is controlled in humans.
– 8 –
M03/410/S(2)+
223-144
Wyszukiwarka
Podobne podstrony:
May 2003 Paper 1 Markscheme
May 2003 Paper 1
May 2003 History HL Paper 3
May 2003 History HL Paper 3 Mark Scheme
Mathematics HL May 2003 P1
History HS May 2003 P2
Further May 00 paper 2
History HS May 2003 P1 T
Mathematics HL May 2003 P1 $
Mathematics HL May 2003 P2 $
History HS May 2003 P2 $
Mathematics HL May 2003 P2
Mathematics HL May 2003 P1
więcej podobnych podstron