
INFLUENCE OF THE TEMPERATURE ON THE
TOUGHNESS OF UDDEHOLM DIEVAR
H. Jesperson.
Uddeholm Tooling AB
SE-683 85 Hagfors
Sweden
Abstract
Tools for hot forming of metals, such as die casting dies, extrusion dies and
forging dies, are often preheated in order to minimise temperature differ-
ences and the risk of catastrophic failure. In the present investigation the
toughness of the hot-work tool steel grade UDDEHOLM DIEVAR in the
temperature range 20- 400
◦
Chas been investigated. Quasi static K
1c
frac-
ture toughness testing, quasi static J
1c
fracture toughness testing, dynamic
fracture toughness testing of fatigue precracked Charpy V-notch specimens
and instrumented Charpy V-notch impact testing were performed.
In the first-mentioned test the K
Q
values obtained were not valid K
1c
values due to insufficient crack length and specimen thickness.
In the J
1c
fracture toughness test valid values were only obtained between
200
◦
Cand 400
◦
C. Within this range the fracture toughness was independent
of the test temperature. At lower temperatures it was difficult to obtain stable
crack growth, the specimen cracked abrupt. This indicates that there is a
decrease in toughness below 200
◦
C.
The dynamic fracture toughness was also independent of the test temper-
ature in the range 200-400
◦
C. Below 200
◦
Cit decreased with decreasing
temperature. The energy absorption at the instrumented Charpy V-notch im-
pact test showed a temperature dependence similar to that of the dynamic
fracture toughness.
Keywords:
Hot-work tool steel, J
1c
fracture toughness, K
1c
fracture toughness, dynamic
fracture toughness, instrumented impact testing, Charpy V-notch impact test-
ing, elevated temperature.
27

28
6TH INTERNATIONAL TOOLING CONFERENCE
INTRODUCTION
Tools for hot forming of metals, such as die casting dies, extrusion dies
and forging dies, are often preheated in order to minimise temperature dif-
ferences and the risk of catastrophic failure. In the present investigation the
toughness of UDDEHOLM DIEVAR in the temperature range 20-400
◦
Chas
been investigated. Quasi static
K
1c
fracture toughness testing according
to ASTM E399 [1], quasi static
J
1c
fracture toughness testing according
to ASTM E813-89 [2], dynamic fracture toughness testing of fatigue pre-
cracked Charpy V-notch specimens and instrumented Charpy V-notch impact
testing were performed.
EXPERIMENTAL
K
1C
AND
J
1C
FRACTURE TOUGHNESS TESTING
The
K
1c
and
J
1c
fracture toughness testing was performed in a 700 kN
servohydraulic universal testing machine from MTS. For
K
1c
fracture tough-
ness testing CT specimens with the thickness B=65 mm and the width W=170
mm were used. At the
J
1c
fracture toughness testing CT specimens with
B=17 mm, W=34 mm and pin diameter of 6,4 mm (0,1875W) were utilised.
The specimens were side grooved after the fatigue cracking. The grooves
were 1,0 mm in depth and had a bottom radius of 0,25 mm. The starter
notches were produced by electric discharge machining. The fatigue crack-
ing was performed at a frequency of 6-10 Hz to a final crack length of
approximately 0,53W in the
K
1c
specimens and 0,61 W in the
J
1c
speci-
mens. The compliance method was used to measure the crack length during
the testing. Afterwards it was measured in a stereoscopic microscope.
The single-specimen technique was used in the
J
1c
fracture toughness
test. Six specimens were tested at each temperature. In the
K
1c
fracture
toughness tests three specimens were used for each temperature level.
Both in the
K
1c
and
J
1c
test an MTS 632.65 COD gauge was used. In
order to protect the strain gauges from heat and mechanical shock, contact
arms made of glass were used in this type of gage. During testing at elevated
temperature the specimen and clevis were encompassed by a ATS 3-zone
split tube furnace.

Influence of the Temperature on the Toughness of UDDEHOLM DIEVAR
29
DYNAMIC FRACTURE TOUGHNESS TESTING
Ordinary Charpy V-notch specimens were fatigue precracked in a 20 kN
Amsler vibrophore at a frequency of approximately 125 Hz. The length of
the cracks (including the V-notch) was 0,45-0,51W. The testing was per-
formed in a 150 J impact testing machine from Roell Amsler equipped with
instrumented tup and appropriate software. At room temperature the an-
gle of fall was 80
°and above room temperature 159,3°. After the test, the
crack length was measured in a stereoscopic microscope. The software of
the machine calculated three values of the dynamic fracture toughness using
equations from ASTM E399 (Plain-Strain Fracture Toughness of Metallic
Materials) [1], ASTM E992 (Determination of Fracture Toughness of Steels
Using Equivalent Energy Methodology) [3] and ASTM E813-81 (
J
1c
, a
measure of fracture toughness) [4]. The values were designated
K
1d
,
K
ds
and
K
J d
, respectively. Six specimens were tested at each temperature.
INSTRUMENTED CHARPY V-NOTCH IMPACT
TESTING
Six Charpy V-notch specimens at each temperature were tested accord-
ing to EN ISO 14556 [5] in a 150 J Roell Amsler impact testing machine
equipped with instrumented tup and appropriate software. Oscillations due
to force interaction between the tup and the specimen make the interpretation
of the force-time curves difficult. In order to obtain a fitted curve through
the oscillations a filter was used (filter value 0,015).
TEST MATERIAL AND HEAT TREATMENT
All specimens were taken from the centre of a 948 × 435 mm bar of
UDDEHOLM DIEVAR, heat E10887. DIEVAR is a recently developed
hot-work tool steel grade. The direction of the normal to the crack plane in
the specimens was parallel to the short transverse direction of the bar and
the direction of crack propagation was parallel with the transverse direction
of the bar. Such specimens can shortly be coded as S-T specimens.
All specimens were heat treated in a vacuum furnace from Schmetz
GmbH. The temperature of the specimens was measured by a thermocouple
placed in an extra specimen with a hole drilled to its centre. All specimens
were austenitized 30 minutes at 1025
◦
Cand quenched in nitrogen gas. The

30
6TH INTERNATIONAL TOOLING CONFERENCE
gas pressure and fan velocity was adjusted to the specimen size so that the
cooling rate was the same, irrespectively to the specimen size. The cooling
time between 800
◦
Cand 500
◦
Cwas 280 s which corresponds to a cooling
rate of approximately 1
◦
C/s or 64
◦
C/min. All specimens were tempered
2*2 hours at 640
◦
Cto a hardness of 38±1 HRC.
RESULTS
K
1C
FRACTURE TOUGHNESS
The following
K
Q
values were obtained: 195
M P a
√
m, 203 M P a
√
m
and 235
M P a
√
m. None of the values were valid K
1c
values because both
the crack length and specimen thickness were too small.
J
1C
FRACTURE TOUGHNESS
Valid values were only obtained at and above 200
◦
Cbecause it was dif-
ficult to obtain a stable crack growth below 200
◦
C. Moreover, as the spec-
imens cracked abrupt, the glass arms of the extensometer were broken and
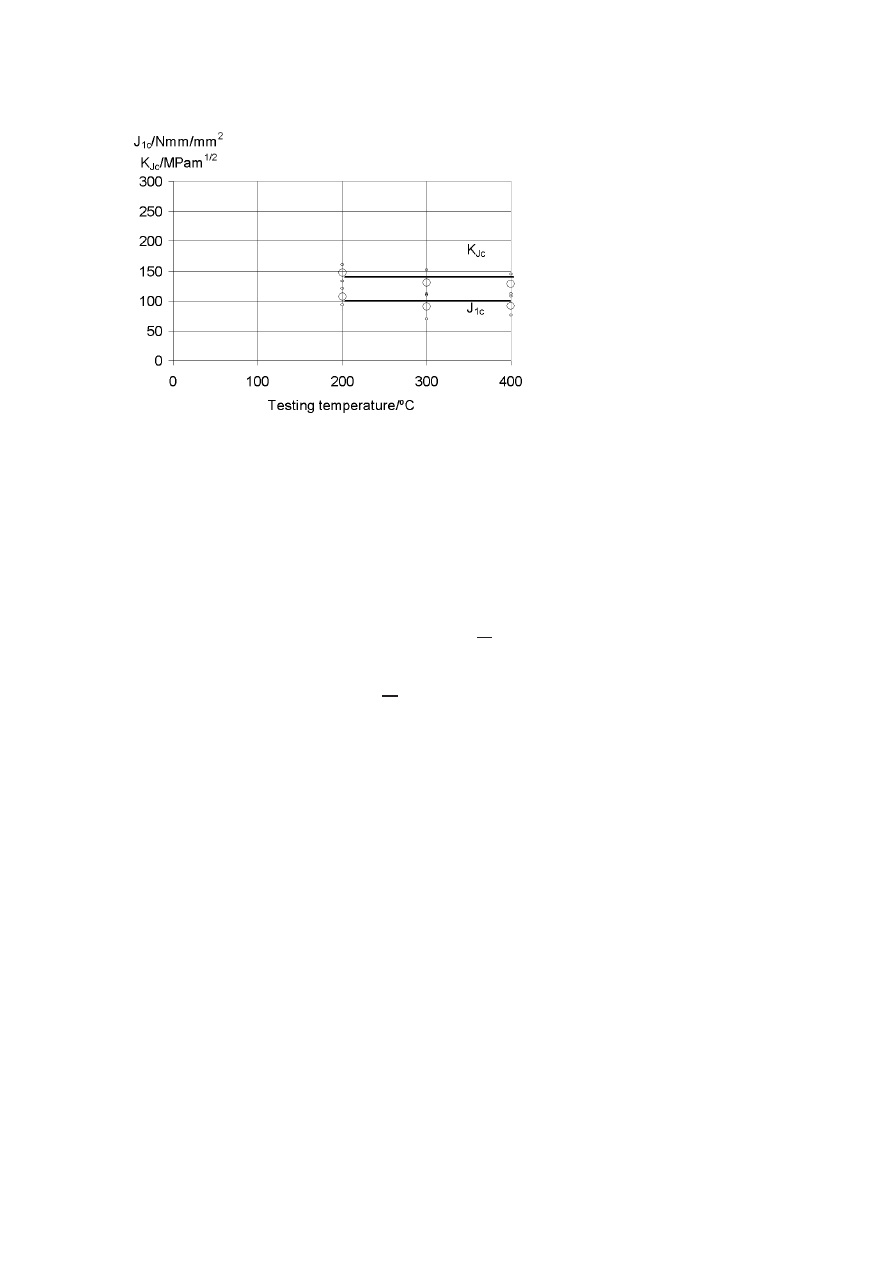
must be replaced. Fig 1 shows
J
1c
and
K
J c
versus temperature.
K
J c
is a
stress intensity value calculated from the
J
1c
value by the following equation:
K
2
J c
=
J
1c
E
1 − ν
2
(1)
where E is Young’s modulus and
ν is Poissons’s ratio.
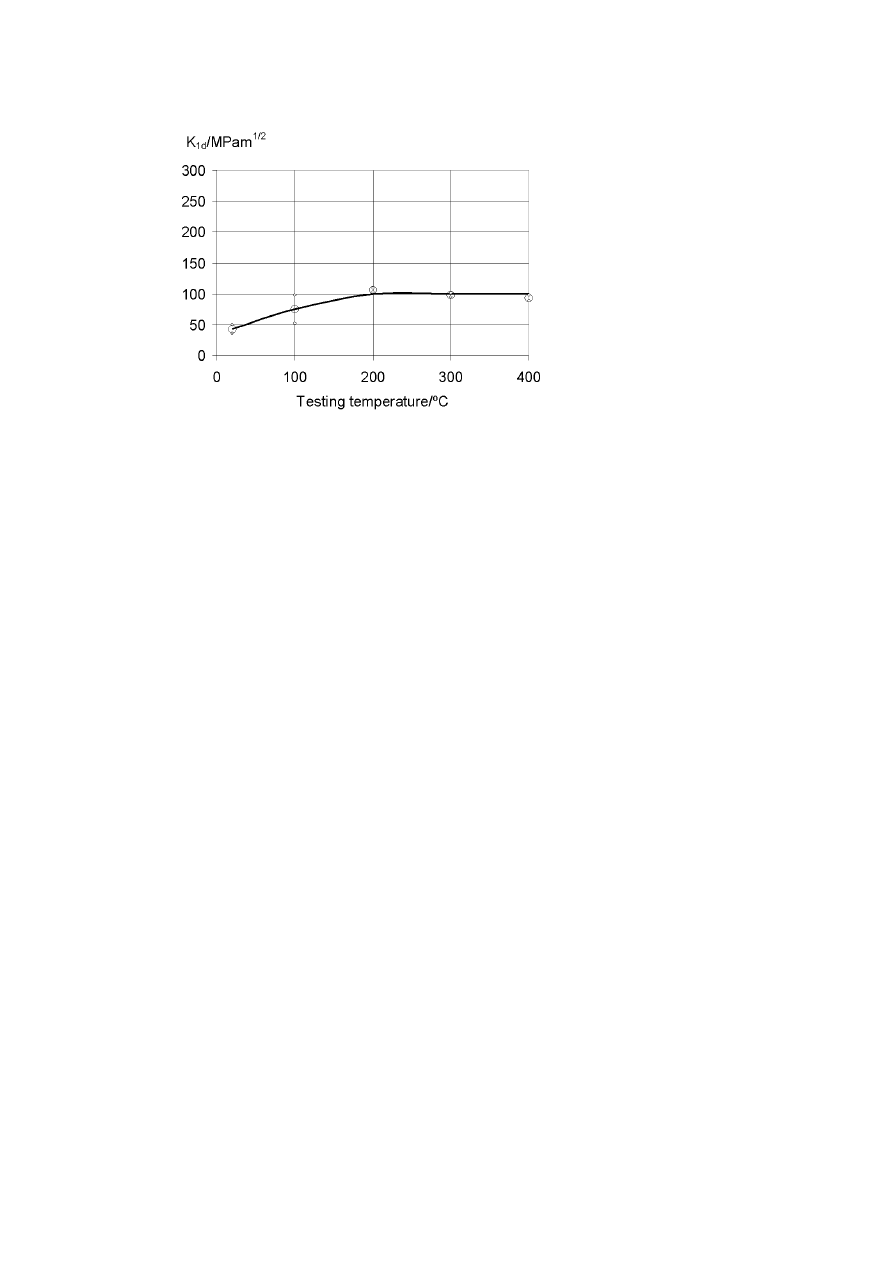
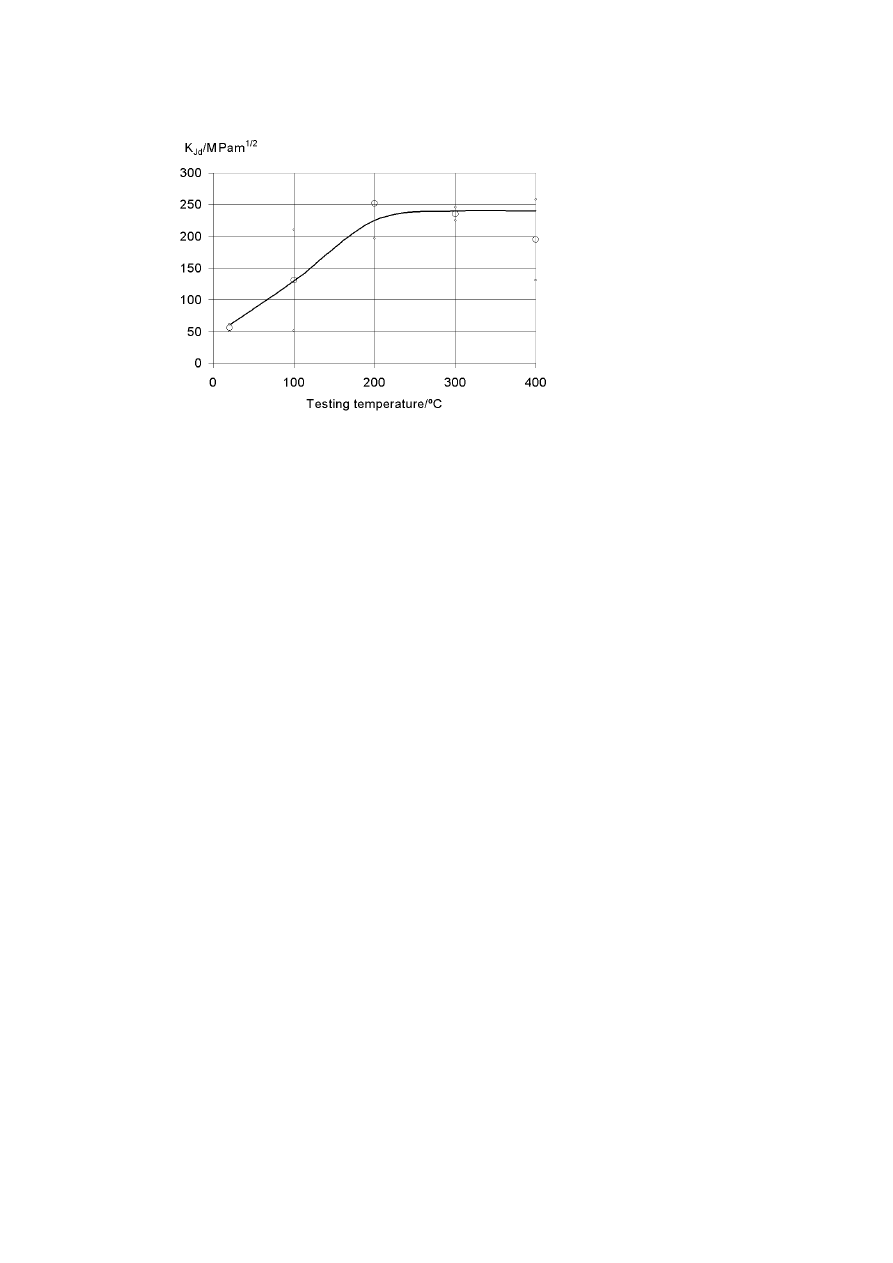
DYNAMIC FRACTURE TOUGHNESS
Figures 2, 3, 4 show the calculated
K
1d
,
K
ds
and the
K
J d
values, respec-
tively, as a function of the testing temperature.
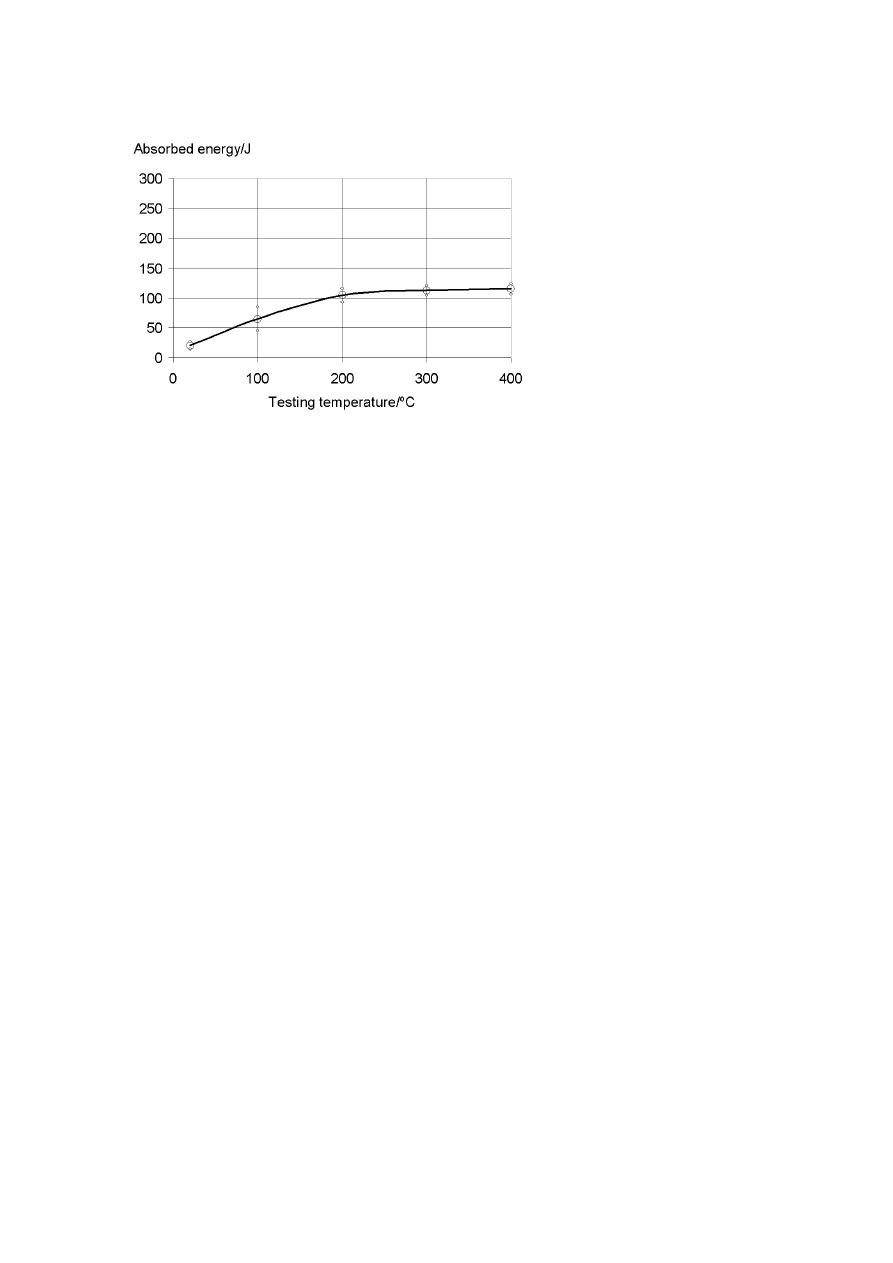
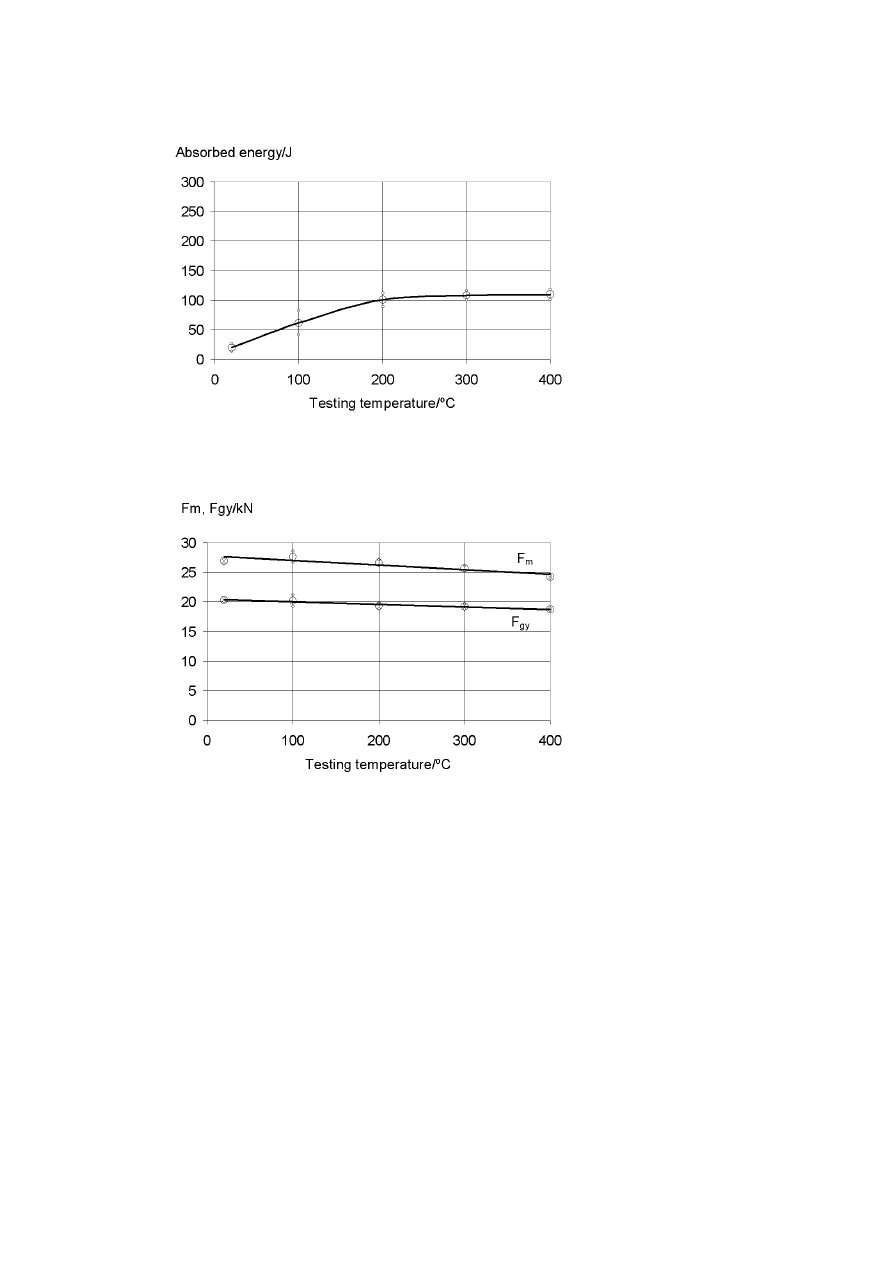
INSTRUMENTED IMPACT TESTING
The energy absorption measured from the angle of rise of the pendulum
is shown in Fig 5. Figure 6 shows the energy absorption calculated from the
area under the load-displacement curve. The yield load and the maximum
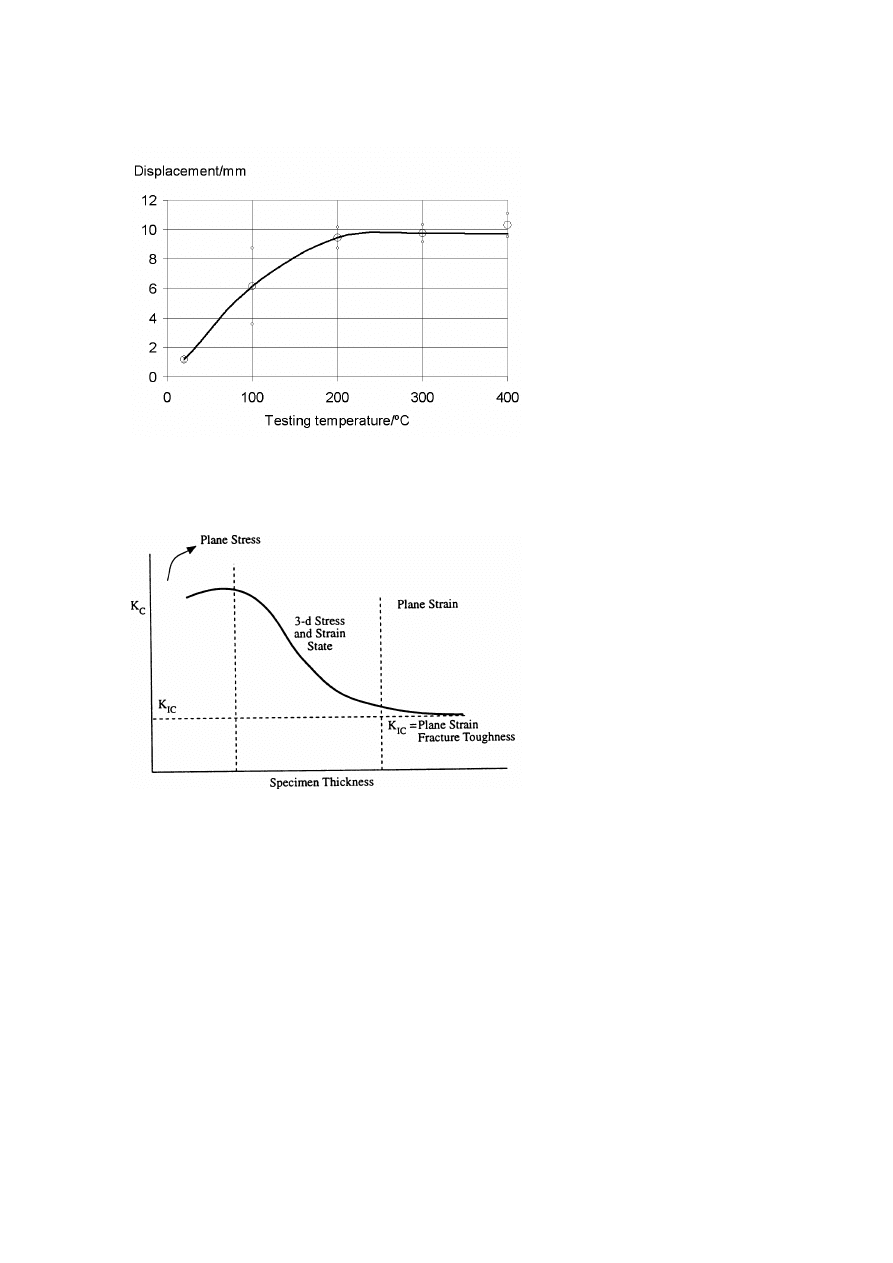
load are shown in Fig 7 and total displacement is shown in Fig 8.
Influence of the Temperature on the Toughness of UDDEHOLM DIEVAR
31
Figure 1.
J
1c
and K
J c
versus temperature. The large circles indicate mean values and the
small circles the 95% confidence interval for the mean value
DISCUSSION
It was no idea to make a new
K
1c
fracture toughness test with larger spec-
imens because a force of 485-645 kN was required to break the specimens
and the maximum capacity of the testing machine was 700 kN.
By means of Fig 9 one can conclude that the
K
Q
values obtained in the
testing are larger than the real
K
1c
values. The real
K
1c
value at room
temperature should consequently be lower than 200
M P a
√
m.
The scatter in the
J
1c
fracture toughness test was considerable. The
toughness was constant in the temperature range 200-400
◦
C; J
1c
was about
95
N mm/mm
2
and
K
J c
about 140
M P a
√
m. The circumstance that it
was difficult to obtain a stable crack below 200
◦
Cindicates that the fracture
toughness decreases below this temperature.
The scatter in the
K
ds
and
K
J d
values in the dynamic fracture test was
considerable. All three measures of the dynamic fracture toughness were
constant in the temperature range 200-400
◦
C. Below 200
◦
Call values de-
creased with decreasing temperature. In spite of the difference in deforma-
tion rate and the fact that Charpy V specimens do not fulfil the size criteria
32
6TH INTERNATIONAL TOOLING CONFERENCE
Figure 2.
K
1d
versus temperature. The large circles indicate mean values and the small
circles the 95% confidence interval for the mean value.
of ASTM E399 [1] and E992 [3] two of the dynamic fracture toughness val-
ues corresponded rather well to the quasi static
K
J c
values calculated from
the
J
1c
values. The values obtain by the equivalent energy method,
K
ds
,
were most similar to the
K
J c
values. The dynamic fracture toughness values
obtained by using equations from ASTM E813 [4] seem to be too high. It
is not likely that a high deformation rate gives higher toughness than a low
rate.
The instrumented impact testing showed that the yield load and maxi-
mum load decreased faintly with increasing temperature. The displacement
increased considerable between room temperature and 200
◦
C. In the tem-
perature range 200-400
◦
Cit was constant. The increase in energy absorp-
tion with increasing temperature is thus a consequence of a larger deflection
(plastic deformation) of the specimens.
CONCLUSIONS
Dynamic fracture toughness testing with fatigue precracked Charpy V-
notch specimens seems to give realistic values. However more tests must

Influence of the Temperature on the Toughness of UDDEHOLM DIEVAR
33
Figure 3.
K
ds
versus temperature. The large circles indicate mean values and the small
circles the 95% confidence interval for the mean value.
be made before confident conclusions can be drawn. The technique is in-
teresting as specimen preparation and testing are considerable faster and
consequently less costly than
J
1c
fracture toughness testing. In order to ob-
tain reasonable confidence interval widths it is necessary to use more than
six specimens.
It seems difficult to obtain room temperature quasi-static fracture tough-
ness values for DIEVAR at a hardness of about 40 HRC as it is difficult to
obtain stable crack growth during the
J
1c
testing.
K
1c
testing requires very
large specimens. This in turn requires a high capacity testing machine with
a large furnace and a COD gage with extremely long contact arms.
The energy absorption at the Charpy V-notch impact testing had the same
temperature dependence as the dynamic fracture toughness.
The results of the investigation indicate that, in order to have maximum
safety against catastrophic failure in hot-work tools of DIEVAR, the tool
should be pre-heated to at least 200
◦
C. A further increase in temperature
does not seem to give any benefit in the form of higher toughness. The rec-
ommendation is valid for DIEVAR at a hardness of 38 HRC. The minimum
recommended temperature for other steel grades and other hardness levels
34
6TH INTERNATIONAL TOOLING CONFERENCE
Figure 4.
K
J d
versus temperature. The large circles indicate mean values and the small
circles the 95% confidence interval for the mean value.
may be different. 38 HRC is a rather low hardness. It is used in certain types
of forging dies. The hardness of extrusion dies and die casting dies is gen-
erally higher than 38 HRC. For above mentioned reasons it may however
be difficult to measure quasi-static fracture toughness at higher hardness.
Stable crack growth is probably difficult to obtain during
J
1c
testing and the
size requirements still makes
K
1c
testing difficult.
REFERENCES
[1] Standard Test Method for Plane-Strain Fracture Toughness of Metallic Materials Annual
Book of ASTM Standards, Volume 03.01 1996, E399-90 American Society for Testing
and Materials
[2] Standard Test Method for J
1c
, A measure of Fracture Toughness Annual Book of ASTM
Standards, Volume 03.01 1996, E813-89 American Society for Testing and Materials
[3] Standard Practice for Determination of Fracture Toughness of Steels Using Equivalent
Energy Methodology Annual Book of ASTM Standards, Volume 03.01 1996, E992-84
American Society for Testing and Materials
[4] Standard Test Method for J
1c
, A measure of Fracture Toughness Annual Book of ASTM
Standards, Volume 03.01 1984, E813-81 American Society for Testing and Materials
Influence of the Temperature on the Toughness of UDDEHOLM DIEVAR
35
Figure 5.
Energy absorbed calculated from angle of rise of pendulum. The large circles
indicate mean values and the small circles the 95% confidence interval for the mean value.
[5] Charpy V-notch pendulum impact test - Instrumented test method EN ISO 14556:2000
[6] A SAXENA, in "Nonlinear Fracture Mechanics for Engineers", (CRC Press LLC,
1998) p. 62
36
6TH INTERNATIONAL TOOLING CONFERENCE
Figure 6.
Energy absorbed calculated from the load displacement curves. The large circles
indicate mean values and the small circles the 95% confidence interval for the mean value.
Figure 7.
Maximum load, F
m
, and general yield load, F
gy
, versus temperature. The
large circles indicate mean values and the small circles 95% confidence interval for the mean
value.
Influence of the Temperature on the Toughness of UDDEHOLM DIEVAR
37
Figure 8.
Total displacement versus temperature. The large circles indicate mean values
and the small circles the 95% confidence interval for the mean value
Figure 9.
Relationship between fracture toughness and specimen thickness [6]
Wyszukiwarka
Podobne podstrony:
3 The influence of intelligence on students' success
84 1199 1208 The Influence of Steel Grade and Steel Hardness on Tool Life When Milling
The influence of Aristotle on Alfarabi
Język angielski The influence of the media on the society
network memory the influence of past and current networks on performance
70 1003 1019 Influence of Surface Engineering on the Performance of Tool Steels for Die Casting
5 49 62 The Influence of Tramp Elements on The Spalling Resistance of 1 2343
The influence of British imperialism and racism on relationships to Indians
The Influence of Bodybuilding on Martial Arts Training
The effect of temperature on the nucleation of corrosion pit
Soliwoda, Katarzyna i inni The influence of the chain length and the functional group steric access
Conrad Hjalmar Nordby The Influence Of Old Norse Literature On English Literature
2000 Influence of Fiber Fermentability on Nutrient Digestion in the Dog
więcej podobnych podstron