United States
Department
of Agriculture
Economic
Research
Service
Electronic
Report
Economic
Information
Bulletin
Number 11
April 2006
The First Decade of
Genetically Engineered
Crops in the
United States
Jorge Fernandez-Cornejo
Margriet Caswell

w
w
w
.e
rs
.us
d
a
.
g
ov
Want to learn more about genetically engineered crops?
Visit our website at www.ers.usda.gov.
You can also find additional information about ERS
publications, databases, and other products at our
website.
Visit Our Website To Learn More!
National Agricultural Library
Cataloging Record:
Cover photos by Jack Dykinga (left) and Doug Wilson (right),
courtesy of Agricultural Research Service, USDA.
The U.S. Department of Agriculture (USDA) prohibits discrimination in all its programs and
activities on the basis of race, color, national origin, age, disability, and where applicable,
sex, marital status, familial status, parental status, religion, sexual orientation, genetic
information, political beliefs, reprisal, or because all or part of an individual’s income is derived
from any public assistance program (Not all prohibited bases apply to all programs.) Persons
with disabilities who require alternative means for communication of program information
(Braille, large print, audiotape, etc.) should contact USDA’s TARGET Center at (202) 720-2600
(voice and TDD). To file a complaint of discrimination, write to USDA, Director, Office of Civil Rights,
1400 Independence Avenue, S.W., Washington, D.C. 20250-9410, or call (800) 795-3272 (voice)
or (202) 720-6382 (TDD). USDA is an equal opportunity provider and employer.
Fernandez-Cornejo, Jorge
The first decade of genetically engineered crops in the United States.
(Economic information bulletin ; no. 11)
1. Transgenic plants—Seeds—United States—Marketing.
2. Diffusion of information—United States.
3. Agricultural biotechnology—Public opinion—Economic aspects.
I. Fernandez-Cornejo, Jorge. II. Caswell, Margiet F.
III. United States. Dept. of Agriculture. Economic Research Service.
SB123.57

The First Decade of Genetically Engineered Crops in the United States/EIB-11
Economic Research Service/USDA
United States
Department
of Agriculture
www.ers.usda.gov
An Electronic Report from the Economic Research Service
April 2006
Economic
Information
Bulletin
Number 11
The First Decade of
Genetically Engineered
Crops in the United States
Jorge Fernandez-Cornejo and Margriet
Caswell, with contributions from Lorraine
Mitchell, Elise Golan, and Fred Kuchler
Abstract
Ten years after the first generation of genetically engineered (GE) varieties
became commercially available, adoption of these varieties by U.S. farmers is
widespread for major crops. Driven by farmers’ expectations of higher yields,
savings in management time, and lower pesticide costs, the adoption of corn,
soybean, and cotton GE varieties has increased rapidly. Despite the benefits,
however, environmental and consumer concerns may have limited acceptance of
GE crops, particularly in Europe. This report focuses on GE crops and their
adoption in the United States over the past 10 years. It examines the three major
stakeholders of agricultural biotechnology and finds that (1) the pace of R&D
activity by producers of GE seed (the seed firms and technology providers) has
been rapid, (2) farmers have adopted some GE varieties widely and at a rapid rate
and benefited from such adoption, and (3) the level of consumer concerns about
foods that contain GE ingredients varies by country, with European consumers
being most concerned.
Keywords: genetically engineered crops, agricultural biotechnology, seed industry,
research and development, adoption, crop yields, pesticide use, corn, soybeans, cotton
Acknowledgements
The authors wish to thank William Lin, Paul Heisey, Keith Wiebe, Marca
Weinberg, Utpal Vasavada, and Mary Bohman of ERS for the helpful comments
provided on earlier drafts of this report. We also thank Andrew Rude from the
Foreign Agricultural Service, Neil E. Hoffman from the Animal and Plant Health
Inspection Service, John W. Radin from the Agricultural Research Service, Daniel
Jones from the Cooperative State Research, Education, and Extension Service,
and Matthew C. Rousu from Susquehanna University. We also thank Lou King
for editorial assistance and Anne Pearl for graphics and layout.

Contents
Summary . . . . . . . . . . . . . . . . . . . . . . . . . . . . . . . . . . . . . . . . . . . . . . . . . .iii
Introduction . . . . . . . . . . . . . . . . . . . . . . . . . . . . . . . . . . . . . . . . . . . . . . . .1
Rapid Change and Pace of R&D Activity Characterize
the Seed Industry and Technology Providers . . . . . . . . . . . . . . . . . . . . .2
From the Laboratory to the Field . . . . . . . . . . . . . . . . . . . . . . . . . . . . . . .3
Adoption of GE Crops by U.S. Farmers Increases Steadily . . . . . . . . . .8
U.S. Farmers Expect To Profit From Adopting GE Crops . . . . . . . . . . . .9
Adoption of GE Crops and Yields . . . . . . . . . . . . . . . . . . . . . . . . . . . . . . .9
Adoption and Net Returns, Household Income,
and Pesticide Use . . . . . . . . . . . . . . . . . . . . . . . . . . . . . . . . . . . . . . . . .10
Consumer Demands Affects R&D, Adoption, and
Marketing of GE-Derived Products . . . . . . . . . . . . . . . . . . . . . . . . . . . . .15
Adoption Offers Market Benefits to Many Stakeholders . . . . . . . . . . .19
Conclusion . . . . . . . . . . . . . . . . . . . . . . . . . . . . . . . . . . . . . . . . . . . . . . . . .21
References
. . . . . . . . . . . . . . . . . . . . . . . . . . . . . . . . . . . . . . . . . . . . . . . . .22
ii
The First Decade of Genetically Engineered Crops in the United States/EIB-11
Economic Research Service/USDA

Summary
Over the past decade, developments in modern biotechnology have
expanded the scope of biological innovations by providing new tools for
increasing crop yields and agricultural productivity. The role that biotech-
nology will play in agriculture in the United States and globally will depend
on a number of factors and uncertainties. What seems certain, however, is
that the ultimate contribution of agricultural biotechnology will depend on
our ability to identify and measure its potential benefits and risks.
What Is the Issue?
Ten years after the first generation of genetically engineered (GE) varieties
of major crops became commercially available, adoption of these varieties
by U.S. farmers has become widespread. United States consumers eat many
products derived from these crops—including some cornmeal, oils, sugars,
and other food products—largely unaware of their GE content. Despite the
rapid increase in the adoption of GE corn, soybean, and cotton varieties by
U.S. farmers, questions remain regarding the impact of agricultural biotech-
nology. These issues range from the economic and environmental impacts
to consumer acceptance.
What Did the Study Find?
This study examined the three major stakeholders in agricultural biotech-
nology: seed suppliers and technology providers, farmers, and
consumers.
Seed suppliers/technology providers. Strengthening of intellectual prop-
erty rights protection in the 1970s and 1980s increased returns to research
and offered greater incentives for private companies to invest in seed devel-
opment and crop biotechnology. Since 1987, seed producers have submitted
nearly 11,600 applications to USDA’s Animal and Plant Health Inspection
Service for field testing of GE varieties. More than 10,700 (92 percent) have
been approved. Approvals peaked in 2002 with 1,190. Most approved appli-
cations involved major crops, with nearly 5,000 for corn alone, followed by
soybeans, potatoes, and cotton. More than 6,600 of the approved applica-
tions included GE varieties with herbicide tolerance or insect resistance.
Significant numbers of applications were approved for varieties with
improved product quality, viral resistance, and enhanced agronomic proper-
ties such as drought and fungal resistance.
Farmers. Adoption of GE soybeans, corn, and cotton by U.S. farmers has
increased most years since these varieties became commercially available
in 1996. By 2005, herbicide-tolerant soybeans accounted for 87 percent of
total U.S. soybean acreage, while herbicide-tolerant cotton accounted for
about 60 percent of total cotton acreage. Adoption of insect-resistant crops
is concentrated in areas with high levels of pest infestation and varies
across States. Insect-resistant cotton was planted on 52 percent of cotton
acreage in 2005—ranging from 13 percent in California to 85 percent in
Louisiana. Insect-resistant corn accounted for 35 percent of the total
acreage in 2005, following the introduction of a new variety to control the
corn rootworm.
iii
The First Decade of Genetically Engineered Crops in the United States/EIB-11
Economic Research Service/USDA

The economic impact of GE crops on producers varies by crop and tech-
nology. Herbicide-tolerant cotton and corn were associated with increased
returns, as were insect-resistant cotton and corn when pest infestations were
more prevalent. Despite the rapid adoption of herbicide-tolerant soybeans,
there was little impact on net farm returns in 1997 and 1998. However, the
adoption of herbicide-tolerant soybeans is associated with increased off-
farm household income, suggesting that farmers adopt this technology
because the simplicity and flexibility of the technology permit them to save
management time, allowing them to benefit from additional income from
off-farm activities.
Genetically engineered crops also seem to have environmental benefits.
Overall pesticide use is lower for adopters of GE crops, and the adoption of
herbicide-tolerant soybeans may indirectly benefit the environment by
encouraging the adoption of soil conservation practices.
Consumers. Most surveys and consumer studies indicate consumers have at
least some concerns about foods containing GE ingredients, but these
concerns have not had a large impact on the market for these foods in the
United States. Despite the concerns of U.S. consumers, “GE-free” labels on
foods are not widely used in the United States. Manufacturers have been
active in creating a market for GE-free foods. Between 2000 and 2004,
manufacturers introduced more than 3,500 products that had explicit non-
GE labeling, most of them food products.
In the European Union and some other countries, however, consumer
concerns have spurred a movement away from foods with GE ingredients.
Despite the fact that some European consumers are willing to consume
foods containing GE ingredients, very few of these foods are found on
European grocery shelves.
How Was the Study Conducted?
This report examined the three major stakeholders of agricultural biotech-
nology: GE seed suppliers and technology providers (biotech firms),
farmers, and consumers. To examine biotech and seed firms, we used infor-
mation from the literature as well as from the database of USDA approvals
of field testing for new GE varieties. To study seed users, we drew on ERS
studies based on USDA farm surveys, and to review the consumer perspec-
tive, we summarized surveys of consumers’ attitudes from the literature.
iv
The First Decade of Genetically Engineered Crops in the United States/EIB-11
Economic Research Service/USDA

The First Decade of Genetically Engineered
Crops in the United States
Jorge Fernandez-Cornejo and Margriet Caswell,
with contributions from Lorraine Mitchell,
Elise Golan, and Fred Kuchler
Introduction
Over the past decade, developments in modern biotechnology have
expanded the scope of biological innovations by providing new tools for
increasing crop yields and agricultural productivity. Agricultural biotech-
nology is a collection of scientific techniques, including genetic engi-
neering, that are used to create, improve, or modify plants, animals, and
microorganisms. Genetic engineering (GE) techniques allow a precise alter-
ation of a plant’s traits (facilitating the development of characteristics not
possible through traditional plant breeding), and permit targeting of a single
plant trait (decreasing the number of unintended characteristics that may
occur with traditional breeding).
1
The commercial success of GE crop varieties typically requires that
biotechnology-derived trait enhancements be incorporated into successful
cultivars (cultivated varieties with useful agronomic properties), the devel-
opment of which requires significant knowledge of traditional plant
breeding and the availability of genetic material (germplasm). This comple-
mentarity has been related to various institutional arrangements between
seed and technology suppliers.
GE crops are often classified into one of three generations (Panos). Crops
with enhanced input traits, such as herbicide tolerance, insect resistance, and
tolerance to environmental stresses (like drought), represent the first genera-
tion. GE crops benefit farmers and may also offer environmental benefits.
Second-generation crops include those with added-value output traits, such
as nutrient enhancement for animal feed. Consumers will benefit directly
from these products when they are available on the market. The third gener-
ation includes crops that produce pharmaceuticals or improve processing of
bio-based fuels, and products beyond traditional food and fiber. At present,
adoption of GE crops is generally limited to those with first-generation traits,
which were tested on a large scale (field testing) in the 1980s to ensure that
the desired traits will perform under production conditions. Second- and
third-generation GE crops are in various stages of research and development.
Ten years after the first generation of GE varieties became commercially
available, they have been widely adopted by U.S. farmers, driven by expecta-
tions of higher yields, savings in management time, and lower pesticide costs.
Despite these benefits, environmental and consumer concerns may have
limited acceptance of agricultural biotechnology, particularly in Europe. In the
United States, foods containing GE ingredients currently available in the U.S.
market do not require labels, since the U.S. Food and Drug Administration
has determined that these foods are “substantially equivalent” to their non-GE
counterparts (Shoemaker et al., 2003; FDA, 1992). Thus, U.S. consumers
have been eating foods that contain GE ingredients (corn meal, oils, sugars)
for the past 10 years while remaining largely unaware of their GE content.
1
In the United States, under guidelines
issued by USDA’s Animal and Plant
Health Inspection Service (as pub-
lished in the Federal Register,
7CFR340: 340.1), genetic engineering
is defined as “the genetic modification
of organisms by recombinant DNA
techniques” (Fernandez-Cornejo and
McBride, 2000). A full biotechnolo-
gy glossary is in USDA (2005).
1
The First Decade of Genetically Engineered Crops in the United States/EIB-11
Economic Research Service/USDA

Rapid Change and Pace of R&D Activity
Characterize the Seed Industry and
Technology Providers
The U.S. commercial seed market is the world’s largest—with an estimated
annual value of $5.7 billion per year in the late 1990s—followed by China
at $3 billion and Japan at $2.5 billion (Fernandez-Cornejo, 2004). Moreover,
the U.S. seed market is growing (in quantity and value), mainly because
farmers have been increasing purchases of seed and reducing the planting of
saved seed. Growth in the seed market has been particularly rapid for major
field crops—corn, soybeans, cotton, and wheat—that together constituted
two-thirds of the seed market value in 1997.
The U.S. seed industry began a transformation in the 1930s, with the intro-
duction of commercially viable hybrid seeds. These hybrids were higher
yielding than nonhybrid varieties but degenerative, so farmers had to
purchase new seed every year to maintain the high yields. Further changes
were motivated by the strengthening of intellectual property rights (IPR)
protection, mainly during the 1970s and 1980s, which increased returns to
research and offered a greater incentive for private companies to invest in
seed development. The two principal forms of legal protection are plant
variety protection (PVP) certificates issued by the Plant Variety Protection
Office of USDA and patents issued by the U.S. Patent and Trademark
Office. Both grant private crop breeders exclusive rights to multiply and
market their newly developed varieties. However, patents provide more
control since PVP certificates have a research exemption allowing others to
use the new variety for research purposes. Agricultural biotechnology
patents, mostly dealing with some aspect of plant breeding, have outpaced
the general upward trend in patenting throughout the U.S. economy. During
1996-2000, 75 percent of over 4,200 new agricultural biotech patents went
to private industry (King and Heisey).
Enhanced protection of intellectual property rights brought rapid increases
in private research and development (R&D) investments and changes in
market concentration in the U.S. seed industry. R&D expenditures on plant
breeding for many major crops shifted from mainly public to mainly private.
Private spending on crop variety R&D increased fourteenfold between 1960
and 1996 (adjusted for inflation), while public expenditures changed little
(Fernandez-Cornejo, 2004).
As the amount of private capital devoted to R&D in the seed industry grew
rapidly, the number of private firms engaged in plant breeding also grew,
until peaking in the early 1990s. Subsequently, the seed industry consoli-
dated, with fewer firms capable of sustaining the research investment
needed to develop new seed varieties. Mergers and acquisitions created a
seed industry structure dominated by large companies with primary invest-
ments in related sectors, such as pharmaceutical, petrochemical, and food
(Fernandez-Cornejo, 2004).
2
In the early 1980s, developments in biological sciences created an additional
incentive for private firms to increase their investment in R&D and seed
production. As the first products of crop biotechnology were tested on a
large scale in the 1980s, the seed industry’s structure underwent additional
2
The First Decade of Genetically Engineered Crops in the United States/EIB-11
Economic Research Service/USDA
2
Some firms evolved in the 1990s
toward developing “life sciences”
complexes organized around the devel-
opment of products such as agricultur-
al chemicals, seeds, foods and food
ingredients, and pharmaceuticals based
on applications of related research in
biotechnology and genetics. However,
most of those life sciences companies
have since divested their agricultural
operations after “failing to realize
adequate returns on their investments”
(Shoemaker et al., 2003, p.32;
Fernandez-Cornejo, 2004, p.42).

transformation. Companies sought to achieve economies of scale to offset
the high costs of biotechnology R&D through an extensive process of
mergers, acquisitions, and joint ventures. Chemical and seed businesses
combined to take advantage of strong demand complementarities between
products (Just and Hueth, 1993). For example, the herbicide glyphosate and
soybean seeds tolerant to glyphosate are sold by the same firm. As a conse-
quence of the merger activity, the seed industry became more concentrated.
By 1997, the share of U.S. seed sales (including GE and conventional vari-
eties) controlled by the four largest firms providing seed of each crop
reached 92 percent for cotton, 69 percent for corn, and 47 percent for
soybeans (table 1).
From the Laboratory to the Field
A critical part of new variety development is field-testing to ensure that the
desired traits will perform under production conditions. The release of new
GE varieties of organisms into the environment is regulated through field
release permits and monitored by USDA’s Animal and Plant Health Inspec-
tion Service (APHIS) (see box, “Regulatory Oversight”). The number of
field releases of plant varieties for testing purposes provides a useful indi-
cator of R&D efforts on crop biotechnology.
By early April 2005, nearly 11,600 applications had been received by
APHIS since 1987 and more than 10,700 (92 percent) had been approved
(Virginia Polytechnic Institute and State University, 2005). Approvals
peaked in 2002 with 1,190 (fig. 1). Most applications approved for field
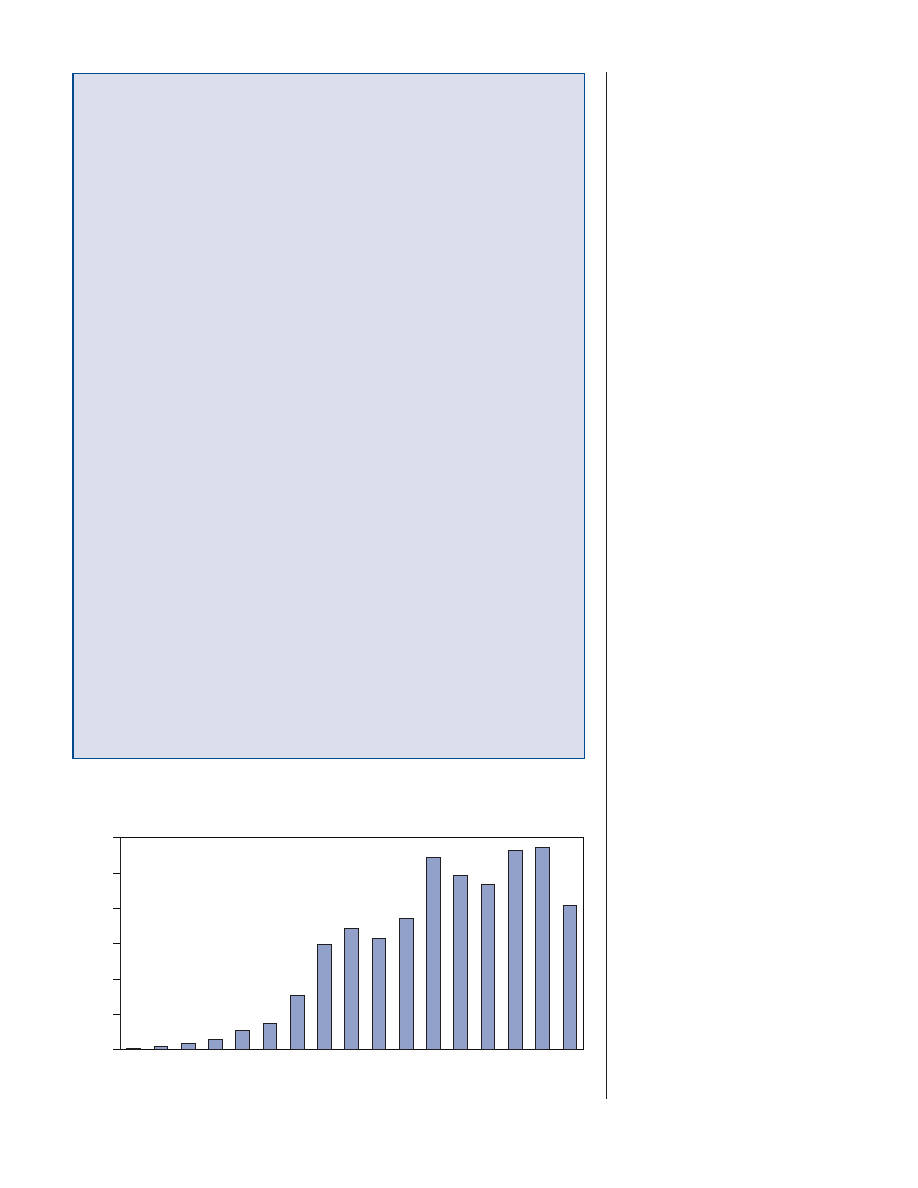
testing involved major crops, particularly corn with nearly 5,000 applica-
tions approved, followed by soybeans, potatoes, cotton, tomatoes, and wheat
(fig. 2). Applications approved between 1987 and early April 2005 included
GE varieties with herbicide tolerance (3,587), insect resistance (3,141),
improved product quality (flavor, appearance, or nutrition) (2,314), virus
resistance (1,239), and agronomic properties like drought resistance (1,043)
and fungal resistance (647) (fig. 3).
3
The First Decade of Genetically Engineered Crops in the United States/EIB-11
Economic Research Service/USDA
Table 1
Estimated U.S. seed market shares for major field crops, 1997
Company
Corn Soybean
Cotton
Pioneer Hi-Bred
42.0
19.0
Monsanto
1
14.0
19.0
11.0
Novartis 9.0
5.0
Delta & Pine Land
2
73.0
Dow Agrosciences/Mycogen
4.0
4.0
California Planting Seed Distributors
6.0
All-Tex
2.0
Four largest total
69.0
47.0
92.0
1
Monsanto acquired DeKalb in 1997 and Asgrow in 1998.
2
The merger proposed between Monsanto and Delta & Pine Land in 1998 was called off in
December 1999.
Source: Fernandez-Cornejo, 2004.
4
The First Decade of Genetically Engineered Crops in the United States/EIB-11
Economic Research Service/USDA
Regulatory Oversight
Before commercial introduction, genetically engineered crops must conform to
standards set by State and Federal statutes (USDA, 2005). Under the Coordi-
nated Framework for the Regulation of Biotechnology, Federal oversight is
shared by the U.S. Department of Agriculture (USDA), the U.S. Environmental
Protection Agency (EPA), and the U.S. Food and Drug Administration (FDA).
USDA’s Animal and Plant Health Inspection Service (APHIS) plays a central
role in regulating field-testing of agricultural biotechnology products. Through
either a notification or permit procedure, such products, which include geneti-
cally engineered plants, microorganisms, and invertebrates, are considered “regu-
lated articles.” APHIS determines whether to authorize the test, based on
whether the release will pose a risk to agriculture or the environment. After
years of field tests, an applicant may petition APHIS for a determination of
nonregulated status in order to facilitate commercialization of the product. If,
after extensive review, APHIS determines that the unconfined release does not
pose a significant risk to agriculture or the environment, the organism is “de-
regulated.” At this point, the organism is no longer considered a regulated article
and can be moved and planted without APHIS authorization (USDA, 2004).
If a plant is engineered to produce a substance that “prevents, destroys, repels,
or mitigates a pest,” it is considered a pesticide and is subject to regulation by
EPA (Federal Register, November 23, 1994). FDA regulates all food applica-
tions of crops, including those crops that are developed through the use of
biotechnology, to ensure that foods derived from new plant varieties are safe to
eat. A more complete description of the EPA and FDA regulations of GE prod-
ucts may be found in EPA (2003) and FDA (1992, 2005).
Though the current regulatory system is considered to be effective, USDA,
EPA, and FDA continuously look forward and make necessary changes to
address new trends and issues of the future. For example, USDA’s APHIS has
made updates in 1993 and 1997 and is currently considering the need for addi-
tional changes in the regulations (USDA, 2004). The National Academy of
Sciences also issued a report that made recommendations suggesting that regu-
lation “could be improved further” by making the process more “transparent
and rigorous” by enhanced scientific peer review, solicitation of public input,
and “more explicit presentation of data, methods, analyses, and interpretations”
(NRC, 2003).
Figure 1
Permits for release of GE varieties approved by APHIS
Source: Virginia Polytechnic Institute and State University, 2005.
1987 89 91 93 95 97 99
0
200
400
600
800
1,000
1,200
2000 01 03
APHIS approvals for field testing also provide an indication of products that
are in development and that may come “through the pipeline” in the future
(table 2). In addition to crops with improved pest management traits,
approvals include crops with traits that provide viral/fungal resistance,
favorable agronomic properties (resistance to cold, drought, salinity, more
efficient use of nitrogen), enhanced product quality (delayed ripening,
increased protein and oil content, modified starch content, nutraceuticals
(added vitamins, iron, antioxidants such as beta-carotene), and pharmaceuti-
cals. Additional information may be found in Runge and Ryan and in Pew
Initiative on Food and Biotechnology (2001).
After extensively field-testing a GE variety, an applicant may petition
APHIS to deregulate (grant nonregulated status) the variety. If, after exten-
sive review, APHIS determines that the new variety poses no significant risk
5
The First Decade of Genetically Engineered Crops in the United States/EIB-11
Economic Research Service/USDA
552
724
747
843
358
4,968
2,560
Corn
Soybeans
Potato
Cotton
Tomato
Wheat
Other
Figure 2
Total number of permits approved by APHIS, by crop
Source: Virginia Polytechnic Institute and State University, 2005.
1,043
1,239
2,314
3,141
647
716
3,587
550
Herbicide tolerance
Insect resistance
Product quality
Virus resistance
Agronomic properties
Fungal resistance
Marker gene
Other
Figure 3
Total number of permits approved by APHIS, by GE trait
Source: Virginia Polytechnic Institute and State University, 2005.

to agriculture or the environment, permission is granted (see box, “Regula-
tory Oversight”). As of April 2005, APHIS had received 103 petitions for
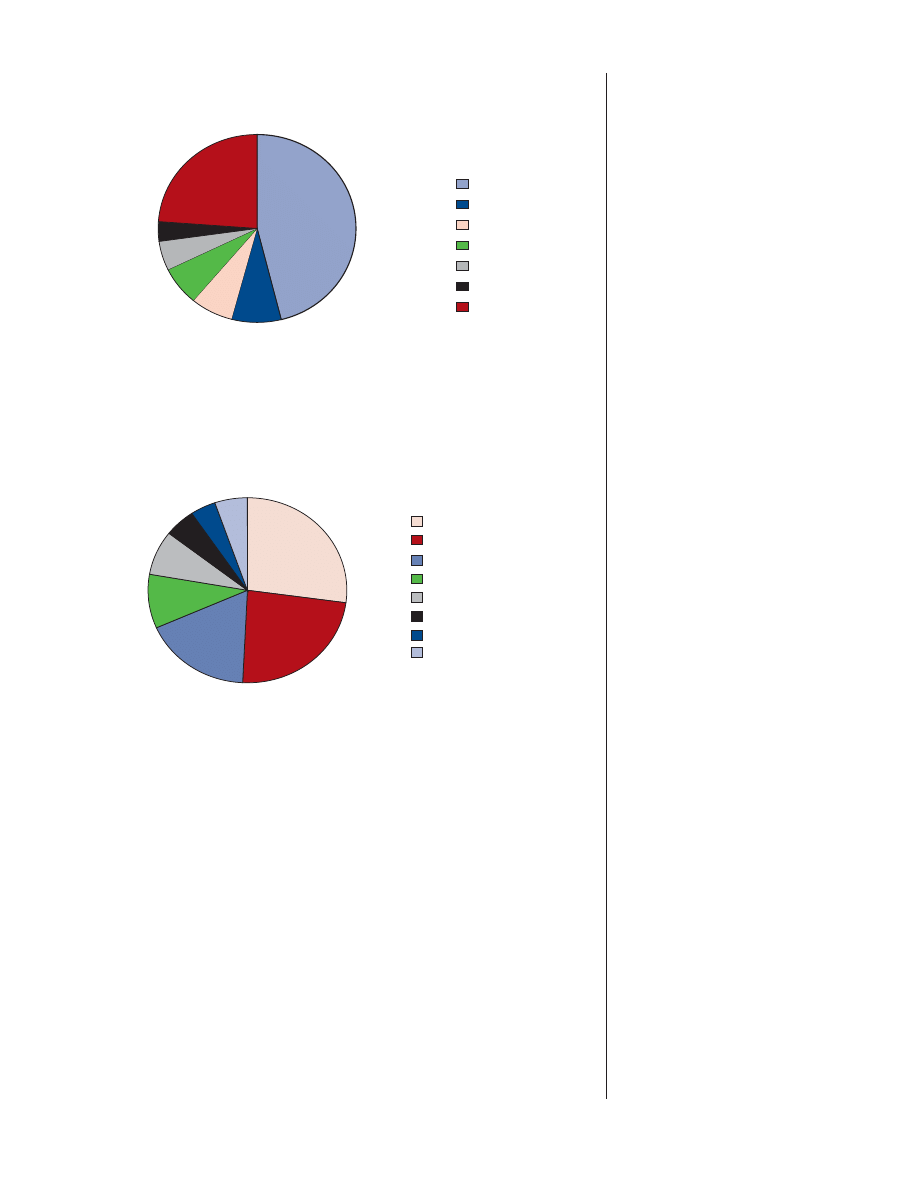
deregulation and had granted 63 (fig. 4). Thirty-six percent of the released
varieties have herbicide-tolerance traits, 27 percent have insect-resistance
traits, and 17 percent have product-quality traits (fig. 5).
6
The First Decade of Genetically Engineered Crops in the United States/EIB-11
Economic Research Service/USDA
Table 2
Biotech crops currently available and in development in the United States
Input traits
Output traits
Crop
Herbicide
Insect
Viral/fungal
Agronomic
Product quality
11
Nutraceuticals;
tolerance
resistance
resistance
properties
9
pharmaceuticals;
industrial
13
Corn C
C
5
D
D
D
D
Soybeans
C
D
D
D
Cotton
C
C
6
D
D
Potatoes
W
7
D
D
D
D
Wheat
C
2
D
Other field crops
1
C
3
D
4
D
D
D
D
D
Tomato, squash, melon
D
D
W
12
D
D
Other vegetables
D
D
Papaya
C
8
Fruit trees
D
D
Other trees
D
10
D
Flowers
D
C = Currently available; D = In various stages of development and testing; W = Withdrawn from the market.
Sources: Virginia Polytechnic Institute and State University; USDA, APHIS; Colorado State University; Shoemaker et al.; Pew.
1
Includes barley, canola, peanuts, tobacco, rice, alfalfa, etc.
2
Monsanto discontinued breeding and field-level research on its GE Roundup Ready wheat in 2004.
3
Canola.
4
Barley, rice, sugar beets.
5
Bt corn to control the corn borer commercially available since 1996; Bt corn for corn rootworm control commercially available since 2003.
6
Bt cotton to control the tobacco budworm, the bollworm, and the pink bollworm, commercially available since 1996.
7
Bt potatoes, containing built-in resistance to the Colorado potato beetle, were commercially introduced in 1996 and withdrawn in 1999.
8
In the mid 1990s, researchers at Cornell University and at the University of Hawaii developed two virus-resistant varieties of GE papaya. First
commercial plantings were made in 1998. The new varieties were proved successful in resisting a viral epidemic and were planted on more than
30 percent of Hawaii’s papaya acreage in 1999.
9
Resistance to cold, drought, frost, salinity; more efficient use of nitrogen; increased yield.
10
Modified lignin content (for example, to reduce cost of paper making from trees).
11
Includes delayed ripening; increased protein, carbohydrate, fatty acid, micronutrient, oil, and modified starch content; enhanced flavor and tex-
ture (fruits and vegetables); color (cotton, flowers); fiber properties (cotton); gluten content; natural decaffeination; and low phytase.
12
Tomato genetically engineered to remain on the vine longer and ripen to full flavor after harvest; currently withdrawn from the market
(Colorado State University, 2004).
13
Includes increased vitamin, iron, beta-carotene content; antibodies, vaccines; specialty machine oils.
7
The First Decade of Genetically Engineered Crops in the United States/EIB-11
Economic Research Service/USDA
Source: Virginia Polytechnic Institute and State University, 2005.
Figure 5
Petitions for deregulation approved by APHIS, by GE trait
6
9
13
21
2
28
Herbicide tolerance
Insect resistance
Product quality
Virus resistance
Agronomic properties
Other
Source: Virginia Polytechnic Institute and State University, 2005.
11
5
9
5
7
8
17
1
Corn
Soybeans
Cotton
Potato
Tomato
Rapeseed
Rice
Other
Figure 4
Petitions for deregulation approved by APHIS, by crop
Adoption of GE Crops by U.S. Farmers
Increases Steadily
Farmers are more likely to adopt new practices and technologies if they
expect to benefit from them. Benefits are usually thought of in monetary
terms, but can also include ease of operation, time savings, lower exposure
to chemicals, and other factors. Farmers choose technologies and practices
they expect to yield the greatest benefit based on their own preferences,
farm characteristics, demand for their product, and costs.
Farmers’ expectations of higher yields, savings in management time, and
lower pesticide costs have driven a rapid increase in the adoption of GE
crop varieties in the United States and several other countries. An estimated
200 million acres of GE crops with herbicide tolerance and/or insect resist-
ance traits were cultivated in 17 countries worldwide in 2004, a 20-percent
increase over 2003. U.S. acreage accounts for 59 percent of this amount,
followed by Argentina (20 percent), Canada and Brazil (6 percent each), and
China (5 percent) (ISAAA, 2004).
3
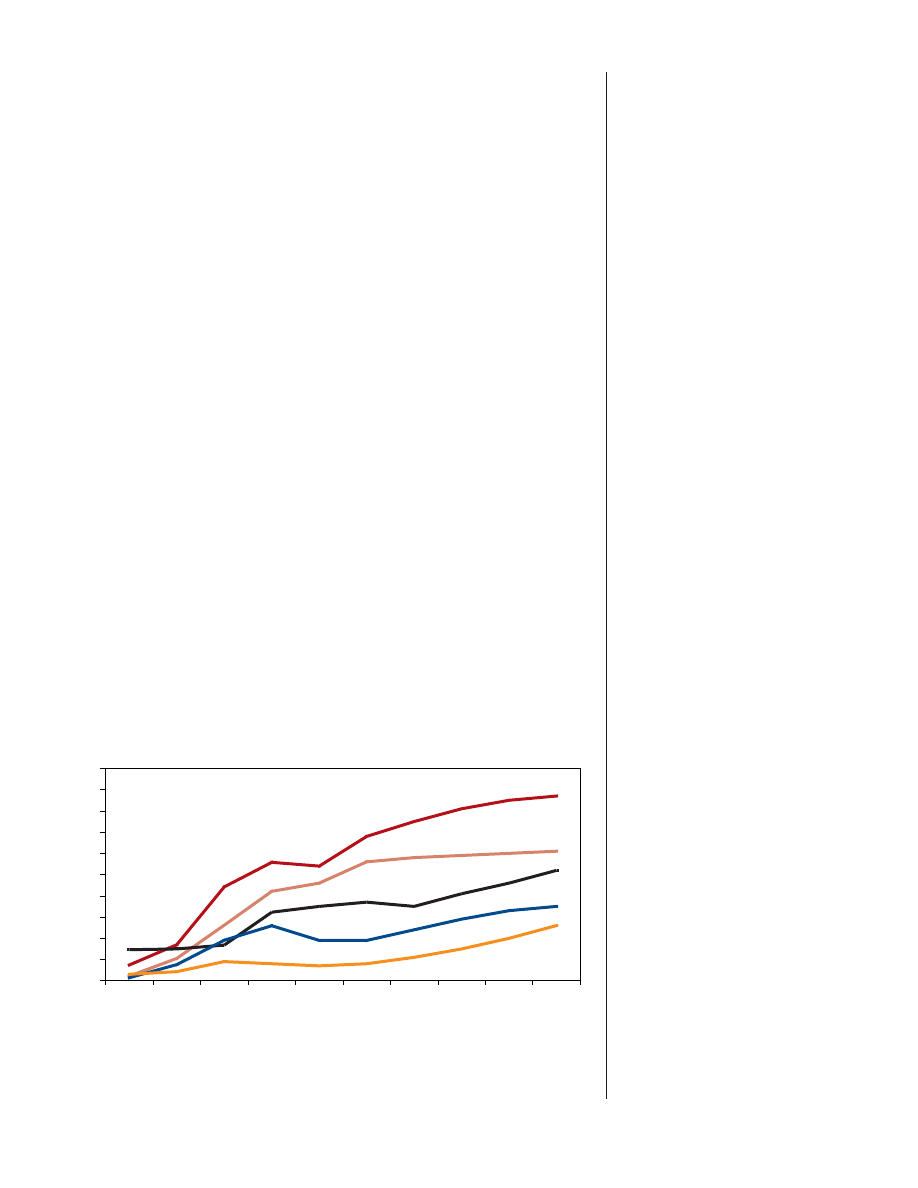
GE varieties of soybeans, corn, and cotton have been available commer-
cially in the United States since 1996, and the rate of adoption by U.S.
farmers has climbed in most years since then (fig. 6). For the most part,
farmers have adopted herbicide-tolerant (HT) varieties—which help control
weeds by enabling
crops to survive certain herbicides that previously would
have destroyed them along with the targeted weeds—at a faster pace than
insect-resistant (Bt) varieties.
Weeds are such a pervasive pest for soybeans, corn, and cotton that over 90
percent of U.S. planted acreage for each crop has been treated with herbi-
cides in recent years. The acreage share for HT soybeans has expanded
more rapidly than that for HT varieties of cotton and corn, reaching 87
percent of U.S. soybean acreage in 2005.
3
Also, there has been an upward trend
in the adoption of “stacked gene” vari-
eties (with traits of herbicide tolerance
and insect resistance) in the case of
cotton and corn.
8
The First Decade of Genetically Engineered Crops in the United States/EIB-11
Economic Research Service/USDA
*Data for each crop category include varieties with both HT and Bt (stacked) traits.
Source: Fernandez-Cornejo (2005).
Figure 6
Adoption of genetically engineered crops grows steadily in the U.S.*
0
10
20
30
40
50
60
70
80
90
1996
1997
1998
1999
2000
2001
2002
2003
2004
2005
100
Percent of acres
HT Soybeans
HT Cotton
Bt Corn
Bt Cotton
HT Corn

Insect-resistant crops contain a gene from the soil bacterium Bacillus
thuringiensis (Bt) that produces a protein toxic to specific insects. Acreage
shares for Bt cotton and corn are lower than those for HT soybeans and
cotton, and adoption is more concentrated in areas with a high level of
infestation of targeted pests (insect infestation varies much more widely
across locations than does weed infestation). Farmers planted Bt cotton to
control tobacco budworm, bollworm, and pink bollworm on 52 percent of
U.S. cotton acreage in 2005. Bt corn, originally developed to control the
European corn borer, was planted on 35 percent of corn acreage in 2005, up
from 24 percent in 2002. The recent increase in acreage share may be
largely due to the commercial introduction in 2003/04 of a new Bt corn
variety that is resistant to the corn rootworm, a pest that may be even more
destructive to corn yield than the European corn borer (Comis).
Other GE crops planted by U.S. farmers over the past 10 years include HT
canola, virus-resistant papaya, and virus-resistant squash (table 2). In addi-
tion, Bt potato varieties were introduced in 1996 but withdrawn from the
market after the 2001 season, and a tomato variety genetically engineered to
remain on the vine longer and ripen to full flavor after harvest was intro-
duced in 1994 but was withdrawn from the market after being available
sporadically for several years.
U.S. Farmers Expect To Profit From
Adopting GE Crops
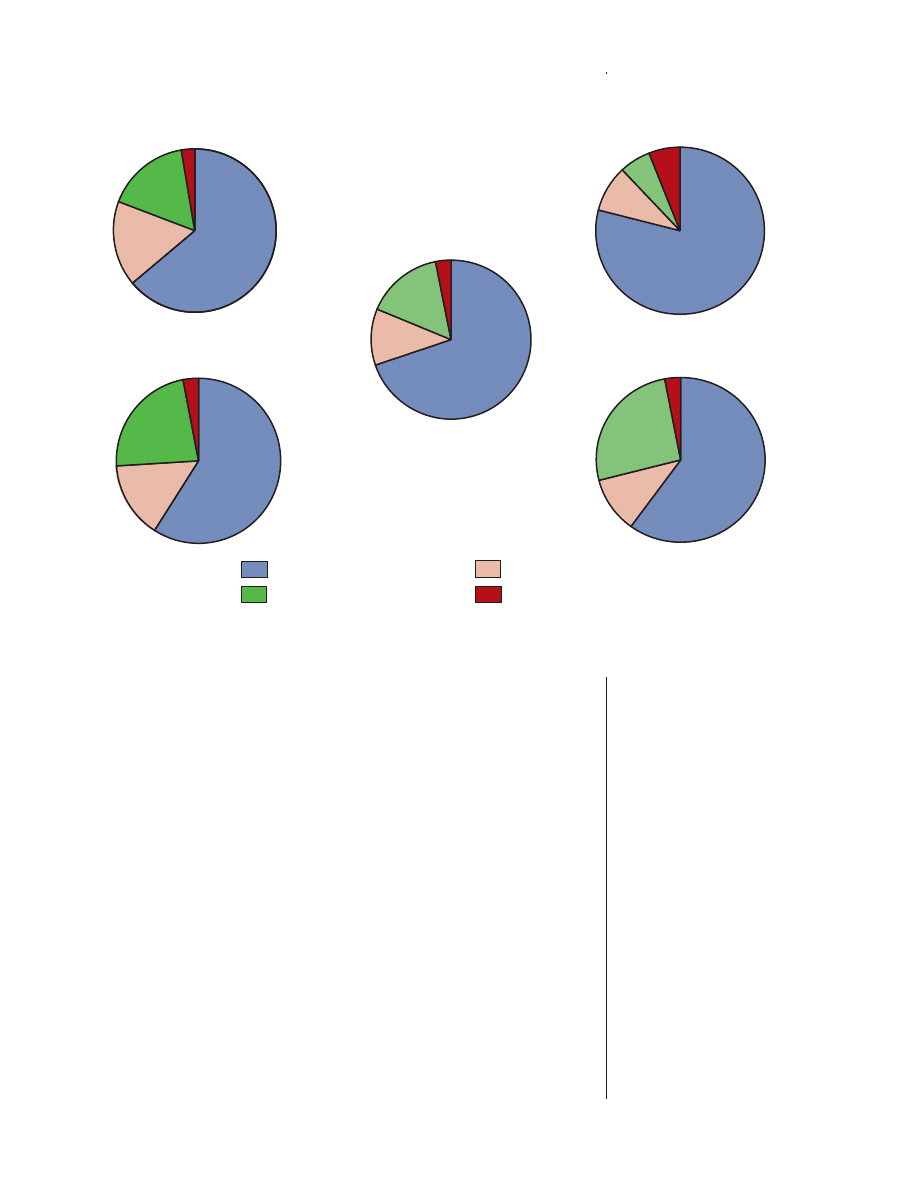
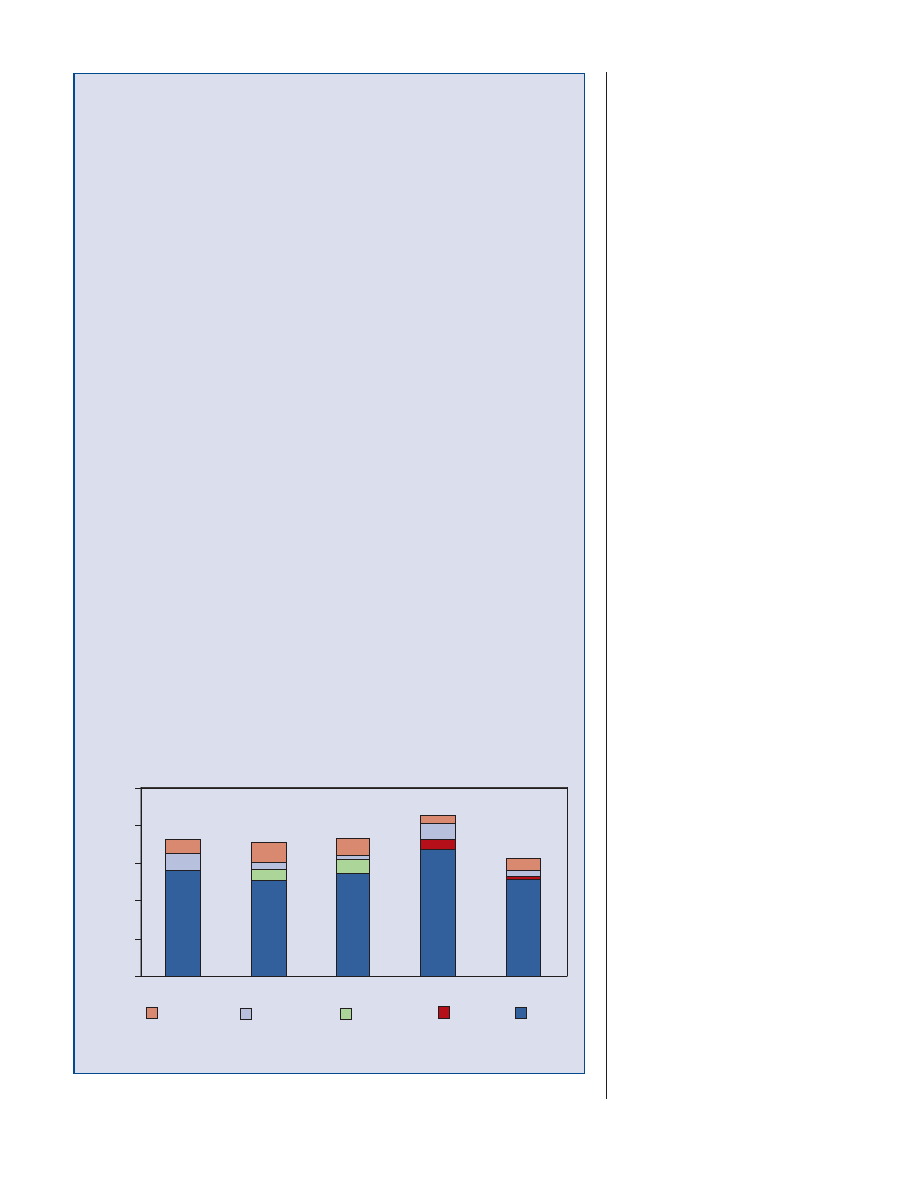
According to USDA’s Agricultural and Resource Management Surveys
(ARMS) conducted in 2001-03, most of the farmers adopting GE corn,
cotton, and soybeans indicated that they did so mainly to increase yields
through improved pest control (fig. 7). Other popular reasons for adopting
GE crops were to save management time and make other practices easier
and to decrease pesticide costs. These results confirm other studies showing
that expected profitability increases through higher yields and/or lower costs
(operator labor, pesticides) positively influence the adoption of agricultural
innovations.
Adoption of GE Crops and Yields
Currently available GE crops do not increase the yield potential of a hybrid
variety. In fact, yield may even decrease if the varieties used to carry the
herbicide-tolerant or insect-resistant genes are not the highest yielding culti-
vars.
4
However, by protecting the plant from certain pests, GE crops can
prevent yield losses compared with non-GE hybrids, particularly when pest
infestation is high. This effect is particularly important for Bt crops. For
example, before the commercial introduction of Bt corn in 1996, the Euro-
pean corn borer was only partially controlled using chemical insecticides.
Chemical use was not always profitable, and timely application was diffi-
cult. Many farmers accepted yield losses rather than incur the expense and
uncertainty of chemical control. For those farmers, the use of Bt corn
resulted in yield gains rather than pesticide savings. On the other hand, a
recently introduced Bt corn trait selected for resistance against the corn
rootworm, previously controlled using chemical insecticides, may provide
substantial insecticide savings.
5
9
The First Decade of Genetically Engineered Crops in the United States/EIB-11
Economic Research Service/USDA
4
This yield decrease occurred mostly
in early years. HT or Bt genes were
introduced into high-yielding cultivars
in later years.
5
Entomologists estimate that the corn
rootworm causes up to $1 billion in
corn yield losses and insecticide
expenditures annually in the U.S.
(Comis).
Many field tests and farm surveys have examined the yield and cost effects
of using GE crops (table 3). The majority of the results show GE crops
produce higher yields than conventional crops.
A 2002 ERS study found that increases in cotton yields in the Southeast
were associated with the adoption of HT and Bt cotton in 1997—a 10-
percent increase in HT cotton acreage led to a 1.7-percent increase in yield
and a 10-percent increase of Bt cotton acreage led to a 2.1-percent increase
in yield. Increases in soybean yields associated with the adoption of HT
soybeans were statistically significant but small (Fernandez-Cornejo and
McBride, 2002).
6
A more recent ERS study using 2001 survey data found that, on average,
actual corn yield was 12.5 bushels per acre higher for Bt corn than for conven-
tional corn, an increase of 9 percent (Fernandez-Cornejo and Li, 2005).
7
Adoption and Net Returns, Household Income,
and Pesticide Use
The impacts of GE crop adoption on U.S. farmers vary by crop and tech-
nology. Many studies have assessed the effects of the adoption of GE crops
10
The First Decade of Genetically Engineered Crops in the United States/EIB-11
Economic Research Service/USDA
Figure 7
Farmers’ reasons for adopting GE crops
63%
17%
17%
3%
HT soybeans
11%
15%
7%
HT corn
67%
9%
6%
6%
Bt corn
79%
15%
23%
3%
Bt cotton
11%
26%
3%
HT cotton
60%
59%
Increase yields Decrease pesticide input cost
Save management time and Other
make other practices easier
Source: Compiled by USDA’s Economic Research Service using data from 2001, 2002, and 2003 Agricultural Resource Management Survey.
6
The study used an econometric model
that takes into consideration that farm-
ers’ adoption of GE crops and pesticide
use decisions may be simultaneous and
that farmers are not assigned randomly
to the two groups (adopters and non-
adopters) but that they make the adop-
tion choices themselves. Therefore,
adopters and nonadopters may be sys-
tematically different. Differences may
manifest themselves in farm perform-
ance and could be confounded with dif-
ferences due to adoption. This self-
selectivity may bias the results, unless
corrected. To account for simultaneity
and self-selectivity, the model uses a
two-stage econometric model.
7
In addition, results using an economet-
ric model with the 2001 data showed a
small but statistically significant yield
increase associated with farmers who
adopted Bt corn relative to those using
conventional corn varieties. (Fernandez-
Cornejo and Li, 2005).

on returns and pesticide use, and the results of these studies are summarized
in table 3. ERS researchers found that:
Planting HT cotton and HT corn was associated with increased producer
net returns, but HT corn acreage was limited.
8
The limited acreage on
which HT corn has been adopted is likely to be acreage with the greatest
comparative advantage for this technology. The positive financial associa-
tion with adoption may also be due to low premiums for HT corn seed rela-
tive to conventional varieties in an attempt to expand market share
(Fernandez-Cornejo and McBride, 2002).
Adoption of Bt cotton and corn was associated with increased returns
when pest pressures were high. The adoption of Bt cotton had a positive
association with producer net returns in 1997, but the association was nega-
tive for Bt corn in 1998. This suggests that Bt corn may have been used on
some acreage where the (ex post) value of protection against the European
corn borer was lower than the premium paid for the Bt seed. Because pest
infestations vary from one region to another and from one year to another,
the economic benefits of Bt corn are likely to be greatest where pest pres-
sures are most severe. Farmers must decide to use Bt corn before they
know what the European corn borer pest pressure will be that year, and
damage caused by the European corn borer varies from year to year. Some
farmers may have incorrectly forecast infestation levels, corn prices, and/or
yield losses due to pest infestations, resulting in “overadoption.” Also,
producers may be willing to pay a premium for Bt corn because it reduces
the risk of significant losses if higher-than-expected pest damage does occur
(Fernandez-Cornejo and McBride, 2002).
Despite the rapid adoption of HT soybeans by U.S. farmers, no significant
association with net farm returns was evident in 1997 or 1998. The lack
of increased profitability for some farmers who adopted HT soybeans
suggests that factors other than those included in traditional farm returns
calculations may be driving adoption for these farmers. In particular, weed
control may become simpler and require less management time, which
allows growers of HT soybeans to control a wide range of weeds and makes
harvest easier and faster. One important alternative use of management time
is off-farm employment by farm operators and their spouses (Fernandez-
Cornejo and McBride, 2002).
Adoption of HT soybeans is associated with increased household income.
Recent ERS research showed that adoption of HT soybeans was associated
with a significant increase in off-farm household income for U.S. soybean
farmers. On-farm household income is not significantly associated with
adoption but total farm household income is significantly higher for
adopters, suggesting that most managerial time saved by adopters is used in
off-farm work (Fernandez-Cornejo et al., 2005).
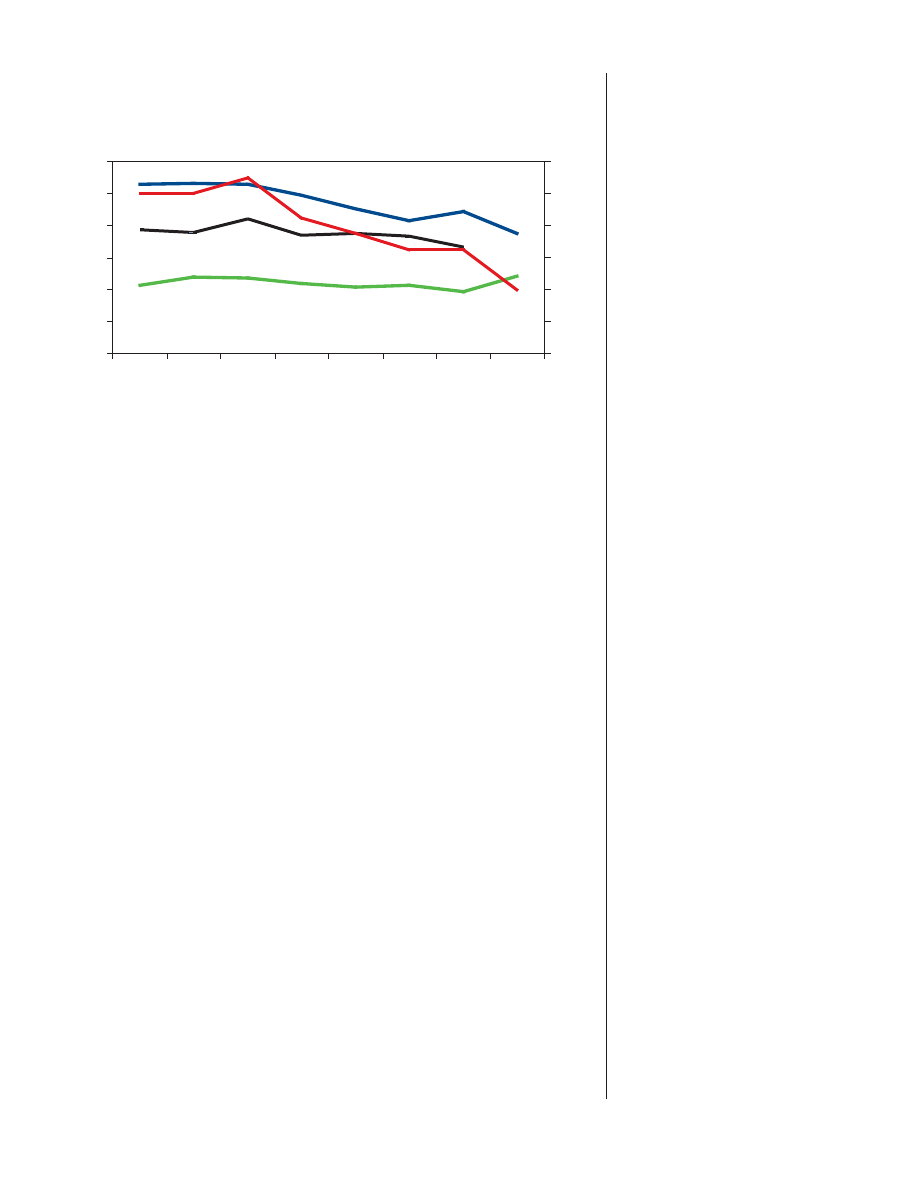
Adoption of GE crops is associated with reduced pesticide use. Pesticide
use rates (in terms of active ingredient) on corn and soybeans have declined
since the introduction of GE corn and soybeans in 1996 (fig. 8). In addi-
tion, ERS research suggests that, controlling for other factors, pesticide use
declined with adoption. There was an overall reduction in pesticide use
associated with the increased adoption of GE crops (Bt and HT cotton, HT
11
The First Decade of Genetically Engineered Crops in the United States/EIB-11
Economic Research Service/USDA
8
Net returns equal revenues minus
variable costs, which include pesticide
and seed costs. Seed costs paid by
adopters of GE varieties include a
technology fee paid by farmers to
biotechnology developers and premi-
ums to seed firms.

12
The First Decade of Genetically Engineered Crops in the United States/EIB-11
Economic Research Service/USDA
Table 3
Summary of primary studies on the effects of genetically engineered crops on yields,
pesticide use, and returns
Data
Effects on
Crop/researchers/
source
date of publication
Yield
Pesticide use
Returns
Herbicide-tolerant soybeans
Delannay et al., 1995
Experiments
Same
na
na
Roberts et al., 1998
Experiments
Increase
Decrease
Increase
Arnold et al., 1998
Experiments
Increase
na
Increase
Marra et al., 1998
Survey
Increase
Decrease
Increase
Fernandez-Cornejo et al., 2002
1
Survey
Small increase
Small increase
Same
McBride & El-Osta, 2002
2
Survey
na
na
Same
Duffy, 2001
Survey
Small decrease
na
Same
Herbicide-tolerant cotton
Vencill, 1996
Experiments
Same
na
na
Keeling et al., 1996
Experiments
Same
na
na
Goldman et al., 1998
Experiments
Same
na
na
Culpepper and York, 1998
Experiments
Same
Decrease
Same
Fernandez-Cornejo et al., 2000
1
Survey
Increase
Same
Increase
Herbicide-tolerant corn
Fernandez-Cornejo
and Klotz-Ingram, 1998
Survey
Increase
Decrease
Same
McBride & El-Osta, 2002
2
Survey
na
na
Increase
Bt cotton
Stark, 1997
Survey
Increase
Decrease
Increase
Gibson et al., 1997
Survey
Increase
na
Increase
ReJesus et al., 1997
Experiments
Same
na
Increase
Bryant et al., 1999
3
Experiments
Increase
na Increase
Marra et al., 1998
Survey
Increase
Decrease
Increase
Fernandez-Cornejo et al., 2000
1
Survey
Increase
Decrease
Increase
Bt corn
Rice and Pilcher, 1998
Survey
Increase
Decrease
Depends on infestation
Marra et al., 1998
Survey
Increase
Decrease
Increase
Benbrook, 2001
Survey
Increase
na
Decrease
McBride & El-Osta, 2002
2
Survey
na
na
Decrease
Duffy, 2001
Survey
Increase
na
Same
Pilcher et al., 2002
Survey
Increase
Decrease
na
Baute, Sears, and Schaafsma, 2002
Experiments
Increase
na
Depends on infestation
Dillehay et al., 2004
4
Experiments
Increase
na
na
Fernandez-Cornejo & Li, 2005
5
Survey
Increase
Decrease
na
na = not analyzed in the study.
1
Results using 1997 data.
2
Results using 1998 data.
3
Results are for 1996 and 1998. Results were different in 1997 when pest pressure was low.
4
Results using 2000-2002 data.
5
Results using 2001 data.
6
Net returns equal revenues minus variable costs.
corn, and HT soybeans combined, using 1997/1998 data), resulting in a
significant reduction in potential exposure to pesticides (Fernandez-Cornejo
and McBride, 2002). Overall pesticide use on corn, soybeans, and cotton
declined by about 2.5 million pounds, despite the slight increase in the
amount of herbicides applied to soybeans. In addition, glyphosate used on
HT crops is less than one-third as toxic to humans, and not as likely to
persist in the environment as the herbicides it replaces (Fernandez-Cornejo
and McBride, 2002).
More recently, using 2001 data, ERS found that insecticide use was 8
percent lower per planted acre for adopters of Bt corn than for nonadopters
(Fernandez-Cornejo and Li, 2005).
9
The ERS results generally agree with field-test and other farm surveys that
have examined the effects of using GE crops (table 3). The majority of
those results show that pesticide use for adopters of GE crops is lower than
for users of conventional varieties.
Adoption of HT soybeans appears to be associated with conservation
tillage. The environmental impact of conservation tillage is well docu-
mented.
10
The use of conservation tillage reduces soil erosion by wind and
water, increases water retention, and reduces soil degradation and water and
chemical runoff.
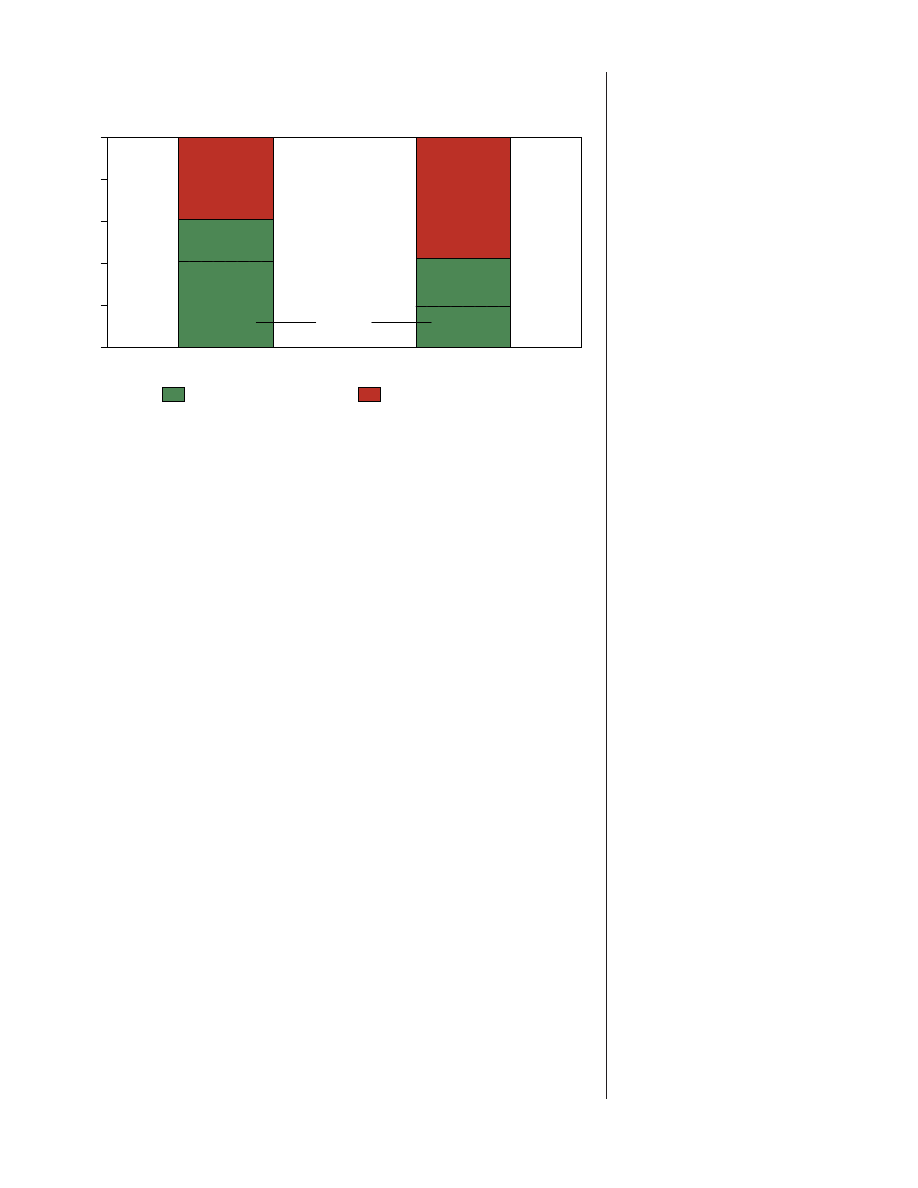
According to USDA survey data, about 60 percent of the area planted with
HT soybeans was under conservation tillage in 1997, compared with only
about 40 percent of the acres planted with conventional soybeans (fig. 9).
Differences in the use of no-till between adopters and nonadopters of HT
soybeans are even more pronounced: 40 percent of acres planted with HT
soybeans were under no-till, twice the corresponding share of acreage
planted with conventional soybeans. As a result, adoption of HT crops may
indirectly benefit the environment by encouraging farmers to use soil
conservation practices.
9
In addition, using an econometric
model with the 2001 data, the ERS
study showed a moderate but statisti-
cally significant insecticide reduction
associated with farmers who adopted
Bt corn relative to those using conven-
tional corn varieties (a 4.11-percent
decrease in insecticide use was associ-
ated with a 10-percent increase in Bt
corn adoption).
13
The First Decade of Genetically Engineered Crops in the United States/EIB-11
Economic Research Service/USDA
Figure 8
Pesticide use in major field crops
1995
1996
1997
1998
1999
2000
2001
2002
He rbicide s,
Lb/acre -ye ar
Insecticides,
Lb/acre -ye ar
Cotton herbicides
Soybean herbicides
Corn insecticides
Corn herbicides
3.00
2.50
2.00
1.50
1.00
0.50
0
0.24
0.20
0.16
0.12
0.08
0.04
0
Source: NASS surveys.
10
Conservation tillage includes any
tillage and planting system that leaves
at least 30 percent of the soil surface
covered with crop residue. It includes
no-till, ridge-till, and mulch-till
(Conservation Technology Information
Center, 2004).
14
The First Decade of Genetically Engineered Crops in the United States/EIB-11
Economic Research Service/USDA
Figure 9
Soybean area under conservation tillage* and no-till, 1997
Herbicide-tolerant varieties
Conventional varieties
Conservation
tillage
No-till
*Conservation tillage acres includes acres under no-till, ridge till, and mulch-till systems.
Source: Fernandez-Cornejo and McBride (2002).
Percent of acres
Conventional tillage
0
20
40
60
80
100

Consumer Demand Affects R&D, Adoption, and
Marketing of GE-Derived Products
Investments in biotechnology-related research and development (R&D), the
adoption of GE seeds, and the marketing of GE-derived products are all
affected by consumer demand. While several surveys indicate that some
U.S. consumers are concerned about GE food (table 4), these concerns have
not had a large impact on the market for foods containing GE ingredients in
the United States. In the European Union and a few other countries,
consumer concern has resulted in substitution away from GE ingredients.
While opinion surveys give some indication of whether or not consumers
are concerned about foods containing GE ingredients, they give little indica-
tion of the level of concern. Some researchers have attempted to quantify
this concern through studies in which consumers are asked how much they
would be willing to pay for foods made with GE ingredients, and for foods
without GE ingredients. Researchers then use these data to measure
whether or not there is a difference between these two hypothetical prices.
In most of these studies (table 5), consumers indicated that they were
willing to pay more on average for GE-free foods or to avoid foods
containing GE ingredients. However, in many of the studies, at least some
consumers did not require a discount to buy foods containing GE ingredi-
ents, while some expressed that they would not be willing to buy foods
containing GE ingredients at all.
11
Some respondents were willing to pay
more for certain characteristics, such as improved nutrition and environ-
mental benefits (Li et al., 2001; Lusk, 2003, Bocaletti and Moro, 2000).
While surveys and willingness-to-pay studies provide some insight into
consumer opinion, they often do not reflect how consumers will behave in a
real market situation when purchasing goods and services. Each food
product has many characteristics, such as taste, color, and ripeness. The
presence of a biotech-derived component is only one attribute. Empirically,
it is difficult to determine what percentage of the price a consumer is paying
for a specific characteristic. There are no published studies that indicate
how many consumers have actually paid a premium to purchase non-GE
goods, but there is some empirical evidence of the types of goods that are
currently offered for sale to consumers. In the United States, many products
contain GE ingredients, and the demands for these products apparently have
been unaffected by negative opinions about biotechnology expressed in
surveys. A few specialty brands are marketed as “GE free,” but they repre-
sent a small percentage of supermarket sales.
12
In some other countries,
however, strong consumer demand for non-GE products has limited the
availability of GE items (see box, “Biotech Product Differentiation: A Tale
of Two Markets”).
15
The First Decade of Genetically Engineered Crops in the United States/EIB-11
Economic Research Service/USDA
11
The amount that consumers indicate
that they are willing to pay for a par-
ticular characteristic in a hypothetical
situation is sometimes different from
the amount that they actually pay
when shopping (Lusk, 2003).
12
In addition, organic foods are avail-
able. Use of any GE techniques bars a
crop from being certified as organic.
Although organic foods still have a
small market share (1-2 percent ) of
total U.S. food sales, their sales have
been rising at a rate of 20 percent
annually (Dimitri and Greene, 2002).

16
The First Decade of Genetically Engineered Crops in the United States/EIB-11
Economic Research Service/USDA
Table 4
Surveys on consumer perceptions of foods containing GE ingredients
Country/ Population
Surveyed by
Details
United States
Pew Initiative/Mellman
27 percent favor introduction of GE foods; 47 percent
Group, 2003, 2004
oppose. However, 64 percent disagree with the
statement, “genetically modified foods should not be
allowed to be sold even if the Food and Drug
Administration believes they are safe,” and 28 percent
feel that those foods should not be allowed, even if the
FDA feels they are safe.
United States
Gallup, 2001
52 percent support the application of biotechnology;
38 percent oppose the use of biotechnology in food
production.
United States
Hallman, 2004
47 percent approved or leaned toward approval of the
use of GE to make plant-based foods, 41 percent
disapproved or leaned toward disapproval, and 12
percent were unsure.
United States
IFIC, 2005
50 percent said likely to buy and 45 percent said not
likely to buy GE produce modified to taste better or
fresher; 64 percent said likely to buy and 32 percent
said not likely to buy GE produce modified to require
fewer pesticide applications.
Beijing, China
Hu and Chen, 2004
67 percent were concerned about biotechnology.
Nanjing, China
Zhong et al., 2002
40 percent would buy GE foods; 17 percent would not;
34 percent don’t know.
Beijing, China,
Ho and Vermeer, 2004
40 percent were willing or rather willing to consume
Shiajiazhuang,
foods containing GE-based ingredients, 51 percent
China
were neutral, and 9 percent were rather unwilling or
very unwilling to consume the foods.
Flemish speakers
Verdurme and Viaene,
15 percent opposed to GE foods; 34 percent perceived
in Belgium
2003
small risks and small benefits; 26 percent perceived
moderate risks and moderate benefits; and 23 percent
perceived large benefits.
United Kingdom
2003 GE Public Debate
86 percent preferred not to eat GE foods; 8 percent
Steering board
happy to eat GE foods.
Source: Compiled by USDA’s Economic Research Service.

17
The First Decade of Genetically Engineered Crops in the United States/EIB-11
Economic Research Service/USDA
Table 5
Willingness to pay for foods that do not contain GE ingredients
1
Country
Food
Study
Willingness-to-pay premium
United States
Vegetable oil
Tegene et al., 2003
In experimental auctions, consumers willing to
pay 14 percent more for non-GE food.
United States
Potatoes
Loureiro and Hine, `
Customers willing to pay 5 percent more for
2002
non-GE food.
United States
Golden rice
Lusk, 2003
Customers willing to pay 93 cents for GE
“golden rice” with added vitamin C, 65-75
cents for regular rice.
United Kingdom
All foods
Burton et al., 2001
Customers indicated willingness to increase
food budgets by 26-129 percent to avoid GE
foods.
Italy
*
Bocaletti and Moro,
Consumers willing to pay a positive amount for
2000
GE attributes; 66 percent did not require a
premium to consume GE foods.
United States, France,
Beef fed with
Lusk et al., 2003
U.S. consumers willing to pay $2.83 and $3.31
Germany, and United
GE feed
per lb. to avoid GE; European consumers
Kingdom
$4.86 to $11.01.
United States,
Breakfast cereal
Moon and
Survey found 56 percent of UK consumers
United Kingdom
Balasubramanian, 2001
willing to pay a premium to avoid GE
compared with 37 percent of U.S. consumers.
Norway, United
Vegetable oil
Chern et al., 2002
Norwegian students were willing to pay $1.51
States, Japan, Taiwan
(55-69 percent premium) per liter for non-GE
vegetable oil, U.S. students were willing to pay
$1.13 (50-62 percent premium), Japanese
students were willing to pay $0.88 (33-40
percent premium), and Taiwanese students
were willing to pay $0.45 cents (17-21 percent
premium).
China
Rice
Li et al., 2002
80 percent of consumers did not require a
premium to purchase GE rice and on average
were willing to pay a 38-percent premium on
GE rice and a 16-percent premium for GE
soy oil.
Norway
Bread
Grimsrud, et al., 2004
Consumers required discounts of 37-63
percent to buy GE bread; One-fourth willing
to buy with no discount.
Australia
Beer
Burton and Pearse, 2002
Younger consumers would pay $A 0.72 less
and older consumers $A 0.40 less for beer
made with GE barley.
Canada
*
West et al., 2002
83 percent of consumers ascribed a lower
value to several GE foods.
France
*
Noussair et al., 2004
35 percent of consumers were unwilling to
purchase GE foods, and 42 percent were
willing to purchase them if they were less
expensive.
United States
Oil, chips,
Rousu et al., 2004
Consumers reduced their demand by an aver-
and potatoes
age of 7-13 percent for each food product
having 1 percent and 5 percent tolerance
levels for GE material relative to GE-free food.
1
See also Lusk et al. (2005), who summarize a set of 25 studies including 57 GE valuation studies and report that, on average, consumers are
willing to pay a positive premium for GE-free foods.
*
This study did not focus on a specific food item.
Source: Compiled by USDA’s Economic Research Service.
18
The First Decade of Genetically Engineered Crops in the United States/EIB-11
Economic Research Service/USDA
Biotech Product Differentiation: A Tale of Two Markets
The introduction of genetically engineered (GE) crops has led food manufac-
turers to make a choice for each of their products: either pursue a non-GE
strategy and market and produce a non-GE product or source inputs based on
cost and quality, or market and produce an undifferentiated product.
If all manufacturers were to pursue a non-GE strategy, farmers would eventu-
ally abandon GE technologies and consumer choice would be restricted to
potentially higher cost non-GE products. If manufacturers were to pursue an
undifferentiated strategy, then farmers’ use of the technology would be deter-
mined by production costs and consumers would be faced with markets in
which they could not differentiate between GE and non-GE foods. If manufac-
turers pursue both strategies, some farmers would continue to use the tech-
nology while others would grow conventional crops to supply non-GE markets.
In this scenario, consumers would have a choice between GE and non-GE
food, at least for some products.
In the United States, where unlabeled foods may contain GE ingredients, the
data show that manufacturers have been active in creating a market for GE-
free foods. From 2000 to 2004, manufacturers introduced over 3,500 prod-
ucts that had explicit non-GE labeling, mostly food products, with annual
totals ranging from 854 in 2003 to 631 in 2004. This is in addition to organic
foods (organic crops may not be grown using GE techniques) (Dimitri and
Greene, 2002).
In the European Union and Japan, where unlabeled foods cannot contain GE
ingredients, manufacturers have chosen a non-GE marketing strategy. Very
few products labeled as containing GE ingredients are found on European or
Japanese grocery store shelves.
The data also show that there have been limited attempts to market GE prod-
ucts in the United States. There were far fewer new GE products introduced
than new non-GE products, and most of the GE products were introduced in
the 1990s. GE products included tomatoes (advertised as better tasting with a
longer shelf life), canola oil (advertised as heat stable), shrimp (advertised as
gourmet-quality), beef (low-fat), dietary supplements, cigarettes (low-nicotine),
and a drain cleaner.
Annual non-GE new product introductions in the United States
0
200
400
600
800
1,000
2000
2001
2002
2003
2004
Beverages
Health &
beauty aids
Household
products
Pet
foods
Food
Number of new products
Source: Productscan Online.
Adoption Offers Market Benefits
to Many Stakeholders
In addition to farmers, seed suppliers, technology providers, and consumers
also benefit from the adoption of GE crops in the United States. Biotech-
nology developers and seed firms benefit by charging technology fees and
seed premiums to adopters of GE varieties. U.S. and foreign consumers may
benefit indirectly from GE crops through lower commodity prices that result
from increased supplies.
13
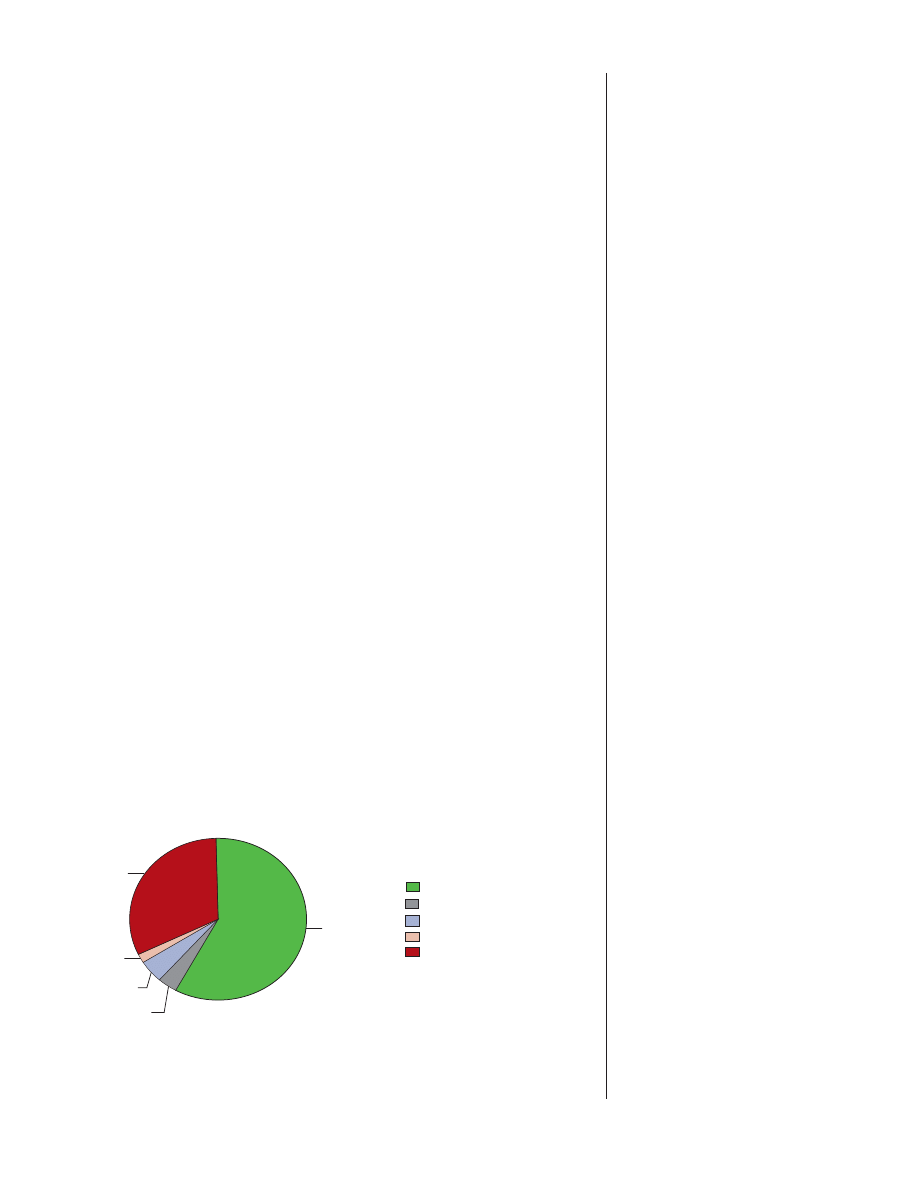
ERS estimated the total market benefit arising from the adoption of three
GE crops in the United States—HT soybeans, Bt cotton, and HT cotton—in
1997 (Price et al., 2003).
14
Estimated benefits to farmers, seed producers,
and consumers were around $210 million for Bt cotton, $230 million for HT
cotton, and $310 million for HT soybeans. This estimate includes the
change in total welfare in both the seed input and commodity output
markets. The distribution of these benefits among consumers, farmers,
technology providers (biotech firms), seed firms, and consumers and
producers in the rest of the world (ROW) is shown in figures 10-12. The
distribution of benefits varies by crop and technology because the economic
incentives to farmers (crop prices and production costs), the payments to
technology providers (biotech firms) and seed firms, and the effect of the
technology on world crop prices are different for each crop and technology.
For example, adoption of HT cotton benefits mainly consumers while Bt
cotton benefits farmers and technology providers. Seed firms are by far the
largest beneficiaries in the case of soybeans.
These results should be interpreted carefully, since the estimates are based
on only a few years of data. Moreover, estimated benefits and their distribu-
tion depend particularly on the analytical framework, supply and demand
elasticity assumptions,
15
crops considered, and year-specific factors (such
as weather). In particular, the benefits attributable to HT soybeans and their
distribution are very dependent on the soybean supply elasticity. Table 6
shows estimates of the benefits of Bt cotton and HT soybeans and their
distribution obtained by other researchers.
19
The First Decade of Genetically Engineered Crops in the United States/EIB-11
Economic Research Service/USDA
13
Consumers may also benefit directly
when GE products of the second and
third generation are commercialized.
14
The study estimated the economic
gains for various stakeholders associat-
ed with adoption by incorporating the
potential yield enhancements and sav-
ings in pest control costs into models
that derive each crop’s supply shift
resulting from biotechnology. Given
domestic and export demands, coun-
terfactual world prices and quantities
demanded of the commodities—those
that would have prevailed in the mar-
ket if biotechnology had not been
introduced—are determined from mar-
ket equilibrium conditions. Producer
and consumer surpluses in the U.S.
and international markets and monop-
oly profits accruing to the biotech
developers and seed firms are then cal-
culated (Price et al., 2003).
15
Elasticity measures the responsive-
ness of one economic variable to a
change in another (e.g., price and
quantity demanded). It is unit free and
always expressed in percentage terms.
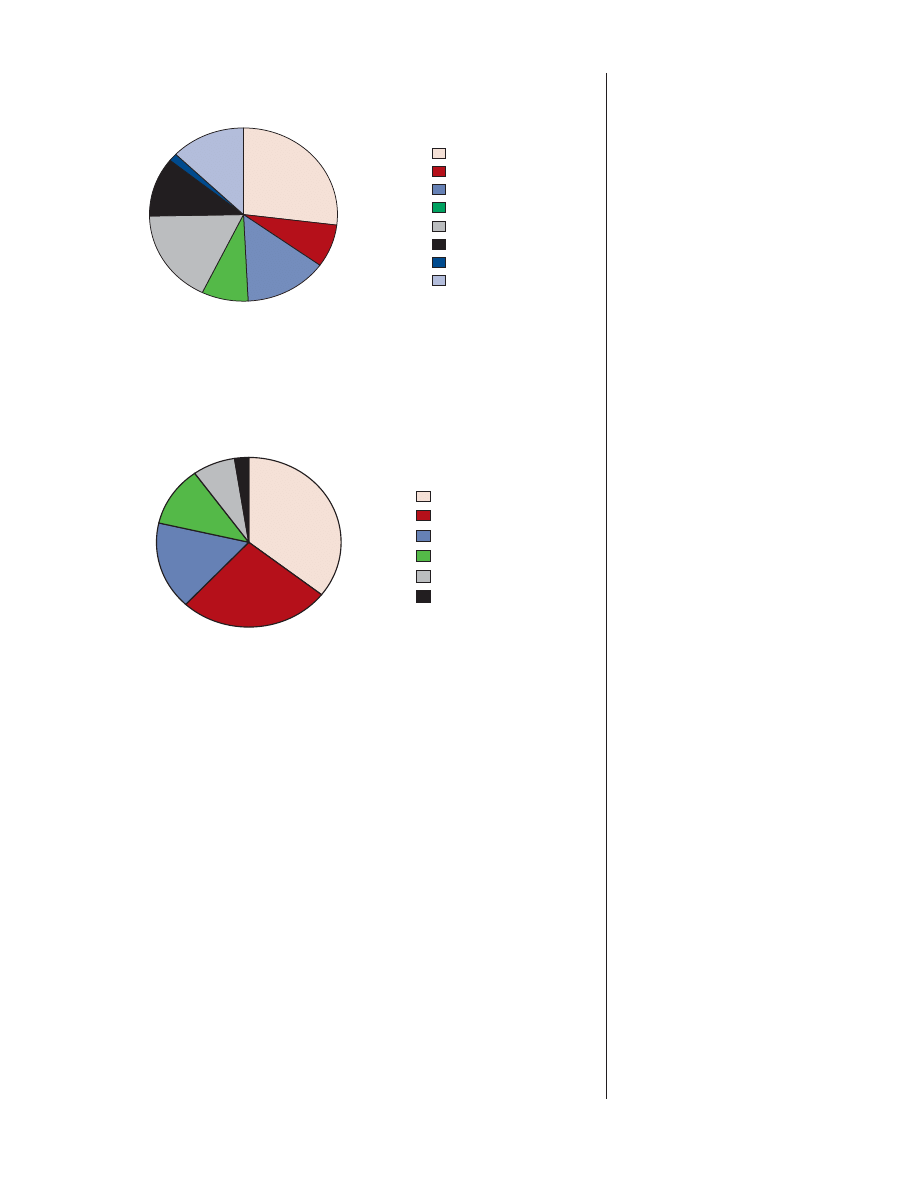
57.1%
4.1%
4.6%
1.6%
32.6%
Source: Price et al., 2003.
Figure 10
Stakeholders’ shares of the estimated total world benefit
from adopting herbicide-tolerant cotton, 1997
Consumer
U.S. farmers
Biotech firms
Seed firms
Net ROW
20
The First Decade of Genetically Engineered Crops in the United States/EIB-11
Economic Research Service/USDA
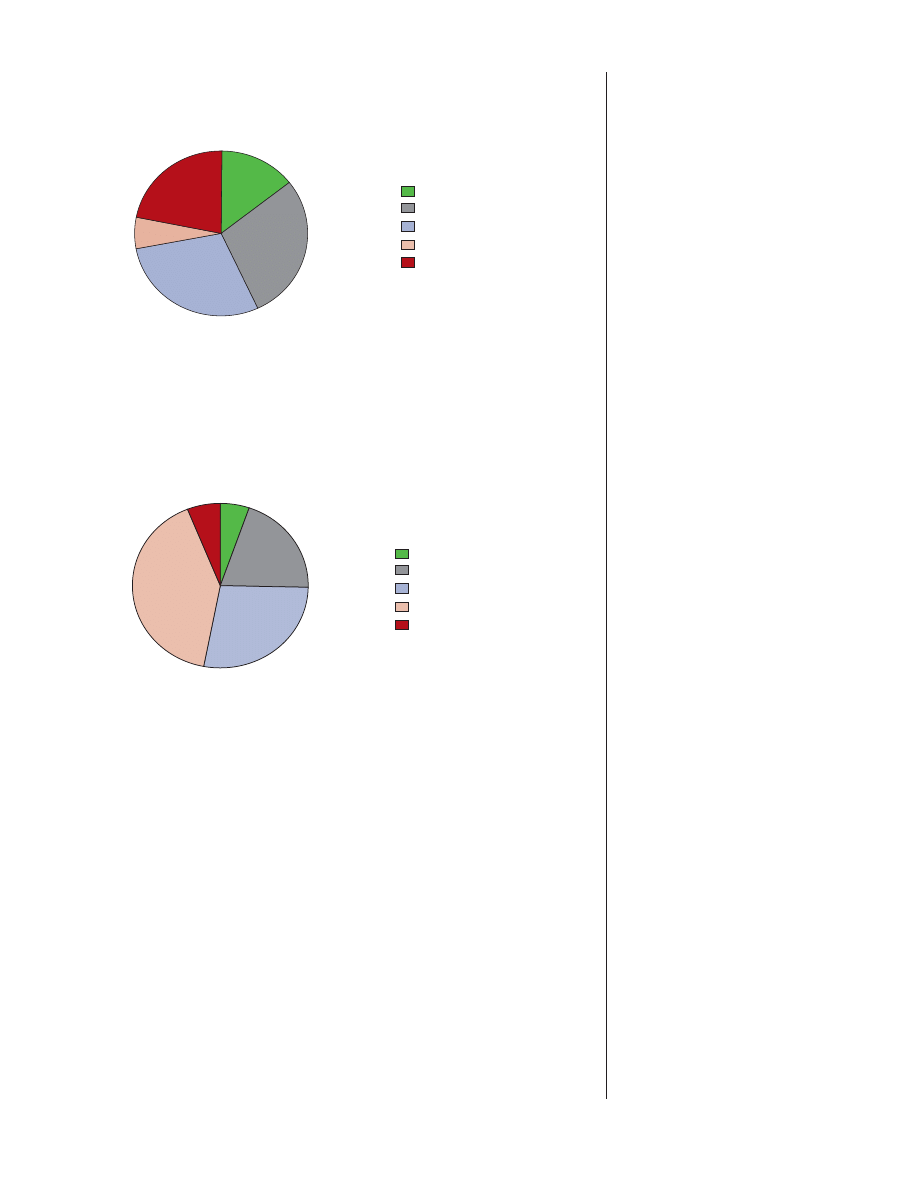
Source: Price et al., 2003.
14.1%
28.9%
29.2%
6.1%
21.8%
Figure 11
Stakeholders’ shares of the estimated total world benefit
from adopting Bt-cotton, 1997
Consumer
U.S. farmers
Biotech firms
Seed firms
Net ROW
6.4%
5.3%
20%
40.4%
27.8%
Source: Price et al., 2003.
Consumer
U.S. farmers
Biotech firms
Seed firms
Net ROW
Figure 12
Stakeholders’ shares of the estimated total world benefit
from adopting herbicide-tolerant soybeans, 1997

21
The First Decade of Genetically Engineered Crops in the United States/EIB-11
Economic Research Service/USDA
Conclusion
The role that biotechnology plays in agriculture in the United States and
globally depends on a number of factors and uncertainties. As the USDA
Advisory Committee on Biotechnology and 21st Century Agriculture report
indicates, “agricultural biotechnology sits at the crossroads of other debates
on the future of American and world agriculture, on international trade rela-
tions, on biological diversity and the development of international instru-
ments related to its preservation and exploitation, on the role of the
multinational corporations, and on how best to build public confidence in
rapidly evolving emerging technologies in general” (p.2.). One thing seems
certain, however: the ultimate contribution of agricultural biotechnology
will depend on our ability to identify and measure its potential benefits and
its risks as well as their distribution.
Table 6
Benefits of GE techniques and their distribution (from estimates in related studies)
Study
Year
Total
Share of the total benefits
benefits
U.S. farmers Innovators U.S. consumers Net ROW
$ million
Percent
Bt cotton
Falck-Zepeda et al. (1999)
1996
134
43
47
6
Falck-Zepeda et al. (2000b)
1996
240
59
26
9
6
Falck-Zepeda et al. (2000a)
1997
190
43
44
7
6
Falck-Zepeda et al. (1999)
1998
213
46
43
7
4
Frisvold et al. (2000)
1996-98
131-164
5-6
46
33
18
EPA (2000)
1
1996-99 16.2-45.9
n.a.
n.a.
n.a.
n.a.
Price et al. (2003)
1997
210
29
35
14
22
Herbicide-tolerant soybeans
Falck-Zepeda et al. (2000a)
1997-Low elasticity
2
1,100
77
10 4
9
1997-High elasticity
3
437 29
18 17
28
Moschini et al. (2000)
1999
804
20
45
10
26
Price et al. (2003)
1997
310
20
68
5
6
n.a. = Not applicable.
ROW = Rest of the world.
1
Limited to U.S. farmers.
2
Assumes a U.S. soybean supply elasticity of 0.22.
3
Assumes a U.S. soybean supply elasticity of 0.92.
Source: Price et al., 2003.

22
The First Decade of Genetically Engineered Crops in the United States/EIB-11
Economic Research Service/USDA
References
Arnold, J.C., D.R. Shaw, and C.R. Medlin. “Roundup Ready
TM
Programs
Versus Conventional Programs: Efficacy, Varietal Performance, and
Economics.” Proceedings of the Southern Weed Science Society, Southern
Weed Science Society. 51(1998): 272-73.
Associated Press, Matt Moore. 2004. Covered by CBS news as “Europeans
Balk At Biotech Beer” July 8, 2004.
http://www.cbsnews.com/stories/2004/07/08/tech/main628305.shtml.
Baker, G., and T. Burnham. “Consumer Response to Genetically Modified
Foods: Market Segment Analysis and Implications for Producers and Policy
Makers,” Journal of Agricultural and Resource Economics, 26(2)
(December 2001): 387-403.
Baute, T.S., M.K. Sears, and A.W. Schaafsma. “Use of Transgenic Bacillus
thuringiensis Berliner Corn Hybrids to Determine the Direct Economic
Impact of the European Corn Borer (Lepidoptera: Crambidae) on Field
Corn in Eastern Canada. Journal of Economic Entomology. 95(1)(2002):
57-64.
Boccaletti, S., and D. Moro. “Consumer Willingness-To-Pay For GM Food
Products In Italy,” AgBioForum, 3(4)(2000): 259-267.
Bryant, K.J., W.C. Robertson, and G.M. Lorenz III. “Economic Evaluation
of Bollgard Cotton in Arkansas.” In Proceedings of the Beltwide Cotton
Conferences, National Cotton Council, Memphis, TN. 1(1998):388-89.
Burton, M., and D. Pearse. “Consumer Attitudes Towards Genetic Modifica-
tion, Functional Foods, and Microorganisms: A Choice Modeling Experi-
ment for Beer.” AgBioForum, 5(2)(2002): 51-58.
Burton, M., D. Rigby, T. Young, and S. James. “Consumer Attitudes to
Genetically Modified Organisms in Food in the UK.” European Review of
Agricultural Economics, 28 (4)(December 2001): 479-98.
Carter, C.A., and G.P. Gruère. “Mandatory Labeling of Genetically Modi-
fied Foods: Does it Really Provide Consumer Choice?” AgBioForum, 6(1 &
2): 68-70. 2003 (a).
Carter, C.A., and G.P. Gruère. “International Approaches to the Labeling of
Genetically Modified Foods.” Choices, June 2003 (b).
Chern, W.S., K. Rickertsen, N. Tsuboi, and Tsu-Tan Fu. “Consumer Accep-
tance and Willingness to Pay for Genetically Modified Vegetable Oil and
Salmon: A Multiple-Country Assessment.” AgBioForum, 5(3)(2002): 105-112.
Colorado State University, Department of Soil and Crop Sciences. “Discon-
tinued Transgenic Products,” in Transgenic Crops: An Introduction and
Resource Guide. http://www.colostate.edu/programs/lifesciences/Trans-
genicCrops/defunct.html. March 2004.

23
The First Decade of Genetically Engineered Crops in the United States/EIB-11
Economic Research Service/USDA
Comis, D. “Safe Corn Pest Bait Expected to Slash U.S. Insecticide Use.”
U.S. Department of Agriculture, Agricultural Research Service.
http://www.ars.usda.gov/is/pr/1997/970116.htm?pf=1. 1997.
Conservation Technology Information Center (CTIC). National Crop
Residue Management Survey. “Conservation Tillage Data.”
http://www.ctic.purdue.edu/CTIC/CRM.html.
Culpepper, A.S., and A.C. York. “Weed Management in Glyphosate-Tolerant
Cotton.” The Journal of Cotton Science, 4(1998):174-185.
Delannay, X., T.T. Bauman, D.H. Beighley, M.J. Buettner, H.D. Coble, M.S.
DeFelice, C.W. Derting, T.J. Diedrick, J.L. Griffin, E.S. Hagood, F.G.
Hancock, S.E. Hart, B.J. LaVallee, M.M. Loux, W.E. Lueschen, K.W.
Matson, C.K. Moots, E. Murdock, A.D. Nickell, M.D.K. Owen, E.H.
Paschall II, L.M. Prochaska, P.J. Raymond, D.B. Reynolds, W.K. Rhodes,
F.W. Roeth, P.L. Sprankle, L.J. Tarochionc, C.N. Tinius, R.H. Walker, L.M.
Wax, H.D. Weigelt, and S.R. Padgette. “Yield Evaluation of a Glyphosate-
Tolerant Soybean Line After Treatment with Glyphosate.” Crop Science,
35(1995):1461-67.
Dillehay, B.L., G.W. Roth, D.D. Calvin, R.J. Karatochvil, G.A. Kuldau, and
J. A. Hyde. “Performance of Bt Corn Hybrids, their Near Isolines, and
Leading Corn Hybrids in Pennsylvania and Maryland.” Agronomy Journal,
96(204): 818-824.
Dimitri, C., and C. Greene. Recent Growth Patterns in the U.S. Organic
Foods Market. U.S. Department of Agriculture, Economic Research Service.
Agriculture Information Bulletin No. 777. Sept. 2002.
Duffy, M. “Who Benefits from Biotehnology?” Paper presented at the Amer-
ican Seed Trade Association meeting. Chicago, IL. December 5-7, 2001.
Falck-Zepeda, J.B., G. Traxler, and R.G. Nelson. “Rent Creation and Distri-
bution from the First Three Years of Planting Bt Cotton.” ISAAA Briefs No.
14. International Service for the Acquisition of Agri-biotech Applications.
Ithaca, NY. 1999.
Falck-Zepeda, J.B., G. Traxler, and R.G. Nelson. “Rent Creation and Distri-
bution from Biotechnology Innovations: The Case of Bt Cotton and Herbi-
cide-Tolerant Soybeans in 1997,” Agribusiness, 16(2000a): 21-32.
Falck-Zepeda, J.B., G. Traxler, and R.G. Nelson. “Surplus Distribution from
the Introduction of a Biotechnology Introduction.” American Journal of
Agricultural Economics, 82(2000b): 360-369.
Fernandez-Cornejo, J. The Seed Industry in U.S. Agriculture: An Explo-
ration of Data and Information on Crop Seed Markets, Regulation,
Industry Structure, and Research and Development. U.S. Department of
Agriculture, Economic Research Service, Agriculture Information Bulletin
No. 786. Feb. 2004.

24
The First Decade of Genetically Engineered Crops in the United States/EIB-11
Economic Research Service/USDA
Fernandez-Cornejo, J. “Adoption of Genetically Engineered Crops in the
U.S.” Data product. U.S. Department of Agriculture, Economic Research
Service. http://www.ers.usda.gov/Data/BiotechCrops/. July 2005.
Fernandez-Cornejo, J., and Jiayi Li. “The Impacts of Adopting Genetically
Engineered Crops in the USA: The Case of Bt Corn.” Paper presented at the
American Agricultural Economics Association meetings. Providence, RI. 2005.
Fernandez-Cornejo, J., and W.D. McBride. Genetically Engineered Crops
for Pest Management in U.S. Agriculture. U.S. Department of Agricul-
ture, Economic Research Service, Agricultural Economic Report No. 786.
April 2000.
Fernandez-Cornejo, J., and W.D. McBride. The Adoption of Bioengineered
Crops. U.S. Department of Agriculture, Economic Research Service, Agri-
cultural Economic Report No. 810. May 2002.
Fernandez-Cornejo, J., C. Hendricks, and A. Mishra. “Technology Adoption
and Off-Farm Household Income: The Case of Herbicide-Tolerant
Soybeans.” Journal of Agricultural and Applied Economics, 37(2)(2005).
Fernandez-Cornejo, J., C. Klotz-Ingram, and S. Jans. “Farm-Level Effects
of Adopting Genetically Engineered Crops in the U.S.A.,” In Transitions in
Agrobiotech: Economics of Strategy and Policy, pp. 57-72. W.L. Lesser,
editor. Food Marketing Research Center, University of Connecticut and
Department of Research Economics, University of Massachusetts. 2000.
Fernandez-Cornejo, J., C. Klotz-Ingram, and S. Jans. “Farm-Level Effects
of Adopting Herbicide-Tolerant Soybeans in the U.S.A.” Journal of Agricul-
tural and Applied Economics, 34(1)(2002): 149-163.
Fernandez-Cornejo, J., M. Caswell, and C. Klotz-Ingram. “Seeds of
Change: From Hybrids to Genetically Modified Foods.” Choices, (Millen-
nium issue, 4th quarter of 1999): 18-22.
Finke, M. S., and H. Kim. “Attitudes About Genetically Modified Foods
Among Korean and American College Students.” AgBioForum, 6(4)(2003):
191-197.
Frisvold, G., R. Tronstad, and J. Mortensen. “Effects of Bt Cotton Adoption:
Regional Differences and Commodity Program Effects.” Paper presented at
the Western Agricultural Economics Association Meeting, Vancouver,
British Columbia. June 30, 2000.
Gibson, J.W. IV, D. Laughlin, R.G. Lutrell, D. Parker, J. Reed, and A.
Harris. “Comparison of Costs and Returns Associated with Heliothis Resis-
tant Bt Cotton to Non-Resistant Varieties,” Proceedings of the Beltwide
Cotton Conferences. Cotton Weed Science Research Conference.1997. v.1,
pp. 244-247.
Goldman, D.L., C. Guy, M. McCelland, and A. Kendig. “Weed Control
Systems in Roundup Ready
TM
Cotton.” In Proceedings of the Beltwide Cotton
Conferences. Cotton Weed Science Research Conference. 1996. v.2. p. 1532.

25
The First Decade of Genetically Engineered Crops in the United States/EIB-11
Economic Research Service/USDA
Gracia, A., and L.M. Albisu. “Food Consumption in the European Union:
Main Determinants and Country Differences.” Agribusiness, 17(4)(Autumn,
2001): 469-488.
Graeber, J.V., E.D. Nafziger, and D.W. Mies. “Evaluation of Transgenic, Bt-
Containing Corn Hybrids.” Journal of Production Agriculture,
(12)(4)(1999):659-663.
Greenpeace. EU Markets. http://www.greenpeace.org/raw/content/interna-
tional/press/reports/european-markets-report-2005.pdf. February 3, 2005.
Grimsrud, K.M., J. McCluskey, M. Loureiro, and T. Wahl. “Consumer Atti-
tudes to Genetically Modified Foods in Norway.” Journal of Agricultural
Economics, 55(1)(March 2004): 75-90.
Hallman, W., W. Hebden, C. Cuite, H. Aquino, and J. Lang. Americans and
GM Food: Knowledge, Opinion & Interest in 2004. Food Policy Institute.
http://www.foodpolicyinstitute.org/docs/reports/NationalStudy2004.pdf.
Harrison, R.W., S. Boccaletti, and L. House.“Risk Perceptions of Urban
Italian and United States Consumers for Genetically Modified Foods.”
AgBioForum, 7(4)(2004):195-201.
Ho, P., and E. B. Vermeer. “Food Safety Concerns and Biotechnology:
Consumers’ Attitudes to Genetically Modified Products in Urban China.”
AgBioForum, 7(4)(2004): 158-175.
House, L., J. Lusk, S. Jaeger, W. B. Traill, M. Moore, C. Valli, B. Morrow,
and W.M.S. Yee. “Objective and Subjective Knowledge: Impacts on
Consumer Demand for Genetically Modified Foods in the United States and
the European Union.” AgBioForum, 7(3)(2004): 113-123.
Hu, W.Y., and K. Chen. “Can Chinese Consumers Be Persuaded? The Case
of Genetically Modified Vegetable Oil.” AgBioForum, 7(3)(2004):24-132.
International Food Information Council (IFIC) Polls, 1999-2005.
http://ific.org/publications/.
International Service for the Acquisition of Agri-biotech Applications
(ISAAA). Preview: Global Status of Commercialized Biotech/GM Crops:
ISAAA Briefs 32-2004.
http://www.isaaa.org/kc/CBTNews/press_release/briefs32/ESummary/Exec-
utive%20Summary%20(English).pdf.
Just, R.E., and D.L. Hueth. “Multimarket Exploitation: The Case of
Biotechnology and Chemicals.” American Journal of Agricultural
Economics, 75(4)(1993): 936-45.
Kaufman, P. “Consolidation in Food Retailing: Prospects for Consumers and
Grocery Suppliers.” Agricultural Outlook, August, 2000.
Keeling, W., P. Dotray, C. Jones, and S. Sunderland. “Roundup
TM
Ready
Cotton: A Potential New Weed Management Tool for the Texas High

26
The First Decade of Genetically Engineered Crops in the United States/EIB-11
Economic Research Service/USDA
Plains.” Proceedings of the Beltwide Cotton Conferences. Cotton Weed
Science Research Conference. 1996. v.2. p. 1529.
King, J., and P. Heisey. “Ag Biotech Patents: Who is Doing What?” Amber
Waves, November 2003.
http://www.ers.usda.gov/Amberwaves/November03/DataFeature/.
Li, Q., K.R. Curtis, J.J. McCluskey, and T.I. Wahl. “Consumer Attitudes
Toward Genetically Modified Foods in Beijing, China.” AgBioForum,
5(4)(2002): 145-152.
List, J.A., and C. Gallet, “What Experimental Protocol Influence Disparities
between Actual and Hypothetical Stated Values.” Environmental and
Resource Economics, 20(2001): 241-254.
Loureiro, M.L., and S. Hine. “Discovering Niche Markets: A Comparison of
Consumer Willingness to Pay for Local (Colorado Grown), Organic, and
GMO-Free Products.” Journal of Agricultural and Applied Economics,
34(3)(December 2002): 477-487.
Lusk, J.L. “Effects of Cheap Talk on Willingness to Pay for Golden Rice.”
American Journal of Agricultural Economics, 85 (4)(November 2003):
840-856.
Lusk, J.L., J. Roosen, and J. Fox. “Demand for Beef with Growth
Hormones and Fed Genetic Corn.” American Journal of Agricultural
Economics, 85 (1)(February 2003): 16-29.
Lusk, J.L., M. Jamal, L. Kurlander, M. Roucan, and L. Taulman. “A Meta
Analysis of Genetically Modified Food Valuation Studies.” Journal of Agri-
cultural and Resource Economics, 30(April 2005):28-44.
Marks, L.A., N. Kalaitzandonakes, and S.S. Vickner. “Consumer purchasing
behavior toward GM foods in the Netherlands,” in Consumer Acceptance of
Biotech Foods. R. Evenson and V. Santaniello (editors). Wallingford, UK:
CABI Publishers, p. 23-29, 2004.
Marra, M., G. Carlson, and B. Hubbell. “Economic Impacts of the First
Crop Biotechnologies.” Available at
http://www.ag.econ.ncsu.edu/faculty/marra/firstcrop/imp001.gif. 1998.
McBride, W.D., and H. El-Osta. “Impacts of the Adoption of Genetically
Engineered Crops on Farm Financial Performance.” Journal of Agricultural
and Applied Economics, Vol. 34, No. 1(April 2002):175-191.
McBride, W., S. Short, and H. El-Osta. “Production and Financial Impacts
of the Adoption of Bovine Somatropin on U.S. Dairy Farms.” Paper
presented at the 2002 American Agricultural Economics Association meet-
ings, Long Beach, CA, July 28-31, 2002.
Moon, W.K., and S.K. Balasubramanian. “Public Perceptions And Willing-
ness-To-Pay A Premium For Non-GM Foods in the US and UK.” AgBio-
Forum, 4(3&4)(2001): 221-231.

27
The First Decade of Genetically Engineered Crops in the United States/EIB-11
Economic Research Service/USDA
Moon, W.K., and S.K. Balasubramanian. “Is There a Market for Genetically
Modified Foods in Europe? Contingent Valuation of GM and Non-GM Break-
fast Cereals in the United Kingdom.” AgBioForum, 6(3)(2003): 128-133.
Moschini, G., H. Lapan, and A. Sobolevsky. “Roundup Ready
TM
Soybeans
and Welfare Effects in the Soybean Complex.” Agribusiness, 16(2000): 33-55.
National Research Council. Animal Biotechnology: Science Based
Concerns. Board on Agriculture and Natural Resources, Board on Life
Sciences, Washington, DC: The National Academies Press.
http://www.nap.edu/openbook/0309084393/html/R1.html#pagetop. 2002 (a).
National Research Council. Environmental Effects of Transgenic Plants:
The Scope and Adequacy of Regulation. Board on Agriculture and Natural
Resources, Committee on Environmental Impacts Associated with Commer-
cialization of Transgenic Plants. Washington, DC: The National Academies
Press. http://www.nap.edu/books/0309082633/html/. 2002 (b).
Noussair, C., S. Robin, and B. Ruffieux. “Do Consumers Really Refuse To
Buy Genetically Modified Food?” The Economic Journal, 114(492)(2004):
102-120.
North Carolina Farm Bureau Federation. “Gallup Conducts Poll on Biotech
Food.” Aug. 6-12, 2001.
Office of Science and Technology Policy, Executive Office of the President.
Coordinated Framework for Regulation of Biotechnology. Federal Register,
51 FR 23302,
http://usbiotechreg.nbii.gov/Coordinated_Framework_1986_Federal_
Register.html. 1986.
Onyango, B., R.M. Nayga, Jr., and B. Schilling . “Role of Product Benefits
and Potential Risks in Consumer Acceptance of Genetically Modified
Foods.” AgBioForum, 7(4)(2004): 202-211.
Panos. “Greed or Need? Genetically Modified Crops.” Panos Media
Briefing No. 30. October 1998. http://www.oneworld.org/panos/.
Pew Initiative on Food and Biotechnology. Harvest on the Horizon: Future
Uses of Agricultural Biotechnology.
http://pewagbiotech.org/research/harvest/harvest.pdf. Sept. 2001.
Pew Initiative on Food and Biotechnology. “Public Sentiment About Geneti-
cally Modified Food: September 2003 Update.”
http://pewagbiotech.org/research/2003update/. 2003.
Pew Initiative on Food and Biotechnology. “Overview of Findings 2004
Focus Groups & Poll.”
http://pewagbiotech.org/research/2004update/overview.pdf. 2004.
Pilcher, C.D., M.E. Rice, R.A. Higgins, K.L. Steffey, R.L. Hellmich, J.
Witkowski, D. Calvin, K.R. Ostlie, and M. Gray. “Biotechnology and the
European Corn Borer: Measuring Historical Farmer Perceptions and Adop-

28
The First Decade of Genetically Engineered Crops in the United States/EIB-11
Economic Research Service/USDA
tion of Transgenic Bt Corn as a Pest Management Strategy.” Journal of
Economic Entomology, 95(5)(2002): 878-892.
Price, G.K., W. Lin, J.B. Falck-Zepeda, and J. Fernandez-Cornejo. The Size
and Distribution of Market Benefits from Adopting Agricultural Biotech-
nology. U.S. Department of Agriculture, Economic Research Service, Tech-
nical Bulletin No. 1906. Nov. 2003.
ReJesus, R.M., J.K. Greene, M.D. Hamming, and C.E. Curtis. “Economic
Analysis of Insect Management Strategies for Transgenic Bt Cotton Produc-
tion in South Carolina.” Proceedings of the Beltwide Cotton Conferences.
Cotton Economics and Marketing Conference. v.1. p. 247-251. 1997.
Rice, M.E., and C.D. Pilcher. “Potential Benefits and Limitations of Trans-
genic Bt Corn for Management of the European Corn Borer (Lepidoptera:
Crambidae).” American Entomologist, 44(1998): 75-78.
Roberts, R.K., R. Pendergrass, and R.M. Hayes, “Farm-Level Economic
Analysis of Roundup Ready
TM
Soybeans.” Paper presented at the
Southern Agricultural Economics Association Meeting, Little Rock, AR,
Feb. 1-4, 1998.
Rousu, M., W.E. Huffman, J.F. Shogren, and A. Tegene. “Are United States
Consumers Tolerant of Genetically Modified Foods?” Review of Agricul-
tural Economics, 26(February 2004): 19-31.
Runge, C. Ford, and B. Ryan. The Global Diffusion of Plant Biotechnology:
International Adoption and Research in 2004. University of Minnesota.
http://www.apec.umn.edu/faculty/frunge/globalbiotech04.pdf. Dec. 8, 2004.
Shoemaker, R., J. Harwood, K. Day-Rubenstein, T. Dunahay, P. Heisey, L.
Hoffman, C. Klotz-Ingram, W. Lin, L. Mitchell, W. McBride, and J.
Fernandez-Cornejo. Economic Issues in Agricultural Biotechnology. U.S.
Department of Agriculture, Economic Research Service, Agriculture Infor-
mation Bulletin No. 762. Feb. 2001.
Shoemaker, R., D. Johnson, and E. Golan. “Consumers and the Future of
Biotech Foods in the United States.” Amber Waves, November 2003.
http://www.ers.usda.gov/Amberwaves/November03/Features/futureof-
biotech.htm.
Steering Board of the Public Debate on GM. GM Nation? The Findings of
the Public Debate.
http://www.gmnation.org.uk/docs/gmnation_finalreport.pdf. 2003.
Tegene, A., W. Huffman, M. Rousu, and J. Shogren. The Effects of Informa-
tion on Consumer Demand for Biotech Foods: Evidence from Experimental
Auctions. U.S. Department of Agriculture, Economic Research Service,
Technical Bulletin No. 1903. April 2003.
Traill, W.B., S.R. Jaeger, W.M.S. Yee, C. Valli, L. O. House, J.L. Lusk, M.
Moore, and J.L. Morrow, Jr. “Categories of GM Risk-Benefit Perceptions
and Their Antecedents.” AgBioForum, 7(4)(2004): 176-186.

Tripp, R. “Regulatory Issues: Varietal Registration and Seed Quality
Control.” In Morris, M.L (editor), Maize Seed Industries in Developing
Countries. Boulder, CO: CIMMYT (International Maize and Wheat
Improvement Center). 1998. pp. 159-173.
United Nations Conference on Trade and Development (UNCTAD). Inter-
national Trade in GMOs and GM Products: A National and Multilateral
Legal Framework. Policy Issues in International Trade and Commodities
Study Series No. 29. United Nations, New York, NY, and Geneva, Switzer-
land. 2005.
University of California, Davis Vegetable Research and Information Center,
Pest-Resistance Management. “Insecticidal Bt-Potatoes.”
http://ucce.ucdavis.edu/files/filelibrary/5283/2196.pdf. Feb. 1998.
USDA Advisory Committee on Biotechnology and 21st Century Agriculture
(AC21). AC21 Consensus Report—Preparing for the Future. Washington,
DC. http://www.usda.gov/agencies/biotech/ac21/reports/scenarios-4-5-
05final.pdf. 2005.
U.S. Department of Agriculture. “Agricultural Biotechnology: Frequently
Asked Questions. What Is Biotechnology?”
http://www.usda.gov/agencies/biotech/faq/html.
U.S. Department of Agriculture. “Glossary of Agricultural Biotechnology
Terms.” http://www.usda.gov/wps/portal/!ut/p/_s.7_0_A/7_0_1OB?contenti-
donly=true&navid=AGRICULTURE
&contentid=BiotechnologyGlosary.xml. October 2005.
U.S. Department of Agriculture, Animal and Plant Health Inspection
Service. “Changes in Regulation of the Products of Biotechnology by
APHIS’ Biotechnology Regulatory Services.”
http://www.aphis.usda.gov/brs/eis/index.html. January 2004.
U.S. Department of Agriculture, Biotechnology, Animal and Plant Health
Inspection Service, Regulatory Services. “United States Regulatory Over-
sight in Biotechnology Responsible Agencies – Overview.”
http://www.aphis.usda.gov/brs/usregs.html. April 5, 2005.
U.S. Environmental Protection Agency. “Bacillus thuringiensis Plant-Pesti-
cides.” Biopesticides Registration Action Document: Preliminary Risks and
Assessments Sections. 2000.
U.S. Environmental Protection Agency. EPA’s Regulation of Biotechnology
for Use in Pest Management.
http://www.epa.gov/pesticides/biopesticides/reg_of_biotech/eparegof-
biotech.htm. June 2003.
U.S. Food and Drug Administration. Statement of Policy: Foods Derived
from New Plant Varieties, 57 FR 22984.
http://vm.cfsan.fda.gov/~lrd/fr92529b.html. May 1992.
29
The First Decade of Genetically Engineered Crops in the United States/EIB-11
Economic Research Service/USDA

U.S. Food and Drug Administration, Center for Food Safety and Applied
Nutrition. Biotechnology. http://www.cfsan.fda.gov/~lrd/biotechm.html.
May 2005.
Vencill, W.K. “Weed Management Systems utilizing Herbicide-resistant
Cotton.” Proceedings of the Beltwide Cotton Conferences. Cotton Weed
Science Research Conference. 1996. v.2. p. 1532-33.
Verdurme, A., and J. Viaene. “Consumer Beliefs and Attitude towards
Genetically Modified Food: Basis for Segmentation and Implications for
Communication.” Agribusiness, 19(1)(Winter 2003): 91-113.
Virginia Polytechnic Institute and State University. “Information Systems
for Biotechnology, Field Test Releases in the U.S.”
http://www.isb.vt.edu/cfdocs/fieldtests1.cfm. April 5, 2005.
West, G.E., C. Gendron, B. Larue, and R. Lambert. “Consumers’ Valuation of
Functional Properties of Foods: Results from a Canada-Wide Survey.” Cana-
dian Journal of Agricultural Economics, 50(4)(December 2002): 541-58.
Zhong, F., M.A. Marchant, Y. Ding, and K. Lu. “GM Foods: A Nanjing
Case Study of Chinese Consumers’ Awareness and Potential Attitudes.”
AgBioForum, 5(4)(2003):136-144.
30
The First Decade of Genetically Engineered Crops in the United States/EIB-11
Economic Research Service/USDA
Wyszukiwarka
Podobne podstrony:
Fred Saberhagen Swords 1 The First Book of Swords
Increased diversity of food in the first year of life may help protect against allergies (EUFIC)
Zelazny, Roger The First Chronicles of Amber 04 The Hand of Oberon
Fred Saberhagen The Swords 01 The First Book Of Swords
Steven D Fisher The First Misadventure of Fragger Sparks A Ranger Leads the Way
Zelazny, Roger The First Chronicles of Amber 01 Nine Princes in Amber
Fred Saberhagen Swords 01 The First Book of Swords
Nature of bacterial colonization influences transcription of mucin genes in mice during the first we
Fairbanks; Zeno of Elea (The First Philosophers of Greece fragm ; 1898)
Zelazny, Roger The First Chronicles of Amber 02 Guns of Avalon
the first month of summer
Zelazny, Roger The First Chronicles of Amber 03 Sign of the Unicorn
Fred Saberhagen Swords 01 The First Book of Swords
Kwiek, Marek The Two Decades of Privatization in Polish Higher Education Cost Sharing, Equity, and
Paine; Dissertations on the First Principle of Government
Chapman The Interpretation of Certain Verses of the First Chapter of Genesis in the Light of Paleont
Zelazny, Roger The First Chronicles of Amber 05 The Courts of Chaos
Co existence of GM and non GM arable crops the non GM and organic context in the EU1
więcej podobnych podstron