
Dietary Intake of Arsenic, Cadmium, Mercury, and Lead
by the Population of Catalonia, Spain
Roser Martí-Cid
&
Juan M. Llobet
&
Victoria Castell
&
José L. Domingo
Received: 15 April 2008 / Accepted: 5 May 2008 /
Published online: 6 June 2008
# Humana Press Inc. 2008
Abstract The concentrations of arsenic (As), cadmium (Cd), mercury (Hg), and lead (Pb)
were determined in samples of food items widely consumed by the population of Catalonia,
Spain. All samples were randomly acquired in 12 cities of Catalonia between March and
June of 2006 and analyzed by inductively coupled plasma mass spectrometry. The dietary
intake of these elements was estimated for various age
–gender groups of population:
children, adolescents, adults, and seniors. In order to determine the temporal trend on the
dietary exposure to As, Cd, Hg, and Pb, the current results were compared with those of a
previous survey (2000). In the present market basket study, for a standard male adult of 70-kg
body weight living in Catalonia, the dietary intakes of As, Cd, Hg, and Pb were 261.01, 9.80,
12.61, and 45.13
μg/day, respectively, while in the 2000 survey, these intakes were 223.59,
15.73, 21.22, and 28.37
μg/day, for As, Cd, Hg, and Pb, respectively. For As, the only food
groups currently contributing with measurable amounts to intake of total As were fish and
shellfish and cereals, while for Cd the highest contribution to total intake corresponded to
pulses, tubers, and cereals. For Hg, the contribution was only due to fish and shellfish, while
cereals were the group with the highest contribution to total Pb intake. The estimated intakes
of As, Cd, Hg, and Pb are notably lower than the respective provisional tolerable weekly
intakes, which indicate that these intakes should not mean additional health risks for the
consumers.
Keywords Arsenic . Cadmium . Mercury . Lead . Foodstuffs . Dietary intake . Health risks
Biol Trace Elem Res (2008) 125:120
–132
DOI 10.1007/s12011-008-8162-3
R. Martí-Cid
:
J. L. Domingo (
*)
Laboratory of Toxicology and Environmental Health, School of Medicine,
“Rovira i Virgili” University,
San Lorenzo 21, 43201 Reus, Spain
e-mail: joseluis.domingo@urv.cat
J. M. Llobet
GRET-CERETOX, School of Pharmacy, University of Barcelona, Avgda. Joan XXIII s/n,
08028 Barcelona, Spain
V. Castell
Catalan Food Safety Agency, Department of Health, Generalitat de Catalunya, Roc Boronat 81-95,
08005 Barcelona, Spain

Introduction
It is well known that metals are natural components of the Earth crust, which can be present in
air, soils, and waters [
]. However, certain metals can be also important environmental
pollutants, particularly in areas with high anthropogenic pressure [
]. While metals such as
cobalt (Co), iron (Fe), manganese (Mn), or zinc (Zn) among others are essential for humans,
elements such as arsenic (As), cadmium (Cd), mercury (Hg), and lead (Pb) have no beneficial
effects, and there is no known homeostasis mechanism for them in humans [
]. Although
toxicity and the resulting threat to human health of any contaminant are, of course, a function
of concentration, it is well known that chronic exposure to As, Cd, Hg, and Pb at relatively
low levels can cause adverse effects [
]. Metals enter the human body mainly through
inhalation and ingestion, and for most non-occupationally-exposed individuals, diet is the
main route of human exposure [
]. It must be noted that although metals can change their
chemical form, they cannot be degraded or destroyed. Therefore, the risk assessment of these
elements via dietary intake is an important issue [
,
]. Mercury is an element of special
concern [
]. Because of the potential content of methylmercury in fish and shellfish, the
European Commission has recommended some restrictions concerning the consumption of
marine species (especially predatory species, which accumulate Hg over a long lifetime) [
This is particularly important for children, pregnant women, and breast-feeding mothers.
During 2000
–2002, we measured the levels of a number of chemical contaminants (including
As, Cd, Hg, and Pb) in various groups of foodstuffs purchased from Catalonia (Spain). Dietary
intake of the pollutants was subsequently estimated for various age and gender groups of the
population of that country [
]. The highest levels of most metals and organic pollutants
were mainly detected in fish and shellfish [
]. However, due to technical and economical
reasons, the levels of the contaminants were only determined in three species of fresh fish and
shellfish and in two species of canned fish. This was a limiting factor for the purpose of
establishing recommendations for the consumers. Taking this into account, our previous survey
was recently extended in the number of analyzed edible marine species. The levels of As, Cd, Hg,
and Pb were measured in the 14 species of fish and shellfish most consumed in Catalonia [
In order to establish the temporal trend in the total dietary intake of As, Cd, Hg, and Pb
by the population of Catalonia, in addition to fish and shellfish, foodstuffs belonging to the
remaining ten food groups assessed in our previous (2000
–2002) survey were also
analyzed. According to the Food and Agriculture Organization
–World Health Organization
(FAO
–WHO) [
], three basic approaches can be used to determine the intake of a food
contaminant: (1) total diet study, (2) duplicate diet method, and (3) diary study, which
combines data for specific contaminants in food with individual (or household)
consumption data. In the present study, as well as in our previous one [
], the total diet
study was used to determine As, Cd, Hg, and Pb dietary intakes. We here present the results
of this new study concerning the concentrations of As, Cd, Hg, and Pb in a number of
foodstuffs, as well as the human exposure through the diet of these potentially toxic
elements. A comparison with the results of our 2000 survey is also done.
Materials and Methods
Sampling
Between March and June 2006, food samples were randomly acquired in local markets, big
supermarkets, and grocery stores from 12 cities (Barcelona, Hospitalet de Llobregat,
Dietary Intake of As, Cd, Hg, and Pb by the Catalonia Population
121

Vilanova i la Geltrú, Mataró, Sabadell, Terrassa, Girona, Tarragona, Reus, Tortosa, Lleida,
and Manresa) of Catalonia, Spain. For collection of samples, two groups were made up.
The first group included meat of beef (steak, hamburger), pork (loin, sausage), chicken
(breast), and lamb (steak); vegetables and tubers (lettuce, tomato, cauliflower, string bean,
potato); fruits (apple, orange, pear, banana), and eggs. The second group included cow milk
(whole, semi-skimmed) and dairy products (yoghurt, cheese); cereals (French bread,
sandwich bread, pasta, rice); pulses (lentil, haricot bean); oils (olive, sunflower) and fats
(margarine, butter); meat products (boiled ham, frankfurt, salami); and industrial bakery
(croissant, cookie, fairy cake).
Because in the first group most products are usually retailed, their origins could be
very diversified in the different cities. Therefore, in that group, four composite samples
were analyzed for each food item. Each composite was made up of 24 individual
samples, which were collected in different places. In contrast, most food items included
in the second group corresponded to brands
–trademarks that might be easily obtained
in many different places. Consequently, in this group, only two composite samples
were analyzed for each food item. These composites were made up of 24 individual
samples of similar weights, which were collected in four different places of a same
city.
Analytical Methods and Instrumentation
The levels of As, Cd, Hg, and Pb in food samples were determined after previous digestion.
About 0.5 g of homogenized samples was predigested with 5 ml of 65% nitric acid
(Suprapur, E. Merck, Darmstadt, Germany) in Teflon vessels for 8 h at room temperature.
Subsequently, solutions were heated at 80°C for eight additional hours. On completion of
the digestion and after adequate cooling, solutions were filtered and made up to 25 ml with
ultrapure water. The concentrations of As, Cd, Hg, and Pb were determined by inductively
coupled plasma mass spectrometry (Perkin-Elmer Elan 6000). Rh was used as internal
standard.
The accuracy of the instrumental methods and analytical procedures was checked by
duplication of the samples. Analytical-grade reagents were used for blanks and calibration
curves, whereas quality control of the methodology was assured by analyzing a certified
reference material (TORT-2 Lobster hepatopancreas, NRC Canada). For sets of every ten
samples, a procedure blank and spike sample, involving all reagents, was run to check for
interference and cross-contamination. Replicate measurements were performed. The limits
of detection (LOD, fresh weight) were the following: As 0.100
μg/g, Hg 0.100 μg/g, Cd
0.025
μg/g, and Pb 0.025 μg/g. The recovery rates (in percentage) were found to be
between 80% and 120%.
Dietary Exposure Estimates
Consumption data by the general population of Catalonia of the analyzed foodstuffs were
taken from Serra-Majem et al. [
]. As only 50 food items were included in this survey,
total dietary intake of metals for each food group was calculated by summing the results of
multiplying the metal concentration in each specific food item by the amount
(proportionally estimated) consumed of that item. Finally, total dietary intake was obtained
by summing the respective intakes from each food group. For calculations, when the
concentration of an element was under the respective LOD, that value was assumed to be
equal to zero (ND=0).
122
Martí-Cid et al.

Table 1 Concentrations (Nanogram Per Kilogram of Fresh Weight) of Arsenic, Cadmium, Mercury, and
Lead in Food Samples Collected in Catalonia, Spain
As
Cd
Hg
Pb
Veal steak
<0.100
<0.025
<0.100
0.025
Hamburger
<0.100
<0.025
<0.100
0.038
Loin of pork
<0.100
0.008
<0.100
0.032
Pork sausage
<0.100
0.044
<0.100
0.090
Chicken breast
<0.100
<0.025
<0.100
0.036
Lamb
<0.100
<0.025
<0.100
0.038
Boiled ham
<0.100
<0.025
<0.100
0.044
Frankfurt
<0.100
<0.025
<0.100
0.041
Salami
<0.100
<0.025
<0.100
0.044
Meat and meat products
<0.100
0.006
<0.100
0.043
Sardine
3.675
0.003
0.082
0.027
Tuna
1.132
0.006
0.485
<0.025
Anchovy
4.633
0.006
0.082
<0.025
Mackerel
4.186
0.003
0.094
<0.025
Swordfish
2.100
0.051
1.928
<0.025
Salmon
1.896
0.004
0.046
0.099
Hake
4.095
0.002
0.187
0.050
Red mullet
16.581
<0.025
0.233
<0.025
Sole
6.088
<0.025
0.082
0.026
Cuttlefish
2.992
0.065
0.024
<0.025
Squid
4.255
0.050
0.056
0.046
Clam
2.233
0.143
0.018
0.056
Mussel
2.227
0.132
0.020
0.151
Shrimp
6.309
0.017
0.118
<0.025
Fish and shellfish
4.457
0.034
0.247
0.033
Lettuce
<0.100
<0.025
<0.100
0.052
Tomato
<0.100
<0.025
<0.100
0.043
Cauliflower
<0.100
<0.025
<0.100
0.034
String bean
<0.100
<0.025
<0.100
0.044
Vegetables
<0.100
<0.025
<0.100
0.043
Potato
<0.100
0.032
<0.100
0.032
Tubers
<0.100
0.032
<0.100
0.032
Apple
<0.100
<0.025
<0.100
0.044
Orange
<0.100
<0.025
<0.100
0.037
Pear
<0.100
<0.025
<0.100
0.029
Banana
<0.100
<0.025
<0.100
<0.025
Fruits
<0.100
<0.025
<0.100
0.028
Eggs
<0.100
<0.025
<0.100
0.042
Eggs
<0.100
<0.025
<0.100
0.042
Whole milk
<0.100
<0.025
<0.100
0.034
Semi-skimmed milk
<0.100
<0.025
<0.100
0.094
Milk
<0.100
<0.025
<0.100
0.064
Yoghurt
<0.100
<0.025
<0.100
0.034
Cheese
<0.100
<0.025
<0.100
<0.025
Dairy products
<0.100
<0.025
<0.100
0.017
French bread
<0.100
<0.025
<0.100
0.040
Sandwich bread
<0.100
<0.025
<0.100
0.068
Rice
0.180
<0.025
<0.100
0.034
Pasta
<0.100
0.034
<0.100
0.032
Cereals
0.045
0.009
<0.100
0.044
Dietary Intake of As, Cd, Hg, and Pb by the Catalonia Population
123

Results and Discussion
The concentrations of As, Cd, Hg, and Pb in the 50 food items analyzed in the present
survey are summarized in Table
. In our previous (2000) market basket study, the highest
concentrations of the four elements were found in the group of fish and shellfish [
]. In
contrast, the lowest As, Cd, and Hg concentrations were found in pulses, vegetables, and
fruits, while the lowest Pb levels were detected in pulses and milk, followed by fruits [
In the present study, although the highest levels of As and Hg were also found in fish and
shellfish, those of Cd and Pb were detected in pulses (Cd) and oils and fats (Pb). The
notable increase in the levels of Cd in pulses was unexpected. In fact, it was only due to the
comparatively high Cd concentration found in haricot beans. By contrast, the levels of Pb in
oils and fats could be reasonably expected according to the results already found in the
2000 survey, where oils and fats were in second place, just after fish and shellfish. In the
groups of vegetables, tubers, fruits, eggs, milk, dairy products, and industrial bakery,
the current concentrations of As, Cd, and Hg were under their respective detection limits.
However, Pb could be detected in all food groups, with concentrations ranging between
0.012 ng/kg of fresh weight for industrial bakery and 0.080 ng/kg of fresh weight for oils
and fats.
For a standard male adult of 70-kg body weight, living in Catalonia, Table
summarizes
data on food consumption, as well as the daily intakes of As, Cd, Hg, and Pb through the
foodstuffs analyzed in this study. In turn, Table
shows (for a standard male adult of 70-kg
body weight) data on food intake and dietary intake of As, Cd, Hg, and Pb, as well as the
estimated intake of inorganic As and methylmercury. These data are presented according to
12 food groups. To estimate inorganic As and methylmercury intake, percentages of 10%
and 90% of the total As and Hg, respectively, were assumed [
,
]. In the present market
basket study, the dietary intakes of As, Cd, Hg, and Pb were 261.01, 9.80, 12.61, and
45.13
μg/day, respectively. In the 2000 survey, these intakes were 223.59, 15.73, 21.22, and
28.37
μg/day, for As, Cd, Hg, and Pb, respectively. It must be noted that the daily
consumption of the specifically analyzed foodstuffs was 1,444 g in 2000 vs. the current
1,228 g. Moreover, for comparing the results of both surveys, it must be taken into account
Table 1 (continued)
As
Cd
Hg
Pb
Lentil
<0.100
<0.025
<0.100
<0.025
Haricot bean
<0.100
0.234
<0.100
0.094
Pulses
<0.100
0.117
<0.100
0.047
Olive oil
<0.100
<0.025
<0.100
<0.025
Sunflower oil
<0.100
0.165
<0.100
0.318
Margarine
<0.100
<0.025
<0.100
<0.025
Butter
<0.100
<0.025
<0.100
<0.025
Oils and fats
<0.100
0.041
<0.100
0.080
Croissant
<0.100
<0.025
<0.100
<0.025
Cookie
<0.100
<0.025
<0.100
<0.025
Fairy cake
<0.100
<0.025
<0.100
0.037
Industrial bakery
<0.100
<0.025
<0.100
0.012
For each food group, the arithmetic mean value of the described same category foodstuffs is indicated in
bold.
124
Martí-Cid et al.

Table 2 Food Intake (Gram Per Day) and Intake of Arsenic, Cadmium, Mercury, and Lead through the Diet
of Male Adults in Catalonia, Spain
Daily
intake
(g/day)
As intake
(
μg/day)
Inorganic
As intake
(
μg/day)
Cd intake
(
μg/day)
Hg intake
(
μg/day)
MeHg
intake
(
μg/day)
Pb intake
(
μg/day)
Veal steak
33.74
0.00
0.00
0.00
0.00
0.00
0.84
Hamburger
3.84
0.00
0.00
0.00
0.00
0.00
0.15
Loin of pork
18.13
0.00
0.00
0.15
0.00
0.00
0.58
Pork sausage
14.27
0.00
0.00
0.63
0.00
0.00
1.28
Chicken breast
39.66
0.00
0.00
0.00
0.00
0.00
1.43
Lamb
8.42
0.00
0.00
0.00
0.00
0.00
0.32
Boiled ham
8.05
0.00
0.00
0.00
0.00
0.00
0.35
Frankfurt
3.03
0.00
0.00
0.00
0.00
0.00
0.12
Salami
10.77
0.00
0.00
0.00
0.00
0.00
0.47
Meat and meat
products studied
139.91
0.00
0.00
0.77
0.00
0.00
5.55
Meat and meat
products
considered
171.90
0.00
0.00
0.95
0.00
0.00
6.82
Sardine
3.78
13.89
1.39
0.01
0.31
0.28
0.10
Tuna
10.13
11.47
1.15
0.06
4.91
4.42
0.00
Anchovy
2.05
9.49
0.95
0.01
0.17
0.15
0.00
Mackerel
1.13
4.73
0.47
0.00
0.11
0.10
0.00
Swordfish
0.06
0.12
0.01
0.00
0.11
0.10
0.00
Salmon
1.80
3.41
0.34
0.01
0.08
0.07
0.18
Hake
15.78
64.61
6.46
0.03
2.94
2.65
0.79
Red mullet
0.33
5.48
0.55
0.00
0.08
0.07
0.00
Sole
5.48
33.38
3.34
0.00
0.45
0.40
0.14
Cuttlefish
4.46
13.34
1.33
0.29
0.11
0.10
0.00
Squid
3.17
13.49
1.35
0.16
0.18
0.16
0.15
Clam
0.27
0.60
0.06
0.04
0.00
0.00
0.02
Mussel
0.97
2.16
0.22
0.13
0.02
0.02
0.15
Shrimp
3.53
22.27
2.23
0.06
0.42
0.37
0.00
Fish and shellfish
studied
52.94
198.45
19.84
0.80
9.89
8.90
1.52
Fish and shellfish
considered
67.53
253.16
25.32
1.03
12.61
11.35
1.94
Lettuce
22.92
0.00
0.00
0.00
0.00
0.00
1.19
Tomato
48.56
0.00
0.00
0.00
0.00
0.00
2.09
Cauliflower
5.40
0.00
0.00
0.00
0.00
0.00
0.18
String bean
16.82
0.00
0.00
0.00
0.00
0.00
0.74
Vegetables studied
93.69
0.00
0.00
0.00
0.00
0.00
4.20
Vegetables
considered
159.66
0.00
0.00
0.00
0.00
0.00
7.16
Potato
73.06
0.00
0.00
2.34
0.00
0.00
2.34
Tubers studied
73.06
0.00
0.00
2.34
0.00
0.00
2.34
Tubers considered
73.06
0.00
0.00
2.34
0.00
0.00
2.34
Apple
46.51
0.00
0.00
0.00
0.00
0.00
2.05
Orange
45.56
0.00
0.00
0.00
0.00
0.00
1.69
Pear
13.89
0.00
0.00
0.00
0.00
0.00
0.40
Banana
29.23
0.00
0.00
0.00
0.00
0.00
0.00
Fruits studied
135.19
0.00
0.00
0.00
0.00
0.00
4.14
Fruits considered
193.61
0.00
0.00
0.00
0.00
0.00
5.92
Dietary Intake of As, Cd, Hg, and Pb by the Catalonia Population
125

that for intake estimations in the present study values not detected were assumed to be
equal to zero (ND=0), while in the 2000 survey ND values were considered to be equal to
1/2 LOD. Probably, the present assumption is more realistic, but there is no doubt that it can
also add a distortion factor.
Table 2 (continued)
Daily
intake
(g/day)
As intake
(
μg/day)
Inorganic
As intake
(
μg/day)
Cd intake
(
μg/day)
Hg intake
(
μg/day)
MeHg
intake
(
μg/day)
Pb intake
(
μg/day)
Eggs
31.07
0.00
0.00
0.00
0.00
0.00
1.31
Eggs studied
31.07
0.00
0.00
0.00
0.00
0.00
1.31
Eggs considered
31.29
0.00
0.00
0.00
0.00
0.00
1.31
Whole milk
86.93
0.00
0.00
0.00
0.00
0.00
2.96
Semi-skimmed milk
40.18
0.00
0.00
0.00
0.00
0.00
3.78
Milk studied
127.12
0.00
0.00
0.00
0.00
0.00
6.73
Milk considered
128.39
0.00
0.00
0.00
0.00
0.00
6.80
Yoghurt
46.47
0.00
0.00
0.00
0.00
0.00
1.58
Cheese
9.70
0.00
0.00
0.00
0.00
0.00
0.00
Dairy products
studied
56.17
0.00
0.00
0.00
0.00
0.00
1.58
Dairy products
considered
75.62
0.00
0.00
0.00
0.00
0.00
2.13
French bread
107.51
0.00
0.00
0.00
0.00
0.00
4.30
Sandwich bread
5.23
0.00
0.00
0.00
0.00
0.00
0.36
Rice
42.23
7.60
7.60
0.00
0.00
0.00
1.44
Pasta
62.20
0.00
0.00
2.11
0.00
0.00
1.99
Cereals studied
217.16
7.60
7.60
2.11
0.00
0.00
8.08
Cereals considered
224.33
7.85
7.85
2.18
0.00
0.00
8.35
Lentil
8.93
0.00
0.00
0.00
0.00
0.00
0.00
Haricot bean
6.51
0.00
0.00
1.52
0.00
0.00
0.61
Pulses studied
15.45
0.00
0.00
1.52
0.00
0.00
0.61
Pulses considered
30.36
0.00
0.00
3.00
0.00
0.00
1.20
Olive oil
24.08
0.00
0.00
0.00
0.00
0.00
0.00
Sunflower oil
1.85
0.00
0.00
0.30
0.00
0.00
0.59
Margarine
0.36
0.00
0.00
0.00
0.00
0.00
0.00
Butter
0.81
0.00
0.00
0.00
0.00
0.00
0.00
Oils and fats studied
27.09
0.00
0.00
0.30
0.00
0.00
0.59
Oils and fats
considered
27.16
0.00
0.00
0.31
0.00
0.00
0.59
Croissant
8.43
0.00
0.00
0.00
0.00
0.00
0.00
Cookie
4.27
0.00
0.00
0.00
0.00
0.00
0.00
Fairy cake
6.34
0.00
0.00
0.00
0.00
0.00
0.23
Industrial bakery
studied
19.04
0.00
0.00
0.00
0.00
0.00
0.23
Industrial bakery
considered
45.45
0.00
0.00
0.00
0.00
0.00
0.56
Total food study
987.89
206.05
27.45
7.86
9.89
8.90
36.88
Total food
considered
1,228.36
261.01
33.17
9.80
12.61
11.35
45.13
For each food group, the arithmetic mean value of the described same category foodstuffs is indicated in
bold. Data on studied products refer to all the above indicated items, while considered products (also in bold)
refer to all consumed foods although not necessarily analyzed in the current study.
126
Martí-Cid et al.

For As, the only groups currently contributing with measurable amounts to intake of
total As were fish and shellfish (253.16
μg/day) and cereals (7.85 μg/day). Both groups
were also the main contributors to total As intake in 2000 [
]. The increase in dietary
intake of As (16.7%) between both studies is mainly due to the increase in the contribution of
fish and shellfish (currently 253.16 vs. 203.32
μg/day). For comparison of results, it is
important to remark that, in the 2000 survey, only three species of fresh fish and shellfish and
two species of canned fish were included vs. the 14 species of fish and shellfish analyzed in
the present study. However, the daily consumption of fish and shellfish decreased from 92 g
(2000) to 68 g (current). For Cd intake, there was a notable reduction (37.7%) between both
surveys (15.73
μg/day in 2000 vs. the current 9.80 μg/day). The current highest contribution
to total Cd intake corresponded to pulses (3.00
μg/day), followed by tubers (2.34 μg/day) and
cereals (2.18
μg/day). In the 2000 study, the highest Cd contribution corresponded to cereals
(6.80
μg/day), followed by fish and shellfish (3.33 μg/day) and tubers (1.47 μg/day). In the
present study, total dietary intake of Hg was estimated to be 12.61
μg/day. Although in
principle, it would mean a notable reduction of 40.6%, it must be noted that, for calculations,
the current contribution was only due to fish and shellfish. Daily Pb intake increased notably
(59.1%) between both studies. This increase was found in almost all food groups, fish and
shellfish being the only group showing an important reduction. As in the 2000 survey [
cereals were the group with the highest contribution to total Pb intake.
The intakes (microgram per day) through the diet of total and inorganic As, Cd, total Hg
and methylmercury (MeHg), and Pb by the population of Catalonia classified according to
gender and age are depicted in Figs.
,
,
, and
. For total As (Fig.
), the highest
Table 3 Food Consumption and Intake of Arsenic, Cadmium, Mercury, and Lead through the Diet of Male
Adults in Catalonia, Spain
Daily
consumption
a
(g) 2006
As
intake
b
(
μg/day)
Inorganic
As intake
(
μg/day)
Cd
intake
(
μg/day)
Hg
intake
(
μg/day)
MeHg
intake
(
μg/day)
Pb
intake
(
μg/day)
Meat and meat
products
172 (14.0)
0.00
0.00
0.00
0.00
0.00
7.16
Fish and shellfish
68 (5.5)
0.00
0.00
0.00
0.00
0.00
6.80
Vegetables
160 (13.0)
0.00
0.00
0.00
0.00
0.00
0.36
Tubers
73 (5.9)
7.60
7.60
2.11
0.00
0.00
8.08
Fruits
194 (15.8)
0.00
0.00
0.00
0.00
0.00
0.00
Eggs
31 (2.5)
0.00
0.00
0.00
0.00
0.00
0.00
Milk
128 (10.5)
0.00
0.00
0.00
0.00
0.00
0.00
Dairy products
76 (6.2)
206.05
27.45
7.86
9.89
8.90
36.88
Cereals
224 (18.3)
0.00
0.00
0.00
0.00
0.00
0.00
Pulses
30 (2.5)
0.00
0.00
0.00
0.00
0.00
0.00
Oils and fats
27 (2.2)
0.00
0.00
0.00
0.00
0.00
0.00
Bakery products
45 (3.7)
0.00
0.00
0.00
0.00
0.00
0.00
Total intake
1,228 (100)
213.65
35.05
9.97
9.89
8.90
59.28
Total intake
(
μg/kg body
weight per day)
3.05
0.50
0.14
0.14
0.13
0.85
Results are given for a male adult of 70-kg body weight
a
Percentages of total consumption are presented in parenthesis.
b
Data were calculated assuming that, when a concentration was below the detection limit, the concentration
was equal to zero.
Dietary Intake of As, Cd, Hg, and Pb by the Catalonia Population
127
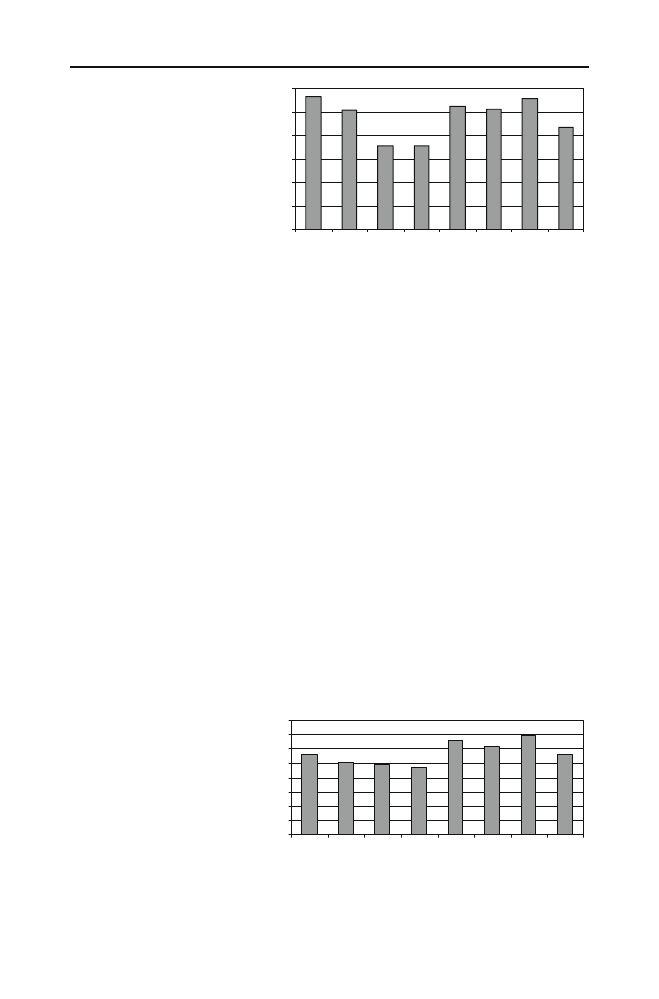
intakes corresponded to boys and male seniors, while the lowest intake was observed in
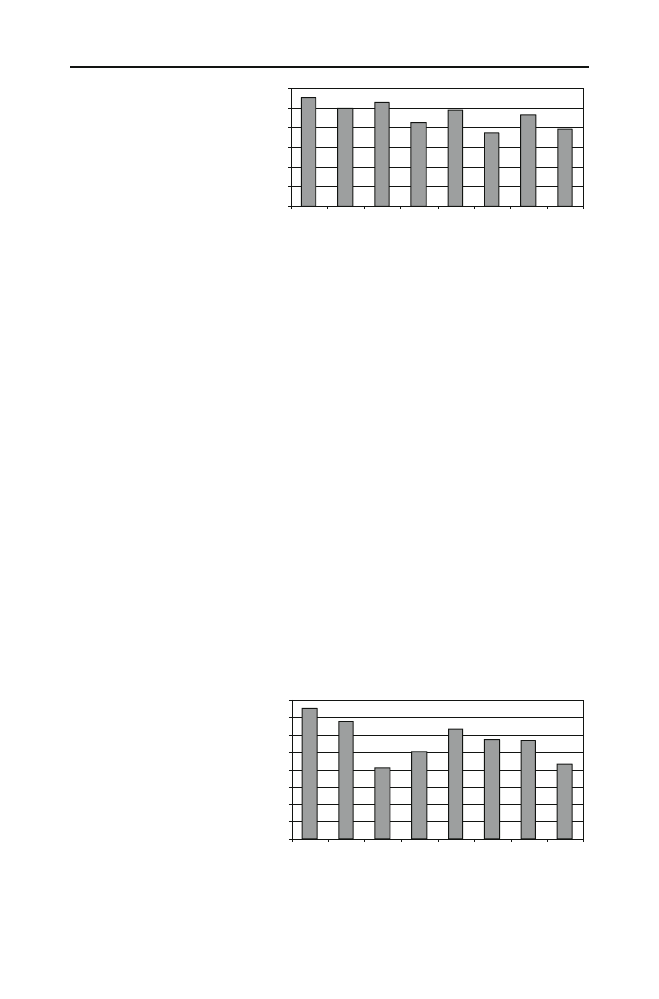
adolescents (males and females). However, the highest intake (Fig.
) of inorganic As was
found in male seniors and adults. In turn, boys and male adolescents were the groups
showing the highest Cd intake (Fig.
), while the lowest intakes corresponded to female
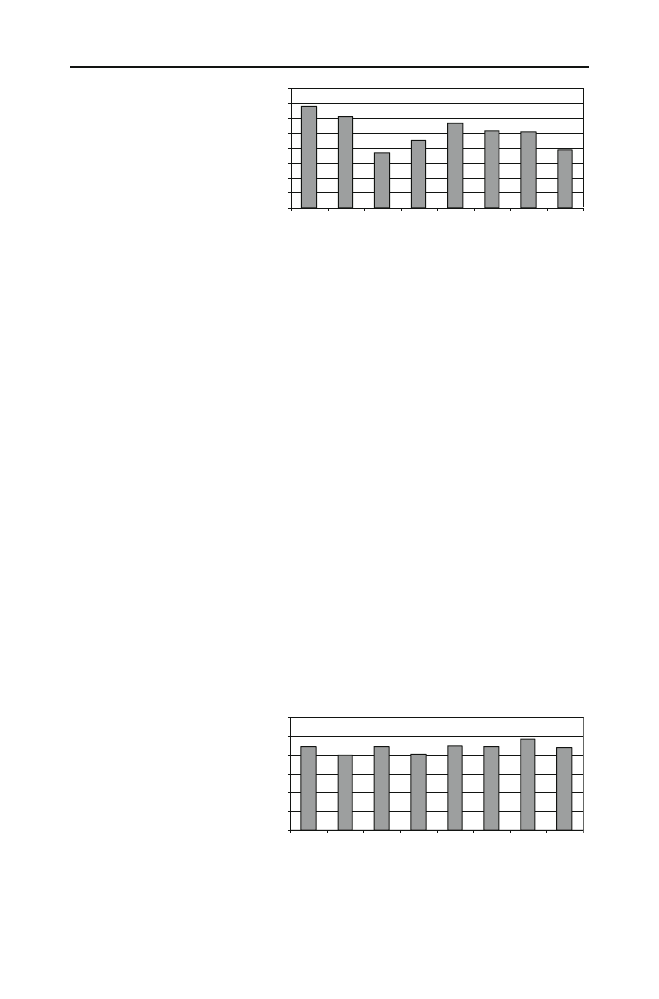
adults and seniors. For both, total Hg (Fig.
) and MeHg (Fig.
), children (boys and girls)
showed the highest intake. By contrast, the lowest intake was observed in male adolescents
and in female seniors. Finally, all age
–gender groups showed similar Pb intakes, the
differences among groups being rather small (Fig.
For the assessment of health risks of the above intakes, these have been compared with
the current provisional tolerable weekly intakes (PTWI) for As, Cd, Hg, and Pb [
]. For
inorganic As, the PTWI is 15
μg/kg of body weight per week or 128 μg/day for a subject of
60 kg. In the present study, all analyses were carried out for total (organic and inorganic)
As. However, it is well known that most As found in fish and shellfish is organic As, which
is the less toxic form. In the literature, the percentage of inorganic As in fish and shellfish
has been reported to be between 0.02% and 11% [
,
], whereas the maximum
acceptable daily load for As, set by the WHO in 1967 and unrevised in 1989, is 3,000
μg
for a subject of 60 kg [
]. Taking this into account, in the current study, the estimated
intake of As would not be of concern for any age group. The total As intake was lower than
that found in traditional fish-consuming countries such as the Basque country (Spain) and
Japan, with values of 297
μg/day [
] and 280
μg/day [
], respectively. The current total
Total As (µg/day)
0
50
100
150
200
250
300
B
oys
G
irls
Ma
le
A
do
le
sce
nts
Fe
m
al
e A
do
le
sc
ent
s
M
al
e
A
du
lt
Fe
m
al
e
A
du
lt
M
al
e
S
en
iors
Fe
ma
le
S
eni
or
s
Fig. 1 Dietary intake of total As
by the population of Catalonia.
The intake was calculated by
summing the results of multiply-
ing the total As concentration in
each specific food item by the
amount consumed of that item by
each group of population (data
from Serra-Majem et al. [
])
Inorganic As (µg/day)
0
5
10
15
20
25
30
35
40
Bo
ys
G
irls
Male
Adol
escent
s
Femal
e Adolescen
ts
M
ale
Ad
ul
t
Fe
ma
le Ad
ult
M
ale
Se
ni
ors
Fe
m
al
e Se
niors
Fig. 2 Dietary intake of inorgan-
ic As by the population of Cata-
lonia. The intake was calculated
by summing the results of multi-
plying the inorganic As concen-
tration in each specific food item
by the amount consumed of that
item by each group of population
(data from Serra-Majem et al.
[
128
Martí-Cid et al.
As intake for a male adult of 70-kg body weight was similar or lower to those found in
previous studies of our research group performed in Tarragona Province (Catalonia):
273
μg/day in 1998 [
] and 458
μg/day in 2003 [
For a male adult, the current Cd intake is notably lower than the PTWI of this element
(60
μg/day for a subject of 60 kg). This Cd intake is similar to or lower than that recently
reported for other European countries and regions: Canary Islands (Spain), 11
μg/day [
];
UK, 12
μg/day [
]; Basque country, 11
–29 μg/day [
]; France, 17
μg/day [
]; Denmark,
15
μg/ day [
]; Germany, 22.2
μg/day [
]; and Huludao City (China), 41.9
μg/day [
It was also lower than the intake found in our previous surveys performed in Tarragona
Province: 18.2
μg/day [
] and 14.3
μg/day [
The Hg PTWI has been established at 5
μg/kg of body weight as total Hg or 43 μg/day
for an individual of 60-kg body weight [
]. In the present survey, the dietary Hg intakes
for all age
–gender groups were lower than the PTWI. However, they were higher than those
previously reported for subjects living in Tarragona Province, 4.8
μg/day [
] and 5.3
μg/
day [
] or for British 3
μg/day [
], Danish, 3.3
μg/day [
], or Chinese, 2.14
μg/day [
]
populations. However, it is important to note the reduction found with respect to our 2000
survey (21.2
μg/day for an adult male) [
].
For Pb, a PTWI of 25
μg/kg of body weight was established by the FAO–WHO [
which is equivalent to 214
μg/day for an individual of 60 kg. In the current study, the
highest Pb intake corresponded to male seniors (48
μg/day for 65-kg body weight), a value
Cd (µ
g/day
)
0
2
4
6
8
10
12
Bo
ys
Gi
rls
Ma
le
A
do
le
sce
nt
s
Fe
ma
le
A
do
le
sc
en
ts
M
ale
A
dul
t
Fem
al
e
A
du
lt
M
ale
S
en
io
rs
Fe
ma
le Se
ni
or
s
Fig. 3 Dietary intake of Cd by
the population of Catalonia. The
intake was calculated by sum-
ming the results of multiplying
the Cd concentration in each
specific food item by the amount
consumed of that item by each
group of population (data from
Serra-Majem et al. [
Hg (µg/day)
0
2
4
6
8
10
12
14
16
Boys
Girls
Male Adolescents
Female Adolescents
Male Adult
Female Adult
Male Seniors
Female Seniors
Fig. 4 Dietary intake of total Hg
by the population of Catalonia.
The intake was calculated by
summing the results of multiply-
ing the total Hg concentration in
each specific food item by the
amount consumed of that item by
each group of population (data
from Serra-Majem et al. [
])
Dietary Intake of As, Cd, Hg, and Pb by the Catalonia Population
129
equivalent to 20.7% of the PTWI. In contrast with the general tendency reported for most
developed countries, Pb intake was increased in relation with our 2000 survey. However, it
is still lower or similar than that found to other studies performed in Catalonia during the
1990s, 115
μg/day [
] and 49
μg/day [
], and the present decade, 44.8
μg/day [
]. The
current intakes are also of similar magnitude to those reported for other industrialized
countries such as the Basque country, 34
μg/day [
], or France, 52
μg/day [
]. However,
they are still higher than Pb intake in Denmark, with a median of 18
μg/day [
], and UK,
26
μg/day [
], but lower than recent results found in Canary Islands, 72.8
μg/day [
], or
in the area of Huludao City, China, 81.5
μg/day [
]. In a recent study to assess health risks
of metal from consuming vegetables, fruits and rice grown on soils irrigated with waters of
the Ebro River in Catalonia, the intake for an adult male was 7.97
μg/day for As and 1.70
for Pb, being negligible for Cd and Hg [
].
In comparison with our previous (2000) survey [
], the dietary intakes of As, Cd, Hg,
and Pb by the population of Catalonia have shown some relevant changes. Thus, while
daily intake of total As and Pb increased, those of Cd and total Hg decreased. The reason
for these changes is mainly due to the variations in the concentrations of these elements
found in the analyzed foods. Especially amazing has been the increase found in Pb intake,
as it seemed already sufficiently demonstrated that in recent years the atmospheric levels of
this element were being significantly reduced. Further studies should corroborate if this
trend still remains. Anyhow, the estimated intakes of As, Cd, Hg, and Pb are notably lower
MeHg (µg/day)
0
2
4
6
8
10
12
14
16
Boys
Girls
Male Adolescents
Female Adolescents
Male Adult
Female Adult
Male Seniors
Female Seniors
Fig. 5 Dietary intake of MeHg
by the population of Catalonia.
The intake was calculated by
summing the results of multiply-
ing the MeHg concentration in
each specific food item by the
amount consumed of that item by
each group of population (data
from Serra-Majem et al. [
])
Pb (
µ
g/day)
0
10
20
30
40
50
60
B
oys
G
irls
Ma
le
A
do
le
sc
en
ts
Fem
al
e Ad
ol
es
ce
nt
s
Ma
le
Ad
ul
t
Fe
ma
le
Ad
ult
Ma
le
S
en
io
rs
Fe
ma
le
S
en
io
rs
Fig. 6 Dietary intake of Pb by
the population of Catalonia. The
intake was calculated by sum-
ming the results of multiplying
the Pb concentration in each
specific food item by the amount
consumed of that item by each
group of population (data from
Serra-Majem et al. [
130
Martí-Cid et al.

than the respective PTWIs, which indicates that these intakes should not mean additional
health risks for the consumers.
Acknowledgment This study was supported by the Catalan Food Safety Agency, Department of Health,
Generalitat de Catalunya, Barcelona, Catalonia, Spain.
References
1. Biegalski S, Landsberger S (1999) An evaluation of atmospheric deposition of trace elements into the
Great Lakes. Biol Trace Elem Res 71
–72:247–256
2. Cook AG, Weinstein P, Centeno JA (2005) Health effects of natural dust: role of trace elements and
compounds. Biol Trace Elem Res 103:1
–15
3. Massadeh A, Al-Momani F, Elbetieha A (2008) Assessment of heavy metals concentrations in soil
samples from the vicinity of busy roads: influence on Drosophila melanogaster life cycle. Biol Trace
Elem Res 122:292
–299
4. Rainbow PS (2007) Trace metal bioaccumulation: models, metabolic availability and toxicity. Environ
Int 33:576
–582
5. Zhang L, Wong MH (2007) Environmental mercury contamination in China: sources and impacts.
Environ Int 33:108
–121
6. Chang LW (1996) Toxicology of metals. CRC Lewis, Boca Raton
7. Llobet JM, Granero S, Schuhmacher M, Corbella J, Domingo JL (1998) Biological monitoring of
environmental pollution and human exposure to metals in Tarragona, Spain. IV. Estimation of the dietary
intake. Trace Elem Electrolytes 25:136
–141
8. Leblanc JC, Malmauret L, Guérin T, Bordet F, Boursier B, Verger P (2000) Estimation of the dietary
intake of pesticide residues, lead, cadmium, arsenic and radionuclides in France. Food Addit Contam
17:925
–932
9. Bocio A, Nadal M, Domingo JL (2005) Human exposure to metals through the diet in Tarragona, Spain:
temporal trend. Biol Trace Elem Res 104:193
–201
10. Ferré-Huguet N, Martí-Cid R, Schuhmacher M, Domingo JL (2008) Risk assessment of metals from
consuming vegetables, fruits and rice grown on soils irrigated with waters of the Ebro River in Catalonia,
Spain. Biol Trace Elem Res 123:66
–79
11. Zukowska J, Biziuk M (2008) Methodological evaluation of method for dietary heavy metal intake. J
Food Sci 73:R21
–R29
12. Jedrychowski W, Perera F, Jankowski J, Rauh V, Flak E, Caldwell KL, Jones RL, Pac A, Lisowska-
Miszczyk I (2007) Fish consumption in pregnancy, cord blood mercury level and cognitive and
psychomotor development of infants followed over the first three years of life: Krakow epidemiologic
study. Environ Int 33:1057
–1062
13. Falcó G, Llobet JM, Bocio A, Domingo JL (2006) Daily intake of arsenic, cadmium, mercury, and lead
by consumption of edible marine species. J Agric Food Chem 54:6106
–6112
14. Bocio A, Llobet JM, Domingo JL, Corbella J, Teixidó A, Casas C (2003) Polybrominated diphenyl
ethers (PBDEs) in foodstuffs: human exposure through the diet. J Agric Food Chem 51:3191
–3195
15. Bocio A, Llobet JM, Domingo JL (2004) Human exposure to polychlorinated diphenyl ethers through
the diet in Catalonia, Spain. J Agric Food Chem 52:1769
–1772
16. Domingo JL, Falcó G, Llobet JM, Casas C, Teixidó A, Müller L (2003) Polychlorinated naphthalenes in
foods: estimated dietary intake by the population of Catalonia, Spain. Environ Sci Technol 37:2332
–2335
17. Falcó G, Domingo JL, Llobet JM, Teixidó A, Casas C, Müller L (2003) Polycyclic aromatic
hydrocarbons in foods: human exposure through the diet in Catalonia, Spain. J Food Prot 66:2325
–2331
18. Falcó G, Bocio A, Llobet JM, Domingo JL, Casas C, Teixidó A (2004) Dietary intake of
hexachlorobenzene in Catalonia, Spain. Sci Total Environ 322:63
–70
19. Llobet JM, Falcó G, Casas C, Teixidó A, Domingo JL (2003) Concentrations of arsenic, cadmium,
mercury, and lead in common foods and estimated daily intake by children, adolescents, adults, and
seniors of Catalonia, Spain. J Agric Food Chem 51:838
–842
20. Llobet JM, Bocio A, Domingo JL, Teixidó A, Casas C, Müller L (2003) Levels of polychlorinated
biphenyls in foods from Catalonia, Spain: estimated dietary intake. J Food Prot 66:479
–484
21. Llobet JM, Domingo JL, Bocio A, Casas C, Teixidó A, Müller L (2003) Human exposure to dioxins
through the diet in Catalonia, Spain: carcinogenic and non-carcinogenic risk. Chemosphere 50:1193
–1200
Dietary Intake of As, Cd, Hg, and Pb by the Catalonia Population
131

22. FAO/WHO (1985) Guidelines for the study of dietary intakes of chemical contaminants, publication 87.
World Health Organization, Geneva
23. Serra-Majem L, Ribas L, Salvador G, Castells C, Serra J, Jover L, Treserras R, Farran A, Román B,
Raidó B, Taberner JL, Salleras L, Ngo J (2003) Avaluació de l
’estat nutricional de la població catalana
2002
–2003. Evolució dels hàbits alimentaris i del consum d’aliments i nutrients a Catalunya (1992–
2003). Direcció General de Salut Pública, Departament de Sanitat i Seguretat Social, Generalitat de
Catalunya, Barcelona (in Catalan)
24. Muñoz O, Devesa V, Suñer MA, Vélez D, Montoro R, Urieta I, Macho ML, Jalón M (2000) Total and
inorganic arsenic in fresh and processed fish products. J Agric Food Chem 48:4369
–4376
25. FAO/WHO (1993) Evaluation of certain food additives and contaminants, technical report series 837.
World Health Organization, Geneva
26. FAO/WHO (1989) Evaluation of certain food additives and contaminants, technical report series 759.
World Health Organization, Geneva
27. Jalón M, Urieta I, Macho ML, Azpiri M (1997) Metales Pesados y Arsénico. In: Vigilancia de la
Contaminación Química de los Alimentos en la Comunidad Autónoma del País Vasco 1990
–1995.
Servicio Central de Publicaciones del Gobierno Vasco, Vitoria, Spain, pp 29
–43
28. Tsuda T, Inoue T, Kojima M, Aoki S (1995) Market basket and duplicate portion estimation of dietary
intakes of cadmium, mercury, arsenic, copper, manganese and zinc by Japanese adults. J AOAC Int
78:1363
–1368
29. Rubio C, Hardisson A, Reguera JI, Revert C, Lafuente MA, González-Iglesias T (2006) Cadmium
dietary intake in the Canary Islands, Spain. Environ Res 100:123
–129
30. Ysart G, Miller P, Croasdale M, Crews H, Robb P, Baxter M, de l
’Argy C, Harrison N (1997) UK total
diet study-dietary exposures to aluminium, arsenic, cadmium, chromium, copper, lead, mercury, nickel,
selenium, tin and zinc. Food Addit Contam 17:775
–786
31. Urieta I, Jalón M, Equileror I (1996) Food surveillance in the Basque Country (Spain). II. Estimation of
the dietary intake of organochlorine pesticides, heavy metals, arsenic, aflatoxin M1, iron and zinc
through the Total Diet Study, 1990/1991. Food Addit Contam 13:29
–52
32. Larsen EH, Andersen NL, Moller A, Petersen A, Mortensen GK, Petersen J (2002) Monitoring the
content and intake of trace elements from food in Denmark. Food Addit Contam 19:33
–46
33. Wilhelm M, Wittsiepe J, Schrey P, Budde U, Idel H (2002) Dietary intake of cadmium by children and
adults from Germany using duplicate portion sampling. Sci Total Environ 285:11
–19
34. Zheng N, Wang Q, Zhang X, Zheng D, Zhang Z, Zhang S (2007) Population health risk due to dietary
intake of heavy metals in the industrial area of Huludao City, China. Sci Total Environ 387:96
–104
35. Schuhmacher M, Bosque MA, Domingo JL, Corbella J (1991) Dietary intake of lead and cadmium from
foods in Tarragona Province, Spain. Bull Environ Contam Toxicol 46:320
–328
36. Rubio C, González-Iglesias T, Revert C, Reguera JI, Gutiérrez AJ, Hardisson A (2005) Lead dietary
intake in a Spanish population (Canary Islands). J Agric Food Chem 53:6543
–6549
132
Martí-Cid et al.
Document Outline
Wyszukiwarka
Podobne podstrony:
Dietary intake and biochemical, hematologic, and immune status of vegans compared with nonvegetarian
Christopher, John Tripods 02 The City of Gold and Lead rtf
Nutrient intake of highly competitive male and female colleg doc
Rehren The archeometallurgy of copper and lead and their related alloys
A Treatise of Mercury and the Philosophers Stone
HUME AND?SCARTES ON THE THEORY OF IDEAS
Phoenicia and Cyprus in the firstmillenium B C Two distinct cultures in search of their distinc arch
Pearson Archeology of death and Burial Eating the body
The Three Great Compromises that lead to the establishment of
Student Roles and Responsibilities for the Masters of Counsel
Master Wonhyo An Overview of His Life and Teachings by Byeong Jo Jeong (2010)
20 Seasonal differentation of maximum and minimum air temperature in Cracow and Prague in the period
Labyrinth13 True Tales of Occult Crime and Conspiracy by Curt Rowlett 3rd edn (2013)
Derrida, Jacques Structure, Sign And Play In The Discourse Of The Human Sciences
więcej podobnych podstron