
Journal of Chromatography A, 897 (2000) 269–277
www.elsevier.com / locate / chroma
Reduction of adsorption phenomena of volatile aldehydes and
aromatic compounds for static headspace analysis of cellulose based
packaging materials
*
Thomas Wenzl, Ernst P. Lankmayr
Institute for Analytical Chemistry
, Micro- and Radiochemistry, Technical University of Graz, Technikerstrasse 4, 8010 Graz, Austria
Received 5 June 2000; received in revised form 21 July 2000; accepted 24 July 2000
Abstract
Headspace analysis of solid samples is frequently hampered by severe matrix effects due to adsorption phenomena of the
analytes on polar matrix surfaces. Since adsorption can give rise to incorrect results, a possible alternative can be provided
by a transfer of the adsorption system into a partition system. This can be accomplished by the addition of substances, which
exhibit higher affinity to the matrix than the analyte, thus acting as displacer or modifier.The effect of water as displacer for a
quantitative static headspace analysis of straight chained saturated aldehydes and mononuclear aromatics (benzene, toluene,
xylenes and ethylbenzene) in cellulose based packaging material has been investigated. Special emphasis was given to an
establishment of distribution equilibrium conditions. For this, the influence of the amount of added displacer was studied by
means of a multiple headspace extraction procedure coupled to gas chromatography with mass spectrometric detection and
selected ion monitoring.
2000 Elsevier Science B.V. All rights reserved.
Keywords
: Cardboard; Headspace analysis; Adsorption; Distribution equilibrium; Extraction methods; Multiple headspace
extraction; Aldehydes; Benzene; Toluene; Ethylbenzene; Xylenes
1. Introduction
materials and the physical properties of the migrating
substances, the process of transfer can occur through
The control of the composition of products which
the gas phase as well as by direct contact of the
are intended for use as packaging materials is
packing and the product of value [1]. Until now,
essential, particularly, when they come into direct or
most investigations on this topic concern the migra-
also indirect contact with packed foodstuff. Transfer
tion of residual monomers, plasticizers and anti-
of substances from the packaging material into the
oxidants from plastic packaging into the food [2–5].
enclosed goods will potentially affect product qual-
Regulations of the European Union require that
ity. Depending on the arrangement of the packaging
‘‘there should not be a transference of substances
from the packaging into the food, which could
endanger humans health, which change the foods
*Corresponding author. Tel.: 143-316-873-8305; fax: 143-
composition characteristically and which deteriorate
316-873-8304.
sensorial properties’’ [6]. Especially the last require-
E-mail address
: lankmayr@analytchem.tu-graz.ac.at (E.P. Lan-
kmayr).
ment has to be investigated thoroughly, since the
0021-9673 / 00 / $ – see front matter
2000 Elsevier Science B.V. All rights reserved.
P I I : S 0 0 2 1 - 9 6 7 3 ( 0 0 ) 0 0 7 9 0 - 1

270
T
. Wenzl, E.P. Lankmayr / J. Chromatogr. A 897 (2000) 269 –277
threshold values of taste and odour of a large number
space sensitivity owing to analyte dilution and the
of substances, including volatile carbonyls, are quite
change of the partition coefficient. Since cardboard is
low [7].
not soluble, a valuable alternative for the reduction
The aim of this work was the analysis of volatile
of the matrix effects is the addition of a displacer,
aldehydes (C4–C7), which have low threshold odour
usually a liquid like carbon disulfide, benzyl alcohol
concentrations and volatile aromatic compounds like
or water, which competes for the polar adsorption
benzene, toluene, xylenes and ethylbenzene (BTEX),
sites on the solid surfaces [14]. Under optimized
which are of hygienic concern in recycling car-
conditions, a true distribution system can be estab-
dboard, by means of static headspace analysis. The
lished in this way.
origin of aldehydes in cardboard is mainly to be
In the present work the displacement characteris-
reasoned with the peroxidation of lipids, while traces
tics of water were investigated for the analysis of the
of BTEX aromatics may occur as residual solvents
target analytes in recycling quality cardboard.
from a previous printing process [8,9].
Several alternatives are available for the analysis
of volatile carbonyls from solid sample matrices.
2. Experimental
Common techniques include a solvent extraction of
the aldehydes followed by derivatization with either
2.1. Chemicals
2,4-dinitrophenylhydrazine (DNPH) and analysis by
HPLC with UV detection [10], or derivatization with
The aldehydes butanal, pentanal, hexanal, hepta-
O-pentafluorobenzylhydroxylamine
(PFBHA)
and
nal, octanal, nonanal and decanal were purchased
gas chromatographic analysis [11]. Liquid extraction
from Merck (Darmstadt, Germany), the quality was
and derivatization require several operation steps, a
pro
analysis.
Benzene,
toluene,
ethylbenzene,
direct analysis will be preferable for routine applica-
xylenes and glyceryl triacetate, which was used as a
tion, therefore. In principle, static as well as dynamic
solvent for the preparation of standards, were ob-
headspace extraction procedures directly coupled
tained from Aldrich (St. Louis, MO, USA), all with a
with gas chromatographic analysis are suited for this
purity better than 99%. Deionized water was pre-
purpose. Recently, an approach based on static
pared with a Barnstead Nanopure Ultrapure Water
headspace extraction combined with solid-phase
System from International PBI (Milan, Italy).
microextraction (SPME) has been introduced [12].
A crucial point with the direct gas phase extraction
2.2. Standards and samples
of solid samples by static headspace techniques,
however, is the presence of matrix effects which are
For calibration purposes an external vapour stan-
quite frequently responsible for incorrect, or irre-
dardization was applied. Standards were prepared by
producible results. The polar surface of cardboard
appropriate dilution of a stock solution containing
makes an adsorption of polar as well as moderately
the aldehydes butanal, pentanal, hexanal, heptanal,
polar
compounds
very
likely.
Adsorption
also
octanal, nonanal and decanal as well as the aromatics
changes the partition characteristics of the analytes.
benzene, toluene, ethylbenzene and xylenes (about 8
A direct establishment of the headspace equilibrium
mg / ml of each) dissolved in glyceryl triacetate to a
may be impossible, or at least very time consuming.
final concentration of 88 ng / ml up to 798 ng / ml.
Therefore, special emphasis has to be given a proper
Portions of 10 ml were pipetted into 22.5 ml head-
establishment of headspace distribution equilibrium.
space vials (Perkin-Elmer, Norwalk, CT, USA) in
Different approaches are suggested to overcome
order to obtain the gas phase standards. The phase
such matrix influences. The ‘‘solution approach’’,
ratio in the vials was kept constant by substitution of
proposed by Rohrschneider [13], is based on a
the sample volume with inert glass beads when sole
dissolution of the solid sample in an appropriate
gas phase standards were processed. For this purpose
solvent, thus breaking the adsorption bonds by
the solid-phase volume was determined by displace-
solvation of the analyte molecules. A potential
ment measurement.
2
disadvantage in trace analysis can be reduced head-
DIN A4 sized cardboard samples of 280 g / m

T
. Wenzl, E.P. Lankmayr / J. Chromatogr. A 897 (2000) 269 –277
271
were taken directly from the production process and
sampler was operated in 4-step multiple headspace
cut in the laboratory by means of a commercially
extraction mode. Open split coupling was chosen for
available annihilator (EBA 1226C, Adolf Ehinger,
connection of the headspace sampler interface to a
Balingen, Germany) to a size of 1.5 mm width and
Hewlett-Packard 5890 Series II gas chromatograph
15 mm length. If necessary, samples were stored at
(Hewlett-Packard, Wilmington, DE, USA), which
2208C in fully filled and tightly sealed 1 l glass
was equipped with a split / splitless injection port and
flasks. For analysis, portions of 1.5 g were weighed
connected to a Hewlett-Packard 5971A mass selec-
into 22.5 ml headspace sample vials. To investigate
tive detector. Separation was achieved with a DB
the influence of water onto the headspace equilib-
624 capillary column from J&W Scientific, 30 m3
rium, volumes of 50 ml, 100 ml and 200 ml were
0.25 mm internal diameter and 1.4 mm film thickness
added to the samples with piston-type pipettes of
(Folson, CA, USA). A brief compilation of the
appropriate volumes (Brand, Wertheim / Main, Ger-
operational parameters of the analysis is given in
many) and the results were compared with those of
Table 1.
untreated samples. Sample vials were tightly sealed
The target analytes were ionized by electron
with a butyl rubber septum and an aluminium
impact ionization at 70 eV and detected in single ion
crimped cap (Perkin-Elmer).
monitoring mode. Characteristic fragment masses,
grouped in run time windows, were selected for
2.3. Instrumentation and conditions of analysis
detection. Qualifier fragments were measured simul-
taneously to check for potential interference. This
Liquid volumes up to 100 ml were handled by
was done automatically during data analysis by
means of calibrated capillaries (Brand), while larger
calculation of the ratios of target ion signals to the
volumes were transferred with adjustable 1000 ml
qualifier ion signals. A second qualifier ion was
Transferpettors (Brand).
measured for the aldehydes to obtain additional
For headspace equilibration and sampling, a Per-
information about peak purity. The low masses of
kin-Elmer HS 40 automatic headspace sampler and
the fragment ions and less selective fragmentation of
22.5 ml headspace vials sealed with butyl septa and
the investigated compounds necessitates this pro-
crimp caps were used. For equilibrium studies the
cedure. A summary of the selected ion masses of the
Table 1
Experimental parameters of the headspace sampler and gas chromatograph
Headspace sampler
Pressurization gas
He 5.0 quality
Head pressure
110 kPa
Equilibration temperature
808C
Equilibration time
90 min
Pressurization time
3 min
Injection time
0.2 min
Hold up time
0.4 min
Vent time
24 s
Needle and transference line temperature
1208C
Gas chromatograph
Injection port temperature
2008C
Splitless time
1 min
Head pressure
90 kPa
Temperature program
408C hold for 0.4 min, 78C per min up to 1508C, than 308C per min up to 2508C, hold for 3 min
Detector temperature
2508C
Electron multiplier voltage offset
106 V starting at 2.4 min
Solvent delay
2.4 min
Detector off
19 min

272
T
. Wenzl, E.P. Lankmayr / J. Chromatogr. A 897 (2000) 269 –277
Table 2
List of measured target and qualifier ions grouped in run time windows
Compound
Group start time
Target ion
Qualifier ions
(min)
(mass / charge)
(mass / charge)
Butanal
2.4
41
39 and 72
Benzene
4.7
78
77
Pentanal
5.8
44
41 and 39
Toluene
7.1
91
92
Hexanal
8.3
72
67 and 82
Ethylbenzene
9.6
91
106
m- and p-Xylene
10.0
91
106
o-Xylene
10.7
91
106
Heptanal
11.7
70
55 and 81
target and qualifier ions is listed in Table 2. Data
V 2 V
V
s
]]
acquisition was carried out with a G1034C Hewlett-
b 5
(1)
V
s
Packard MS ChemStation, V. C 02.00.
where b is the phase ratio, V
the volume of the
V
2.4. Characterization of the headspace equilibrium
sample vial and V the sample volume.
s
and quantitative analysis
The partition coefficients were calculated by appli-
cation of the vapour phase calibration multiple
The headspace equilibrium conditions were in-
headspace extraction (VPC–MHE) method [14]. A
vestigated by means of a four step multiple head-
substantial variation of the distribution coefficient is
space extraction (MHE) procedure which was ap-
reflecting a deviation from equilibrium conditions. In
plied on all individual samples. In an ideal partition
order to reduce the influence of statistical random
system, the amount of a volatile analyte in the
variations of the individual data points on the area
headspace above the sample decreases with increas-
ratio values (Q ), which represents the ratio of the
ing extraction cycles according to an exponential
peak areas of two consecutive extraction steps, the
relationship. If the system is in equilibrium, a plot of
slopes ( q) of the regression curves according to Eq. 2
the logarithms of the headspace concentrations ex-
were used:
pressed by the chromatographic peak areas versus
2q
Q 5 e
(2)
the number of the extraction steps will produce a
where Q is the ratio of peak areas of a single
linear function [14]. The equation of the curve was
component after consecutive extraction and q the
determined by linear regression of the data points in
slope of regression curve.
Microsoft Excel for Windows 95 (V7.0). Conse-
Eq. (3) was applied for calculation of the partition
quently, the numerical value of the linear correlation
2
coefficient according to the VPC–MHE method:
coefficient (r ) will be reflecting the quality of the
distribution equilibrium, any significant deviation
Q 2 Q
st
s
]]]
K 5
?
b
(3)
from unity is indicative of interferences.
Q 2 1
s
The two parameters phase ratio ( b ) and partition
coefficient (K ) of the volatiles are essential to
where K is the partition coefficient, b the phase
express the establishment of a partition equilibrium.
ratio, Q
the area ratio value of the standard and Q
st
s
Since vial size and sample volume were not altered
the area ratio of the sample.
throughout the experiments, the phase ratio, which
The total amount of analyte in the sample can be
was calculated according to Eq. 1, was kept constant.
determined by extrapolation of the regression curve
The addition of displacer reduced the volume of the
to infinity. The corresponding signal is the total peak
gas phase less than 1% and required no further
area, which would be obtained if the whole amount
corrections, therefore:
of analyte in the sample could be injected into the
T
. Wenzl, E.P. Lankmayr / J. Chromatogr. A 897 (2000) 269 –277
273
GC within one extraction. Calculation of this value
chromatogram of standard mixture recorded under
was performed according to Eq. (4) [15]:
conditions as pointed out in the Experimental section
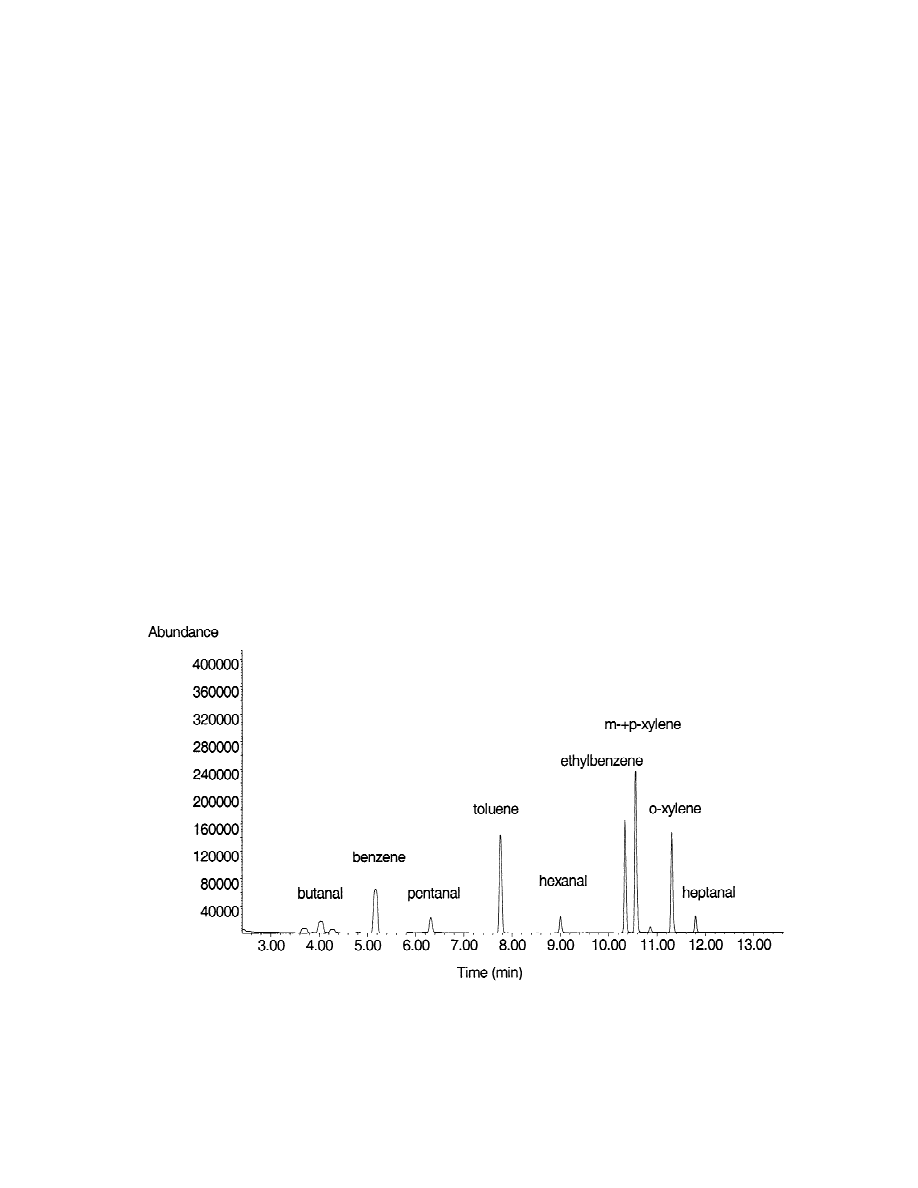
is depicted in Fig. 1. Apparently, selectivity of
n 5`
*
A
1
separation and detection are sufficient for the re-
]]]
O
A 5
(4)
2q
n
1 2 e
n 51
quired purpose.
In order to establish the suitability of water as a
where n is the number of extractions, A the total
n
displacer, a set of homogenized cardboard samples
*
peak area, A
the intercept of regression curve with
1
with different amounts of water added was analyzed.
the y-axis and q the slope of the regression curve.
The correlation coefficients of the regression curves
The limits of detection were calculated from
for the MHE analysis are listed in Table 3. The
calibration data of three replicate measurements of
values represent the mean of three replicate samples
standard mixtures at four concentration levels using
including also their standard deviations. The lowest
the ValiData macro for MS-Excel V 1.04 (Rohrer &
correlation coefficients are obtained for the untreated
Wegscheider, Graz, Austria) [16].
samples. With an increasing amount of added water
2
also, the values of r rose and reached nearly unity
in the case of the aldehydes. Closest approximation
3. Results
to ideal linearity was observed for hexanal. Remain-
ing deviations from unity are the result of statistical
random variations of the measurements.
3.1. Effect of the addition of displacer onto the
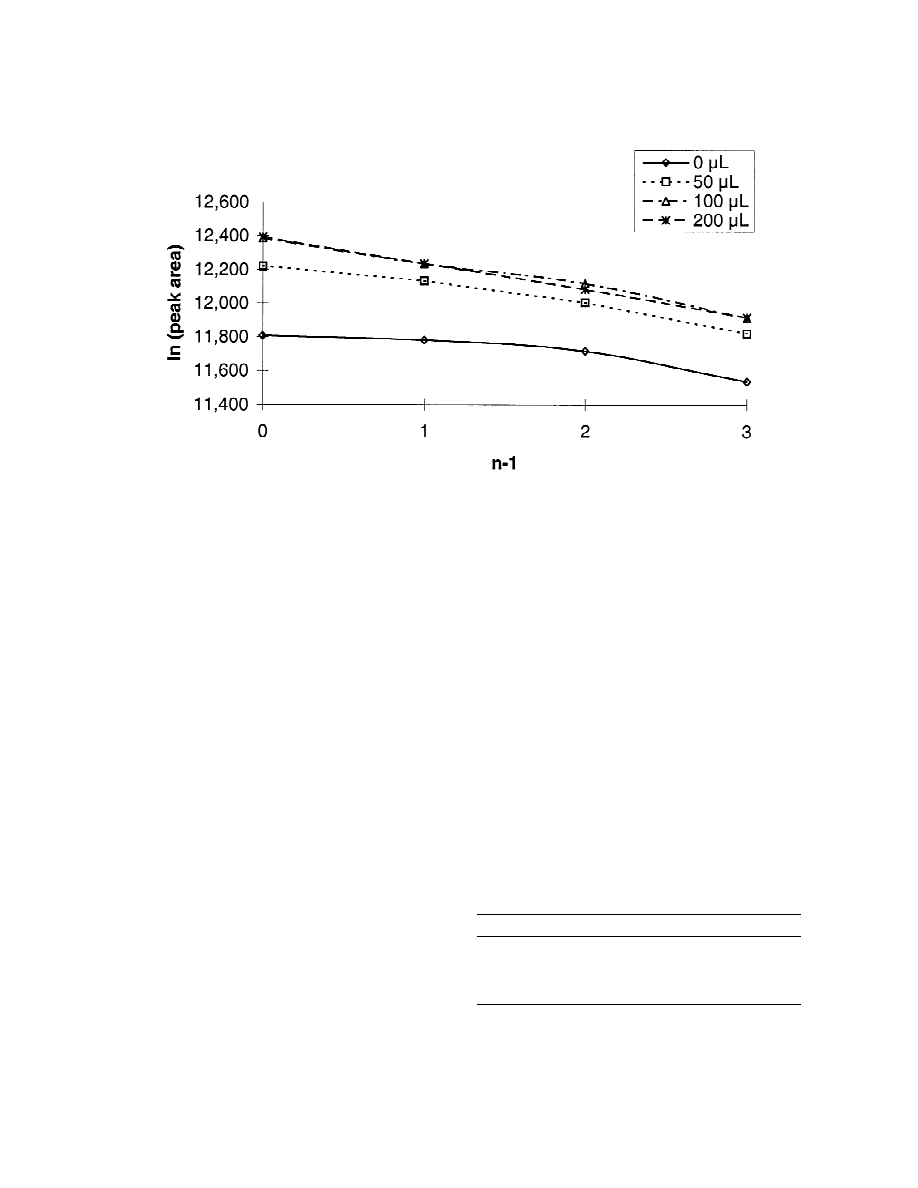
For a visualization of the displacer effect, pentanal
headspace equilibrium
was chosen as representative target analyte. The
result of the appropriate MHE analyses is shown in
A prerequisite for all further analyses was a proper
Fig. 2 by plotting the logarithms of the peak areas
separation and identification of the target compounds
from all displacer dosage experiments versus the
by combined headspace analysis and gas chromatog-
number of extraction steps minus one. To character-
raphy with mass spectrometric detection. A typical
Fig. 1. Typical chromatogram of standard mixture.

274
T
. Wenzl, E.P. Lankmayr / J. Chromatogr. A 897 (2000) 269 –277
Table 3
2
Mean values (Mean) and standard deviations (SDs) of the regression coefficients r
of MHE regression curves of three replicate
measurements in dependence of the added displacer volume
Compound
0 ml
50 ml
100 ml
200 ml
Mean
SD
Mean
SD
Mean
SD
Mean
SD
Butanal
0.722
0.053
0.965
0.013
0.981
0.004
0.993
0.001
Pentanal
0.859
0.005
0.982
0.006
0.990
0.002
0.997
0.001
Hexanal
0.990
0.004
0.997
0.001
0.998
0.002
0.998
0.001
Heptanal
0.862
0.048
0.976
0.001
0.985
0.005
0.997
0.002
Benzene
0.557
0.071
0.868
0.028
0.934
0.016
0.978
0.018
Toluene
0.950
0.029
0.971
0.018
0.949
0.036
0.982
0.009
Ethylbenzene
0.896
0.057
0.993
0.001
0.992
0.005
0.995
0.005
m-1p-Xylene
0.964
0.035
0.995
0.004
0.963
0.014
0.987
0.005
o-Xylene
0.983
0.015
0.991
0.004
0.997
0.003
0.997
0.001
ize the shapes of the extraction curves, the corre-
As can be seen from Table 3, similar results were
sponding data points are distinguished by different
obtained for volatile aromatic compounds. Especially
types of lines. The curvature of the continuous line
for the most volatile compounds, benzene and
connecting the data points of untreated samples is
toluene, equilibrium was not reproducibly estab-
typical for adsorption systems, whereas the dashed
lished. This is indicated by an increase in the
line, which was obtained after addition of 200 ml
standard deviations of the correlation coefficients. A
water, exemplifies good approximation to a partition
typical MHE plot is displayed in Fig. 3 which
system. The fit of linearity expressed as a correlation
represents the influence of the displacer dosage onto
2
coefficient is r 50.858 for the untreated sample and
the linearity for toluene. In a quite analogous manner
2
r 50.999 for the sample with an amount of 200 ml
as had been observed for the analysis of the alde-
displacer for an 1.5 g cardboard sample quantity.
hydes, headspace equilibria of the aromatic com-
Fig. 2. Influence of the displacer addition onto MHE of pentanal. Plot of the logarithms of the peak areas of pentanal obtained in four
consecutive headspace extractions of samples with varying displacer content versus the number of extractions (n) reduced by one.
T
. Wenzl, E.P. Lankmayr / J. Chromatogr. A 897 (2000) 269 –277
275
Fig. 3. Influence of the displacer addition onto MHE of toluene. Plot of the logarithms of the peak areas of toluene obtained in four
consecutive headspace extractions of samples with varying displacer content versus the number of extractions (n) reduced by one.
pounds are significantly improved by the addition of
establishment of the static headspace equilibrium of
water as displacer. For the given experimental set-up
this system. Thus, accuracy of the analytical results
a minimum of 100 ml displacer is required.
can only be obtained by a careful consideration of
true equilibrium conditions.
3.2. Influence of the addition of displacer onto the
partition coefficient
3.3. Quantitative results
The correlation coefficients of the MHE regression
Not only the regression coefficient, but also the
curves are quite useful parameters for method de-
slope of the MHE curve is of relevance for quantita-
velopment and system characterization. A valid
tive analysis. The exchange rate of the gas phase of
confirmation of the static headspace equilibrium
consecutive headspace extractions must be sufficient
conditions can be established by a computation of
to attain a concentration gradient of the volatiles in
the individual partition coefficients, which reflect the
order to permit a meaningful extrapolation of the
true influence of the displacer. Since hexanal and
total peak areas. The signal intensity of the first
o-xylene exhibited the closest approximation to
extraction, expressed as the intercept of the regres-
ideality at all levels of displacer dosage, they were
sion curve, does not automatically reflect the quality
chosen as model compounds for this purpose. The
of the gas phase extraction. A typical set of the
computationally obtained partition coefficients are
Table 4
listed in Table 4. Obviously, the data show a
Calculated partition coefficients for hexanal and o-xylene in
pronounced trend for the availability of the volatile
dependence of the displacer dosage
sample components in the gas phase. The partition
Hexanal
o-Xylene
coefficients differ significantly depending on the
amount of added displacer, the numerical values
Untreated sample
47.64
53.83
50 ml displacer
24.92
31.96
decrease and level off to constancy with increasing
100 ml displacer
24.28
24.09
displacer concentration. This demonstrates clearly
200 ml displacer
21.29
18.14
the overall importance of the displacer onto the

276
T
. Wenzl, E.P. Lankmayr / J. Chromatogr. A 897 (2000) 269 –277
Table 5
Regression curve parameters and calculated content of pentanal at selected displacer volumes
0 ml
50 ml
100 ml
200 ml
Slope of regression curve
20.1199
20.2050
20.2364
20.2599
Intercept of regression curve
13.546
13.880
13.982
13.916
Correlation coefficient
0.858
0.978
0.991
0.998
Total peak area
6758416
5755902
5611995
4828609
Calculated pentanal content (mg / g)
6.48
5.18
4.93
4.34
relevant parameters is shown for the example of
space analysis, also data from the analysis under
non-equilibrium conditions are included. Precision
pentanal in Table 5. The effect of the displacer
and accuracy are significantly enhanced by the
addition is not visible with the first gas chromato-
addition of the displacer. Analyte contents of the
grams which yield comparable signal intensities. The
samples, which were modified with 200 ml water,
data indicate the influence of the displacer on the
result in considerably lower values. The data for the
characteristic data of the MHE curve, higher values
aromatic compounds are less conclusive than those
for slope and correlation coefficients predict a reduc-
for the aldehydes. Analyte contents decrease with
tion of the systematic error of quantitation. For the
increasing amounts of displacer for benzene, ethyl-
purpose of comparison, total peak areas and calcu-
benzene and o-xylene, but relative standard devia-
lated pentanal contents are displayed despite in-
tions are more pronounced. According to the mean
sufficient equilibration of the untreated sample as
value of the correlation coefficient of the MHE
well as for samples with 50 and 100 ml of water
regression curve equilibrium conditions are suffi-
addition. As a result of the decrease of the calculated
ciently established for quantitation purposes.
total areas with increasing displacer dosage, quantita-
tive data decrease too. A compilation of the quantita-
tive results including limits of detection and relative
standard deviation for the analysis of all components
4. Conclusion
at different levels of displacer dosage is given in
Table 6. In order to visualize the effect of the
The intention of this work was a thorough in-
displacer addition onto the reliability of the head-
vestigation of the influence of water as a displacer
Table 6
Limits of detections (LODs) and calculated mean values, standard deviations (SDs) and relative standard deviations (RSDs) obtained from
three replicate analysis of cardboard samples at increased displacer volumes
Compound
LOD
0 ml
50 ml
100 ml
200 ml
(mg / g)
Mean
SD
RSD
Mean
SD
RSD
Mean
SD
RSD
Mean
SD
RSD
(mg / g)
(mg / g)
(%)
(mg / g)
(mg / g)
(%)
(mg / g)
(mg / g)
(%)
(mg / g)
(mg / g)
(%)
Butanal
0.17
1.71
0.25
14.86
1.23
0.04
3.58
1.17
0.02
1.77
1.04
0.01
1.13
Pentanal
0.18
6.48
0.83
12.86
5.18
0.08
1.64
4.93
0.07
1.48
4.34
0.05
1.04
Hexanal
0.21
5.97
0.59
9.80
5.72
0.19
3.34
5.77
0.29
5.06
5.60
0.07
1.25
Heptanal
0.11
1.90
0.36
18.92
1.52
0.13
8.34
1.63
0.13
7.81
1.47
0.07
4.50
Benzene
0.15
0.97
0.07
7.62
0.65
0.02
3.68
0.57
0.01
1.79
0.48
0.01
2.94
Toluene
0.19
1.21
0.04
3.40
1.07
0.07
6.55
1.11
0.09
8.12
1.15
0.09
7.53
Ethylbenzene
0.12
0.94
0.13
13.90
0.59
0.01
1.96
0.55
0.05
9.05
0.50
0.03
6.86
m-1p-Xylene
0.25
0.89
0.12
13.72
0.97
0.35
36.17
0.95
0.06
6.81
0.87
0.11
12.33
o-Xylene
0.20
0.27
0.02
8.03
0.27
0.00
0.62
0.26
0.01
2.92
0.26
0.01
3.04

T
. Wenzl, E.P. Lankmayr / J. Chromatogr. A 897 (2000) 269 –277
277
onto the headspace equilibrium of volatile aldehydes
References
and aromatics in polar solid samples. The displacer
has to establish a partition system and reduce
[1] C. Nerin, R. Batle, J. Cacho, Food Addit. Contam. 15 (1998)
84.
adsorption phenomena which are responsible for
[2] M.H.W. Morelli-Cardoso, E.R. Lachter, D. Tabak, S. Ab-
systematic errors in quantitative analysis. In order to
rantes, O.M.G. de-Moraes, J. High Resolut. Chromatogr. 22
find out about the required saturation level of the
(1999) 70.
displacer, measurements were accomplished with
[3] M.S. Tawfik, A. Huyghebaert, Food Addit. Contam. 15
increasing volumes of added displacer and compared
(1998) 592.
with the data obtained for untreated samples. For a
[4] G. Lawson, C.T. Barkby, C. Lawson, J. Fresenius, Anal.
Chem. 354 (1996) 483.
characterization of the headspace equilibrium con-
[5] European economic community directive 76 / 893.
ditions, the technique of multiple headspace extrac-
[6] S. Risch, Food Technol., July (1988) 95.
tion was found to be useful. The effect of the
¨
¨
[7] A. Veijanen, Academic Dissertation, Univ. Jyvaskyla Fin-
displacer was evaluated by means of the characteris-
land, 1990
tic parameters of the MHE regression curves and
[8] H. Esterbauer, Fette Seifen Anstrichm. 70 (1968) 1.
correlation coefficients. Apparently, the polar dis-
[9] J.L. Booker, M.A. Friese, Food Technol., May (1989) 110.
placer improves significantly gas phase equilibration,
[10] H. Nishikawa, T. Sakai, J. Chromatogr. A 710 (1995) 159.
thus resulting also in enhanced precision and accura-
[11] K. Kobayashi, M. Tanaka, S. Kawai, J. Chromatogr. 187
(1980) 413.
cy of quantification. A confirmation of the actual
[12] M.E. Miller, J.D. Stuart, Anal. Chem. 45 (1999) 23.
shift of the equilibrium conditions could be obtained
[13] L. Rohrschneider, Z. Anal. Chem. 45 (1973) 2327.
by a computation of the partition coefficients for the
[14] B. Kolb, L.S. Ettre, Static Headspace Gas-chromatography:
individual components. The data display clearly the
Theory and Practice, Wiley, New York, 1997.
marked influence of the displacer dosage onto the
[15] B. Kolb, P. Pospisil, M. Auer, Chromatographia 19 (1984)
analysis of the volatiles in the polar cardboard
113.
matrix.
[16] Ch. Rohrer, W. Wegscheider, GIT 39 (1994) 688.
Wyszukiwarka
Podobne podstrony:
Confirmation of volatiles by SPME and GC MS in the investiga
A Simple and Effective Method for the Reduction of Acyl
Insensitive Semantics~ A Defense of Semantic Minimalism and Speech Act Pluralism
Estimation of Dietary Pb and Cd Intake from Pb and Cd in blood and urine
Development of Carbon Nanotubes and Polymer Composites Therefrom
Analysis of soil fertility and its anomalies using an objective model
Modeling of Polymer Processing and Properties
DICTIONARY OF AUSTRALIAN WORDS AND TERMS
A Chymicall treatise of the Ancient and highly illuminated Philosopher
Song of Myself Individuality and Free Verse
Extensive Analysis of Government Spending and?lancing the
Comparison of Human Language and Animal Communication
The?onomic Emergence of China, Japan and Vietnam
Hoban The Lion of Boaz Jachin and Jachin Boaz
Comparison of the Russians and Bosnians
Cruelty of Animal Testing Analysis of Animal Testing and A
Explaining welfare state survival the role of economic freedom and globalization
więcej podobnych podstron