1
L
AND
A
PPLICATION
O
F
A
NIMAL
M
ANURE
Animal manure can be an economical source of crop
nutrients. There are three key steps to utilizing manure in an
environmentally and economically sound manner:
• know the nutrient content of the manure,
• apply a uniform rate based on crop nutrient needs, and
• adjust the rate of supplemental fertilizer to compensate for
the nutrients applied in the manure.
Use of manure and fertilizer as nutrient sources for crop produc-
tion must be managed properly to ensure that they do not
contaminate ground or surface water.
Nutrient Content
Nutrient content of animal manure is variable, depending on
the type and age of animal, feed source, housing type, handling
method, temperature, and moisture content. Because of this
variability in nutrient content, individual land application
decisions should be based on the nutrient content of the manure to
be applied.
Average nutrient contents (Tables 1 and 2) are useful in
determining overall waste management plans, but should not be
used to determine actual land application rates. Application rates
are usually based on nitrogen (N), phosphorus (P expressed as
P
2
O
5
) and/or potassium (K expressed as K
2
O) contents. Quanti-
ties of secondary and micronutrients applied in manure are
generally sufficient to prevent deficiency.
Why Measure the Nutrient Content of Manure?
Not knowing the nutrient content of the manure to be
applied can result in large errors in application rate. For
instance, the plant-available N content of broiler litter can
easily range from 25 to 50 lb N/ton. To supply 125 lb N/
acre to a corn crop, 5 ton/acre of the low N litter is needed,
but only 2.5 ton/acre of the high N litter is required. If 5
ton/acre of the high N
litter were applied, an
extra 125 lb N/acre
would be added to the
soil, wasting valuable
nutrients and increas-
ing the potential for
ground and surface
water contamination.
Two and one-half ton/
acre of the low N litter
would only provide 63
lb N/acre and would be
insufficient to produce
the intended yield.
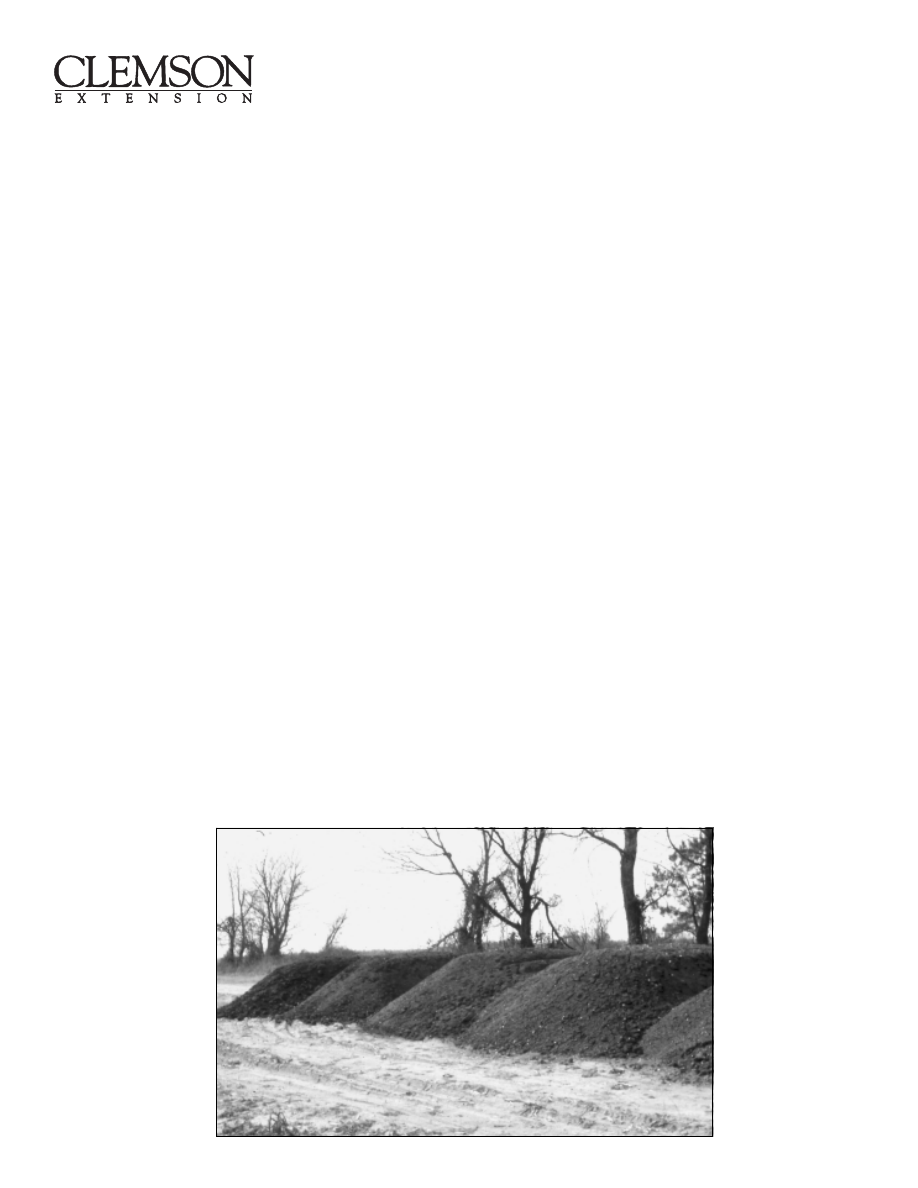
What Happens When I Stockpile Manure?
Stockpiling solid manure uncovered and exposed to
rainfall results in a reduction in the N and K
2
O content.
Also, the manure becomes sticky and difficult to spread
uniformly. Leaching of N and run-off of N and P from the
stockpiled manure may pollute ground and surface water.
Manure Sampling
Nutrient analysis of animal manure for land application can
be obtained from the Agricultural Service Laboratory, Coopera-
tive Extension Service, Cherry Road, Clemson, SC 29634-0391.
Analyses include moisture, organic-N, ammonium-N,
available-N, P
2
O
5
, K
2
O, calcium (Ca), magnesium (Mg), sulfur
(S), zinc (Zn), copper (Cu) and manganese (Mn). The fee is $10
to $15 per sample and depends on the analyses requested.
Obtaining a representative sample is one of the most
important tasks in manure management because application rates
are based on the concentration of nutrients in the manure.
Samples should be taken as close as possible to the time of
application. If several weeks elapse between sampling and land
application, or if the manure gets altered by rainfall or manure
additions, another sample should be obtained.
To take a representative sample, obtain a quart of waste
from 15 to 20 locations in the pile or lagoon and place in a large
clean plastic bucket. Mix this bulk sample thoroughly, then place
about a quart in a clean plastic bag or bottle. Seal tightly, but
leave room for the sample to expand. Keep the sample cool. If
the sample is not mailed to the laboratory on the same day it is
sampled, it should be refrigerated.
Nutrient Availability
Although manure application rates are usually based on N
availability, managing manures for their P
2
O
5
and K
2
O contents
can also be important.
The availability of P
2
O
5
and K
2
O in manures in
the year of application is
similar to that of
fertilizer sources, so
basing application rates
Improper storage of
manure can result in
water pollution. The
nutrient content of the
manure, as well as the
ability to spread it
uniformly, are reduced
with rainfall.
EC 673
Rep. April 1996

2
Table 1. Nutrient content of different sources of animal manure.
MANURE TYPE
INFO.
TOTAL
PHOSPHORUS
POTASSIUM
AND HANDLING
SOURCE
N
AMMONIUM-N
P
2
O
5
K
2
O
BROILER
lb/ton
all types
a
51
13
64
48
fresh (no litter)
b
26
10
17
11
broiler litter
b
72
11
82
46
roaster litter
b
73
12
75
45
breeder litter
b
31
7
54
31
stockpiled litter
b
36
8
80
34
all types
d
59
15
63
40
TURKEY
lb/ton
all types
a
61
18
57
41
fresh (no litter)
b
27
8
25
12
brooder litter
b
45
9
52
32
grower litter
b
57
16
72
40
stockpiled litter
b
36
8
72
33
LAYER
lb/ton
all types
a
35
14
42
28
fresh (no litter)
b
26
6
22
11
under cage scraped
b
28
14
31
20
highrise stored
b
38
18
56
30
all types
d
39
15
57
30
lb/1000 gallon
liquid slurry
b
62
42
59
37
anaerobic lagoon sludge
b
26
8
92
13
lb/acre-inch
anaerobic lagoon liquid
b
179
154
46
266
SWINE
lb/ton
fresh
c
12
7
9
9
scraped
c
13
7
12
9
lb/1000 gallon
liquid slurry
c
31
19
22
17
anaerobic liquid sludge
c
22
6
49
7
all types
d
40
19
37
23
lb/acre-inch
anaerobic lagoon liquid
c
136
111
53
133
DAIRY
lb/1000 gallon
all types
d
28
11
19
25
HORSE
lb/10 ton
all types
d
90
6
58
109
a - Data compiled by J. J. Camberato, Extension Agronomist, 1990-91.
b - Soil Facts-Poultry Manure as a Fertilizer Source. North Carolina Agricultural Extension Service Fact Sheet AG-439-5.
J. P. Zublena, J. C. Barker, and T. A. Carter.
c - Soil Facts-Swine Manure as a Fertilizer Source. North Carolina Agricultural Extension Service Fact Sheet AG-439-4.
J. P. Zublena, J. C. Barker, and J. W. Parker.
d - Using Manure to Cut Fertilizer Costs. University of Maryland Cooperative Extension Service Fact Sheet 512. V. Allan Bandel.
on the manure’s P
2
O
5
and K
2
O content should be adequate.
Determine how much P
2
O
5
and K
2
O are applied in the manure
and supplement with fertilizer, if necessary. On soils testing high
in P
2
O
5
and K
2
O (no P
2
O
5
and K
2
O recommended from soil test),
consider using the manure on other fields requiring P
2
O
5
and K
2
O.
Incorporation of the manure into the soil as soon as possible and
controlling erosion and runoff minimizes the impact of P on
surface water quality.
Nitrogen availability from animal manure is difficult to
predict. Availability of N is dependent on release of N from the
waste and loss from the soil. Nitrogen is in manure in three
forms—organic, ammonia/ammonium, and nitrate. The quantity
of each is difficult to predict because of the dependence on the
same environmental factors that affect nutrient content. The three

3
Table 2. Secondary and selected micronutrient content of different sources of animal manure
MANURE TYPE
INFO.
AND HANDLING
SOURCE
Ca
Mg
S
Mn
Zn
Cu
BROILER
lb/ton
all types
a
†
41
8
12
0.5
0.5
1.0
broiler litter
b
41
8
15
0.7
0.6
0.5
roaster litter
b
43
9
14
0.7
0.7
0.5
breeder litter
b
94
7
9
0.6
0.5
0.2
stockpiled litter
b
54
8
12
0.6
0.6
0.3
all types
d
30
13
10
0.4
0.4
0.3
TURKEY
lb/ton
all types
a
32
7
10
0.7
0.6
0.6
brooder litter
b
28
6
8
0.5
0.5
0.4
grower litter
b
42
7
10
0.7
0.6
0.5
stockpiled litter
b
42
7
10
0.6
0.6
0.3
LAYER
lb/ton
all types
a
85
5
6
0.4
0.3
<0.1
under cage scraped
b
43
6
7
0.3
0.3
<0.1
highrise stored
b
86
6
9
0.5
0.4
<0.1
all types
d
101
14
6
0.2
0.2
0.1
lb/1000 gallon
liquid slurry
b
35
7
8
0.4
0.4
0.1
lagoon sludge
b
71
7
12
2.3
0.8
0.1
lb/acre-inch
lagoon liquid
b
25
7
52
0.2
0.7
0.2
SWINE
lb/ton
fresh
c
8
2
2
<0.1
0.1
<0.1
paved lot scraped
c
12
2
2
0.2
0.4
0.2
lb/1000 gallon
liquid slurry
c
9
3
5
0.2
0.4
0.1
lagoon sludge
c
16
5
8
0.3
0.7
0.2
all types
d
11
8
5
0.1
0.3
0.1
lb/acre-inch
lagoon liquid
c
26
8
10
0.3
1.5
0.3
DAIRY
lb/1000 gallon
all types
d
23
7
3
0.1
<0.1
<0.1
HORSE
lb/10 ton
all types
d
156
62
16
0.8
0.1
0.1
†
See footnotes following Table 1.
forms of N have different plant availabilities and are lost from the
soil in different ways.
Often, organic-N is the predominant form of N in animal
manure. Organic- N is not available to crops until it has been
decomposed to ammonium. The speed and extent of degradation
are dependent on the type of manure, soil type, soil moisture and
temperature and how well the manure is mixed with the soil.
Estimates of organic-N availability range from 30 to 80 percent of
the organic-N available in the first cropping season. We are
currently assuming an average of 60 percent availability of
organic- N from animal manure in the first cropping season after
incorporation. Since many factors influence the decomposition
rate of organic-N, its actual decomposition can be more or less
than this estimate. Organic-N is lost from the soil only by
erosion.
Do we Get Any Benefit From The Manure After The
First Cropping Season?
The organic-N that is not decomposed to ammonium in
the first cropping season may be released in subsequent
seasons. Unfortunately, there is not enough research to
make recommendations on how much becomes available.
There is probably little N released after the first season from
one-time applications at rates to provide the crop N
requirement in the first season. However, for fields with a
long-term manure history—annual applications for five
years or more—the amount of N released from previous
seasons’ applications may be significant.
4
These processes can occur readily; therefore, it is best to apply
manure or fertilizer to provide N at the time the crop’s require-
ment for N is greatest.
Application Rates
The rate of manure applied is usually based on the
plant-available N content of the manure and the recommended N
rate for the crop to be grown. Available-N is calculated as 60
percent of the organic-N and 80 percent of the NH
4
+ for the first
year after application, if the manure is incorporated into the soil
immediately. Plant-available NH
4
+ should be reduced 15 percent
per day for every day the manure remains unincorporated.
Recommended N rates for crops are as low as 70 lb N/acre for
cotton and tobacco to as much as 400 lb N/acre for bermudagrass
hay. A portion or all of the crop’s N need can be provided with
manure. If manure rates provide more available-N than is
required by the crop, excess NO
3
- in the soil may contaminate
groundwater, if rainfall or irrigation leach it from the rooting
zone.
Use the worksheet at the end of this circular to assist you in
determining the proper application rate.
Application rates of solid manures are determined in one of
two ways. The most common method is to weigh a truck load of
manure, spread it until the truck is empty, determine the acres
spread, and then calculate the rate of application. An alternative
method is to spread several plastic sheets on the soil surface,
weigh the manure that lands on each sheet, and then calculate the
rate. Although both methods give an average rate of application,
the second method measures the variability of the application and
allows one to spread the first truck load of manure at the intended
rate.
Are Applications Of Manure Variable?
The rate of poultry manure applied by several South
Carolina farmers was measured by the sheet method
(Table 3). The actual application rate was significantly less
than the farmers intended, and the range in application rates
from place to place in the field was generally two-fold.
Determining the application rate, as well as the nutrient
content, of manure enables one to add known amounts of
plant nutrients.
Some NO
3
- is found in manure but usually not much.
However, the fate of NO
3
- is important, because organic-N and
NH
4
+ are converted to NO
3
-. Although NO
3
- is readily accumu-
lated by crops, it can be lost from the soil by two ways. Excess
rainfall or irrigation that results in water movement through the
crop rooting zone will result in loss of NO
3
- by leaching. When
soils are saturated, but leaching does not occur, NO
3
- can be
converted to several gaseous N forms and lost to the atmosphere.
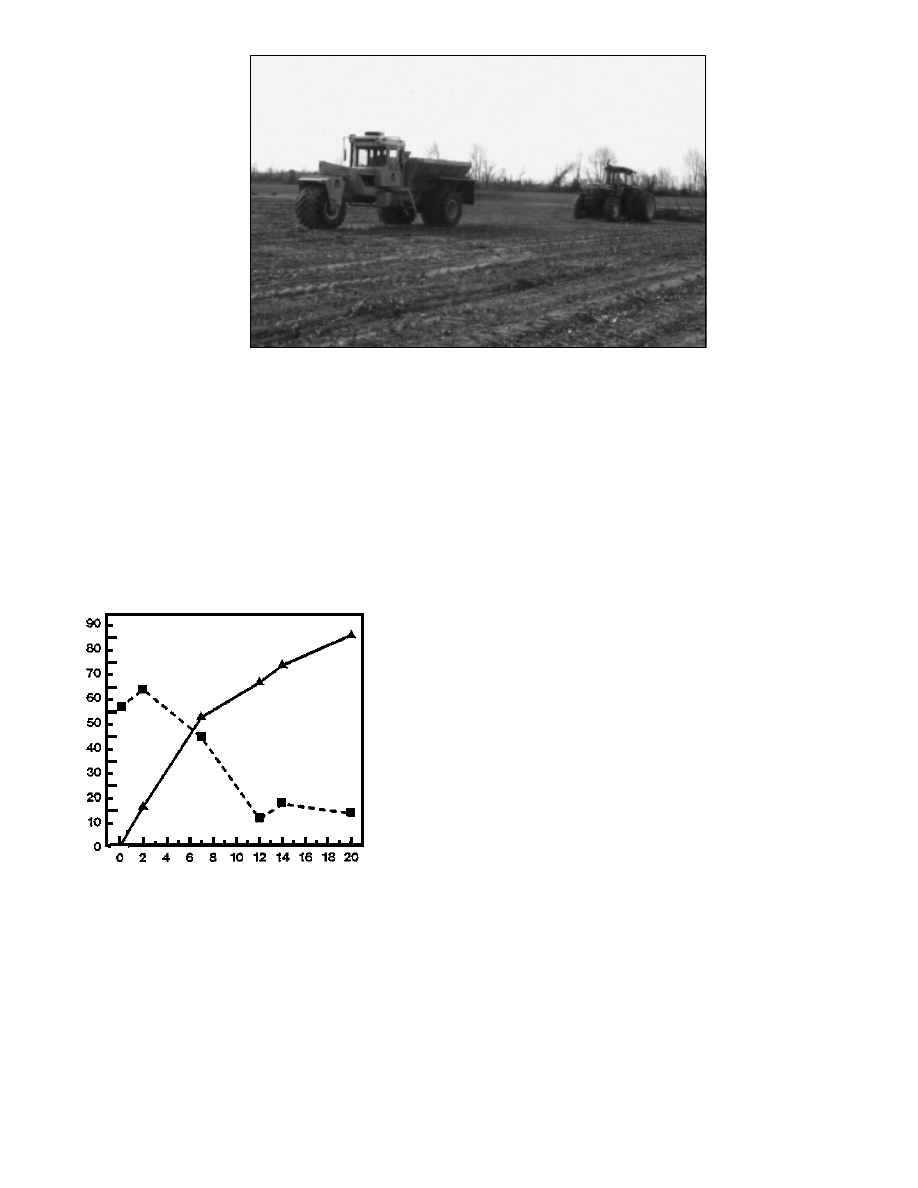
Incorporate as soon after
application as possible to
conserve nitrogen and
phosphorus and reduce
odors and flies.
Figure 1. Changes in soil nitrate and ammonium
after an application of dairy wastewater in February
containing 56 lb/acre of organic-N and 56 lb/acre
of ammonium-N.
Considerable quantities
of ammonia/ammonium N
occur in most manures.
Ammonia (NH
3
) is a gas, and
ammonium (NH
4
+) is a
charged molecule dissolved in
the soil water. Ammonia and
NH
4
+ are rapidly interchange-
able, dependent on the pH of
the solution. Increasing pH
increases the amount of NH
3
and decreases NH
4
+. Most
crops will take up NH
4
+ as
well as any other form of N
but do not accumulate NH
3
to
any extent. Ammonia is
readily lost to the atmosphere
from the soil. As much as 15
percent of the NH
3
from
surface applied manure can be lost each day with breezy, warm,
moist conditions on sandy soils with a high pH. Considerable
losses of NH
3
can occur when manure is applied to pasture.
Leaching losses of NH
4
+ from soil are small.
How Fast Is NH
4
Converted To The Leachable Form Of
Nitrogen--Nitrate?
Ammonium does not persist in soils in South Carolina if
soil temperatures exceed 40
o
F, because it is rapidly con-
verted to nitrate (NO
3
-). For example: Dairy wastewater
high in NH
4
+ was applied to the soil in February. Within
twelve days after application, most of the NH
4
+ had been
converted to NO
3
-. (Fig. 1)
Days After Application of Dairy Wastewater
Nitrogen (pounds/acre)
Nitrate
Ammonium

5
When applying manure at a rate to satisfy the N needs of a
crop, P
2
O
5
and K
2
O are usually applied in excess of need. The
value of manure as a nutrient source is greatest when applied to a
soil of low fertility status. Excess nutrients are not given any
value. Hauling and application costs were not considered in this
analysis but should be determined on an individual basis.
Plant and Soil Analysis
Because of the uncertainty in decomposition of organic-N in
manure, as well as unquantifiable losses of NH
3
and NO
3
-, it is
recommended that the N status of the crop be monitored with
plant and soil analysis. Sampling representative plant tissues on a
regular basis—every two weeks, for instance—gives one the
ability to track the nutrient status of the plant and take corrective
measures, if necessary. Repeated sampling is most often used to
follow the N status of the plant, because soil tests for N are not
currently available. For small grains and corn, the part to be
sampled and sufficiency ranges for several nutrients, including N,
are published in Clemson University Extension Information
Leaflets 34 and 42, available from your County Extension Office.
To determine
Table 3. Rates of Manure Application Fall 1990
TARGET
ACTUAL
NO. TIMES
LOCATION
RATE
RATE
RANGE IN RATE
MEASURED
————TON/ACRE————
LAYER MANURE
McCormick
3.0
1.8
1.3 - 2.6
4
Greenwood 1
2.5
1.4
0.9 - 2.0
4
Greenwood 2
3.0
4
2.0 - 6.4
10
Darlington
3.0
3.2
1.5 - 4.6
4
Lee
4.0
1.3
0.7 - 1.6
6
BROILER/TURKEY MANURE
Newberry 1
2.5
2.7
1.4 - 3.9
6
Newberry 2
5.0
3.8
3.4 - 4.1
2
Clarendon
4.5
3.4
2.6 - 5.0
10
Lee 1
2.5
0.5
0.2 - 2.0
5
Lee 2
2.5
0.9
0.5 - 1.0
6
Use some method to
calibrate your
spreader so you can
add the proper
amount of nutrients
to each field. This is
the plastic sheet
method.
Liquid manure application rates can be determined by
knowing the quantity of liquid applied to a known acreage or
measuring the inches of liquid applied with a rain gauge. One
acre-inch of liquid is equivalent to 27,154 gallons. Variability of
liquid manure application rate can be high and is dependent on
the type of application equipment.
Uniform application of manure is important, because
managing the crop will become more difficult as variability
increases. Variability in application often leads to
over-fertilization of the majority of the field to compensate for
small areas receiving inadequate nutrient supplies.
Determining the Dollar Value of Manure
Nutrients
The value of manure nutrients is dependent on the nutrient
status of the field to which it is applied, the nutrient needs of the
crop to be grown, the nutrient content of the manure, and the cost
of purchased nutrients. For example: A farmer has three fields of
different fertility status—testing low, medium and high for P and
K. The farmer wishes to grow
120 bu/acre corn and follows
Clemson’s nutrient recommenda-
tions. The farmer has poultry
manure with a nutrient content of
40 lb available-N/ton, 60 lb P
2
O
5
/
ton, and 40 lb K
2
O/acre. The
farmer applies 3 ton manure/acre
to provide all of the N needed to
grow the crop. Purchased N,
P
2
O
5
, and K
2
O cost 24, 24, and 18
cent/pound, respectively. The
value of the manure per ton for
each field can be calculated using
the formulas on page 6.

6
Soil Testing Low in P + K
RECOMMENDED
AMOUNT APPLIED
EXCESS
NUTRIENT
APPLICATION
WITH MANURE
VALUE
NUTRIENTS
————lb/acre————
$/3 ton
lb/acre
N
120
120
120 X .24 = 28.80
0
P
2
O
5
80
180
80 X .24 = 19.20
100
K
2
O
80
120
80 X .18 = 14.40
40
The nutrient value of this manure on a soil testing low in P and K is $20.80/ton. When the manure is added to a
low fertility soil, 80 lb/acre of P
2
O
5
and K
2
O are recommended from soil analysis and credited with value.
Soil Testing Medium in P + K
RECOMMENDED
AMOUNT APPLIED
EXCESS
NUTRIENT
APPLICATION
WITH MANURE
VALUE
NUTRIENTS
————lb/acre————
$/3 ton
lb/acre
N
120
120
120 X .24 = 28.80
0
P
2
O
5
50
180
50 X .24 = 12.00
130
K
2
O
50
120
50 X .18 = 9.00
70
The nutrient value of the manure on a soil testing medium in P and K is $16.60/ton. Partial credit is given to the
P and K content of the manure, because only 50 lb P
2
O
5
and K
2
O/acre were recommended from soil analysis.
Soil Testing High in P + K
RECOMMENDED
AMOUNT APPLIED
EXCESS
NUTRIENT
APPLICATION
WITH MANURE
VALUE
NUTRIENTS
————lb/acre————
$/3 ton
lb/acre
N
120
120
120 X .24 = 28.80
0
P
2
O
5
0
180
0 X .24 = 0
180
K
2
O
0
120
0 X .18 = 0
120
The nutrient value of the manure on a soil testing high in P and K is $9.60/ton. In this situation, no credit is
given to the P and K content of the manure, because no P and K were recommended from soil analysis.
the sufficiency of nutrients other than N, it is acceptable to take
diagnostic tissue samples. These samples should be taken once a
season at easily identified crop growth stages, such as heading for
small grains and silking for corn. The sufficiency range for the
plant tissue sampled will be included with the plant analysis.
Yearly sampling can be used not only to assess the level of
several nutrients in that year, but to follow changes in soil fertility
over several seasons.
Currently, there are no guidelines for determining if soil
supplies of N are adequate for crop growth. However, soil
sampling of the root zone and determination of NO
3
- can be
useful. Several of the requirements for taking a representative
soil sample for NO
3
-analysis are the same as those for taking
traditional soil samples. Fields should be separated into different
soil types. Areas that were cropped, fertilized, or manured
differently should be sampled separately. Soil samples should
represent no more than 10 acres, and each sample should be
comprised of fifteen or more cores.
The major differences between soil sampling for NO
3
-
analysis and traditional soil sampling are the depth and time of
sampling and sample handling. Nitrate is easily leached from the
sandy surface soil but can accumulate in the clay subsoil.
Because of this, NO
3
- samples need to be taken deeper than the
traditional 6-inch soil sample and as close to fertilization time as
possible.
Soil samples for NO
3
- analysis should represent a major
portion of the crop rooting zone, which is at least 3 feet for most
crops. The samples should be taken in one-foot increments to a

7
depth of 3 feet. Each one-foot sample should be sent to the
laboratory as a separate sample. Soil samples for NO
3
- analysis
should be spread thinly to air dry within one hour of sampling.
This minimizes changes in NO
3
- content that will occur in moist
soil. After the samples have dried, send them to a soil testing
laboratory and request a NO
3
- analysis or use a portable NO
3
- test
kit. The results will be reported in ppm (parts per million) of
NO
3
—N. Multiply the ppm value for each one-foot increment by
4 to convert the results into lb N/acre. Add the lb N/acre in each
increment to determine the total NO
3
—N content of the entire
sampling depth. This will serve as an indicator of whether excess
N is being applied.
WORKSHEET: DETERMINING THE NUTRIENT NEEDS OF YOUR CROP*
Use this worksheet to determine how much manure to apply to your field.
EXAMPLE
YOUR FARM
1. Crop to be grown.
corn
________
2. Clemson nutrient recommendation based on soil test.
a. N (lb/acre)
120
________
b. P
2
O
5
(lb/acre)
50
________
c. K
2
O (lb/acre)
50
________
3. Nutrients applied preplant or at planting.
a. N (lb/acre)
20
________
b. P
2
O
5
(lb/acre)
0
________
c. K
2
O (lb/acre)
0
________
4. Net nutrient needs of crop (lb/acre).
Nitrogen, phosphorus, and potassium: total need
(item 2a,2b,2c) minus additional nutrients from preplant
or at planting (item 3a,3b,3c)
a. N: 120-20 (lb/acre)
100
________
b. P
2
O
5
: 50-0 (lb/acre)
50
________
c. K
2
O: 50-0 (lb/acre)
50
________
5. Available nutrients in manure based on laboratory analysis.
a. Available-N (lb/ton)
40
________
b. P
2
O
5
(lb/ton)
60
________
c. K
2
O (lb/ton)
40
________
6. Application rate to supply priority nutrient.
a. Priority nutrient
N
________
b. Amount of priority nutrient needed
100
________
(lb/acre from 4a)
c. Rate of manure needed to supply priority nutrient (6b)
2.5
________
divided by (5a): 100/40(ton/acre)
How Do I Calculate The Amount Of NO
3
—N Available To
My Crops Fom Soil NO
3
- Analysis Results?
Soil
Increment
NO
3
—N
NO
3
—N
———
———
ppm
lb/acre
0-1'
2
8
1-2'
3
12
2-3'
6
24
TOTAL
44
Multiply NO
3
—N in ppm times 4 to convert to NO
3
—N in lb/
acre when the sampling increment is 1 foot.

8
RATE OF MANURE TO APPLY
EXAMPLE
YOUR FARM
7. Pounds per acre of all nutrients supplied at the application
rate required to meet the needs for the priority nutrient:
for each nutrient enter the available nutrients (5a,5b,5c)
times manure rate (6c).
a. N supplied: 40 X 2.5 (lb/acre)
100
________
b. P
2
O
5
supplied: 60 X 2.5 (lb/acre)
150
________
c. K
2
O supplied: 40 X 2.5 (lb/acre)
100
________
8. Nutrient balance: net nutrient need (-) or excess (+):
amount of nutrient applied by manure (7a,7b,7c) minus
net amount needed by crop (4a,4b,4c).
a. N balance: 100-100 (lb/acre)
0
________
b. P
2
O
5
balance: 150-50 (lb/acre)
+100
________
c. K
2
O balance: 100-50 (lb/acre)
+50
________
*Calculation format adapted from SoilFacts - Poultry Manure as a Fertilizer Source. North Carolina Agricultural Extension
Service Fact Sheet AG-439-5. July 1990.
Printed on recycled paper with soy ink
Prepared by James J. Camberato, Extension Agronomist.
Funded in part by USDA Water Quality funds.
The Clemson University Cooperative Extension Service offers its programs to people of all ages, regardless of race, sex, religion, national origin, or disability and is an equal opportunity employer.
Clemson University Cooperating with U.S. Department of Agriculture and South Carolina Counties. Issued in Furtherance of Cooperative Extension
Work in Agriculture and Home Economics, Acts of May 8 and June 30, 1914
Wyszukiwarka
Podobne podstrony:
Applications of polyphase filters for bandpass sigma delta analog to digital conversion
2 Application of Distributed Loads
2004 Applications of RT to translation
Ken Hultgren The Art of Animal Drawing
application of solid state fermentation to food industry a review
[2006] Application of Magnetic Energy Recovery Switch (MERS) to Improve Output Power of Wind Turbine
Cruelty of Animal Testing Analysis of Animal Testing and A
The Group Souls of Animals
94 1363 1372 On the Application of Hot Work Tool Steels for Mandrel Bars
Carnival of animals
1 Application of Joints and Springs in ANSYS
Applications of Robotics and Artificial Intelligence
Kinesiotherapy is the application of scientifically?sed exercise principles?apted to enhance the str
Application of Solid Phase Microextraction Gas Chromatograp
Gatunki chronione Decree on Conservation of Animals
Application of the Modelica
44)28 09 Parts of animal body VIb
Applications of magnetic resonance spectroscopy in radiotherapy treatment planning
Applications of polyphase filters for bandpass sigma delta analog to digital conversion
więcej podobnych podstron