D
o markets change?
Is it necessary to
undertake contin-
ued research and
development and adapt a trend-
following system to maintain its
profitability over the years?
To attempt to answer these
questions, the following study
tracks the strategy of the
“Turtles,” a group trained by leg-
endary traders Richard Dennis
and Bill Eckhart in the 1980s.
The Turtles were used to conduct
an experiment about whether it
was possible to teach people to
become successful traders.
One trading system salesmen
recently argued that it is “non-
sense” and a “specious argument”
to suggest trend-following rules
must adapt to changing market
conditions. Others argue trend-
following systems do not automatically
adapt but need continued monitoring
and refining. Some well-known trend fol-
lowers have indeed stated they still trade
the same system they used 30 or 40 years
ago. But what do those managers really
mean?
Markets in flux
Suppose a trend-following commodity
trading advisor (CTA) trades a simple
channel breakout system with the
following rules: buy when the market
trades above an x-day high and reverse
the trade to sell short when the market
penetrates an x-day low. In addition,
the system uses a fixed-fractional
approach to sizing positions, risking
y percent of total equity based on
the channel’s width (x-day high
TRADING
STRATEGIES
BY ANTHONY GARNER
KC
For more information about the
following concepts, go to “Key concepts”
on p. 78.
• Compound annual growth rate
(CAGR)
• Correlation
• Exponential moving average (EMA)
• True range
Tuning up the turtle
Dissecting the original Turtle strategy illustrates the difficulty of designing
a system that can perform consistently over decades.
28
www.activetradermag.com • February 2010 • ACTIVE TRADER
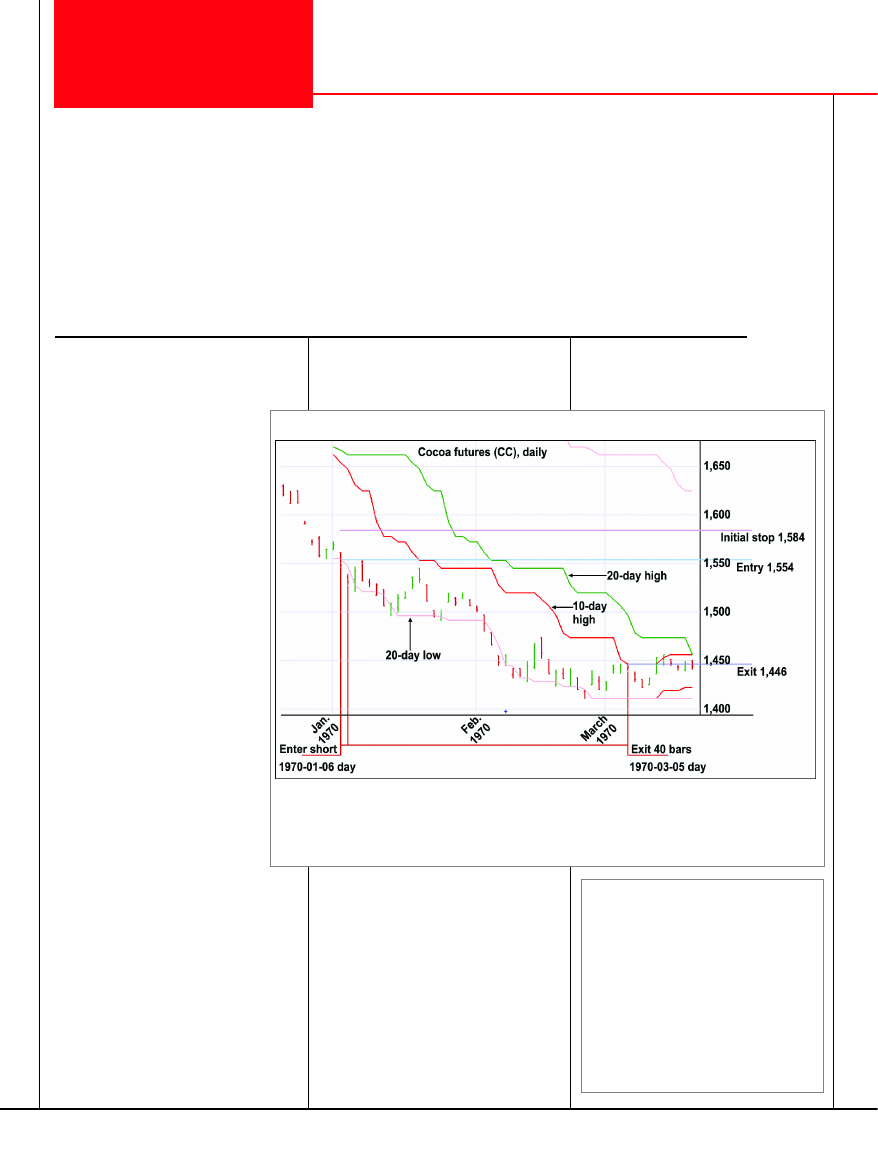
FIGURE 1: TURTLE SYSTEM TRADE EXAMPLE
The original Turtle strategy shorted cocoa futures in January 1970 and exited at a
profit in March.
Source: Trading Blox
continued on p. 30
30
www.activetradermag.com • February 2010 • ACTIVE TRADER
Trading Strategies
minus x-day low).
As markets change over the years,
imagine the CTA adjusts the strategy in
the following manner: He increases x’s
value in an attempt to avoid choppiness
in the markets and increases the percent-
age of equity risked (y) to keep a similar
exposure to the market after the stops
and the channel itself are widened. As the
CTA adds different markets, let’s assume
he introduces portfolio-wide and sector-
specific risk limits. Perhaps he also adds
profit-target rules, which lock in some
profit before a trend begins to reverse.
Is the CTA trading the same system
with which he started? Well, yes, he is
still trading channel breakouts, but the
system’s profile is very different from the
way it began. If you look at a few CTA
disclosure documents, you are unlikely to
find many that do not extol the benefits
of continuing research and development.
Changes to many systems have been cau-
tiously implemented over the years.
Testing the Turtle
By back-testing the original Turtle strate-
gy, we can find out whether this particu-
lar system, which was highly profitable
back in the early 1980s, has adapted or
needs updating.
At its core, the Turtle strategy is a
trend-following system that attempts to
capture short and medium-term trends in
a portfolio of futures markets (Table 1).
For example, Turtles bought the market
after 20-day highs and
sold short after 20-day
lows. Figure 1 (p. 28) shows trade exam-
ples in cocoa futures (CC), which shows
the effect of pyramiding: Units were
entered short on Jan. 6 and 7, 1970, and
all units were exited at the same time on
March 5, 1970 as the market penetrated
the 10-day high.
However, the details behind the system
are fairly complex, especially steps
involving risk management and position
sizing. The following rules apply for the
Turtles’ shorter-term strategy, labeled “sys-
tem 1.” The Turtles also traded a longer-
term system based on 55-day highs and
lows (“system 2,” not tested). The trade
rules are:
1
1.. G
Go
o llo
on
ngg when price exceeds
a 20-day high.
2
2.. SSeellll ssh
ho
orrtt when price drops
below a 20-day low.
3
3.. E
Exxiitt llo
on
ngg when price drops
below a 10-day low.
4
4.. E
Exxiitt ssh
ho
orrtt when price exceeds
a 10-day high.
5
5.. Ignore entry signals if the
previous signal in that market
produced (or would have
produced) a winning trade. If a
trade is skipped, enter after a
55-day high or low to avoid
missing major moves.
TABLE 3: TEST SETTINGS
Interest earned on capital
90-day T-bill rate
Slippage on new entries/exits
7%
Slippage on rolls
3.5%
Round-turn commission per contract
$7
Starting capital
$1,000,000
Risk per trade
1%
Both sets of tests began with $1 million and included
interest, slippage, and commission.
TABLE 2: POSITION THRESHOLDS
Level
Type
Max units
1
Single market
4
2
Closely correlated markets
6
3
Loosely correlated markets
10
4
Single direction
12
The Turtles limited portfolio risk by capping trade
size according to contract size, volatility, correlation,
and direction. They never traded more than 12 risk
units in either direction.
Source:
Way of the Turtle: The Secret Methods that Turned
Ordinary People into Legendary Traders (McGraw-Hill, 2007).
TABLE 1: THE TURTLE PORTFOLIO
Interest rates:
30-year T-bonds, 10-year T-note, Eurodollar
Softs:
Coffee, cocoa, sugar #11, cotton
Currencies:
Swiss franc, Euro, British pound, Japanese yen, Canadian dollar
Stock indices:
S&P 500
Metals:
Gold, silver, copper
Energy:
Crude oil, unleaded gas, heating oil
The original portfolio traded by the Turtles included 21 futures markets. The
tests in this article replace the Deutsche mark and French franc with the Euro
and exclude the 90-day T-bill contract.
Source:
Way of the Turtle: The Secret Methods that Turned Ordinary People into
Legendary Traders (McGraw-Hill, 2007).
The Turtle system normalized
the dollar volatility of positions by
trading more contracts in less
volatile markets and fewer con-
tracts in more volatile markets.
Volatility is expressed in terms of
the 20-day average true range
(ATR; this calculation uses an
exponential moving average). One
percent of capital is risked per
“unit” or trade, the size of which is
illustrated in the following exam-
ple in heating oil futures (HO):
Contract size = 42,000 gallons,
priced in U.S. dollars
20-day ATR on Nov. 23,
2009 = 0.0663
Account size = $1,000,000
Dollars per point = $42,000
Unit size = 0.01*$1,000,000 =
0.0663*42,000
3.59 contracts (rounded down to 3)
The Turtles initially placed stops two
ATRs above short positions or below long
positions, effectively risking 2 percent per
unit. This test will use 1-percent risk per
unit to prevent the test from becoming
unwieldy over the very long test period.
Positions were pyramided by adding
more trade units each time a market
moved 0.5 ATR in the right direction. To
limit risk in specific markets, sectors, and
portfolios, the maximum number of units
never exceeded 12 in either direction
(Table 2). When pyramiding into a favor-
able trade, the system could add up to
three additional units per market. If addi-
tional units were added to a position, the
original stops were raised by 0.5 ATR.
Generally, all stops were set two ATRs
from the most recently entered trade.
To preserve capital, the notional
account size was decreased by 20 percent
each time the account value dropped 10
percent. For example, if
a $1 million account fell
10 percent to $900,000,
the account’s size was
lowered to $800,000 for
position-sizing purpos-
es. Table 3 lists all other
test details.
The strategy was test-
ed on the futures mar-
kets in Table 1 from Jan.
1, 1970 to Sept. 23,
2009. These were the
markets traded by the
original Turtles. Note:
French francs and the
90-day U.S. T-Bill were
omitted from the original portfolio, and
the Euro currency (FX) was substituted
for the Deutsche mark.
The results
Table 4 lists the system’s performance sta-
tistics and Figure 2 shows its equity
curve. The strategy was highly profitable
before and during the Turtle experiment,
which spanned 1983 to 1988. Average
trade length was relatively short: 43 cal-
endar days for winning trades and 13
days for losing trades.
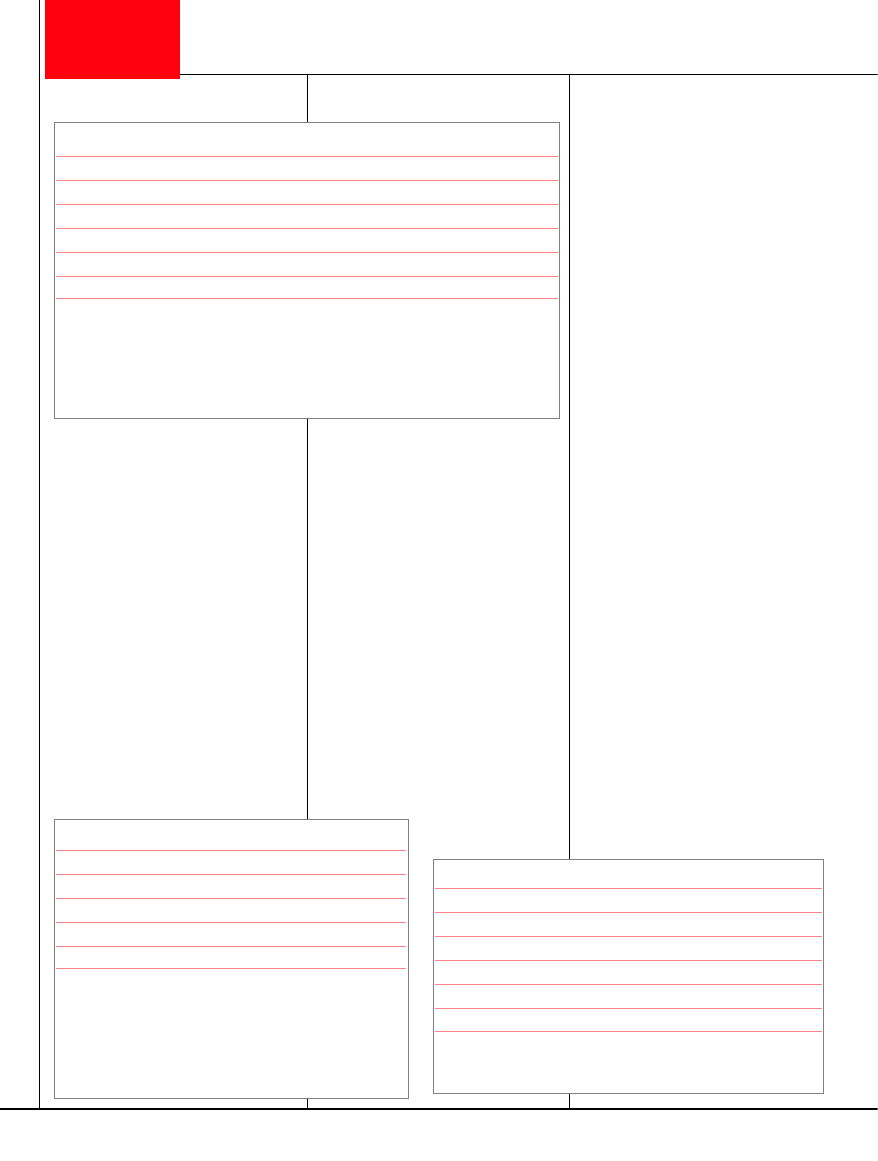
However, since the early 1990s, the
system has essentially been unprofitable.
Large drawdowns — up to 66 percent —
would have made this system difficult to
trade unless you had exceptionally strong
nerves. The original Turtle system needs
considerable updating in the light of cur-
rent market conditions.
ACTIVE TRADER • February 2010 • www.activetradermag.com
31
FIGURE 2: ORIGINAL TURTLE SYSTEM EQUITY CURVE
After impressive growth in the 1980s, the equity curve flattened in the early 1990s,
suggesting the system has broken down.
Source: Trading Blox
TABLE 4: ORIGINAL TURTLE PERFORMANCE SUMMARY
Compound annual growth rate (CAGR)
72%
MAR ratio (CAGR/Max. DD)
1.09
Max. drawdown
66%
Longest drawdown (months)
85
No. of trades
11,440
Duration of average winner (days)
43
Duration of average loser (days)
13
The strategy had a 72-percent compound annual
growth rate since 1970. However, it also suffered a
maximum drawdown of 66 percent.
Source: Trading Blox
continued on p. 32
Trading Strategies
32
www.activetradermag.com • February 2010 • ACTIVE TRADER
Expanding the portfolio to include the
many new markets that have been intro-
duced over the past 20 years merely con-
firmed the system’s demise. It failed to
respond to changing market conditions.
Bringing the Turtle back to life
Let’s explore ways to make the Turtle sys-
tem better suited for today’s markets. Let’s
stick with the basic approach, but buy the
market at a new 90-day high and sell
short at a new 90-day low (rather than
using 20-day thresholds). Also, the sys-
tem will now wait to exit long (short)
trades at a new 45-day low (high) instead
of just 10 days. These changes produce a
longer-term system that is more
likely to avoid some of the
increased noise in today’s mar-
kets. Other suggested improve-
ments include:
Widen the stop. Try a five-ATR
stop instead of the original sys-
tem’s two-ATR stop. The wider
stop will further help keep the
system out of choppy, noisy mar-
kets.
Scale out, not in. Abandon the
Turtles’ complex scale-in rules
and try scaling out of winning
trades instead. Exit half the trade
each time a profit target of, say,
10 ATRs is reached. Scaling out of
winners can help reduce draw-
down and smooth the equity
curve.
Reduce sector risk. Continue to
use risk-management rules, but
only take trades when sector risk (e.g.
softs, bonds, stock indices) is below 10
percent. Keep overall portfolio risk to 40
percent of the account, but abandon the
rule that lowers risk after large drops in
account equity. Without this rule, the
strategy might recover faster from draw-
downs.
Add markets. Expand the portfolio to
include new futures contracts launched
since the Turtle experiment ended in
1988. The increased diversity can help
reduce drawdowns and smooth the
equity curve.
Add filter. Finally, try adding a filter that
takes trades only in the direction of a
longer-term trend. One idea is to use a
dual moving average crossover. For exam-
ple, go long (short) only if the 50-day
moving average (MA) is above (below)
the 300-day MA.
Adjusted performance
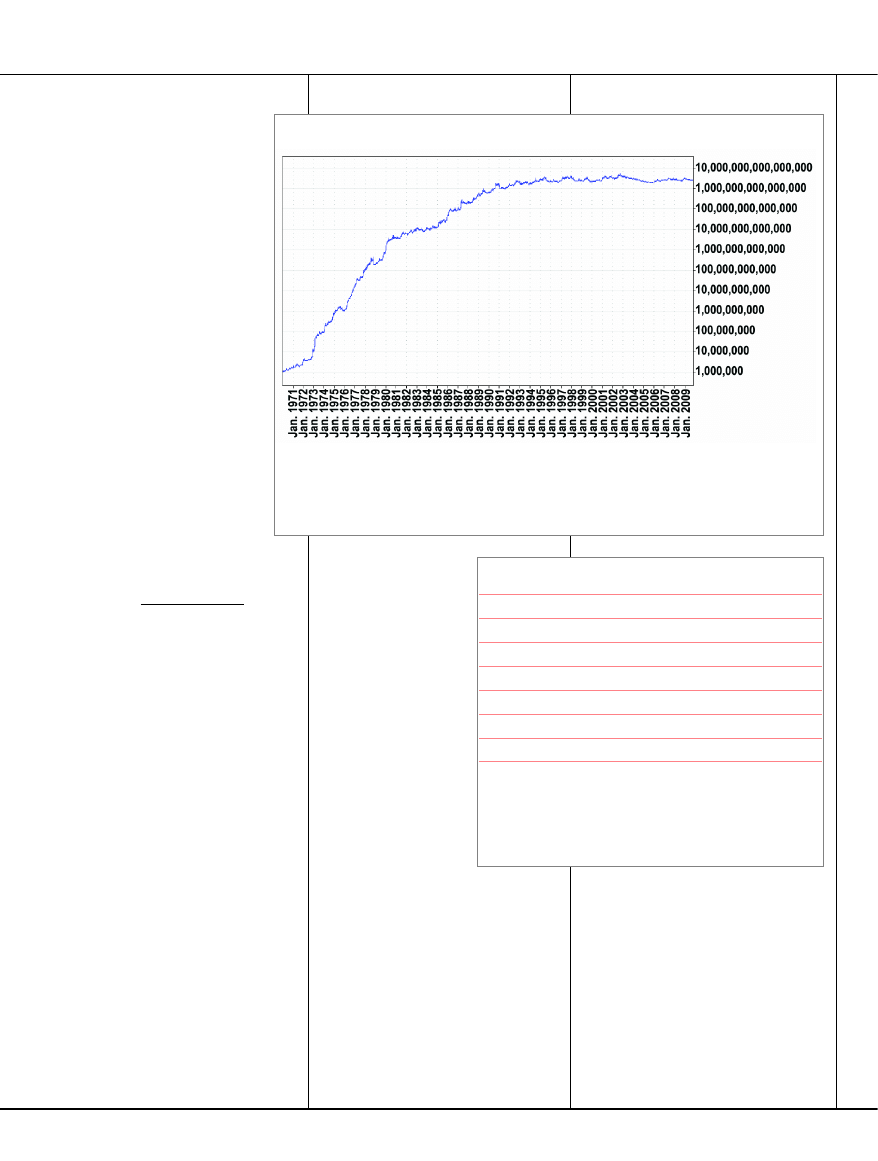
Figure 3 shows a trade example in lead
futures (MPB2). A total short position of
59 lead contracts was taken on Aug. 18,
FIGURE 3: REVISED TURTLE TRADE EXAMPLES
The revised system sold short after lead futures fell to a new 90-day low in August
1971. The strategy hit profit targets in September and November, and the remainder
of the position was exited in December.
Source: Trading Blox
TABLE 5: REVISED TURTLE PERFORMANCE SUMMARY
Orig.
Revised
Compound annual growth rate (CAGR)
72%
35.28%
MAR (CAGR/Max. DD)
1.09
2.26
Max. drawdown
66%
15.60%
Longest drawdown (months)
85
16.3
No. of trades
11,440
3,205
Duration of average winner (days)
43
159
Duration of average loser (days)
13
63
The revised approach isn’t as profitable as the original (35.3 percent CAGR vs.
72 percent, respectively). But the MAR ratio doubled from 1.09 to 2.26, and
the number of trades declined by two-thirds — signs of a longer-term system
that can navigate increasingly choppy markets.
Source: Trading Blox
ACTIVE TRADER • February 2010 • www.activetradermag.com
33
1971 as the market breached the 90-
day low. The moving average con-
vergence divergence (MACD) was
negative, meaning the 50-day MA
was below the 300-day MA.
Profit was taken by exiting 29
contracts on Sept 7, 1971, and 15
more contracts on Nov. 23, 1971.
The rest of the position was bought
back on Dec. 30, 1971 as the trend
reversed and the 45-day high was
breached.
Table 5 shows the revised system’s
performance statistics, and Figure 4
shows the equity curve. The updat-
ed strategy was tested on more than
100 futures markets from Jan. 1,
1970 to Sept. 23, 2009.
Unlike the original system, the
revised system remained profitable to the
present day. Overall profitability, as meas-
ured by the compound annual growth
rate (CAGR), is lower than in the original
test (35.3 percent vs. 72 percent). CAGR
can be increased to Turtle levels by
increasing position size, increasing total
and sector risk limits, reducing the size
of the ATR stop, and altering the parame-
ters of the filter. But these steps are likely
to lead to higher drawdowns.
In addition, the new rules consider-
ably improve the system’s MAR ratio
(CAGR/maximum drawdown) from 1.09
to 2.26. The number of trades also dra-
matically decreased while trade length
increased. This is a much longer-term,
slower system designed to ride out
increased market noise. Finally, the
revised strategy is somewhat simpler than
the original one.
This study suggests markets may
indeed change over time. The revised
system itself may well become outdated.
Thus, it is undoubtedly necessary to
adapt a trend-following system to main-
tain its profitability over the years.
For information on the author see p. 6.
Book:
Way of the Turtle: The Secret Methods that Turned Ordinary People into
Legendary Traders by Curtis Faith (McGraw-Hill, 2007).
Articles:
““Breakout Trading Technique article collections: Basic and Advanced””
This 22-article set combines the advanced and basic collections of breakout
strategies. The basic collection (12 articles) explains and illustrates basic break-
out concepts, including breakout trading strategies based on chart analysis
and simple breakout-channel calculations. The techniques cover time frames
from intraday to multi-week.
The advanced collection (10 articles) details different trading systems, strate-
gies and concepts based on breakout trading. Also, there are special Trading
System Labs that illustrate trailing stop and walk-forward testing techniques for
breakout systems.
““System death: When good systems go bad””
Active Trader, May 2008.
Not every trade can be a winner, and most traders endure losing streaks at
some point. But if your trading system is losing money, how do you know if it
is suffering just a brief drawdown or if the system is on its last leg?
““Turning systems upside down””
Active Trader, February 2007.
Inverting the rules of two popular trading techniques produces much better
results than their standard applications.
Related reading
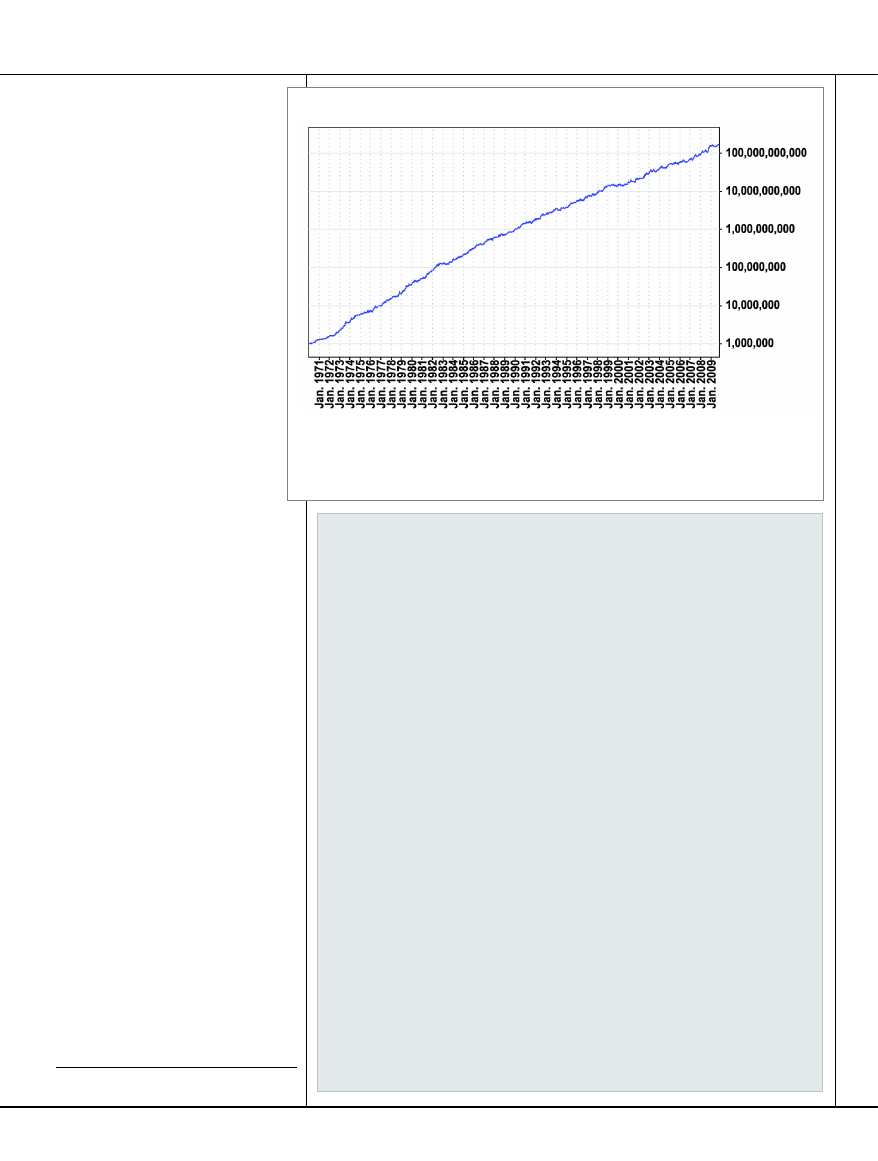
FIGURE 4: REVISED TURTLE SYSTEM EQUITY CURVE
Unlike in the classic Turtle system, the revised strategy’s equity curve continued
to climb higher in recent years.
Source: Trading Blox
Wyszukiwarka
Podobne podstrony:
40 Bringing up the Ark pt4 Pink
Pumpin up the party
38 Bringing up the Ark pt2 Pink
Stitching up the Enemy
37 Bringing up the Ark Pink
Light up the world tonight
39 Bringing up the Ark pt3 Pink
Anthony Borgia Life in the World Unseen
Up the Down Escalator
Grayslake 3 Roaring up the wrong tree Celia Kyle
Anthony, Piers & Margroff, Robert E The E S P Worm
10 15 Finish up the sentences
James Tiptree Jr Up the Walls of the World
Mark Hebden [Inspector Pel 18] Pel Picks Up the Pieces Juliet Hebden (retail) (pdf)
Robert Silverberg Up the Line
FIDE Trainers Surveys 2013 11 26, Goran Dizdar Building up the endgame advantage on a piece activit
Anthony, Piers Shade of the Tree
Anthony, Piers Xanth 24 The Dastard
WINDSOR FOR THE DERBY Giving Up the Ghost CDLP (SC128cdlp, Secretly Canadian)sc128
więcej podobnych podstron