
June 17, 2002
Number One
Occasional Papers of the Baraminology Study Group
A BARAMINOLOGICAL ANALYSIS OF THE TRIBE
HELIANTHEAE sensu lato (ASTERACEAE) USING
ANALYSIS OF PATTERN (ANOPA)
David P. Cavanaugh and Todd Charles Wood
Copyright 2002 Baraminology Study Group. All Rights Reserved.

Occas. Papers of the BSG No. 1, pp. 1-11
©2002 Baraminology Study Group.
www.bryancore.org/bsg/
All rights reserved.
A Baraminological Analysis of the Tribe Heliantheae
sensu lato
(Asteraceae) Using Analysis of Pattern
(ANOPA)
D
AVID
P. C
AVANAUGH
1
and
T
ODD
C
HARLES
W
OOD
2
1
Independent Scholar, Harvest, AL, USA
2
Assistant Professor, Center for Origins Research and Education, Bryan College, Dayton, TN, USA
Abstract.
Morphological characteristics from 97 genera representing the major groups of tribe Heliantheae sensu lato and several
outgroups were analyzed using Analysis of Pattern (ANOPA) and baraminic distance correlation. The ANOPA results revealed a
complex structure that does not correspond to any previous classifi cation and does not exhibit any obvious discontinuity. The baraminic
distance correlation confi rmed continuity between all taxa studied. Taken together, results from this study and our previous one (Wood
and Cavanaugh 2001) strongly support monobaraminic status for tribes Heliantheae s. l. and Eupatorieae collectively. This monobaramin
contains 5730 species, more than 25% of the sunfl ower family.
www.bryancore.org/bsg/
1
Although of central importance to creation
systematics, discontinuity is often defi ned merely
by the failure to demonstrate baraminic relationship
(continuity). ReMine suggested absence of continuity
as his only criterion for detecting discontinuity
(ReMine 1990). Wise developed a matrix of fi fteen
criteria that can be used to identify discontinuity, all
of which are heavily biased towards fossil evidences
(Wise 1992), making them of limited applicability to
many organisms. A recurrent theme in all of these
criteria is the notion of signifi cant difference between
the members of a group and all other organisms, as
expressed in Wise’s defi nition of apobaramin as a
group “separated from all other organisms by phyletic
discontinuity, but [which] may or may not be divided
by at least one phyletic discontinuity” (Wise 1990)
The emphasis on signifi cant difference with
all other organisms provides a basis for practical
detection of discontinuity. Similarity and difference
can be measured in a variety of ways, using discrete
or continuous morphological characters or DNA
sequences. Robinson and Cavanaugh introduced the
baraminic distance correlation test as a novel method
capable of detecting continuity and discontinuity using
any type of data (Robinson and Cavanaugh 1998b).
In 1997, Cavanaugh introduced Analysis of Pattern
(ANOPA), a method of projecting multidimensional
data points into three-dimensions (Cavanaugh, unpub.
ms.). Unlike similar multidimensional analysis
methods such as Principle Component Analysis,
ANOPA makes no assumptions about the distribution
of the data and so is ideal for examining data of
unknown structure. While ANOPA cannot defi ne
groups of taxa, it can visually display the structure of
the taxa, which allows for further statistical analysis.
Used together, ANOPA and baraminic distance
correlation can be powerful tools for detecting and
interpreting continuity and discontinuity.
Because these statistical methods have only
recently been made available, Creationists have been
limited to indirect evidence that the holobaramin may
be approximated at the taxonomic rank of family (i.e.
the family is bounded by discontinuity and united
by continuity) (Jones 1972). Baraminology studies
of vertebrates tend to support this view (Robinson
and Cavanaugh 1998a; Wood et al. 1999; Wood et

2
www.bryancore.org/bsg/
al. 2001). Though frequently much larger and more
diverse than animal families, some plant families may
also comprise holobaramins. For example, a recent
analysis of the grass family Poaceae (Wood 2002)
suggests that the relevant holobaramin encompasses
almost the entire family of 10,000 species.
In a previous study (Wood and Cavanaugh
2001), we tried to address the limits of the baramin
in the sunfl ower family Asteraceae, consisting of an
estimated 20,000 species (Bremer 1994a). We chose
the subtribe Flaveriinae (Asteraceae: Helenieae) as
the subject of our study to test the hypothesis that the
group is a monobaramin and possibly a holobaramin.
Robinson includes just three genera, Flaveria,
Sartwellia, and Haploësthes in Flaveriinae (Robinson
1981), while other systematists also refer the genera
Clappia, Jaumea, Pseudoclappia, and Varilla to the
subtribe (Karis and Ryding 1994; Lundberg 1996). We
obtained a morphological data set representing species
of all of these genera as well as outgroup species from
subtribe Pectidinae (Lundberg 1996). Our results
confi rmed the monobaraminic status of all three
genera of Flaveriinae sensu stricto, but we also found
probable relationships to members of Flaveriinae
sensu lato. Based on our results, we concluded that
the monobaramin Flaveriinae is a member of a larger
holobaramin (Wood and Cavanaugh 2001).
To evaluate further the baraminological status of
the monobaramin Flaveriinae, we applied ANOPA and
the baraminic distance correlation test to a published
dataset (Karis 1993). This dataset thoroughly
samples Tribes Helenieae (including seven genera of
monobaramin Flaveriinae) and Heliantheae, which
is cladistically nested within Helenieae. It also
provides a limited sampling of Tribes Eupatorieae
and Senecioneae, initially included as outgroup taxa.
Although the dataset does not sample the entire
Asteraceae family, the multitribal representation
should allow us to determine if tribes Helenieae
and Heliantheae are holobaraminic or merely
monobaraminic.
METHODS
We performed ANOPA as described previously
(Cavanaugh and Sternberg, submitted). All
calculations were performed in a Lotus spreadsheet.
Cavanaugh performed the ANOPA on an anonymous
dataset in which the taxa were identifi ed only by
sequential alphabetical designations, in order to
prevent bias in the analysis from prior knowledge.
For 1D ANOPA, a centroid is calculated for all taxa
by calculating the mean state of each character, and
the Euclidean distance (a0) from each taxon to the
centroid is calculated. For 2D and 3D ANOPA, a
hyperline connecting the centroid with an outlying
taxon serves as the axis of a multidimensional cylinder
from which cylindrical coordinates can be derived.
The distance of each taxon along the cylindrical axis
(t0), the perpendicular distance from each taxon to the
hyperline (d2), and the angle formed by the taxon,
the hyperline, and the multidimensional origin (2)
are then calculated. T0 and d2 can be plotted as a
two-dimensional plot or can be converted with 2 to
three-dimensional cartesian coordinates (the preferred
display for ANOPA data).
Baraminic distances were calculated as described
previously (Robinson and Cavanaugh 1998b) using
BDIST v. 1.0 (Wood 2002). Statistical calculations
using baraminic distances were done in S-PLUS
v. 4.0 (Insightful Corp.). To display the baraminic
distance correlation results, we ordered the taxa using
the agglomerative nesting algorithm (Kaufman and
Rousseau 1990) as implemented in S-PLUS.
All ANOPA and baraminic distance calculations
were done using Karis’s dataset (Karis 1993),
consisting of 141 morphological characters scored
for 98 taxa. For ANOPA, the dataset was modifi ed
as follows: The numbering of all character states was
increased by one (1 becomes 2, 2 becomes 3, etc.), so
that missing or unknown data could be coded as zero.
RESULTS
In ANOPA results, we can observe discontinuity
as a gap between taxa. In some cases, the gap may
be clear enough to view in 1D, but most groups
will require at least 2D or 3D ANOPA to observe
the gaps most clearly. The statistical signifi cance
of the gaps may be measured with other statistical
tests, such as the baraminic distance correlation test.
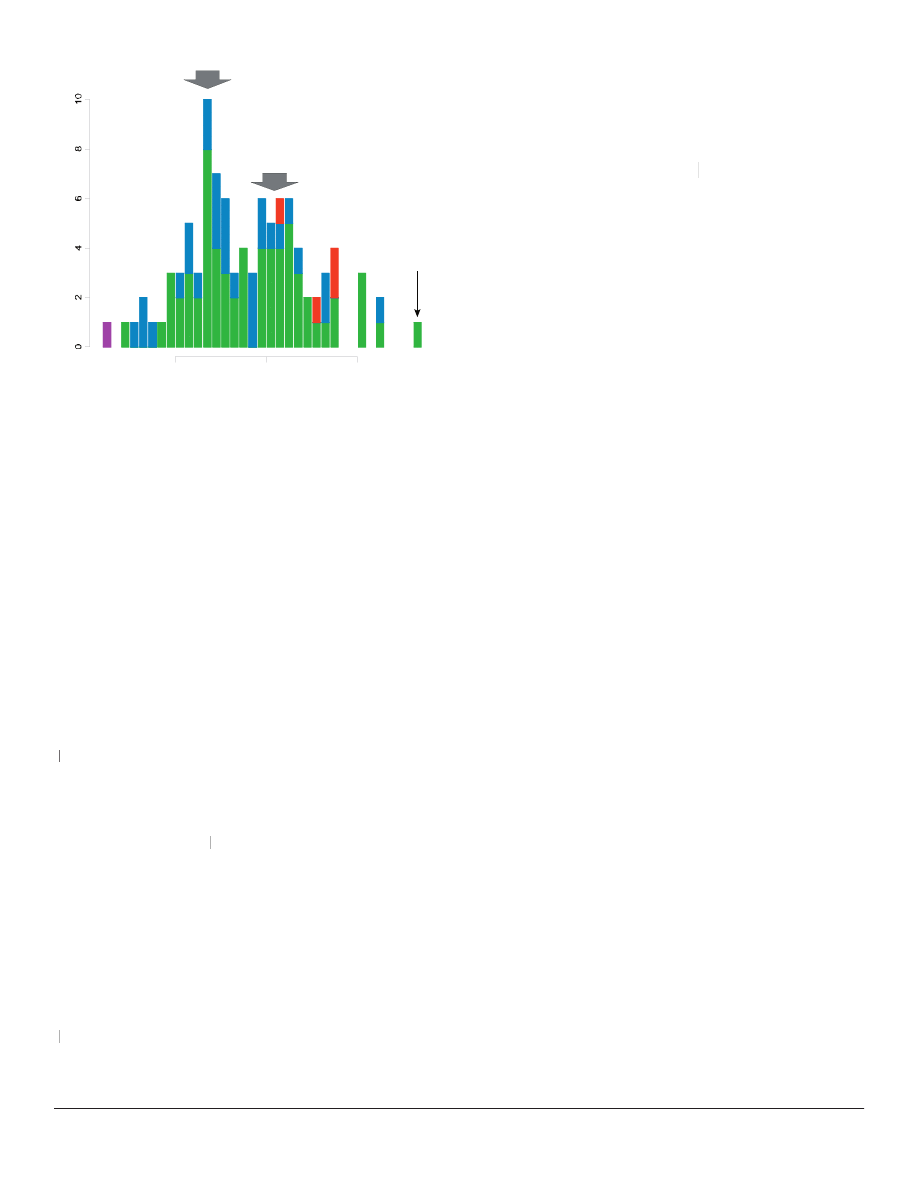
The one-dimensional ANOPA results from the Karis
dataset revealed two overlapping distributions of taxa
(Figure 1). The genus Iva of subtribe Ambrosiinae is
a possible outlier from the second main distribution.
The distributions overlap signifi cantly, indicating
a probable relationship between the two statistical
populations. Already at this level, we fi nd members
www.bryancore.org/bsg/
3
of tribes Helenieae and Heliantheae s. str. in both
populations, but we do not detect any obvious gaps
that would suggest the existence of a discontinuity.
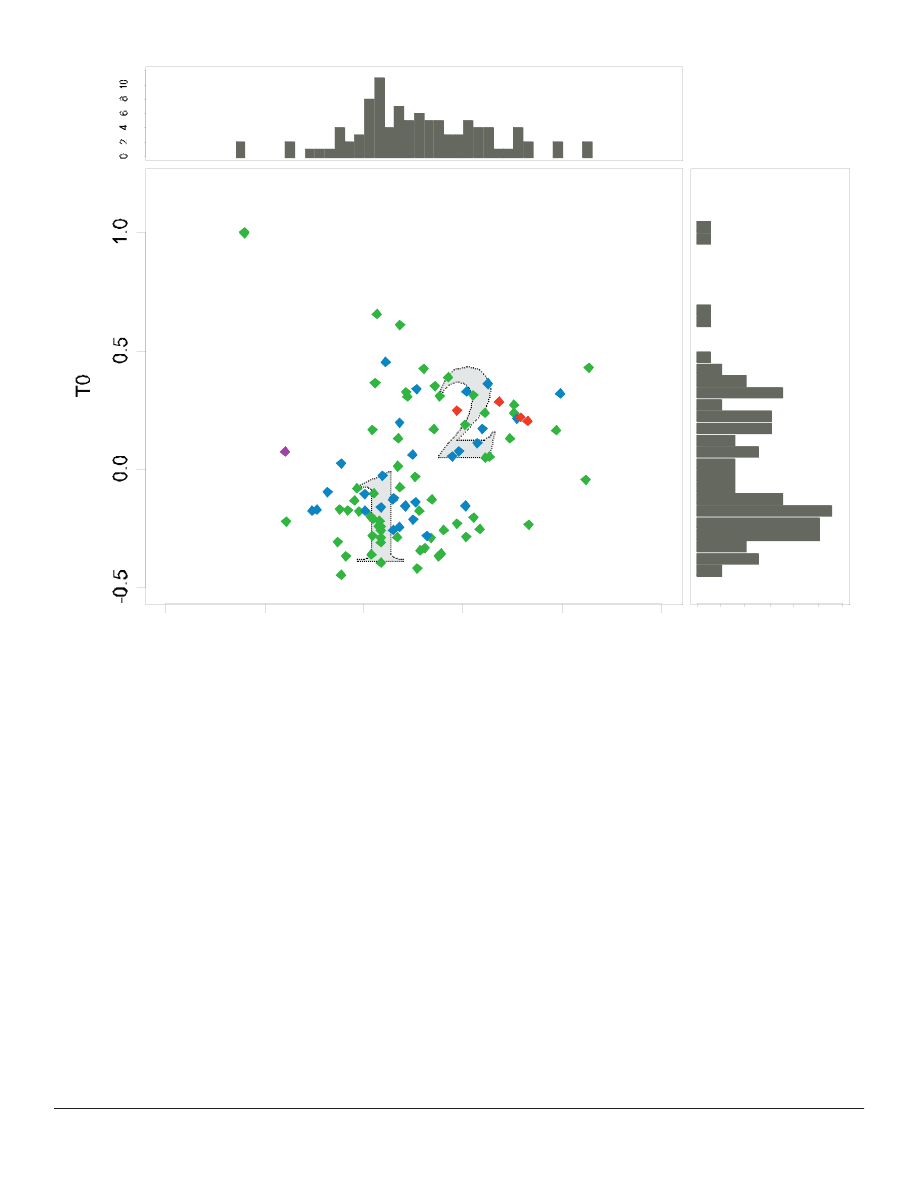
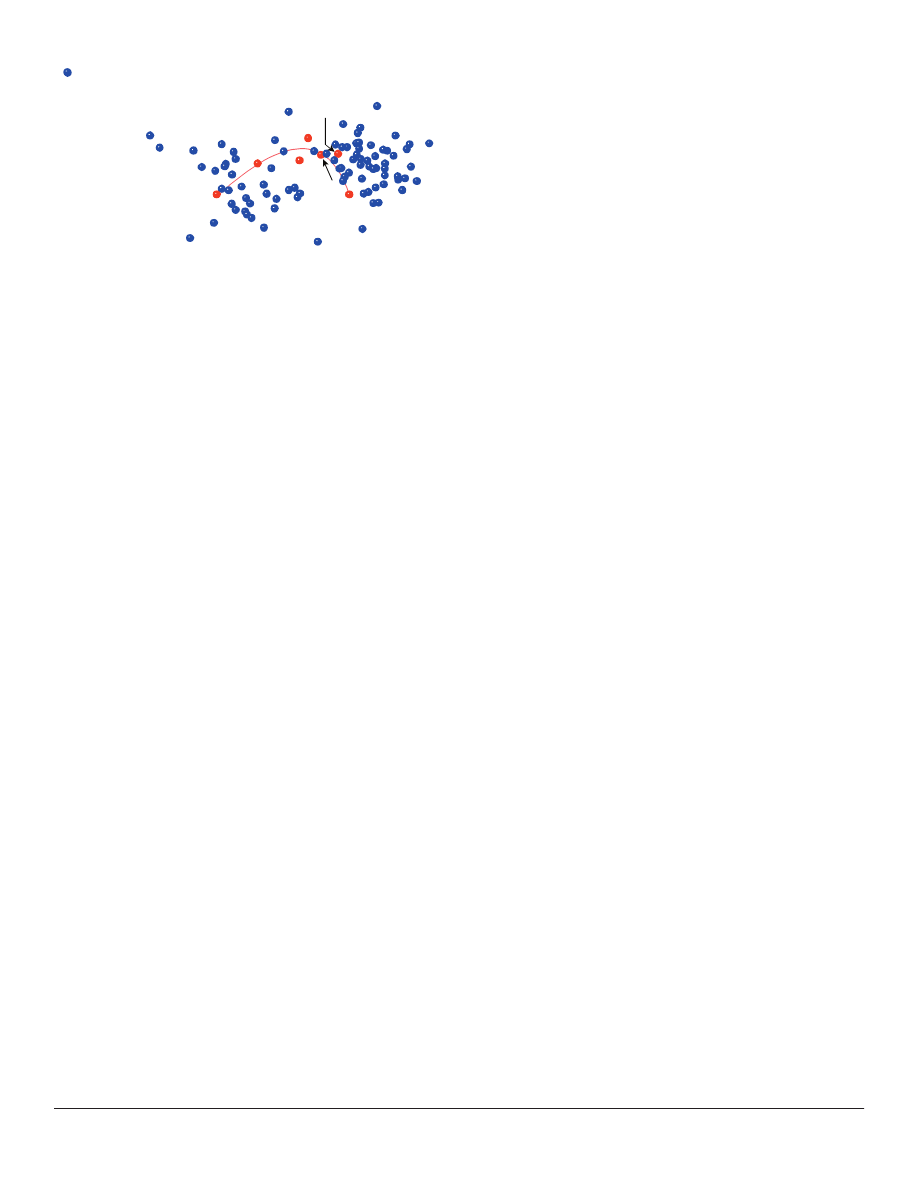
The two populations of taxa observed in the 1D
ANOPA are confi rmed in the two-dimensional plot
(Figure 2). Once again Iva appears as an outlier from
the main populations, but the added dimensionality
of the 2D plot reveals two closely-overlapping taxa
(Ambrosia
((
and Pinillosia) as much more distant outliers.
A “tight string” limited curvature boundary placed
around both populations appears as a bent tear-drop
shape and excludes the outgroup tribe Senecioneae.
Three outlying taxa (Rudbeckia
Three outlying taxa (
Three outlying taxa (
, Sanvitalia, and Iva)
on the edge of the group lie upon a consistent radius of
curvature defi ning the outer containment boundary of
one of the primary population.
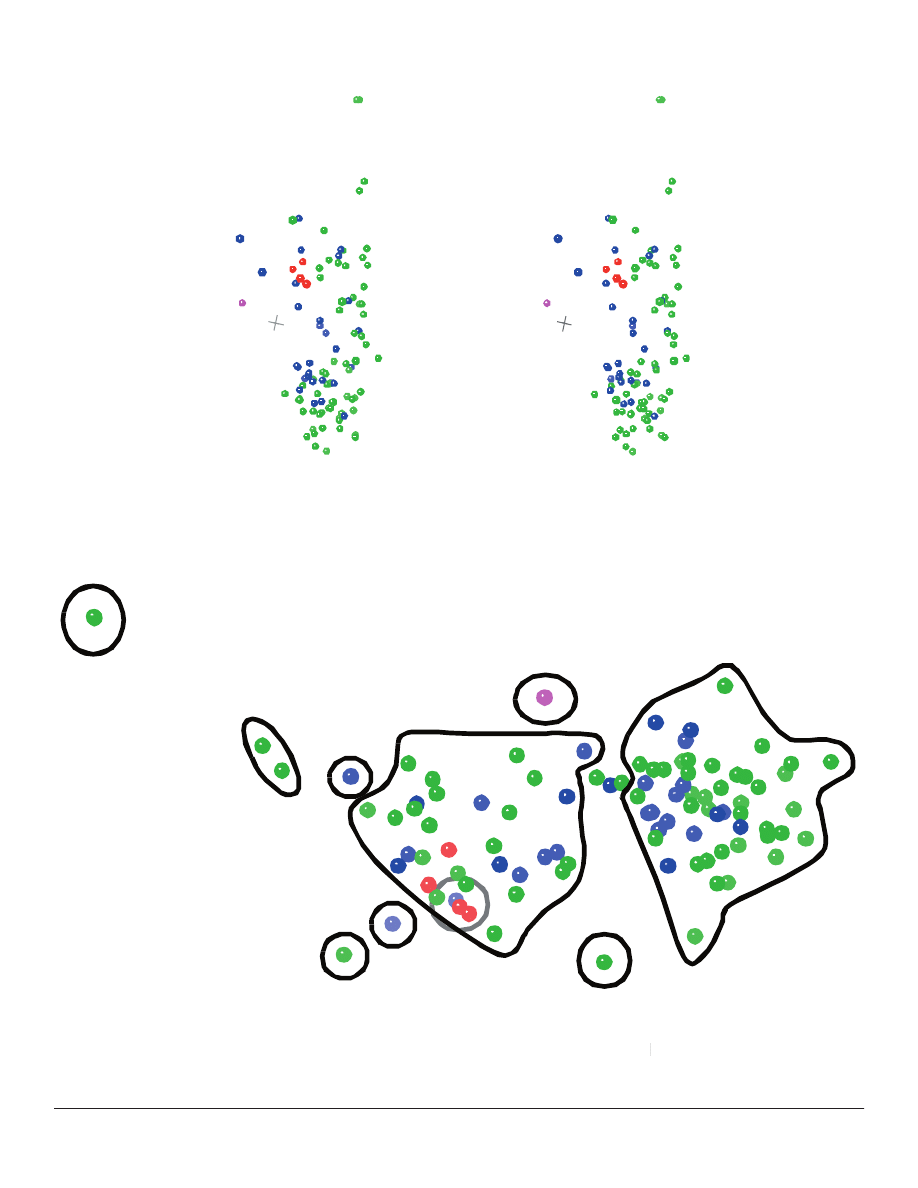
The overall structure of the 3D ANOPA plot
reveals ten visually-distinguishable groups with
most taxa residing in one of two groups (#6 and #8)
(Figures 3 and 4). Each of the largest groups may be
subdivided into smaller groups (Table 1). Groups #3
(Desmanthodium
((
and Ichthyothere), #9 (Iva
), #9 (
), #9 ( ), and #10
(Chaenactis) are probable outgroups with signifi cant
separation distances from group #6 (Figure 4). Group
A0 Distance
2.5
3.0
3.5
Iva
Figure 1. One-dimensional ANOPA results (for explanation of
axis, see Methods). Stacked histogram divided according to tribal
affi nity of genera. Tribes are color-coded as follows: Heliantheae
s. str., green; Helenieae, blue; Eupatorieae, red; Senecioneae,
magenta. Large grey arrows indicate peaks of two different
populations of taxa. Black arrow indicates outlying genus Iva.
#6 has a curved appearance along the lengthwise
axis with an arched cross section perpendicular to
the lengthwise axis. Group #8 appears as a “jelly
roll” when viewed from an appropriate angle, and
this group naturally bifurcates about Alvordia into
two subgroups. Groups #4 (Hypericophyllum
two subgroups. Groups #4 (
two subgroups. Groups #4 (
) and
#5 (Coulterella) are weakly associated with group
#6. Once again, Ambrosia and Pinillosia (group #1)
appear as signifi cant outliers from the main population
of taxa.
The seven members of Flaveriinae, previously
identifi ed as a monobaramin (Wood and Cavanaugh
2001), appear in both group #6 and #8 (Figure 5).
The wide distribution of these taxa in the 3D ANOPA
plot implies that #6 and #8 ought to be interpreted
collectively as a single monobaramin, because we
know from independent evidence that members of
both groups belong to the same monobaramin (Wood
and Cavanaugh 2001). The monobaraminic status of
#6 and #8 bears directly upon the central question of
the baraminic status of Heliantheae s. l., for #6 and #8
both contain members of the three tribes Heliantheae
s. str., Helenieae, and Eupatorieae.
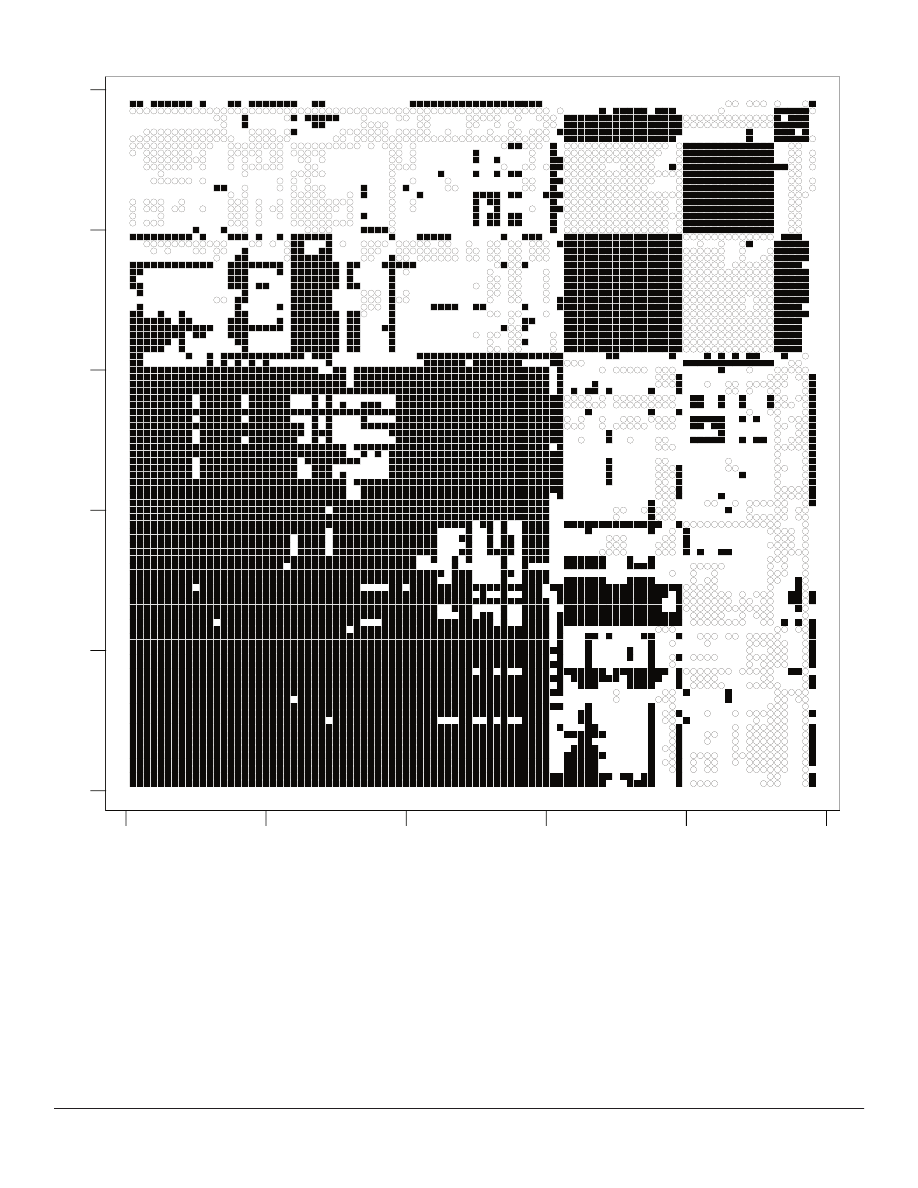
To evaluate the baraminic status of the 98 taxa
of our study, we performed a baraminic distance
correlation test, as shown in Figure 6. The results
showed an unambiguous structure consisting of fi ve
distinct groups, which we have labeled A-E (Figure 6).
Group A consists of members of ANOPA Group #8,
and Groups B and C consist of members of ANOPA
Group #6. Group D contains fi ve genera, Ambrosia,
Pinillosia, Espeletia, Milleria, and Iva. Group E
contains only one genus, Sanvitalia. As Figure 6
shows, Groups A and B share a number of signifi cant
positive correlations, as do Groups A and C. The
genera Athroisma and Flaveria show signifi cant
positive correlation with members of every group
except Group E. Group E (Sanvitalia) shows a number
of signifi cant positive correlations with members of
Group A. Thus, all taxa in the study can be connected
by signifi cant positive correlation, even though some
comparisons (e.g. Groups B and C) exhibit signifi cant
negative correlations. No taxa show signifi cant
negative correlation with all other taxa, as observed
in previous baraminic distance studies (Robinson and
Cavanaugh 1998a; Wood 2002).
4
www.bryancore.org/bsg/
D2
1.5
2.0
2.5
3.0
3.5
4.0
0
2
4
6
8
10 12
Iva
Sanvitalia
Rudbeckia
Ambrosia/Pinillosia
Figure 2. Two-dimensional ANOPA results (for explanation of axes, see Methods). Tribes are color-coded as in Figure 1. The two
concentrations of taxa are indicated by grey numbers. The histograms indicate concentration of taxa along the T0 and D2 axis.
DISCUSSION
Monobaramins within Asteraceae. We
previously analyzed the subtribe Flaveriinae and
several outgroup genera and found good evidence
for the monobaraminic status of the Flaveriinae.
Our analysis also revealed no discontinuity between
Flaveriinae and outgroup species of other Helenieae
subtribes. In the present study, we expanded our
sampling to include 98 taxa (97 genera and one
family) from a previously published dataset (Karis
1993) covering four tribes: Heliantheae s. str.,
Helenieae, Eupatorieae, and Senecioneae. We
evaluated this dataset using ANOPA and baraminic
distance correlation. The 3D ANOPA revealed ten
visually-distinguishable groups, with the majority
of taxa in either group #6 or #8. Members of the
Flaveriinae monobaramin occur in both group #6 and
#8, indicating the continuity between both groups.
If the largest ANOPA groups (#6 and #8) are
actually baraminologically continuous, then all of the
outliers also must be continuous with the main groups.
If the two large groups are lobes of a single group,
then the outliers are actually not signifi cantly different
from the larger population of taxa. The baraminic
distance correlation results confi rm this interpretation
and support the continuity of all 98 taxa in this study.
Because tribe Senecioneae was not represented in
the Karis dataset by a specifi c genus, we reserve
judgement on the relationship of that tribe to the
three tribes represented by actual genera. Whatever
www.bryancore.org/bsg/
5
Figure 3. A stereo view of the 3D ANOPA results. Tribes are color-coded as in Figure 1. Coordinate origin is shown in grey.
2
1
4
3
5 6
7
10
6
9
8
4
6 8
Figure 4. Major groups of taxa distinguishable in the 3D ANOPA. From this perspective, group 4 (Hypericophyllum
Major groups of taxa distinguishable in the 3D ANOPA. From this perspective, group 4 (
Major groups of taxa distinguishable in the 3D ANOPA. From this perspective, group 4 (
) is located behind
group 6, and groups 6 and 8 overlap slightly, thus obscuring the exact boundaries of these groups. In each of these cases, the precise
membership of individual taxa is indicated by a number on the actual taxon point.
6
www.bryancore.org/bsg/
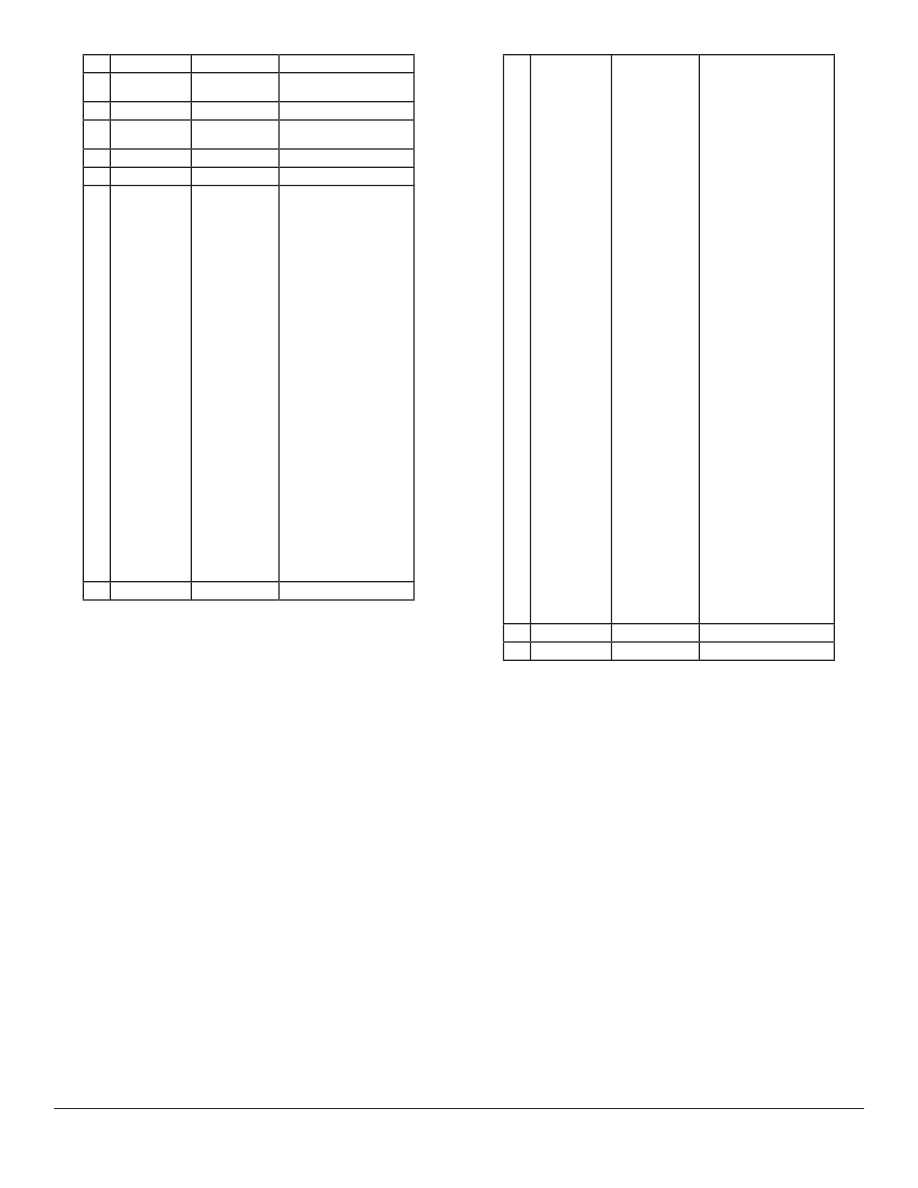
#
Taxon
Robinson (1981)
Karis and Ryding (1994)
1
Ambrosia
Pinillosia
Ambrosiinae
Pinillosinae
Heliantheae: Ambrosiinae
Heliantheae: Pinillosiinae
2
Senecioneae
Outgroup tribe
Outgroup tribe
3
Desmanthodium
Ichthyothere
Desmanthodiinae
Melampodiinae
Heliantheae: unassigned
Heliantheae: unassigned
4
Hypericophyllum
Chaenactidinae
Helenieae: Chaenactidinae
5
Coulterella
Coulterellinae
Helenieae: unassigned
6
Athroisma
Baltimora
Clibadium
Critonia
Delilia
Dimeresia
Dugesia
Engelmannia
Enhydra
Espeletia
Eupatorium
Fitchia
Flaveria
Guardiola
Haploësthes
Hemizonia
Heptanthus
Jaumea
Koehneola
Lagascea
Lindheimera
Lourteigia
Madia
Marshallia
Melampodium
Milleria
Parthenium
Pectis
Pentalepis
Polymnia
Silphium
Smallanthus
Symphyopappus
Tetranthus
Villanova
Varilla
Ecliptinae
Clibadiinae
Ecliptinae
Dimeresiinae
Ecliptinae
Ecliptinae
Enhydrinae
Espeletiinae
Fitchiinae
Flaveriinae
Guardiolinae
Flaveriinae
Madiinae
Heptanthinae
Jaumeinae
Pinillosinae
Helianthinae
Ecliptinae
Madiinae
Marshalliinae
Melampodiinae
Milleriinae
Ambrosiinae
Pectidinae
Coreopsidinae
Polymniinae
Ecliptinae
Melampodiinae
Ecliptinae
Ambrosiinae
Varillinae
Helenieae: unassigned
Heliantheae: unassigned
Heliantheae: unassigned
Eupatorieae
Heliantheae: unassigned
Helenieae: unassigned
Heliantheae: Engelmanniinae
Heliantheae: Engelmanniinae
Heliantheae: Melampodiinae
Heliantheae: Verbesininae
Eupatorieae
Heliantheae: Coreopsidinae
Helenieae: Flaveriinae
Heliantheae: unassigned
Helenieae: Flaveriinae
Helenieae: Madiinae
Heliantheae: Pinillosiinae
Helenieae: Flaveriinae
Heliantheae: Pinillosiinae
Heliantheae: Helianthinae
Heliantheae: Engelmanniinae
Eupatorieae
Helenieae: Peritylinae
Helenieae: Gaillardiinae
Heliantheae: Melampodiinae
Heliantheae: Melampodiinae
Heliantheae: Ambrosiinae
Helenieae: Pectidinae
Heliantheae: unassigned
Heliantheae: Melampodiinae
Heliantheae: Engelmanniinae
Heliantheae: Melampodiinae
Eupatorieae
Heliantheae: Pinillosiinae
Helenieae: Hymenopappinae
Helenieae: Flaveriinae
7
Sanvitalia
Ecliptinae
Heliantheae: Zinniinae
8
Acmella
Alvordia
Amblyolepis
Aphanactis
Argyroxiphium
Aspilia
Baileya
Calea
Calycadenia
Calyptocarpus
Chaetymenia
Chrysanthellum
Clappia
Coreopsis
Cosmos
Dyssodia
Echinacea
Eclipta
Encelia
Flourensia
Gaillardia
Galinsoga
Guizotia
Helenium
Helianthus
Heliopsis
Hymenopappus
Isostigma
Jefea
Lasianthaea
Lasthenia
Lycapsus
Montanoa
Neurolaena
Palafoxia
Perityle
Perymenium
Podachaenium
Ratibida
Rudbeckia
Rumfordia
Sabazia
Sclerocarpus
Simsia
Tagetes
Tetragonotheca
Tridax
Verbesina
Wedelia
Zaluzania
Zexmenia
Zinnia
Ecliptinae
Helianthinae
Gaillardiinae
Galinsoginae
Madiinae
Ecliptinae
Gaillardiinae
Neurolaeninae
Madiinae
Ecliptinae
Coreopsidinae
Clappiinae
Coreopsidinae
Coreopsidinae
Pectidinae
Ecliptinae
Ecliptinae
Ecliptinae
Ecliptinae
Gaillardiinae
Galinsoginae
Milleriinae
Gaillardiinae
Helianthinae
Ecliptinae
Hymenopappinae
Coreopsidinae
Ecliptinae
Baeriinae
Lycapsinae
Montanoinae
Neurolaeninae
Chaenactidinae
Peritylinae
Ecliptinae
Ecliptinae
Rudbeckiinae
Rudbeckiinae
Milleriinae
Galinsoginae
Helianthinae
Helianthinae
Pectidinae
Galinsoginae
Galinsoginae
Ecliptinae
Ecliptinae
Zaluzaniinae
Ecliptinae
Ecliptinae
Heliantheae: Zinniinae
Heliantheae: Helianthinae
Helenieae: Gaillardiinae
Heliantheae: Galinsoginae
Helenieae: Madiinae
Heliantheae: Verbesininae
Helenieae: Gaillardiinae
Heliantheae: Melampodiinae
Helenieae: Madiinae
Heliantheae: Verbesininae
Helenieae: unassigned
Heliantheae: Coreopsidinae
Helenieae: Flaveriinae
Heliantheae: Coreopsidinae
Heliantheae: Coreopsidinae
Helenieae: Pectidinae
Heliantheae: Rudbeckiinae
Heliantheae: unassigned
Heliantheae: Verbesininae
Heliantheae: Verbesininae
Helenieae: Gaillardiinae
Heliantheae: Galinsoginae
Heliantheae: Melampodiinae
Helenieae: Gaillardiinae
Heliantheae: Helianthinae
Heliantheae: Zinniinae
Helenieae: Hymenopappinae
Heliantheae: Coreopsidinae
Heliantheae: Verbesininae
Heliantheae: Verbesininae
Helenieae: Baeriinae
Helenieae: Peritylinae
Heliantheae: unassigned
Heliantheae: Melampodiinae
Helenieae: Chaenactidinae
Helenieae: Peritylinae
Heliantheae: Verbesininae
Heliantheae: Zinniinae
Heliantheae: Rudbeckiinae
Heliantheae: Rudbeckiinae
Heliantheae: Melampodiinae
Heliantheae: Galinsoginae
Heliantheae: Helianthinae
Heliantheae: Helianthinae
Helenieae: Pectidinae
Heliantheae: Melampodiinae
Heliantheae: Galinsoginae
Heliantheae: Verbesininae
Heliantheae: Verbesininae
Heliantheae: Verbesininae
Heliantheae: Verbesininae
Heliantheae: Zinniinae
9
Iva
Ambrosiinae
Heliantheae: Ambrosiinae
10
Chaenactis
Chaenactidinae
Helenieae: Chaenactidinae
Table 1. Generic membership of the 3D ANOPA groups, with reference to their classifi cation by Karis & Ryding (1994) and Robinson
(1981). Note that Robinson does not recognize Helenieae as a separate tribe and all listed taxa are referred to subtribes of Heliantheae
s. l.
the position of the Senecioneae, our present results
strongly support a single monobaramin consisting of
tribes Helenieae, Heliantheae s. str., and four genera
of tribe Eupatorieae.
Historically, tribes Heliantheae and Helenieae have
been diffi cult to circumscribe. According to Robinson,
Heliantheae was fi rst described by Cassini in 1819
but Bentham divided the group into Heliantheae and
Helenieae in 1873 (Robinson 1981). Based on a
cladistic analysis of the same dataset used in this study,
Karis concluded that the Helenieae were paraphyletic
and that the Heliantheae were a monophyletic lineage
branching from the Helenieae (Karis 1993). Bremer
accepted this cladistic conclusion, but still retained
tribe Helenieae in his treatment of the family (Bremer
1994a). Our results agree with none of these previous
proposals and may thus illuminate the cause of
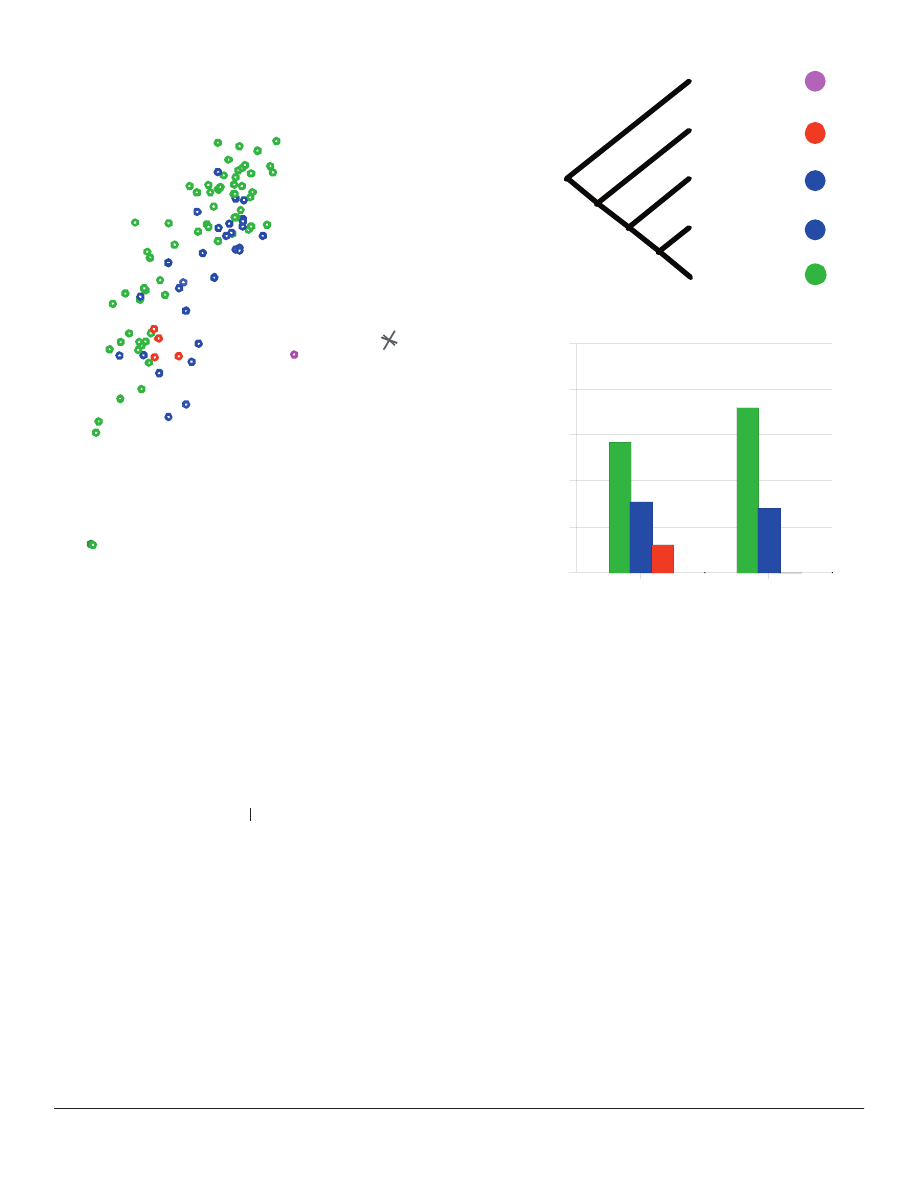
confusion in the classifi cation of these taxa. Although
the 3D ANOPA plot showed two clear groups of
genera (#6 and #8), the groups do not correspond
to the accepted tribes (Figure 7). Of the 35 genera
in group #6, 57% are members of Heliantheae, 31%
are members of Helenieae, and 12% are members
of Eupatorieae. The 50 genera of group #8 show a
similar distribution, with 28% members of Helenieae
and 72% members of Heliantheae (Figure 7).
This taxon pattern-vector non-linear geometry
illustrates the diffi culty of applying classical
statistical methods and classical tree data structure
methods to identify taxic groups. ANOPA presents
an excellent means of observing multidimensional
“morphospace” in three dimensions without the loss
www.bryancore.org/bsg/
7
Varilla
Dyssodia
Jaumea
Haploësthes
Tagetes
Clappia
Flaveria
Figure 5. The location of the previously-identifi ed monobaramin
within the larger Heliantheae s. l. 3D ANOPA results.
Monobaramin members are indicated in red and labeled. An arc
connecting the taxa is shown in pink.
of important information. The results of our ANOPA
on the Karis dataset reveal a complex relationship
between the taxa that seems to preclude rigorous
classifi cation of most taxa into a particular tribe based
on one or another characteristic. When viewed in
toto, the synapomorphy-based tribe Heliantheae s.
str. intermingles with members of the paraphyletic
Helenieae and the alleged outgroup Eupatorieae. In
this case, ANOPA reveals the morphological trends
more powerfully than do the rigid tree structures
produced by cladistic analyses. The complexity of
morphospace is poorly described by a bifurcating
tree.
Asteraceae as an Apobaramin. In the present
and the previous analysis (Wood and Cavanaugh
2001), we sought discontinuity at the level of tribe
and subtribe within the family Asteraceae. In both
cases, we found evidence of continuity but no
evidence of discontinuity. Having failed to identify
apobaraminic tribes or subtribes within Asteraceae,
it is appropriate to evaluate the discontinuity of the
family as a whole. Plant systematists have long
recognized Asteraceae as a distinct family within the
fl owering plants (Bentham 1873). Because members
of Asteraceae are so distinctive, cladists have not yet
enumerated synapomorphies that defi ne the family.
Instead, Asteraceae are usually described by a suite
of homoplastic synapomorphies (Crepet and Stuessy
1978; Lawrence 1951).
In their discussion of the fossil Viguiera cronquistii,
Crepet and Stuessy (1978) list eight characteristics
that defi ne the family: 1. Infl orescence a capitulum,
2. Involucral bracts subtending the capitulum, 3.
Syngenesious anthers, 4. Epipetalous stamens, 5.
Pappus, 6. Inferior ovary, 7. Bicarpellate ovary, 8.
Achene fruit. Because each of these characters occur
in at least one other family, no trait alone may be
considered synapomorphic. Only Judd et al. (1999)
explicitly list seven synapomorphies that unite the
family. In addition to synapomorphies 1-3, 5, and
8 listed by Crepet and Stuessy above, Judd et al. list
three others: 1. Sesquiterpenes present, but iridoids
lacking, 2. Ovary with basal placentation, and 3.
Ovules one per ovary. They do not accept the inferior
or bicarpellate ovary as synapomorphic (Judd et al.
1999). Again, though, each of these characteristics are
homoplastic synapomorphies. For example, achenes
also occur in Brunoniaceae and Calyceraceae, and
epipetalous stamens occur in Campanulaceae (Crepet
and Stuessy 1978).
Although Asteraceae are morphologically
distinctive and considered by evolutionists to be
monophyletic, these facts alone do not constitute
evidence for baraminic discontinuity. Because the
monophyly of all living things is widely accepted,
phylogenetic discontinuity within the tree of life is
a wholly alien concept to evolutionary theory and
practice. Consequently, Wise proposed a series of
criteria by which discontinuity may be detected
(Wise 1992). Three of these criteria may be applied
to the Asteraceae: 1. synapomorphies, 2. uncertainty
of ancestral or sister group (neontological evidence),
and 3. uncertainty of ancestral or sister group
(paleontological evidence).
According to Wise, independently-created
organisms may be distinguished by a clear set of
defi ning characteristics (synapomorphies) (Wise
1992). As we noted above, all synapomorphies
uniting the Asteraceae are homoplastic. Nevertheless,
the overall shape of the ovary is widely-acknowledged
to be unique to the family. Thus, we may conclude
that the suite of homoplastic synapomorphies listed
by Crepet and Stuessy and Judd et al. constitutes a
single, well-defi ned, holistic synapomorphy that sets
the Asteraceae apart from all other plant families.
The identifi cation of an unambiguous ancestral
or sister group from neontological or paleontological
evidence would be good evidence of phylogenetic
continuity. The absence of an ancestral or sister group
could indicate that the group of interest was separately
created as a discontinuous baramin (Wise 1992). The
8
www.bryancore.org/bsg/
0
20
40
60
80
100
0
20
40
60
80
100
testmat[cmat > 0 & pmat < 0.05]
testmat2[cmat > 0 & pmat < 0.05]
Figure 6. Baraminic distance correlation for all 98 taxa in the Karis dataset. Taxa with signifi cant (P<0.05) positive correlation are
indicated as fi lled squares, and taxa with signifi cant (P<0.05) negative correlation are indicated as open circles. Taxa are ordered by the
agglomerative nesting algorithm in S-PLUS (see methods). Group A consists of taxa 1-62 (in order: Acmella, Podochaenium, Zinnia,
Jefea, Zexmenia, Lasianthaea, Perymenium, Verbesina, Calyptocarpus, Aspilia, Wedelia, Encelia, Flourensia, Neurolaena, Sabaxia,
Aphanactis, Guizotia, Calea, Tetragontheca, Galinsoga, Tridax, Lycapsus, Chaetymenia, Koehneola, Eclipta, Heliopsis, Rumfordia,
Zaluzania, Enhydra, Montanoa, Rudbeckia, Ratibida, Echinacea, Alvordia, Simsia, Helianthus, Sclerocarpus, Chrysanthellum,
Coreopsis, Cosmos, Isostigma, Dyssodia, Lasthenia, Palafoxia, Amblyolepis, Senecioneae, Baileya, Villanova, Perityle, Haploësthes,
Jaumea, Clappia, Pectis, Hymenopappus, Gaillardia, Helenium, Argyroxiphium, Madia, Calycadenia, Tagetes, Athroisma, Flaveria).
Group B consists of taxa 63-79 (in order: Engelmannia, Lindheimera, Silphium, Baltimora, Pentalepis, Dugesia, Heptanthus, Delilia,
Parthenium, Smallanthus, Polymnia, Melampodium, Guardiola, Clibadium, Ichthyothere, Desmanthodium, Hemizonia). Group C
consists of taxa 80-92 (in order: Lagascea, Lourteigia, Symphyopappus, Eupatorium, Critonia, Hypericophyllum, Fitchia, Varilla,
Marshallia, Tetranthus, Coulterella, Dimeresia, Chaenactis). Group D consists of taxa 93-97 (in order: Ambrosia, Pinillosia, Espeletia,
Milleria, Iva). Group E consists of taxon 98 (Sanvitalia).
www.bryancore.org/bsg/
9
identity of the sister group of Asteraceae remains an
area of active research among plant systematists.
Early cladistic analyses of morphological data support
the Lobeliaceae, Campanulaceae, or the Calyceraceae
(Anderberg 1992; Bremer 1994b), but more recent
molecular studies of ndhF support the Calyceraceae
ndhF
ndhF
or Goodeniaceae (Kim and Jansen 1995). Bremer
considered the sister group of Asteraceae to be
either Campanulaceae sensu lato, Calyceraceae,
or Goodeniaceae (Bremer 1994b), but more recent
research supports a monophyletic group consisting
of Asteraceae, Calyceraceae, Brunoniaceae, and
Goodeniaceae (Gustafsson and Bremer 1995).
Gustafsson concluded that the sister group of the
Asteraceae is probably Goodeniaceae or Calyceraceae
(Gustafsson 1996). Since more and more evidence
is being discovered that points to the same limited
number of families as the sister to Asteraceae, we
Senecioneae
Eupatorieae
Helenieae
Heliantheae
Helenieae
Group #6
Group #8
0
20
40
60
80
100
Figure 7. The 3D ANOPA results compared to a representation of the phylogeny of Karis (Karis 1993). The histogram indicates the
percentage of taxa in groups #6 and #8 that are members of tribes Heliantheae s. str. (green), Helenieae (blue), and Eupatorieae (red).
Taxa are color-coded as in Figure 1.
cannot at this time infer discontinuity from the lack of
an extant sister group.
One other fi eld of evidence relates to the question of
Asteraceae discontinuity: their well-documented fossil
record. Turner reviewed the fossil record of Asteraceae
and concluded that macrofossils demonstrate the
existence of the family in Eocene sediments (Turner
1977). Members of Heliantheae in particular appear
in both Eocene and Miocene sediments. An achene
discovered in the Eocene of Colorado appears similar
to Jaumea or Hypericophyllum, and pollen from
Ambrosia appears in the Miocene of the northwestern
U.S. and the Caribbean. In contrast, Crepet and Stuessy
(1978) dispute the classifi cation of macrofossils as
Asteraceae, persuasively arguing that the Miocene
Viguiera cronquistii may not be unequivocally referred
to the Asteraceae. Turner and Crepet & Stuessy agree
that the pollen record of Asteraceae does show a

10
www.bryancore.org/bsg/
dramatic increase in the Miocene that persists in the
Pliocene and Pleistocene.
Whether or not one accepts the macrofossils,
the fossil pollen presents useful baraminological
data. Pollen that appears fi rst in the fossil record
may be referred to the tribes Mutisieae, Heliantheae,
and possibly Astereae or Helenieae (Graham 1996).
Assuming the conventional phylogeny of Asteraceae
is correct, all clades of Asteraceae must have been
present at least by the Miocene (when the fossil pollen
becomes common) since Heliantheae, Helenieae, and
Astereae branch only after the origin of the rest of the
clades (Bremer 1994b). The early appearance of these
crown taxa leads to two conclusions relevant to the
question of discontinuity. First, the Asteraceae display
the full diversity of the family at their fi rst appearance
in the fossil record, similar in quality to the “Cambrian
explosion.” Wise has argued that disparity preceding
diversity suggests discontinuity (Wise 2001); thus, the
implied presence of tribal diversity prior to intertribal
species diversity would suggest discontinuity between
Asteraceae and other families. Second, the earlier
evolution of the family is not known from the fossil
record, thus the paleontological ancestral group is
unknown. The absence of an ancestor in the fossil
record constitutes another evidence of discontinuity
(Wise 1992).
Based on this brief review, we provisionally
accept the phylogenetic discontinuity surrounding
the Asteraceae. Based on the support we have listed
here, we are confi dent that future research will clarify
the apobaraminic status of Asteraceae. In particular,
examination of the ndhF and
ndhF
ndhF
rbcL DNA sequences
could lend statistical support to the proposed
phylogenetic discontinuity between Asteraceae and
other plant families. Further research will clarify
the position of Goodeniaceae and Calyceraceae, the
putative sister groups of Asteraceae.
The Central Question. We began the study
of Asteraceae to determine whether conventional
classifi cation could inform our baraminological
hypotheses. In particular, we wished to address
whether the conventional family was equivalent to the
holobaramin in non-vertebrate organisms. Creationists
have long used the conventional classifi cation to
guide baraminological hypotheses, and some even
claim that baramins may be approximated by the
family. We lack strong baraminological studies to
confi rm these intuitive beliefs. In our previous study,
we presented evidence from hybridization that the
subtribe Flaveriinae forms a monobaramin that is
part of a larger, unidentifi ed holobaramin (Wood and
Cavanaugh 2001). In the present study, we argue
from 3D ANOPA and baraminic distance that three
tribes comprise a single monobaramin, which in turn
belongs to a larger, unidentifi ed holobaramin.
Our analysis of members of the Asteraceae has not
uncovered any signifi cant phylogenetic discontinuities
within the family. If we include all species of
Helenieae, Eupatorieae, and Heliantheae s. str., the
present three-tribe monobaramin represents 5730
species, the second largest monobaramin identifi ed
after the Poaceae (Wood 2002). If we include the
Senecioneae, the total rises to 8930 species, nearly
40-45% of the entire Asteraceae apobaramin.
Further evaluations of interspecifi c hybridization and
baraminic distance among the species of Asteraceae
will help to clarify the baraminological status of this
monobaramin. Consequently, we still cannot rule out
the possibility that all 20,000 species of the Asteraceae
represent a single holobaramin.
REFERENCES
Anderberg, A.A. 1992. The circumscription of the
Ericales, and their cladistic relationships to other
families of “higher” dicotyledons. Systematic
Botany 17:660-675.
Bentham, G. 1873. Notes on the classifi cation, history,
and geographical distribution of Compositae.
Journal of the Linnaen Society XIII:335-577.
Bremer, K. 1994a. Classifi cation. In: Bremer, K., ed.
Asteraceae: Cladistics & Classifi cation. Timber
Press, Portland, OR, pp. 13-23.
Bremer, K. 1994b. Evolution. In: Bremer, K., ed.
Asteraceae: Cladistics and Classifi cation. Timber
Press, Portland, OR, pp. 36-46.
Cavanaugh, D.P. and R.v. Sternberg. 2002. Analysis
of morphological constraints using ANOPA, a
pattern recognition and multivariate statistical
method: A case study involving centrarchid fi shes.
J. Biol. Systems, submitted.
Crepet, W.L. and T.F. Stuessy 1978. A reinvestigation
of the fossil Viguiera cronquistii (Compositae).
Brittonia 30:483-491.
Graham, A. 1996. A contribution to the geologic
history of the Compositae. In: Hind, D.J.N.

www.bryancore.org/bsg/
11
and H.J. Beentje, eds. Compositae: Systematics
Proceedings of the International Compositae
Conference, Kew, 1994. Royal Botanic Gardens,
Kew, pp. 123-140.
Gustafsson, M.H.G. 1996. Phylogenetic hypotheses
for Asteraceae relationships. In: Hind, D.J.N.
and H.J. Beentje, eds. Compositae: Systematics
Proceedings of the International Compositae
Conference, Kew, 1994. Royal Botanic Gardens,
Kew, pp. 9-19.
Gustafsson, M.H.G. and K. Bremer 1995.
Morphology and phylogenetic interrelationships
of the Asteraceae, Calyceraceae, Campanulaceae,
Goodeniaceae, and related families (Asterales).
Am. J. Bot. 82:250-265.
Jones, A.J. 1972. Boundaries of the min: An analysis
of the mosaic lists of clean and unclean animals.
Creation Research Society Quarterly 9:114-123.
Judd, W.S., C.S. Campbell, E.A. Kellogg, and P.F.
Stevens. 1999. Plant Systematics: A Phylogenetic
Approach. Sinauer Associates, Sunderland, MA.
Karis, P.O. 1993. Heliantheae sensu lato (Asteraceae
sensu lato (
sensu lato (
),
clades and classifi cation. Plant Systematics and
Evolution 188:139-195.
Karis, P.O. and Ryding, O. 1994. Tribe Helenieae.
In: Bremer, K., ed. Asteraceae: Cladistics and
Classifi cation. Timber Press, Portland, OR, pp.
521-558.
Kaufman, L. and P.J. Rousseeuw. 1990. Finding
Groups in Data: An Introduction to Cluster
Analysis. Wiley, New York.
Kim, K.J. and R.K. Jansen 1995. ndhF sequence
evolution and the major clades in the sunfl ower
family. Proc Natl Acad Sci U S A 92:10379-83.
Lawrence, G.H.M. 1951. Taxonomy of Vascular
Plants. Macmillan Co., New York.
Lundberg, J. 1996. Phylogeny of subtribe Flaveriinae
(Asteraceae: Helenieae), unpublished dissertation.
Uppsala University, Uppsala.
ReMine, R.J. 1990. Discontinuity systematics: A new
methodology of biosystematics relevant to the
creation model. In: Walsh, R.E. and C.L. Brooks,
editors. Proceedings of the Second International
Conference on Creationism. Creation Science
Fellowship, Pittsburgh, pp. 207-213.
Robinson, D.A. and D.P. Cavanaugh 1998a. Evidence
for a holobaraminic origin of the cats. Creation
Research Society Quarterly 35:2-14.
Robinson, D.A. and D.P. Cavanaugh 1998b. A
quantative approach to baraminology with
examples from Catarrhine primates. Creation
Research Society Quarterly 34:196-208.
Robinson, H. 1981. A revision of the tribal and
subtribal limits of the Heliantheae (Asteraceae).
Smithsonian Contributions to Botany 51:1-102.
Turner, B.L. 1977. Fossil history and geography. In:
Heywood, V.H., J.B. Harborne, and B.L. Turner,
eds. The Biology and Chemistry of the Compositae.
Academic Press, New York, pp. 21-39.
Wise, K.P. 1990. Baraminology: A young-earth
creation biosystematic method. In: Walsh, R.E.
and C.L. Brooks, editors. Proceedings of the
Second International Conference on Creationism.
Creation Science Fellowship, Pittsburgh, pp. 345-
358.
Wise, K.P. 1992. Practical Baraminology. Creation
Ex Nihilo Technical Journal 6:122-137.
Ex Nihilo Technical Journal
Ex Nihilo Technical Journal
Wise, K. 2001. Evidence of biological discontinuity in
the fossil record. In: Helder, M., ed. Discontinuity:
Understanding Biology in the Light of Creation.
Baraminology Study Group, Cedarville, OH, pp.
25-26.
Wood, T.C. 2002. A baraminology tutorial with
examples from the grasses (Poaceae). TJ 16:15-
TJ
TJ
25.
Wood, T.C. and D.P. Cavanaugh 2001. A
baraminological analysis of subtribe Flaveriinae
(Asteraceae: Helenieae) and the origin of
biological complexity. Origins 52:7-27.
Wood, T.C., P.J. Williams, K.P. Wise, and D.A.
Robinson. 1999. Summaries on Camel
Baraminology. In: Robinson, D.A. and P.J.
Williams, eds. Baraminology’99. Baraminology
Study Group, pp. 9-18.
Wood, T.C., K.P. Wise, and D.P. Cavanaugh. 2001.
Pattern Recognition Analysis of Fossil Horses
Confi rms the Reality of the Stratomorphic
Series. In: Helder, M., editor. Discontinuity:
Understanding Biology in the Light of Creation.
Baraminology Study Group, pp. 34.
Wyszukiwarka
Podobne podstrony:
Cherry Orchard, A Doll's House, and Galileo General Analys
Personality and divorce A genetic analysis
Death of a Salesman and The Price Analysis of Ideals
Breman And Subrahmanyam Investment Analysis And Price Formation In Securities Markets
Cultural Studies, Critical Theory and Critical Discourse Analysis Terry Threadgold (Cardiff)
With Microscope and Tweezers An Analysis of the Internet Virus of November 1988
LCD VU meter and FFT spectrum analyser
Personality and divorce A genetic analysis
Analysis of soil fertility and its anomalies using an objective model
Extensive Analysis of Government Spending and?lancing the
Summary and Analysis of?owulf
Count of Monte Cristo, The Book Analysis and Summary
KasparovChess PDF Articles, Alexey Bezgodov The Hottest and Latest Moves with GM Analysis!
Catcher in the Rye, The Book Analysis and Summary
Cry, the?loved Country Book Review and Analysis
Preliminary Analysis of the Botany, Zoology, and Mineralogy of the Voynich Manuscript
Conceptual Analysis and Reductive Explanation
Doll's House, A Interpretation and Analysis of Ibsen's Pla
Babi Yar Analysis of Yevtushenko's Writing Style and Meani
więcej podobnych podstron