
A Case Study of Auditory Navigation in Virtual Acoustic
Environments
Tapio Lokki, Matti Gr¨ohn, Lauri Savioja, and Tapio Takala
Telecommunications Software and Multimedia Laboratory
Helsinki University of Technology
P.O.Box 5400, 02015 HUT, Helsinki, FINLAND
Phone: +358 9 451 4737, Fax: +358 9 451 5014
Tapio.Lokki@hut.fi, Matti.Grohn@hut.fi, Lauri.Savioja@hut.fi, Tapio.Takala@hut.fi
ABSTRACT
We report results of an auditory navigation experiment. In auditory navigation sound is employed as a navigational aid in a
virtual environment. In our experiment, the test task was to find a sound source in a dynamic virtual acoustic environment.
In dynamic auralization the movements of the subject are taken into account in acoustic modeling of the room. We tested the
effect of three different factors (stimulus, panning method and acoustic environment) to the number of errors and to the time
spent in the test in finding the target. The results, which were also statistically validated, proved that noise is the best stimulus,
reverberation complicates the navigation and simple models of spatial hearing give enough cues for auditory navigation.
Keywords: Auditory Navigation, Virtual Acoustics, Spatial Hearing, Dynamic Auralization
INTRODUCTION
In this paper we describe results of an auditory navigation experiment. Auditory navigation tests have been done earlier e.g.
by Loomis et al. [6] and Rutherford [8]. Our aim was to do the experiment in dynamic system, in which perceived acoustics
changes according to the movements of the subject. A good overview of different techniques needed in auditory navigation is
presented by Begault [2]. In our experiment we applied a version of the DIVA auralization system [9].
EXPERIMENT
In this experiment the task of the subjects was to find a sound source by moving and turning in a virtual space. Our purpose
was to analyse the effect of various factors in the test setup. These factors were influence of the sound stimulus, the directional
cues, and acoustics of the environment.
We collected the following data from each test : time spent, ending position, and trajectory of the subject’s motion. Also every
subject filled out a short questionnaire after completing the experiment. In this questionnaire we asked comments about the
easiest stimulus and which tactic the subject used in finding the sound source. In the experiment, instructions were given both
aurally and literally. In the beginning of the experiment there were three rehearsal tests. These helped subjects to understand
what they should do.
We carried out a complete test set with three variables each having three different choices. Thus the whole test set contained
27 tests.
Coaching
Moving in a virtual space was controlled with the arrow keys of a keyboard. The subject was able to move forward and
backward, and to turn left and right in constant steps (0.4 meter when moving forward or backward and
when turning).
When subject assumed that he has found the sound source he indicated that by pressing key “
f
”. This experiment was done in
the horizontal plane.
The sound source was a point source. The target area was a sphere around the source (the diameter was one meter). Starting
positions were in random directions, 25 m away from the source.
The experiment was run in an SGI O2 workstation in a quiet office room. The reproduction equipment was headphones
(Sennheiser HD-580).
Participants
The experiment was completed (all 27 tests) by 27 subjects. All of them were students or staff from Helsinki University of
Technology. All subjects easily understood the experiment and were enthusiastics to give comments and to see their results.
Stimulus
Panning method
Acoustic environments
pink noise
ITD alone
direct sound
artificial flute
ITD + simple amplitude panning (See Fig. 1)
direct sound + 6 early reflections
recorded anechoic guitar
ITD + minimum-phase HRTF (FIR 30 taps)
direct sound + 6 early reflections
+ reverberation (length about 1 second)
Table 1: The three tested factors.
Variables
In this experiment we tested three different factors: stimulus, panning method, and influence of acoustic environment. Each
factor contained three choices summarized in Table 1.
Stimuli: All stimuli were sampled at 32 kHz and had equal loudness. Each was about 30 seconds long and played in a loop.
The sound source had an omni-directional radiation pattern. Pink noise and anechoic guitar were digitally copied from Music
for Archimedes CD.
1
The synthesized flute was produced by a physical-based model [11].
Panning Methods:
The interaural time difference (ITD), was included as an auditory cue to all tests. The ITD was calculated from spherical head
model and implemented with a short delay line. When subject pressed a key to turn his head the ITD changes smoothly. The
pick-up positions from ITD delay line were interpolated with first order fractional delays.
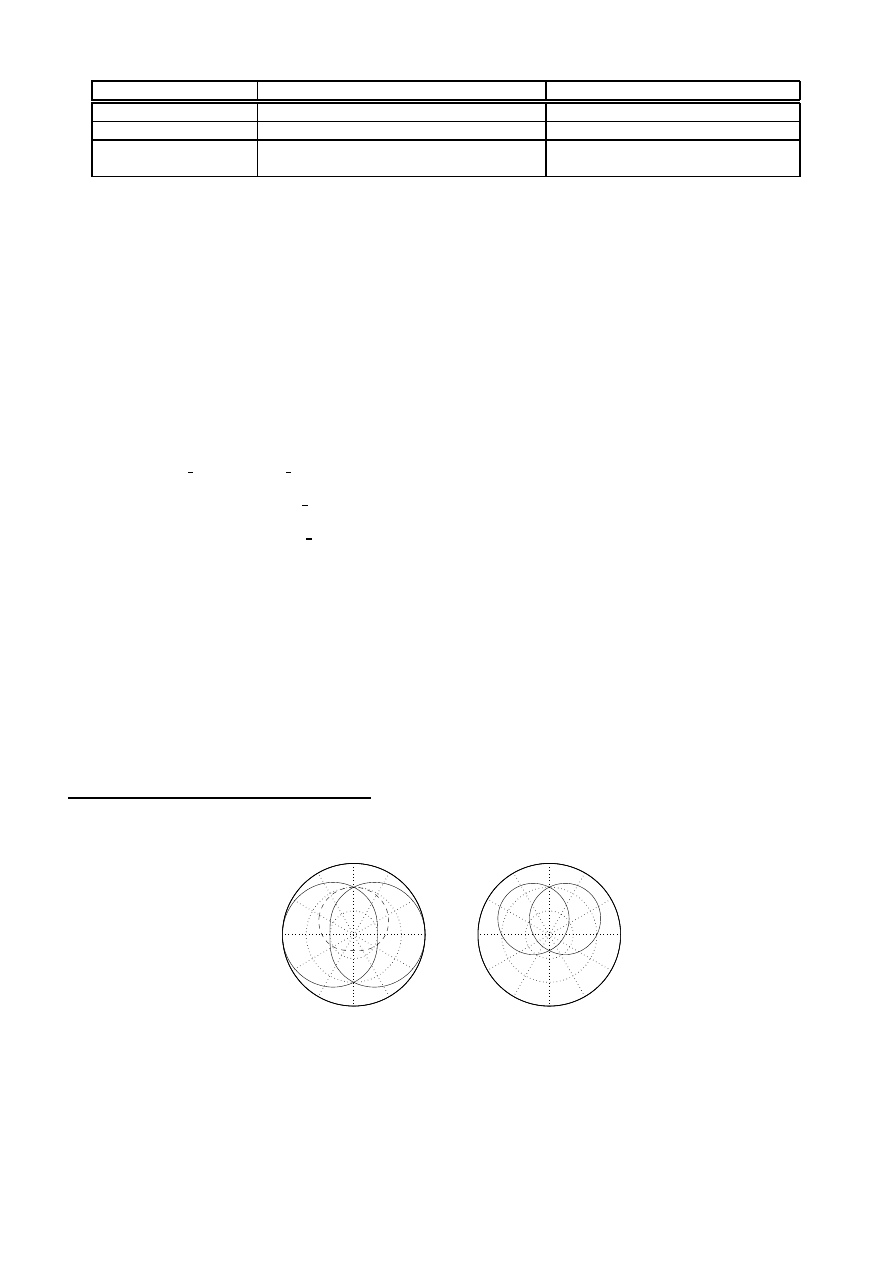
The second panning method included also a simple model for frequency independent interaural level difference (ILD). This
method, also called cardioid method, was introduced by Takala and Hahn [10]. In this method sound signals for both ears are
weighted with
and
, which are obtained from equations:
"!#
%$ &('*)
,+.-(-
$
/01!#
%$ 243&
,+--(5#
(1)
67/%89!#
:$ &';)
+.--
$
1!#
<$ 2=3.&
,+.-(-(5.#
(2)
where
+
is the azimuth angle of incoming sound. The cardioid method is illustrated in Fig. 1. On the left side two solid lines
illustrate the panning gains for right and left ears and a dashed line shows the front-back gain (
0>!#
<$%243.&
,+.-(-(5#
in Eq. 1
and Eq. 2). On the right side of Fig. 1 the final panning gains for left and right ear are depicted.
The third panning method used minimum-phase head-related transfer function (HRTF) filters instead of simple ILD. Original
HRTFs were measured from an artificial head [7]. They were approximated with 30 tap FIR filters designed by Huopaniemi
[5]. We had filters at
?!
steps and other directions were interpolated from two adjacent filters with linear interpolation of filter
coefficients.
Acoustic environment: The simplest acoustic environment was a free field, where only the direct sound was rendered. Our
auralization software calculates distance dependent delay, gain (according to 1/r-law), air absorption and direction for the
sound source. Air absorption is implemented with a simple lowpass filter. All auralization parameters are updated according
to the movements of a user. For example, when moving towards the sound source, delay gets shorter, gain gets bigger, and
air absorption reduces less high frequencies. To get smooth and continuous output signal the auralization parameters are
interpolated.
1
CD B&O 101. Music for Archimedes, 1992.
0.5
1
1.5
30
210
60
240
90
270
120
300
150
330
180
0
0.5
1
1.5
30
210
60
240
90
270
120
300
150
330
180
0
Figure 1: The cardioid panning method. In the left picture solid lines are right and left ear gains and a dashed line is front-back
gain. In the right picture the final panning gains for left and right ear are depicted.

Found
Not Found
Total
Tested variable
N
Percent
N
Percent
N
pink noise
232
95.5 %
11
4.5 %
243
artificial flute
191
78.6 %
52
21.4 %
243
recorded anechoic guitar
199
81.9 %
44
18.1 %
243
ITD only
176
72.4 %
67
27.6 %
243
ITD + Cardioid panning
221
90.9 %
22
9.1 %
243
ITD + HRTF (dummy head)
225
92.6 %
18
7.4 %
243
direct sound
215
88.5 %
28
11.5 %
243
direct sound + 6 reflections
210
86.4 %
33
13.6 %
243
direct sound + 6 reflections + reverb
197
81.1 %
46
18.9 %
243
Table 2: The number of found and not found cases. The 27 navigation tasks were completed by 27 subjects.
The second and third acoustic environments were a simple shoe-box room (30m x 22m x 10m). The second rendering case
included the direct sound (located in a corner, 2m from floor, 2m from wall and 5m from another wall) and all six first order
reflections, which were calculated using the image source method [1]. Each image source had similar auralization parameters
as the direct sound, but also material absorption was included. The auralization parameters of image sources (and direct sound)
were updated dynamically, according to the movements of user. The third rendering case included the direct sound, six early
reflections and late reverberation with duration of one second.
RESULTS
The first result of our experiment is that in most cases subjects did find the target area. The found and not found (also called
errors) cases are summarized in Table 2 as a function of the tested variables. In the case “found” the ending point of the
navigation task was inside the target area.
Three subjects managed perfectly in all tests; they found the sound source in all 27 tests. Over half of the subjects made less
than three errors which can be considered very well performance. One of the subjects, whose performance was the poorest,
found only 55 % of sound sources.
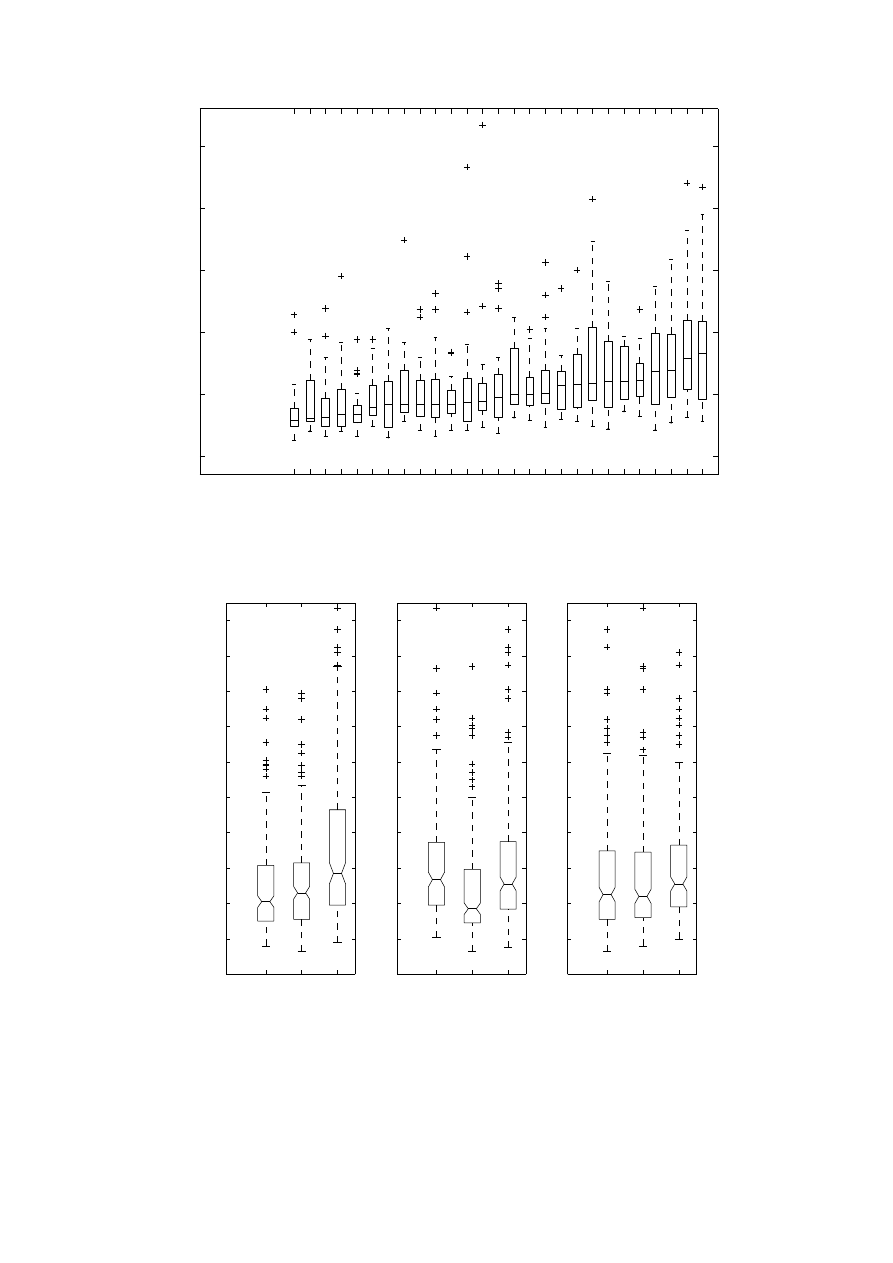
Other collected data was the time spent in each navigation task. The high rate of found cases allows us to analyse spent times
in more detail. In Figs. 2 and 3 the boxplots present the effect of different factors to the time needed to carry out the navigation
task and the failure rate. In these plots as well as in the following analysis the spent times of “not found” cases are excluded,
because these cases do not give a reliable time of the completed task.
Typically the analysis of variance (ANOVA) model is used. However, in this case the collected data was not normally distributed
and hence it does not fulfil the assumptions of ANOVA model. Fortunately, there exist nonparametric tests in which the
requirement of normal distribution of the data is not needed. In fact these nonparametric tests are especially appropriate when
the measurement of the dependent variable is ordinal. This applies in our case since the spent times can be ordered.
The first applied nonparametric test was Kruskal-Wallis test. The Kruskal-Wallis test showed that in each variable group at
least one variable has a statistically significant differences in distribution location, in other words the median of spent times of
one variable differs from other medians. The obtained results were for stimulus
@BA
= 43.094, p = 0.000, for panning method
@BA
= 43.932, p = 0.000, and for acoustical environment
@BA
= 8.227, p = 0.016.
With nonparametric tests it is considered advisable to check validity of results by another test method. Thus we also conducted
the Friedman test, which is a nonparametric test that compares three or more paired groups. The test gave similar results that
Kruskal-Wallis test. The results were for stimulus
@BA
= 71.003, p = 0.000, for panning method
@BA
= 46.703, p = 0.000, and for
acoustical environment
@
A
= 16.867, p = 0.000.
To find out which variables have statistically significant differencies in median times, the Wilcoxon Signed Ranks Test was
done (see Table 3). The Wilcoxon test analyzes the differences between the paired measurements for each subject.
Stimulus: Figure 3 and Table 2 show that pink noise was clearly the best stimulus (also statistically significant difference,
see Table 3). Pink noise gave the minimum number of errors and was fastest, and it has also found to be easiest in subjective
judgements. Guitar sound gave worst results, which was also the subjective opinion of the subjects.
Panning Methods: It is quite clearly shown that ITD alone is inferior for auditory navigation, because almost 30% of these
cases were not found. The best panning method was cardioid panning which gave clearly fastest results. The difference to the
two other methods is statistically significant (see Table 3). Surprisingly, in terms of median times ITD and ITD+HRTFs were
not statistically very different, although the error rate is much smaller with ITD+HRTFs (see Table 2).
Acoustic environment: Reverberation increased both the spent times and the error rate, which is an expected result. Direct
1
2
3
4
5
6
7
8
9 10 11 12 13 14 15 16 17 18 19 20 21 22 23 24 25 26 27
0
50
100
150
200
250
All 27 tests in ascending order of median time (27 subjects)
Time in seconds
29 31 31 34 34 39 42 42 42 42 42 43 44 48 50 50 51 57 58 59 60 60 62 69 70 79 83
Errors n/27
Median time
Stimulus
Panning
Acoustic
Environment
3
5
0
1
0
2
1
1
1
0
4
0
1
5
4
0
2 10 8
8
3 11 13 3 11 7
3
flute HRTF
guitar CARD refl REV
noise ITD refl REV
flute HRTF refl
noise ITD
guitar CARD refl
guitar ITD
noise HRTF refl REV
flute ITD refl REV
guitar CARD
noise HRTF refl
guitar ITD refl
flute CARD
guitar HRTF refl REV
flute CARD refl
guitar HRTF
noise ITD refl
guitar ITD refl REV
noise CARD
flute ITD refl
noise CARD refl
flute HRTF refl REV
guitar HRTF refl
noise CARD refl REV
flute ITD
noise HRTF
flute CARD refl REV
Figure 2: The spent times of all the navigation tasks. The boxplot depicts the median and the 25%/75% percentiles. In the
bottom of the figure the median times (not found cases excluded) and the number of not found cases are printed.
1
2
3
0
20
40
60
80
100
120
140
160
180
200
Stimulus
Time in seconds
Columns:
1. NOISE
2. FLUTE
3. GUITAR
41
46
57
62
63
93
30
31
39
1
2
3
0
20
40
60
80
100
120
140
160
180
200
Panning
Columns:
1. ITD
2. ITD+CARD
3. ITD+HRTF
54
37
51
75
59
75
39
29
37
1
2
3
0
20
40
60
80
100
120
140
160
180
200
Acoustics
Columns:
1. DIR
2. DIR+REFL
3. DIR+REFL+REV
45
44
51
69
70
73
31
32
38
Figure 3: Spent times in navigation tasks in the function of each tested variable (not found cases excluded). The boxplot depicts
the median and the 25%/75% percentiles. The “+” signs are outliers – the cases with values over 1.5 times the box length for
the upper edge of the box.
−2
−1.5
−1
−0.5
0
0.5
1
1.5
2
2.5
3
x 10
4
−2
−1.5
−1
−0.5
0
0.5
1
1.5
2
2.5
3
x 10
4
2
Test 9
11
4
15
7
24
22
19
3
6
21
9
13
27
14
18
25
16
23
20
8
12
5
26
10
17
1
SP
Panning: ITD
Environment: 6 refl., rev.
Stimulus: flute
TA
−2
−1.5
−1
−0.5
0
0.5
1
1.5
2
2.5
3
x 10
4
−2
−1.5
−1
−0.5
0
0.5
1
1.5
2
2.5
3
x 10
4
Test 19
21
2
4
3
5
20
6
18
24
14
13
15
22
1
7
17
27
11
19
12
23
10
25
16
9
8
26
SP
Environment: no refl., no rev.
Stimulus: noise
Panning: ITD + Cardioid
TA
−2
−1.5
−1
−0.5
0
0.5
1
1.5
2
2.5
3
x 10
4
−2
−1.5
−1
−0.5
0
0.5
1
1.5
2
2.5
3
x 10
4
1
4
Test 25
24
20
17
6
10
8
12
25
2
22
18
16
13
15
23
9
3
27
11
5
14
26
19
21
7
TA
Environment: no refl. no rev.
Panning: ITD
Stimulus: flute
SP
−2
−1.5
−1
−0.5
0
0.5
1
1.5
2
2.5
3
x 10
4
−2
−1.5
−1
−0.5
0
0.5
1
1.5
2
2.5
3
x 10
4
Test 21
19
11
3
17
7
26
1
21
14
6
2
15
24
27
5
13
25
12
9
22
10
18
20
16
23
4
8
TA
Environment: 6 refl., no rev.
Stimulus: noise
Panning: ITD + Cardioid
SP
−2
−1.5
−1
−0.5
0
0.5
1
1.5
2
2.5
3
x 10
4
−2
−1.5
−1
−0.5
0
0.5
1
1.5
2
2.5
3
x 10
4
Test 20
4
2
11
21
22
1
7
9
12
15
10
14
27
20
6
16
3
18
25
5
13
8
23
26
17
24
19
TA
Environment: 6 refl., no rev.
Panning: ITD
Stimulus: flute
SP
−2
−1.5
−1
−0.5
0
0.5
1
1.5
2
2.5
3
x 10
4
−2
−1.5
−1
−0.5
0
0.5
1
1.5
2
2.5
3
x 10
4
Test 26
21
10
25
15
9
18
22
17
20
5
6
19
8
1
26
4
7
14
23
3
12
13
11
16
24
27
2
SP
Environment: no refl., no rev.
Panning: ITD + HRTF
Stimulus: noise
TA
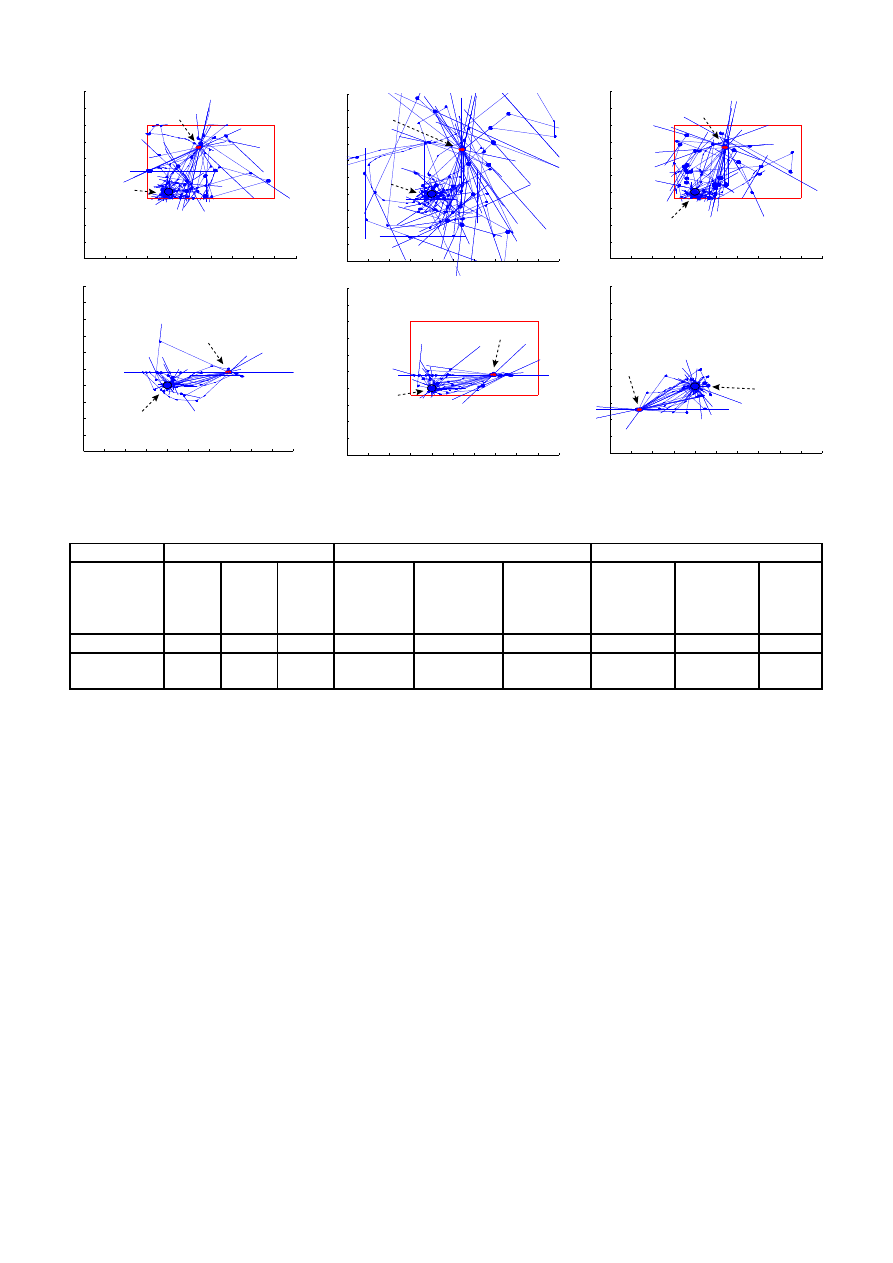
Figure 4: All paths (27 subjects) of six different navigation tasks. Boxes indicates cases where at least the early reflections
were rendered. Abbreviation SP marks the starting point and TA the target area.
Stimulus
Panning method
Acoustic environments
noise
flute
noise
ITD+Card
ITD+Card
ITD+HRTF
dir+refl
dir
dir
C
C
C
C
C
C
C
C
C
guitar
guitar
flute
ITD
ITD+HRTF
ITD
dir+
dir+
dir+refl
refl+reverb
refl+reverb
Z
-8.408
-5.494
-2.634
-6.237
-5.579
-0.389
-2.704
-2.497
-0.250
Asymp. Sig.
(2-tailed)
0.000
0.000
0.008
0.000
0.000
0.697
0.007
0.013
0.802
Table 3: The results of the Wilcoxon Signed Ranks Test. All Z values are based on positive ranks.
and direct+reflections gave almost equal results both in the time spent and in the error rate.
Figure 4 shows all paths (27 subjects) for six different navigation tasks. The upper row displays the test cases with most errors
(11 to 13 errors). In all these the stimulus was flute and the panning method ITD only. Due to the sine-wave like nature of the
flute sound the ITD can be very confusing panning method. The subjects had problems to find correct direction to target area.
The three lower figures display three navigation tasks with no errors. In these cases the right direction to target area is found
very well. (It is easy to see, that there have been few front-back confusions and some subjects have first headed away from the
target area.) These tasks have also been completed much faster than three tasks with most errors (mean of median times 37 s.
vs. 64 s.).
DISCUSSION
The noise stimulus was a continuous noise, which means that early reflections and late reverberation should not affect to sound.
However, each early reflection makes comb filter effect to noise and a comb filter effect is perceived as a certain pitch (so called
repetition pitch [4]). In dynamic situation, as in this case, these perceived repetition pitches descend when moving towards to
a sound source and this is clearly audible and helps a lot in navigation.
The results proved that dynamic early reflections did not help in these navigation tasks. However, dynamic early reflections are
considered as helping cues in externalization [3]. In these navigation tasks the perception of auditory space was not a measured
variable.
In our experiment the user interface is quite limited. The subjects could only turn their head or move forward and backward.

These restricted movements enforced subjects to behave in same manner. First they panorated sound source in middle of the
head and
D
then moved forward or backward. That limited movement control might have affected the results of panning methods.
The cardioid panning method gives the best front-back separation although the externalization is not as good as with HRTFs.
A possible explanation is that the employed artificial head HRTFs were not suitable for all the test subjects.
The pairwise results in Fig. 3 were statistically significant. Unfortunately, with nonparametric tests the interactions between
variables cannot be examined. Therefore we couldn’t statistically verify that flute and ITD only combination is not suitable for
auditory navigation (See Fig. 4) although by examining the error rate (see Fig. 2) this seems to be the case.
There was a quite large variation in spent times between the test subjects. To our surprise spent times didn’t correlate (
E4FHG
!#JI
) with number of errors made by each subject. One explanation might be the way the test subjects did the tasks. The
“careful” subjects tried to locate each target as well as possible without caring how much time they spent. The “impulsive”
subjects tried to find the target in some limited time and then forwarded to the next test.
CONCLUSION AND FUTURE WORK
The results of our experiment showed that navigation is possible with the auditory cues. The 27 subjects completed the 27
navigation tasks (all variable combinations). The results, which were also statistically validated, proved that noise is the
best stimulus, reverberation complicates the navigation and simple models of spatial hearing give enough cues for auditory
navigation.
In the future more listening tests and new tests with other variables should be conducted to get more data for statistical analysis
(e.g. ANOVA). Then also the analysis of interactions between two or more statistical variables will be possible. The use of
auditory navigation in virtual environments requires testing of true 3D navigation tasks. Methods for more flexible navigation
control (such as joystick) should also be tested.
REFERENCES
1
Allen, J. B., and Berkley, D. A. Image method for efficiently simulating small-room acoustics. J. Acoust. Soc. Am. 65, 4
(1979), 943–950.
2
Begault, D. 3-D Sound for Virtual Reality and Multimedia. Academic Press, Cambridge, MA, 1994.
3
Begault, D., Wenzel, E., Lee, A., and Anderson, M. Direct comparison of the impact of head tracking, reverberation,
and individualized head-related transfer functions on the spatial perception of a virtual speech source. In the 108th Audio
Engineering Society (AES) Convention, preprint no. 5134 (Paris, France, Feb. 19-22 2000).
4
Houtsma, A. J. Pitch perception. In Hearing, B. C. Moore, Ed. Academic Press, 1995, ch. 8.
5
Huopaniemi, J. Virtual acoustics and 3-D sound in multimedia signal processing. PhD thesis, Helsinki University of
Technology, Laboratory of Acoustics and Audio Signal Processing, report 53, 1999.
6
Loomis, J., Golledge, R., and Klatzky, R. Navigation system for the blind: Auditory display modes and guidance. Presence:
Teleoperators and Virtual Environments 7, 2 (Apr 1998), 193–203.
7
Riederer, K. Repeatability analysis of hrtf measurements. In the 105th Audio Engineering Society (AES) Convention,
preprint no. 4846 (San Francisco, USA, Sept. 26-29 1998).
8
Rutherford, P. Virtual acoustic technology: Its role in the development of an auditory navigation beacon for building
evacuation. In Proc. 4th UK Virtual Reality SIG Conference (London, UK, 1997), R. Bowden, Ed., Brunel University.
9
Savioja, L., Huopaniemi, J., Lokki, T., and V¨a¨an¨anen, R. Creating interactive virtual acoustic environments. J. Audio Eng.
Soc. 47, 9 (Sept. 1999), 675–705.
10 Takala, T., and Hahn, J. Sound rendering. Computer Graphics SIGGRAPH’92, 26 (1992), 211–220.
11 V¨alim¨aki, V.
Discrete-Time Modeling of Acoustic Tubes Using Fractional Delay Filters.
Doctoral thesis, Helsinki
University of Technology, Lab. of Acoustics and Audio Signal Processing, Report 37, 1995.
Available at
http://www.acoustics.hut.fi/
K
vpv/publications/vesa phd.html.
Wyszukiwarka
Podobne podstrony:
Case Study of Industrial Espionage Through Social Engineering
tools of the mind a case study of implementing the Vygotskian
case study of dyslexic person
A case study of Public Places
The Study of Solomonic Magic in English
IMPORTANCE OF EARLY ENERGY IN ROOM ACOUSTICS
Maffra, Gattass Propagation of Sound in Two Dimensional Virtual Acoustic Environments
Reviews and Practice of College Students Regarding Access to Scientific Knowledge A Case Study in Tw
Code Red a case study on the spread and victims of an Internet worm
Simulation of a Campus Backbone Network, a case study
Production of benzaldehyde, a case study in a possible industrial application of phase transfer cata
A Behavioral Genetic Study of the Overlap Between Personality and Parenting
Farina Reproduction of auditorium spatial impression with binaural and stereophonic sound systems
17 209 221 Mechanical Study of Sheet Metal Forming Dies Wear
Comparative Study of Blood Lead Levels in Uruguayan
Nukariya; Religion Of The Samurai Study Of Zen Philosophy And Discipline In China And Japan
A Study Of Series Resonant Dc Ac Inverter
Mossbauer study of the retained austenitic phase in
Ćw 4 - Case 1 - Selekcja na podstawie dotychczasowej ścieżki kariery, Case Study - Selekcja na podst
więcej podobnych podstron