
Using Predators to Combat Worms and Viruses:
A Simulation-Based Study
∗
Ajay Gupta, Daniel C. DuVarney
Department of Computer Science
Stony Brook University
Stony Brook, NY 11794
{
ajay,dand
}
@cs.sunysb.edu
Abstract
Large-scale attacks generated by fast-spreading or stealthy
malicious mobile code, such as flash worms and e-mail
viruses, demand new approaches to patch management and
disinfection. Currently popular centralized approaches suf-
fer from distribution bottlenecks which cannot be solved by
merely increasing the number of servers, as the number
of servers required to eliminate all bottlenecks is imprac-
tically large. Recently, predators were proposed as a tech-
nique for eliminating automated mobile malware from com-
puter networks. Predators are benevolent, self-propagating
mobile programs which have the ability to clean up systems
infected by malignant worms/viruses. We propose a num-
ber of extensions to the original predator model, includ-
ing immunizing predators, persistent predators, and seeking
predators. We report on a set of simulations which explore
the effects of predators on small-scale (800 to 1600 node)
networks. Our results indicate that predators hold signifi-
cant promise as an alternative to the centralized patch dis-
tribution mechanism. The results show that predators can
be used to disinfect systems and distribute patches rapidly
across the network, without suffering from bottlenecks or
causing network congestion. The results also show that the
new predator models provide significant benefits over the
original predator model. The simulation tool is also useful
for tuning predator behavior, so that an optimal tradeoff be-
tween the peak virus/worm infection rate and the overhead
generated by the predator can be chosen before a preda-
tor is released.
1. Introduction
Improving the defensive capabilities of computer net-
works from self-propagating attacks, such as worms and
e-mail viruses, is an urgent problem [4, 7, 6, 10, 8]. The
rate at which these types of attacks spread across networks
∗
This research is supported in part by an ONR grant N000140110967.
has been steadily increasing, to the point where some re-
cent worms, such as the Blaster worm [9], SoBig [12], Sir-
cam [5] and Code Red [11, 26, 32], have infected hundreds
of thousands of computers within a matter of a few hours.
The phenomenal propagation rates of these new worms
make a rapid response to self-propagating attacks critical.
The reaction to a self-propagating attack can be viewed
as a two phase process. In the first phase, the attack is
detected, the vulnerability exploited by the attack is diag-
nosed, and a patch is developed. If the vulnerability is novel
(i.e., it was previously unknown), then a temporary patch
which disables the service targeted may be employed in or-
der to provide a timely response. Approaches such as auto-
matic patch generation [25] have the potential for quickly
generating patches, and other approaches, such as address
space randomization [2, 14], can slow down the propaga-
tion rate of attacks that exploit memory errors and cause
failed attacks to become conspicuous, making early detec-
tion more likely and buying time for a patch to be devel-
oped. These developments lend credence to the hope that,
in many cases, patches will be available before a worm has
penetrated much of the network.
In the second phase, malware installed by the worm must
be removed and the patch must be applied to all vulnerable
machines on the network. In this paper, we address the is-
sues involved in this latter phase.
Current approaches to patch distribution are primarily
centralized, and hence suffer from bottlenecks at the server
end. Both the server/push approach, in which servers broad-
cast patches to client machines, and the client/pull ap-
proach, in which clients download the patch from a server,
suffer from bottlenecks due to centralization. Consider a
typical patch of the size of 10Mb to be installed on 10 mil-
lion machines in an hour, which would require a net band-
width of 200 Gb/s. While these bottlenecks could poten-
tially be relieved by caching patches across the network,
such an approach is a complex solution which requires
many additional machines, and furthermore, only reduces

the distribution time by a linear amount of time, i.e., the
patch distribution time is essentially
O(N/k), where N is
the number of clients and
k is the number of server/cache
machines. Additionally, any centralized approach is vulner-
able to a denial-of-service attack which could be launched
by an attacker in order to delay patch distribution.
Recently, Toyozumi and Kara proposed the use of preda-
tors [28] as a defensive mechanism to protect networks from
worms and viruses. Predators are benevolent mobile pro-
grams that replicate and migrate from machine to machine
across a network, in a manner similar to a virus or worm,
disinfecting and immunizing each visited machine.Since
predators spread across the network in a tree-like fashion,
the patch time will be
O(log
k
N ), where N is the number
of clients, and
k is the fan-out factor of the predator.
Furthermore, predators have the potential of containing
the spread of a virus/worm before a patch is available, by
continually disinfecting machines until a stable infection
rate is reached. Our results show that, with proper preda-
tor design, the stable infection rate can usually be kept to
a small percentage of machines without excessive band-
width consumption. This would serve as a useful stopgap
measure for containment of worms/viruses until a patch be-
comes available. The patch could then be distributed by tra-
ditional means or by a second predator.
One issue involving the use of predators is whether or
not the predator exploits the existing vulnerability in order
to gain access to the system. In the original work on preda-
tors [28, 20, 17], this has been suggested as a technique. In-
truding into the systems of others without authorization is
not legal, and it seems likely that for predators to become
a practical technique, they should rely upon OS infrastruc-
ture rather than attempt to exploit vulnerabilities to enter
systems. More discussion on this topic is in Section 6.
One of the problems that will be faced in downloading
any mobile code using either predators propagation, server-
push or client-pull technologies is that of authentication of
the server and establishing a trusted source. The problem of
source authentication is only compounded in the case of a
predator, since it is an arbitrary, self-propagating code. The
problem can be solved if the vendor supplying the predator
signs the code, which can be verified by the recipient. In our
work, we have mainly concentrated on studying the effects
of a predator once it is accepted by a user machine, and how
it could patch and cleanup a network.
The base assumptions underlying our work are as fol-
lows. There is a network which is fully connected (any ma-
chine can connect to any other machine), there is a consen-
sus to allow predators on the network, and patches can be
made available before worms/viruses have penetrated the
entire network. Given these assumptions, our work builds
on the results of [28] in several ways.
First, in [28], the behavior of predators is predicted us-
ing equations from epidemiology [19]. We have developed
a discrete simulation tool which simulates the behavior of
predators and viruses on small scale (1600 node) networks.
We report on the simulation results and closely they match
the results predicted in [28].
Second, an important issue is the amount of network traf-
fic generated by the predator. The simulations show that it is
possible to design predators so that worms and viruses are
eliminated without clogging the network.
Third, the simulation tool is valuable as a design tool for
predators, as it allows the predator’s behavior to be tuned
so that the predator is effective without overloading the
network. If predators are to become a practical technique,
then tools will be required which allow predator behavior to
be confidently predicted before the predator is actually re-
leased. We report on the design and implementation of our
tool, which is a first step in this direction.
Finally, in [28], in order to conform with biological mod-
els, a predator immediately dies when it propagates to an
uninfected host. In this paper, we extend the original preda-
tor model in three different directions:
• We propose persistent predators, which improve the
original predator model by introducing a delay before
the predator dies.
• We propose immunizing predators, which have the
ability to install patches as well as disinfect machines.
• We propose seeking predators, which have the ability
to follow the same path as the virus from an infected
machine. This type of predator model is applicable in
particular to e-mail viruses, where it may be possible
to automatically inspect the mail server log and deter-
mine where viruses were sent to and came from.
Our simulations show that the above three predator mod-
els are more effective at combating automated attacks with-
out overloading the network.
The rest of this paper is organized as follows. In Sec-
tion 2, the simulation design, including the predator and
virus models, is presented. Section 3 describes the exper-
iments that were performed and the experimental results.
Section 4 discusses the implication of the experimental re-
sults on the design of predators. Section 5 summarizes re-
lated work, and Section 6 discusses broader issues involv-
ing the use of predators. Section 7 summarizes our results.
2. Simulation Design
In order to study the propagation of malicious mo-
bile code through a network, we developed a single
machine simulation testbed where the application of preda-
tors against different types of self-propagating malware
could be studied. The main advantages of such an ap-
proach over using a real network are ease of configura-
tion and low testbed cost. The obvious disadvantage is that

the simulation must be carefully designed in order to accu-
rately model real-world behavior.
The overall simulation works as follows. The network
consists of a fixed set of fully interconnected nodes (any
routers that may connect nodes are ignored). Each node has
a single e-mail queue and a single user, modeled as a Pois-
son process, who randomly sends an e-mail (once every 5
minutes on average) or reads all queued e-mails (once every
10 minutes on average). When not performing e-mail func-
tions, users are in an idle state. The e-mail queue length dur-
ing the simulation is unbounded, although queues which ex-
ceed a length of 500 trigger an alert that the e-mail server is
overloaded. During the simulations reported on in this pa-
per, no overloading occurred.
At the start of the simulation, all e-mail queues are
empty. After the e-mail queues stabilize (which occurs af-
ter about 25 minutes of simulated time), a virus-carrying
e-mail is introduced into the system. The virus is allowed to
propagate until a threshold of infected systems is reached.
Once the infection threshold is reached, the predator is in-
troduced to the network. The threshold was varied in order
to explore the effectiveness of predators at disinfecting net-
works in different levels of virus infection. The simulation
then runs until some termination criteria is satisfied (e.g.,
less than
1% of the network is infected).
The simulation uses discrete time, where each cycle of
simulation was chosen to correspond to roughly 0.2 sec-
onds. This is a rather arbitrary number — our main concern
in this context was to choose a small enough granularity so
that the results would be essentially the same as with a sim-
ulation based on real time.
The simulation relies on abstract models of predator
and worm/virus behavior, which are based on state transi-
tions [18, 24]. The models encode the behavior of a mo-
bile program on a network as a timed finite state machine.
Model behavior is tuned by a set of parameters.
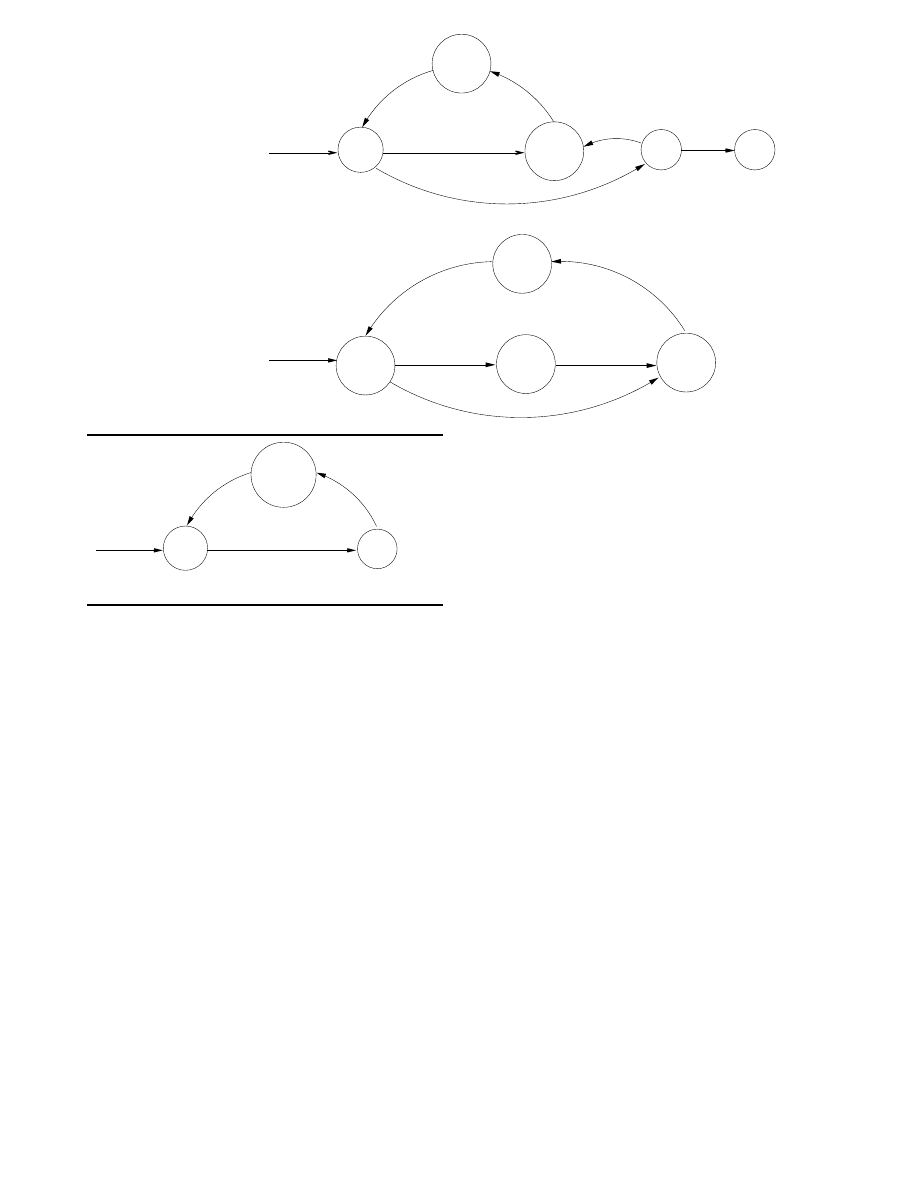
2.1. Predator Models
Two basic predator models were employed. The first
model, depicted in Figure 1(a), is essentially the same as
the model used in [28]. The second model, depicted in
Figure 1(b), is an extension which can not only destroy a
worm, but can also deliver patches to an infected machine,
thereby immunizing the machine from future recurrences of
the same attack.
The purpose of the non-immunizing predator is to com-
bat a worm or virus for which no patch is yet available. The
non-immunizing predator has the capability to disinfect ma-
chines, but not to immunize them from future attacks. In
order to prevent the predator from flooding the network,
the non-immunizing predator is prevented from propagat-
ing unless it finds a copy of the virus. When the predator
propagates to a machine which is not infected by the virus,
it waits for some time for the machine to be attacked. If no
worm or virus attempts to propagate to the machine dur-
ing the waiting period, the predator dies.
When the immunizing predator (Figure 1(b)) propagates
to a new machine, it disinfects the machine if necessary, and
then immunizes the machine by applying a security patch
regardless of whether or not the machine has ever been in-
fected. The predator then propagates to other machines in
the network.
The model states in Figure 1 represent specific phases of
the predator’s behavior:
• Initial state: The predator has just arrived on a machine
in the network. The first event that occurs during the
initial state is a delay which simulates the transmission
and execution time required by the predator. Once the
delay is finished, then the predator checks to see if a
virus/worm is present on the machine. If a virus is de-
tected, the predator moves to the disinfection state. If
no virus is present, then the behavior is dependent on
the type of predator: a non-immunizing predator en-
ters the waiting state, while an immunizing predator
enters the immunization phrase.
• Waiting state (non-immunizing predator only): The
predator waits for the machine to become infected. If
the predator’s time-to-live clock expires before any in-
fection attempt occurs, the predator dies (i.e., it is de-
activated and deleted). If the machine is infected by
the virus, then the predator proceeds to the disinfec-
tion state.
• Disinfection state: The predator removes any malware,
backdoors, virus copies etc. installed on the machine.
The next state is either the immunization state (in the
case of an immunizing predator), or the replication
state (in the case of a non-immunizing predator).
• Immunization state (immunizing predator only): The
predator immunizes the machine, by installing rele-
vant security patches. The predator then proceeds to
the replication state.
• Replication state: The predator generates a number of
copies of itself, and sends itself out as an attachment
in an email to various users on the network. The num-
ber of users are randomly generated, and are generally
more than the fan-out of the virus.
2.1.1. Predator Model Parameters In addition to the
predator behavioral state transition system, stochas-
tic and temporal aspects of predator behavior are deter-
mined by a set of parameters. The parameters are fixed
prior to the start of the simulation and apply to all preda-
tors. The most important parameters are:
• Fanout. The fanout determines how many copies of
a self-propagating program are made each time it
(a)
Initial
Injection
INIT
Propagate
DISINFECT
Virus Arrives
Generate
Target List
of Hosts
REPLICATE
Find Virus
No Virus
No Virus
WAIT
DIE
(b)
Find Virus
No Virus
Initial
Injection
INIT
Generate
Target List
of Hosts
Propagate
REPLICATE
DISINFECT
Fix Vulnerability
IMMUNIZE
using Email
Address Book
PROPAGATE
and
INFECT
DORMANT
ACTIVE
Recipient Target List
User Clicks on attachment
containing Virus
Send out Emails
Email containing
Virus Received
Figure 2. Virus model.
reaches a new node. The fanout parameters are up-
per and lower bounds, and the fanout for each
propagation is chosen randomly (using a uniform dis-
tribution) between the bounds.
• Propagation Time. The delay between the time a
predator is sent to a new node and the time at which
it is activated. This delay is currently the same for all
predator propagation attempts.
• Time-to-Live. For non-immunizing predators, the
length of time that the predator will wait for a virus to
arrive before terminating.
2.2. Virus Model
The virus model used in the simulations appears in Fig-
ure 2.2. The virus model has three basic states:
• Dormant. The virus is enqueued in the e-mail queue
for some node, waiting for the user to activate the
virus. The next time the user reads e-mail, the virus
will be activated and enter the active state.
• Active. The virus accesses the users e-mail history,
and randomly chooses some nodes from the history as
propagation targets. The number of targets chosen is
based on the fan-out of the virus, which is one of the
simulation parameters (4 in most of the simulations).
• Infect and Propagate. For each selected target user, a
copy of the virus is placed in the users e-mail queue.
Each of these new virus copies is initially in the dor-
mant state. The original virus then dies.
2.2.1. Virus Model Parameters Just like predators, the
behavior of viruses is tuned by a set of parameters which de-
termine the temporal and stochastic aspects. The most im-
portant of these are:
• Fanout. The fanout is expressed as a uniform distribu-
tion with an upper and lower bound.
• Incubation Time. The delay between the time a user
reads an e-mail containing a virus, and the time the
virus becomes active. This delay is also expressed as
upper and lower bounds, with the actual incubation
time being chosen uniformly randomly between these
two values for each virus attack attempt.
These parameters are sufficient to model both flash and
stealth viruses. Stealth viruses can be modeled by using a
very long incubation period, so that at any given time in-
stant, most of these viruses are in a dormant state, plus keep-
ing the fanout low, so that the percentage of virus-carrying
e-mails is kept very low. Flash viruses are characterized by
a high fanout and a short incubation time [27, 30].

2.3. Simulation Testbed
The simulator was implemented in Java. With 400
clients, about 800 frequency distributions were main-
tained, each over 8 time scales. Due to these struc-
tures, the total memory use of the Java program was
30MB. When run on a Intel Pentium III system oper-
ating at 1GHz running RedHat Linux 9.0, Java2 SDK
1.4, it was able to simulate about 500 cycles per sec-
ond, i.e., simulate 100 seconds per one second of real
time.
3. Experimentation
Our experiments fall into three categories. The first batch
of experiments were designed to compare the behavior of
the simulator results with the models presented in [28]. The
second batch of experiments were designed to test the clas-
sic predator model and the effect of various improvements
on the model, such as immunization. The effects of vary-
ing some parameters, such as the predator fanout and time-
to-live parameter, was also studied. The third set of exper-
iments were done to explore the effectiveness of predators
against rapidly-spreading worms.
3.1. Simulator vs. Other Models
As pointed out in [28], the interaction between viruses
and predators can be modeled using the Lotka-Volterra
equations from biomathematics. Let
x(t) be the virus popu-
lation and
y(t) be the predator population at any given time
instant
t. Then, the following differential equations model
the virus-predator interactions:
dx(t)
dt
= r · x(t) − a · x(t) · y(t)
dy(t)
dt
= b · x(t) · y(t)
(x(0), y(0)) = (x
0
, y
0
)
where
x
0
is the initial number of viruses,
y
0
is the initial
number of predators,
r is the viral multiplication rate, a is
the predatory rate and
b is the predator multiplication rate.
The equations have no analytical solution, but are instead
approximated numerically. Figure 3.1 shows the result of
an orbit generated by a single run of the simulator with a
virus fanout of 4 and a predator fanout between 0 and 8,
compared with the results predicted by the Lotka-Volterra
equations with
r = 1.3, a = 0.015 and b = 0.015. In
both simulator and the Lotka-Volterra system,
x
0
= 200
and
y
0
= 1. The results show that the simulator behaves as
a Lotka-Volterra system.
3.2. Predator Effectiveness
In our experiments, we simulated four types of predator:
0
100
200
300
400
500
600
0
100
200
300
400
500
600
700
800
Virus Space
Predator Space
An orbit in Virus-Predator space
f(x)
Predator launched at 200/800
Figure 3. Lotka-Volterra orbit f(x) compared
with simulation results.
• Classic predator. This predator can only disinfect, not
immunize, and dies immediately when it propagates to
an uninfected system.
• Persistent predator. This predator is similar to the clas-
sic model, the only difference being that it doesn’t die
immediately when an uninfected system is encoun-
tered. Instead, it waits for a fixed amount of time, dur-
ing which it destroys the first incoming virus and prop-
agates, or dies if no virus arrives.
• Immunizing predator. This predator differs from
the previous models in two ways. First, when-
ever it reaches a new system, it renders that system
permanently immune to any future attacks. Sec-
ond, it propagates regardless of whether a virus is
found on the system or not.
• Seeking predator. This predator is an extension of the
immunizing predator, with the ability to inspect e-mail
logs and follow the same path as an incoming or out-
going viruses. This enables the predator to target in-
fected machines rather than propagating randomly.
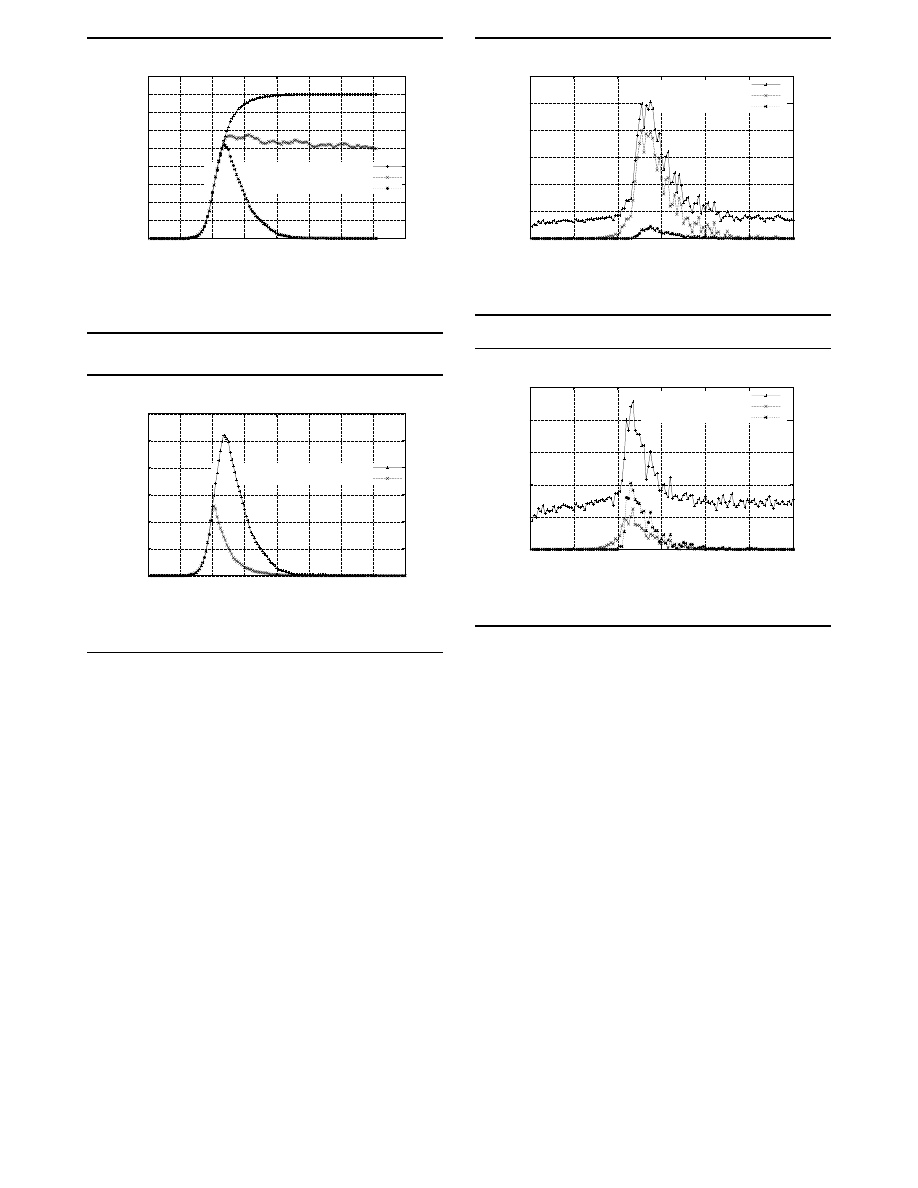
Figure 4 compares the effect of the classic and immu-
nizing predators against an e-mail virus. In these experi-
ments, the network size was 800, virus fanout 4, and preda-
tor fanout 8. In every case, the predator was injected into
the network when the infection rate reached
25%. As the re-
sults show, the immunizing predator is superior to the clas-
sic, and manages to disinfect the network at a rate roughly
the same as the rate at which it was infected. Nevertheless, it
should be pointed out that the classic (and persistent) preda-
tor is still useful for combating a virus or worm for which
no patch is available, or in situations where the use of an im-
munizing predator is not feasible.
Figure 5 shows the effectiveness of increasing the fanout
of the immunizing predator. When the fanout is increased
0
100
200
300
400
500
600
700
800
900
0
20
40
60
80
100
120
140
160
Infected Machines
Time in Hundreds of Seconds
Propagation with Predator (800 Clients)
No Predator
Predator w/o Immunization
Predator w/i Immunization
Figure 4. Predator effect on virus population.
0
100
200
300
400
500
600
0
20
40
60
80
100
120
140
160
Infected Machines
Time in Hundreds of Seconds
Predator with High Fanout (800 Clients)
Predator w/i Fanout = 08
Predator w/i Fanout = 16
Figure 5. Fanout effect on performance.
to this amount, it has the effect of immediately arresting the
spread of the virus and quickly cleaning up the network.
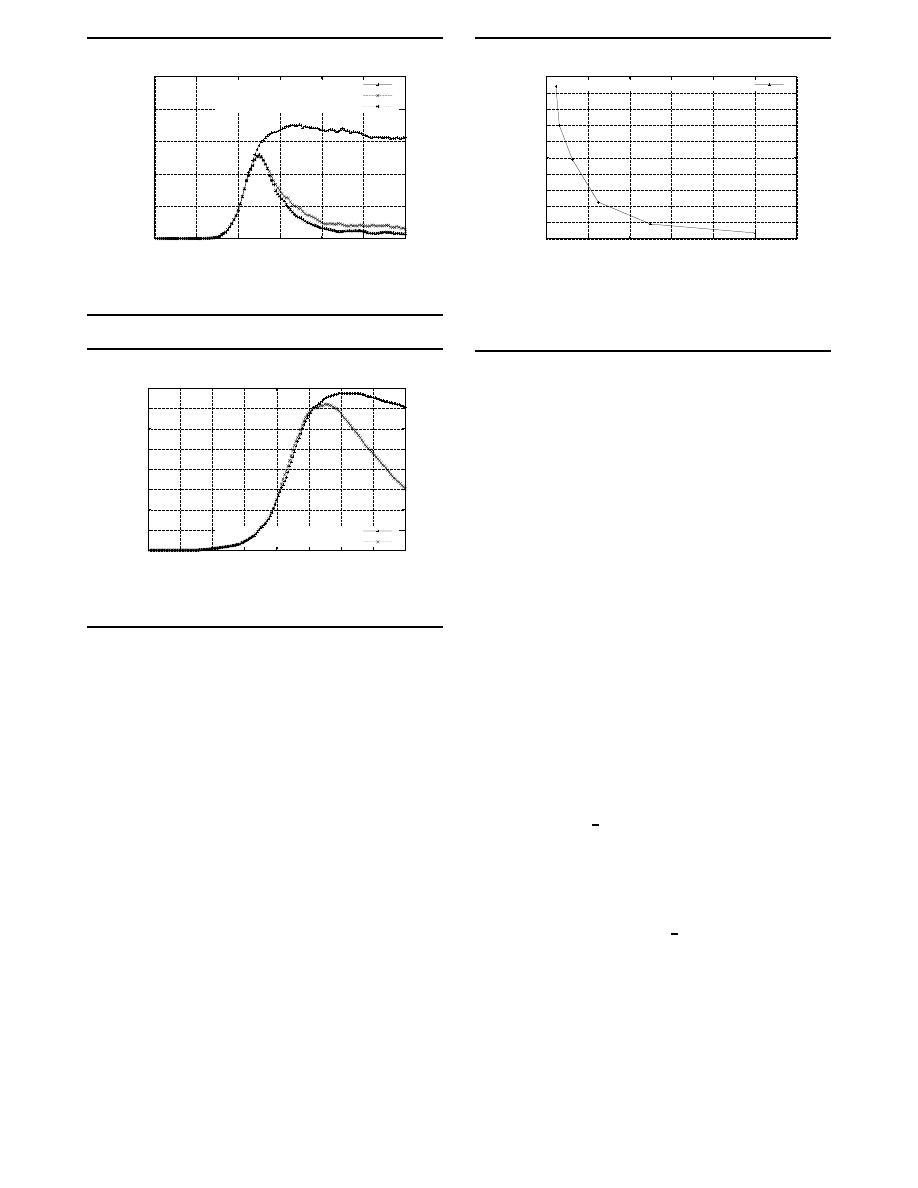
An additional and perhaps surprising benefit of increas-
ing the fanout is that the overall network traffic level is re-
duced. Figure 6 shows observed virus and predator traffic
The normal email traffic before the virus hits the network is
around 8-9 emails/sec. The virus was introduced in the sys-
tem at t=2898 secs, at which point one can clearly see an
exponential increase in total email traffic. The predator is
introduced at around
t = 4100 secs, when 200 out 800 ma-
chines are infected. The predator traffic never increases be-
yond 5 emails/sec. The predator has a fanout of 8, but it
will die in 75% of the cases initially, since only 200 out of
800 machines are infected, and will effectively propagate
with a fanout of only 2. So, effective fanout of the preda-
tor will depend on the percentage of infected machines. By
the time
t = 9000 secs, the virus is completely eradicated.
0
10
20
30
40
50
60
0
2000
4000
6000
8000
10000
12000
Traffic
Time in seconds
Email and Virus Traffic
Total traffic
Virus Traffic
Predator Traffic
Figure 6. Network traffic when fanout=8.
0
5
10
15
20
25
0
2000
4000
6000
8000
10000
12000
Traffic
Time in seconds
Email and Virus Traffic
Total traffic
Virus Traffic
Predator Traffic
Figure 7. Network traffic when fanout=16.
Figure 7 shows the traffic characteristics when the fanout
of the predator is increased to 16, which is 4 times the fanout
of the virus. As in the earlier case, virus was introduced at
t=2898 secs, and the predator was introduced when 25% of
the machines became infected. As the results show, preda-
tor traffic peaks much higher than in Figure 6, though the
total traffic is still much less, due to quick containment of
the virus. By time
t = 7500 secs, the virus has been com-
pletely removed from the system.
The conclusion one can draw from this that the in cases
where the size of the predator is close to the size of the virus,
then increasing the fanout will eradicate the virus while con-
suming less network bandwidth. In cases where the size of
the predator is much larger than the size of the malware
(e.g., a large patch must be installed in order to immunize
each machine), then the overall traffic may increase when
the fanout is set to 16.
Figure 8 illustrates the effectiveness of the persistent
predator. Recall that the persistent predator does not im-
0
200
400
600
800
1000
0
2000
4000
6000
8000
10000
12000
Infected Machines
Time in seconds
Varying Time to Live, Without Immunization
Time to Live = 0secs
Time to Live = 1sec
Time to Live = 1000sec
Figure 8. Persistent predator effectiveness.
0
100
200
300
400
500
600
700
800
0
20
40
60
80
100
120
140
160
Infected Machines
Time in hundred of seconds
Predator follows Virus in an intranet
Predator Independent
Predator Follows Virus
Figure 9. Seeking predator effectiveness.
munize the machine, but is capable of killing the virus as
long as it is present on the machine. When the time-to-live
is zero (the classic predator), we get a stable system, where
virus and predator populations balance out, and the num-
ber of infected machines becomes stable at 600 out of 800,
which is 75% of the whole network. If we increase the time-
to-live to even a small positive value, the stable population
of infected machines drops down to less than 5%. Further-
more, the rate of decrease is close to that observed for the
immunizing predator. Of course, there are still a number of
major drawbacks in comparison to an immunizing preda-
tor, such as the fact that at any point in time a small but sig-
nificant number of machines are infected by the virus, so
that the predator and virus will continue to consume net-
work and processing resources ad infinitum.
Figure 9 illustrates the effectiveness of the seek-
ing predator, which is nearly identical to the immunizing
predator, with the enhancement that it has the ability to per-
form a forensic analysis a determine which hosts the virus
0
200
400
600
800
1000
1200
1400
1600
1800
2000
0
0.2
0.4
0.6
0.8
1
1.2
Cleanup Times in Seconds
Fanout Ratio - Predator/Virus
Cleanup times for varying Predator Fanout
Predator Fanout/Virus Fanout
Figure 11. Clean up time as function of
predator-to-virus fanout.
or worm is likely to have infected and propagate to those
machines first. As Figure 9 shows, the ability to seek sig-
nificantly improves performance.
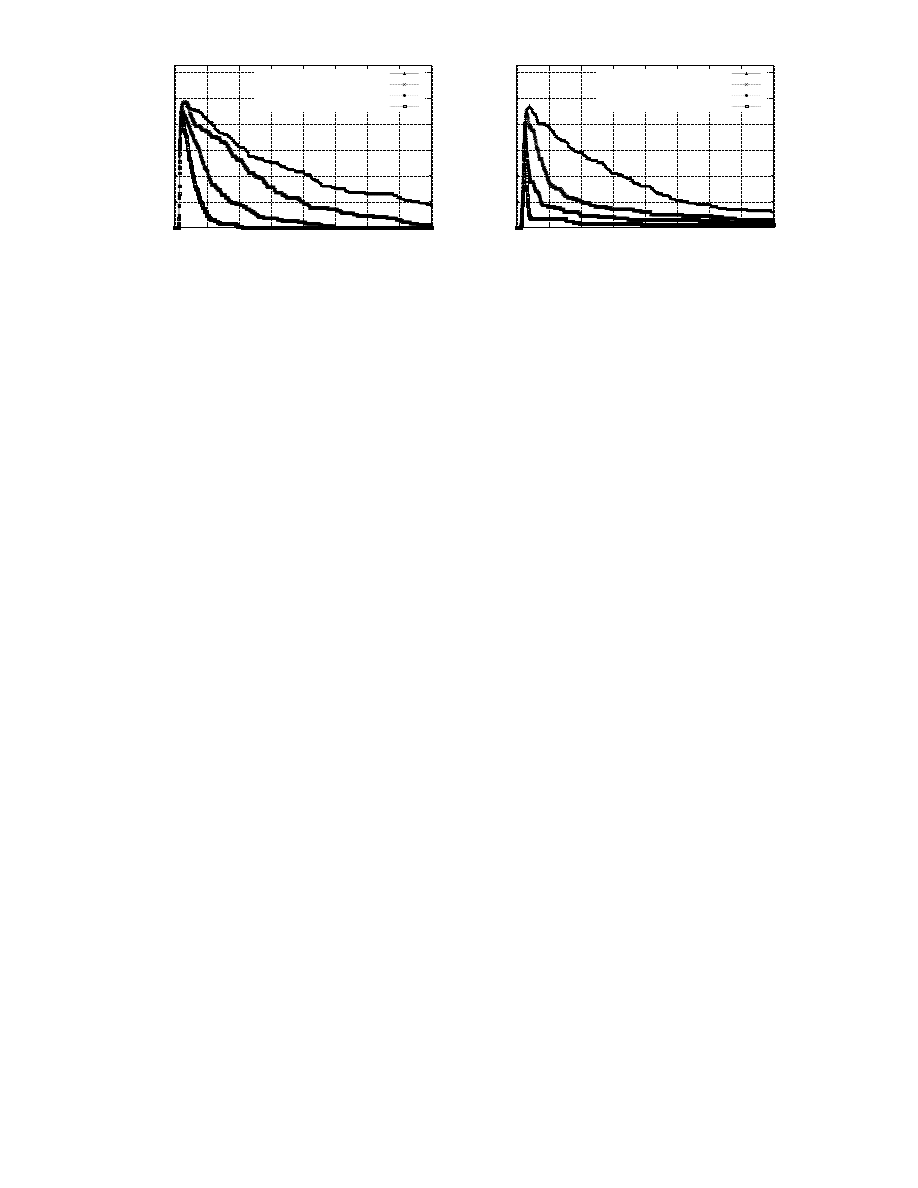
3.3. Rapidly-spreading worms
A third set of experiments were done to explore
the effectiveness of predators against rapidly spread-
ing worms/viruses. Of particular concern is the fanout of
the predator required to quickly eliminate worms from the
network, as the designer of a predator wants to use the mini-
mum amount of fanout required to eliminate the virus/worm
in a reasonable amount of time.
Along these lines, experiments were done to measure
the clean-up times required for varying degrees of preda-
tor and virus fanout. The results of these experiments are
shown in Figure 10. In these experiments, a rapidly spread-
ing virus was introduced simultaneously with the predator
20 seconds into the simulation (the purpose of the delay was
to allow the size of the simulated e-mail queues to stabi-
lize). Note that while this simulation is inspired by flash
worms, no simulation of the network congestion likely to
be caused by a flash worm was done. An additional differ-
ence between this experiment and the earlier ones is that,
in this experiment,
1
8
-th of the machines were vulnerable to
the virus, while in the earlier experiments,
100% of the ma-
chines were vulnerable.
Based on these experiments, the correlation between the
ratio of predator fanout to virus fanout and the clean-up
time was measured. The results, shown in Figure 11, in-
dicate that a predator fanout of
1
2
the virus fanout is suffi-
cient to quickly eliminate viruses from the network under
the simulated conditions. This is an encouraging result, as
as a fanout ratio of less than one means that the amount of
0
20
40
60
80
100
120
0
100
200
300
400
500
600
700
800
Infected Machines
Time in seconds
Virus Fanout = 64, 100/800 (1/8th) Vulnerable Machines
Predator Fanout = 04
Predator Fanout = 08
Predator Fanout = 16
Predator Fanout = 32
0
20
40
60
80
100
120
0
100
200
300
400
500
600
700
800
Infected Machines
Time in seconds
Virus Fanout = 16, 100/800 (1/8th) Vulnerable Machines
Predator Fanout = 02
Predator Fanout = 04
Predator Fanout = 08
Predator Fanout = 16
predator traffic is likely to be less than the virus traffic.
4. Predator Design
When designing a predator, the goal is to minimize the
number of machines which become infected and disinfect
infected machines as quickly as possible, while keeping per-
formance overhead to a minimum, and minimizing the risks
introduced by the predator. To reach these goals, the de-
signer must choose between several competing alternatives.
The first choice is “should the predator be immunizing or
non-immunizing?” A non-immunizing (i.e., non-patching)
predator could be used in cases where no patch is yet avail-
able, the risks involved in patched are judged to be too great,
or a predator-driven application of the patch would cause
too much disruption to ongoing computations.
In these cases, a non-immunizing predator could be used
to reduce the number of infected machines to very low level
until patches are available and/or manually applied to each
machine. A second possibility for dealing with novel attacks
is a two-phase use of predators. In the first phase, a non-
immunizing predator contains the spread of the new attack,
and in the second phase, an immunizing predator patches
all vulnerable systems.
A second choice is whether or not the predator has the
seeking property or not (i.e., whether or not it follows
the path of the virus). This choice is driven primarily by
whether or not the outgoing path of the virus/worm can be
determined, and if so, how much effort is required. While
a seeking predator enjoys a significant performance advan-
tage over a non-seeking one, the extra implementation effort
may not be worthwhile, particularly for non-e-mail worms.
Additional choices include the setting of the predator pa-
rameters, namely the time-to-live and fanout. These involve
tradeoffs between performance overhead and effectiveness,
and are also driven by the properties of the virus.
The fanout value depends primarily on the type of attack.
For slowly propagating worms, a predator fanout equal to
twice the worm/virus fanout was shown to be effective (see
Figure 5), which is acceptable because the virus in used in
those experiments was spreading at a much lower rate, so
that the overall network traffic (shown in Figure 7) remained
reasonably low. For rapidly propagating attacks, a predator
fanout in the range of 1/5 to 1/2 of the attack fanout ap-
pears to be effective (see Figure 10).
The time-to-live value depends on the type of predator.
For immunizing predators, the time-to-live is irrelevant; for
all non-immunizing predators, a large time-to-live is desir-
able, and ideally would be on the order of the time required
for the predator to reach every node on the network, but will
consume resources on each protected machine.
5. Related Work
Work related to ours falls into three essential areas:
Predator-based approaches. The earliest works which
suggest the use of predators are [20, 17]. [28] is the sem-
inal paper which suggests the use of models from mathe-
matical biology to predict the behavior of predators. Our
work extends theirs by extending the range of potential be-
haviors to patch management as well as virus removal, and
using discrete simulations to study predator behavior.
Patch management and distribution techniques. In reac-
tion to the escalating security situation, some operating sys-
tem vendors, such as [23] are attempting to automate the
distribution and application of security patches. The main
difference between these efforts and the predator approach
is that the current OS vendor approaches are largely cen-
tralized, which suffers from distribution bottlenecks that the
predator approach avoids. There has also been investigation
into the use of mobile agents to perform software updates,
such as [1]. The focus of these works has been the develop-
ment of infrastructure, rather than studying the likely effec-
tiveness, which is the main focus of our work.
Worm modeling techniques. There has been one early
[21] and several recent [29, 13, 15, 16] efforts to model
worm behavior. The main difference between these ap-
proaches and ours is that they focus on the spread of the
worm itself (typically modeling cleanup as a simple algo-
rithmic parameter), while this paper focuses on a specific
technique to combat the spread (i.e., predators). [31] em-
ployed simulations to explore the use of quarantines to stop

the spread of worms. [22] used a detailed simulation to
evaluate the effectiveness of worm detection algorithms. [3]
used simulations to compare the ability of various scale-free
network topologies to preserve critical functionality in the
presence of self-propagating attacks.
6. Discussion
While we are encouraged by our results, which we be-
lieve indicate that predators have the potential to be devel-
oped into a practical approach for combating worms and
viruses, there are a number of issues involving the use of
predators which warrant further discussion.
6.1. How the predator gains entry
One issue confronted by a person wishing to release a
predator onto a network is legality. If the predator exploits
the same vulnerability as the virus, as was originally sug-
gested, and not all users on the network have given con-
sent, then the release of the predator is a criminal act in
many countries. There are two solutions one can envision
to this problem. First, there may eventually be some sort
of legal authority which authorizes the release of preda-
tors, perhaps similar to today’s public health agencies which
have the power to quarantine infectious individuals Second,
a predator port infrastructure could support the entry of au-
thorized predators. The first approach has the advantages
that no new infrastructure is required, and no new vulner-
abilities are created, with the drawback being the virus or
worm could potentially close the vulnerability after gain-
ing entry, preventing the predator from removing the virus
or patching the system. The second approach requires sig-
nificant implementation effort, and must be done carefully
to prevent unauthorized access, but has the advantage that,
if implemented well, the malicious code will be unable to
close the predator port, and propagation of the predator will
be easier to control.
6.2. Techniques for secure patch distribution
Distributing code through predators poses security chal-
lenges similar to those faced when mobile code is down-
loaded over a network. In particular, if each system on the
network has an automated predator port enabled, then the
potential exists for an unauthorized predator to subvert ev-
ery system on the network. Hence, ensuring the integrity
and authenticity of predators is essential. Towards these
ends, the following techniques can be used:
Transit Integrity: To verify that the patch was not dam-
aged in transit, a cryptographic hash can be transmitted in
addition to the patch code. The hash value can be locally
verified to ensure that the patch was transmitted correctly.
Digital Certificates. Code-signing certificates can be
used to authenticate the predator.
Centralized authentication. Upon receiving a predator,
the system could query a known centralized server to check
the authenticity of the predator. The size of the authentica-
tion query would hopefully be much smaller than the size
of the patch, thereby avoiding bottleneck issues.
6.3. Some risks with patch management
Software patches implicitly contain vulnerability infor-
mation which may be abused to jeopardize the security of
a system. Malicious users can analyze patches and develop
exploits against unpatched systems. These risks can be mit-
igated by (a) rapidly distributing patches so that all systems
are patched within a small timeframe, and (b) encrypting
patches in ways which prevent reverse engineering.
Unfortunately, neither of these solutions appears to be
feasible at the moment. On the positive side, it should also
be noted that predators can be useful even in cases where
no patching is done by the predator, so that if the risks are
judged to be too high, a non-patching predator could be used
to contain a virus/worm outbreak until a patch could be dis-
tributed though some other distribution channels.
6.4. Simulation Issues
The main weakness of the results presented in this report
is that they are all based on simulation. Real systems often
display behaviors that are more complex and variable than
those exhibited in simulations. In order to truly assess the
effectiveness of the predator approach, it will be necessary
to evaluate it using realistic network traffic.
A second difficulty in extrapolating the simulation re-
sults is that on real systems, network-based application traf-
fic crosses organization boundaries frequently. For exam-
ple, an email virus may propagate from one user to any
other user on the Internet, and not just on the intranet of
the user’s organization. The effects of firewalls, routers and
network topology on predators have not been accounted for.
These issues need to be addressed in future research.
7. Conclusion
The results presented in this paper demonstrate that
predators have the potential to quickly clean-up networks
infected by self-propagating malicious code and also im-
munize networks from future attacks. Predators have a po-
tential for becoming a practical emergency patch distribu-
tion mechanism, when many machines need to be quickly
patched in the face new a worm or virus. Simulation tech-
niques could be used to tune the predator’s behavior prior
to release, so that worms are quickly eliminated while
the only minimum amount of necessary bandwidth is con-
sumed. Predators can potentially provide timely control on
the spread of self-propagating worms, thereby reducing the
monetary losses due to their unchecked spread.

References
[1] L. Bettini, R. D. Nicola, and M. Loreti. Software update
via mobile agent based programming. In Proceedings of the
2002 ACM symposium on Applied computing, pages 32–36.
ACM Press, 2002.
[2] S. Bhatkar, D. C. DuVarney, and R. Sekar. Address obfusca-
tion: an efficient approach to combat a broad range of mem-
ory error exploits. In USENIX Security Symposium, 2003.
[3] L. Briesemeister, P. lincoln, and P. Porras. Epidemic profiles
and defense of scale-free networks. In ACM Workshop on
Rapid Malcode, 2003.
[4] Cert
advisory
ca-1999-04
melissa
macro
virus.
http://www.cert.org/advisories/ca-1999-04.html.
[5] Cert advisory ca-2001-22 w32/sircam malicious code.
http://www.cert.org/advisories/ca-2001-22.html.
[6] Cert
advisory
ca-2001-26
nimda
worm.
http://www.cert.org/advisories/ca-2001-26.html.
[7] Cert
advisory
ca-2003-04
ms-sql
server
worm.
http://www.cert.org/advisories/CA-2003-04.html.
[8] Cert
advisory
ca-2003-04
w32/mydoom.b
virus.
http://www.us-cert.gov/cas/techalerts/TA04-028A.html.
[9] Cert
advisory
ca-2003-20
w32/blaster
worm.
http://www.cert.org/advisories/CA-2003-20.html.
[10] Cert
advisory
ca-2004-04
email-borne
viruses.
http://www.cert.org/advisories/CA-2004-02.html.
[11] Cert.
code
red
ii:
Another
worm
exploiting
buffer
overflow
in
iis
indexing
service
dll.
http://www.cert.org/incident notes/in-2001-09.html.
[12] Cert
incident
note
in-2003-03
w32/sobig.f
worm.
http://www.cert.org/incident notes/IN-2003-03.html.
[13] Z. Chen, L. Gao, and K. Kwait. Modeling the spread of ac-
tive worms. In IEEE Infocom, 2003.
[14] S. Forrest, A. Somayaji, and D. H. Ackley. Building diverse
computer systems. In Workshop on Hot Topics in Operating
Systems, 1997.
[15] S. Gorman, R. Kulkarni, L. Schintler, and R. Stough. A
network based simulation approach to cybersecurity policy.
http://policy.gmu.edu/imp/research.html.
[16] S. P. Gorman, R. G. Kulkarni, L. A. Schintler, and R. R.
Stough. A predator prey approach to the network structure
of cyberspace. In Proceedings of the winter international
synposium on Information and communication technologies,
pages 1–6. Trinity College Dublin, 2004.
[17] R. Grimes. Malicious Code. O’Reilly and Associates, 2001.
[18] A. Gupta and R. Sekar.
An approach for detecting self-
propagating email using anomaly detection. In Recent Ad-
vances in Intrusion Detection, 2003.
[19] J. Jorgensen, P. Rossignol, M. Takikawa, and D. Upper. Cy-
ber ecology: Looking to ecology for insights into informa-
tion assurance. In DARPA Information Suvivability Confer-
ence and Exposition, 2001.
[20] A. Kara. On the use of intrusion technologies to distribute
non-malicious programs to vulnerable computers. Technical
report, University of Aizu, 2001.
[21] J. Kephart and S. White. Directed-graph epidemiological
models of computer viruses. In IEEE Computer Society Sym-
posium on Research in Security and Privacy, pages 343–359,
1991.
[22] M. Liljenstam, D. M. Nicol, V. H. Berk, and R. S. Gray. Sim-
ulating realistic network worm traffic for worm warning sys-
tem design and testing. In Proceedings of the 2003 ACM
workshop on Rapid Malcode, pages 24–33. ACM Press,
2003.
[23] Patch management, security updates, and downloads.
http://www.microsoft.com/technet/default.mspx.
[24] R. Sekar, A. Gupta, J. Frullo, T. Shanbhag, A. Tiwari,
H. Yang, and S. Zhou. Specification-based anomaly detec-
tion: a new approach for detecting network intrusions. In
ACM Computer and Communication Security Conference,
2002.
[25] S. Sidiroglu and A. D. Keromytis.
Countering network
worms through automatch patch generation. Technical Re-
port 029-03, Columbia University Department of Computer
Science, 2003.
[26] S. Staniford. Analysis of spread of july infestation of the
code red worm. http://www.silicondefense.com/cr/july.html.
[27] S. Staniford, V. Paxson, and N. Weaver. How to own the in-
ternet in your spare time. In Usenix Security Symposium,
2002.
[28] H. Toyoizumi and A. Kara. Predators: Good will mobile
codes combat against computer viruses. In New Security
Paradigms Workshop, 2002.
[29] Y. Wang and C. Wang. Modeling the effects of timing pa-
rameters on virus propagation. In ACM Workshop on Rapid
Malcode, 2003.
[30] N. Weaver, V. Paxson, S. Staniford, and R. Cunningham. A
taxonomy of computer worms. In ACM Workshop on Rapid
Malcode, 2003.
[31] C. Zou, L. Gao, W. Gong, and D. Towsley. Monitoring and
early warning for internet worms. In ACM Computer and
Communication Security Conference, 2003.
[32] C. Zou, W. Gong, and D. Towsley. Code red worm propaga-
tion modeling and analysis. In ACM Computer and Commu-
nication Security Conference, 2002.
Wyszukiwarka
Podobne podstrony:
How to Kill Worms and Viruses with Policy Pontifications
PL 7 2 4 3 Lab Using Wireshark to Examine FTP and TFTP Captures (1)
7 2 4 3 Lab Using Wireshark to Examine FTP and TFTP?ptures
National Legal Measures to Combat Racism and Intolerance in the Member States of the Council of Euro
Where have the worms and viruses gone new trends in malware
An Epidemiological View of Worms and Viruses
Using Support Vector Machine to Detect Unknown Computer Viruses
The Case for Using Layered Defenses to Stop Worms
2 Advanced X Sectional Results Using Paths to Post Process
więcej podobnych podstron