M
any technical trading
strategies revolve around
the assumption that mar-
kets will hover within a
given range — and with good rea-
son. Seventy percent of the time
markets will bounce back and forth
between support and resistance lev-
els, or fluctuate randomly. The rest
of the time, market behavior is char-
acterized by persistent price moves
— trends — that shatter support and
resistance levels.
Although these basic probabilities
work against traders who try to
exploit trends, the potential rewards
can be worth the risk. It is possible to
increase your ability to capitalize on
t rends by locating trend signals,
identifying specific entry points
within the trend and using risk man-
agement techniques to limit losses.
The following sections will
explain how a trading system based
on these concepts works especially
well in the foreign exchange (Forex),
or curre n c y, market, particularly
with the “major” currencies — the
U.S. dollar, Euro, Japanese yen,
British
pound,
Swiss
franc,
Canadian dollar and Australian dol-
lar. More than 85 percent of transac-
tions in the $1 trillion per day Forex
market involve the majors.
The strategy uses two charts with differ-
ent time periods (10-minute and hourly),
along with two technical indicators: a
200-bar moving average and a 14-bar
slow stochastic study (see “Stochastic
2
www.activetradermag.com • October 2002 • ACTIVE TRADER
Cashing in on short-term
CURRENCY TRENDS
Trends may be rarer than trading ranges, but that
doesn’t mean they can’t be traded. This strategy
uses two time frames to identify the trend, an
overbought-oversold indicator to pinpoint entry and
a trailing stop to protect gains on profitable trades.
TRADING Strategies
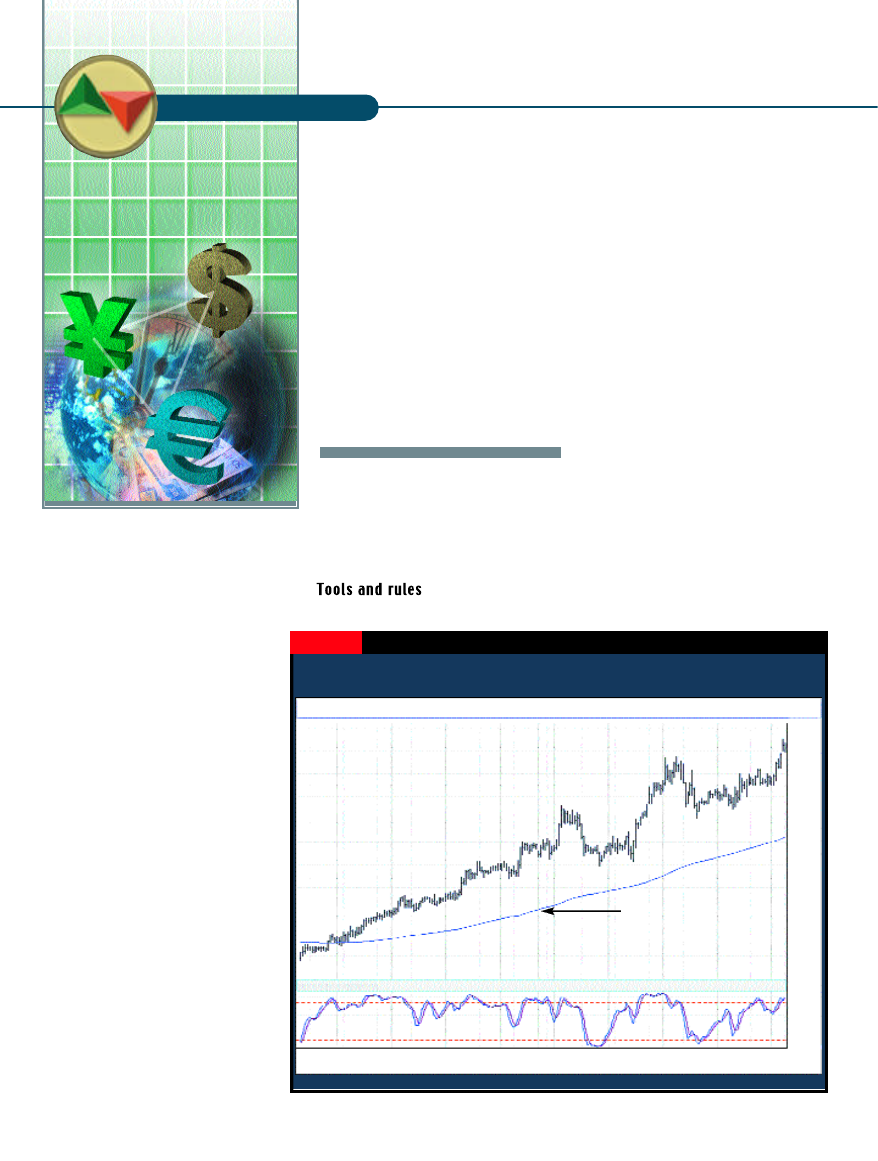
Euro/U.S. Dollar (EUR/USD), hourly
Stochastics (14, 3, 3)
12:00 3:00 18:00 9:00 0:00 15:00 6:00 21:00 12:00 3:00 18:00 9:00 0:00 15:00 6:00
18
19
20
21
23 24
25
26
27
28
1.002
0.996
0.990
0.984
0.978
0.972
0.966
0.960
0.954
0.949
0.942
90
60
30
With price consistently above the 200-bar moving average, the hourly chart reflects
the prevailing uptrend.
FIGURE 1 LONG TRADE, HOURLY TREND
Source: Gain Capital
BY TIMOTHY O’SULLIVAN
200-hour moving average
refresher,” right).
Step 1: Identify a trend. Compare the
moving averages on the 10-minute and
hourly charts. A trend is in effect when
price is consistently above/below the
moving averages on both charts.
Step 2: Pinpoint entry. Once you’ve
identified a trend, look for the following
two conditions at the same time on the
10-minute chart: 1) the market is no
more than 20 points above (to buy) or 20
points below (to sell) the moving aver-
age; and 2) the fast stochastic line cross-
es above the slow stochastic line below
20 (to buy) or crosses below the slow
stochastic line above 80 (to sell).
These conditions indicate: 1) the cur-
rency is currently in a short-term
uptrend or downtrend; and 2) the cur-
rency has paused or pulled back (reflect-
ed by the higher low stochastic reading
and the fact that price is within 20 points
of the moving average) and is poised to
turn (because the fast stochastic line is
crossing back above or below the slow
line).
Step 3: Ride the trend. Set a trailing
stop after the initial trade entry. On a
long position, enter a stop-loss order 10
points below the 200-period moving
average on the 10-minute chart. In the
case of a short position, place the initial
stop 10 points above this moving aver-
age. As the trade goes in your favor, raise
(for a long trade) or lower (for a short
trade) the stop to protect profits. For
simplicity’s sake, the following exam-
ples use a trailing stop 25 points from
each new top or bottom. The charts in
the next section illustrate the application
of this strategy in two currency pairs.
The first example took place in the
E u ro c u r rency-dollar (EUR/USD) cur-
rency pair during the fourth week of
June 2002. (For those unfamiliar with
currency quoting and charting conven-
tions, see “Quoting currencies,” p. xx.)
First, compare the hourly and 10-
minute EUR/USD charts. Look for a
time when price is above the 200-period
moving averages on both charts. On the
hourly chart (Figure 1, opposite page),
the fact that price is almost exclusively
above the 200-hour moving average
indicates a persistent uptrend. On the
10-minute chart (Figure 2, top left), price
moves (and remains above) the moving
continued on p. x
Stochastic refresher
The stochastic oscillator consists of two lines: %K and a moving average of
%K called %D.
The basic stochastic calculation compares the most recent close to the price
range (high of the range - low of the range) over a particular period. A basic
five-bar stochastic calculation is the difference between the most recent bar’s
close and the lowest low of the last five days divided by the difference
between the highest high and the lowest low of the last five days. The result
is multiplied by 100. The formula for this calculation, which is %K, is:
%K = 100*{(C
t
-L
n
)/(H
n
-L
n
)}
where
C
t
= the most recent bar’s closing price
L
n
= the lowest price of the most recent n bars
H
n
= the highest price of the most recent n bars
(for a stochastic calculated on daily bars, the default is five days)
The second line, %D, is simply a three-period moving average of %K:
average(%K,3)
Because this basic “fast” stochastic calculation is very volatile, an addition-
ally smoothed version of the indicator, where the original %D line becomes a
new “slow” %K line and a three-period average of this line becomes the “slow”
%D line, is more commonly used.
The stochastic can be made to reflect longer- or shorter-term price move-
ment and to be less or more sensitive to small price fluctuations by increasing
or decreasing the number of bars used to calculate %K and/or increasing or
decreasing the length of the moving average used to calculate %D. For exam-
ple, a stochastic using a 10-bar %K and a three-bar moving average for %D [sto-
chastic(10,3)] would be shorter-term and more sensitive than a stochastic
using a 20-bar %K and a five-bar moving average for %D [stochastic(20,5)].
ACTIVE TRADER • October 2002 • www.activetradermag.com
3
Seventy percent of the time markets
will bounce back and forth between
support and resistance levels,
or fluctuate randomly.
average in the last third of the
chart. The next step is to pin-
point the entry zone — when the
market is within 20 points of the
moving average on the 10-
minute chart and the stochastic
lines cross.
The range between 1 p.m. and
midnight on June 27 meets these
re q u i rements. The entry point
occurs when the fast stochastic
crosses above the slow stochastic
when the indicator is below 20. A
long position is entered at .9883
around 8 p.m., with an accompa-
nying stop-loss at .9858 (10
points below the 200-bar moving
average value of .9868). The stop
is then trailed upward as the
market makes new peaks. The
EUR/USD tops out at .9992, so
the stop scaled up to .9967,
where the position was closed
for an 84-point ($840) gain.
Figures 3 and 4 illustrate a
similar example in the dollar-yen
rate (USD/JPY). The hourly
chart (Figure 3, bottom left)
shows price was trading well
below the 200-bar moving aver-
age after June 21. On the 10-
4
www.activetradermag.com • October 2002 • ACTIVE TRADER
continued on p. x
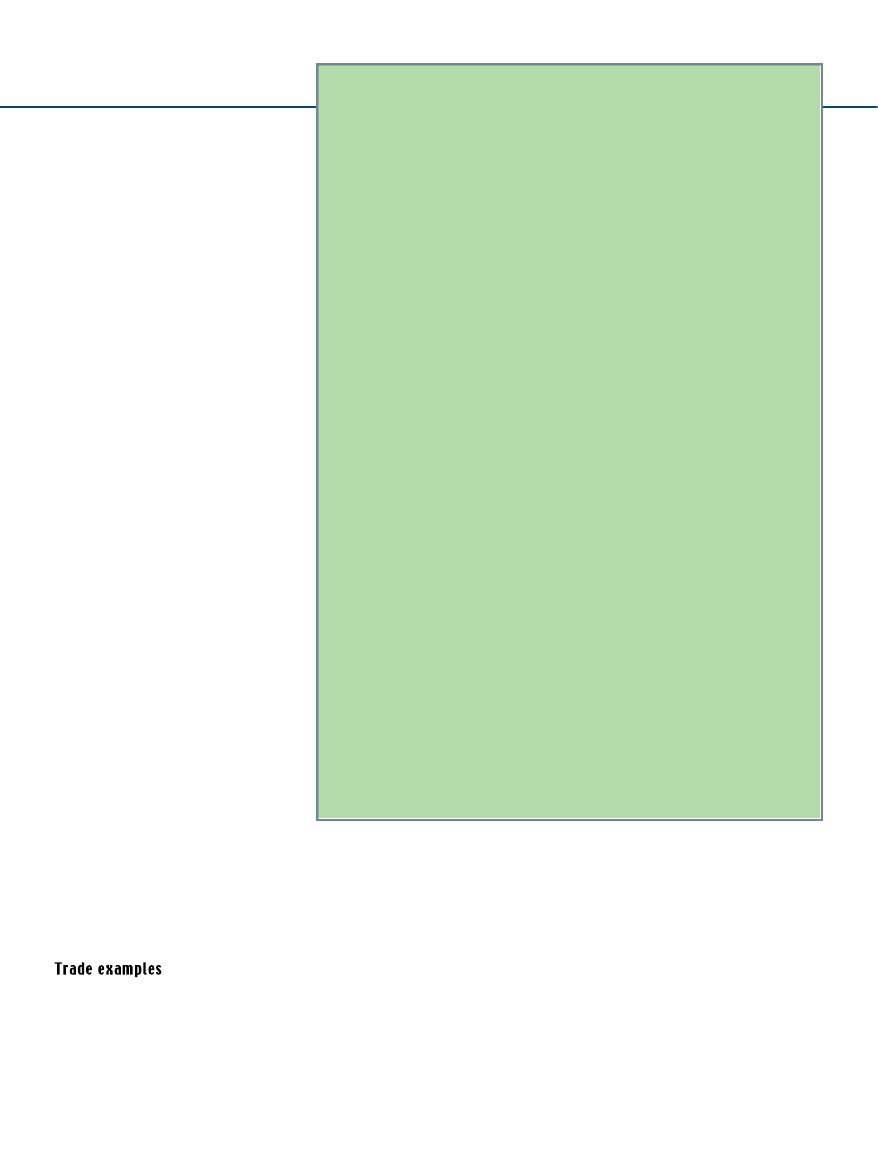
Euro/U.S. Dollar (EUR/USD), 10-minute
Stochastics (14, 3, 3) 72.5152, 77.0424
5:40 9:10 13:10 17:10 20:30 23:50 3:10 6:30 9:50 13:10 17:00 20:20 23:40 3:00 6:20
6/26
6/27
6/28
1 . 0 0 0 0
0 . 9 9 7 5
0 . 9 9 5 0
0 . 9 9 2 5
0 . 9 9 0 0
0 . 9 8 7 5
0 . 9 8 5 0
0 . 9 8 2 5
0 . 9 8 0 0
0 . 9 7 7 5
8 0
4 0
Stop out @ 0.9967
Buy entry @ 0.9883
Market stays within 20 points
of moving average
Stochastic crosses below 20
Price is also above the 200-bar moving average in the final third of the 10-minute
chart. The market moves within 20 points of the moving average between 1 p.m.
and midnight on June 27. The entry is finally signaled when the fast stochastic
line crosses above the slow line (a sign of renewed upside momentum) when the
indicator is below 20 near 8 p.m.
FIGURE 2 LONG TRADE, 10-MINUTE TREND
Source: Gain Capital
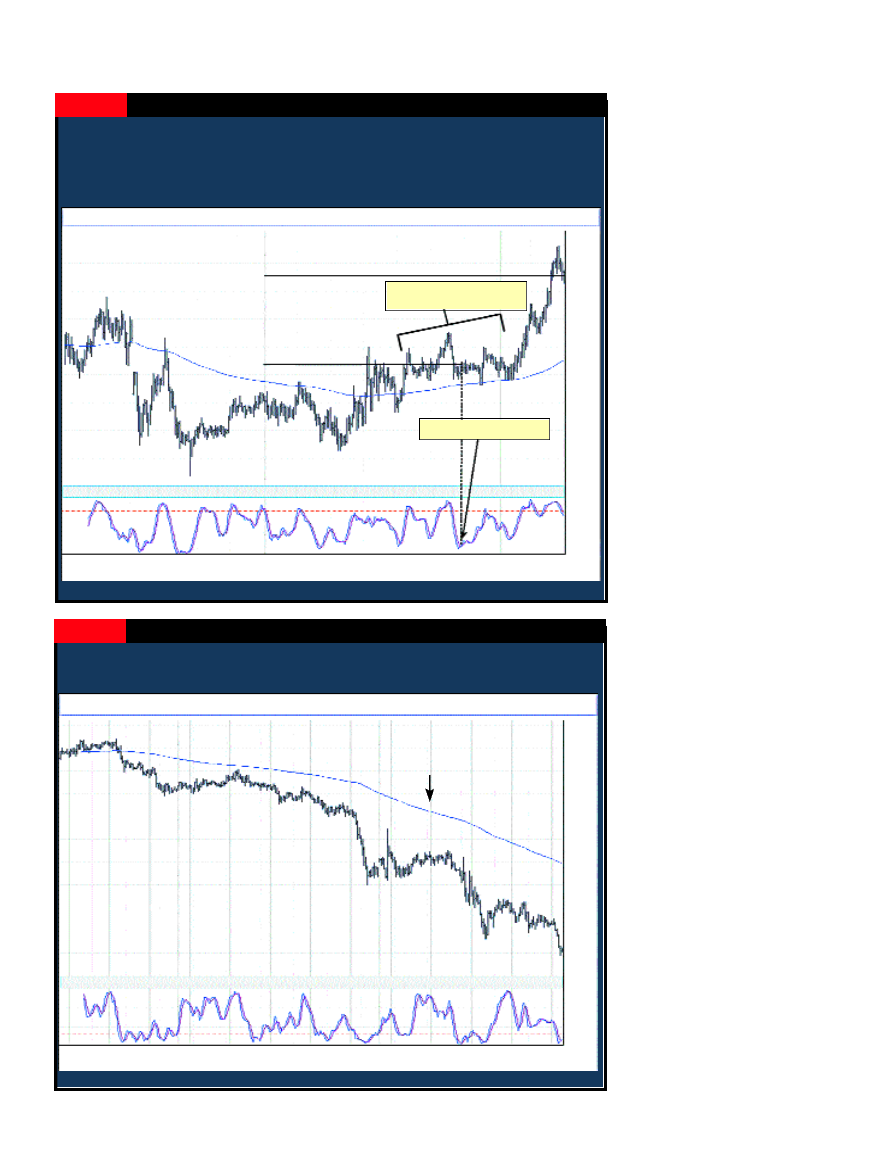
U.S. Dollar/Japanese Yen (USD/JPY), hourly
Stochastics (14, 3, 3) 11.6808, 8.8996
14:00 10:00 6:00 2:00 22:00 18:00 14:00 10:00 6:00
2:00 22:00 18:00 14:00 10:00 6:00
12
13
14
16 17
18
19
20
21
23 24
25
26
27
28
1 2 6 . 4
1 2 5 . 6
1 2 4 . 8
1 2 4 . 0
1 2 3 . 2
1 2 2 . 4
1 2 1 . 6
1 2 0 . 8
1 2 0 . 0
1 1 9 . 2
1 1 8 . 4
1 1 7 . 6
6 0
3 0
On June 27, the down trending USD/JPY traded consistently below the 200-hour
moving average.
FIGURE 3 SHORT TRADE, HOURLY TREND
Source: Gain Capital
Although
the basic
probabilities
work against
traders who try
to exploit
trends, the
potential
rewards can be
worth the risk.
200-hour moving average
minute chart (Figure 4, below), price fell
below the moving average after 10 a.m.
on June 27, indicating a sell opportunity.
Also, price was within 20 points of the
moving average at this point. A short
trade was opened around 5 p.m. at
119.57 when the fast stochastic line
crossed below the slow stochastic line
when the indicator was above 80.
The trade was protected with a
stop-loss order at 119.86. In this
case, the stop remained intact until
the following day, when USD/JPY
began to decline. After trailing the
stop down as the market contin-
ued to decline, profits were taken
at 118.58 (25 points off the 118.33
low), for a gain of 99 points.
This short-term trading method
works well in the Forex market,
but it is also applicable to others.
Each step of the system helps iden-
tify areas where effective trades
can be made. If at any point one of
the criteria is not met, you’ll
instantly know not to make a
trade. This model also gives you
the freedom to experiment with
d i ff e rent chart intervals. When
y o u ’ re equipped with a system
that can help you catch the trend
early, you can wait for the rest of
the market to follow.
Ý
For information on the author see p.
xx.
5
www.activetradermag.com • October 2002 • ACTIVE TRADER
Quoting currencies
B
ecause currencies are quoted in a different manner than equities, reading a
foreign exchange quote may seem a bit confusing at first. However, it’s real-
ly quite simple if you remember two things: 1) The first currency listed first
is the base currency and 2) the value of the base currency is always 1.
For example, if you see a quote of USD/CAD 1.54825, that means that one U.S.
dollar is equal to 1.54825 Canadian dollars. Likewise, USD/JPY 122.01 shows that one
U.S. dollar is equal to 122.01 Japanese yen.
In every trade involving the U.S. dollar, the dollar will be the base currency, with
three exceptions — the British pound (GBP), the Australian dollar (AUS) and the
European currency unit, or Euro (EUR). In these cases, you might see a quote such
as GBP/USD 1.4366, meaning that one British pound equals 1.4366 U.S. dollars.
Whenever the U.S. dollar is the base unit and a currency quote goes up, it means
the dollar has appreciated in value and the other currency has weakened. If the
USD/JPY quote we previously mentioned increases to 123.01, the dollar is stronger
because it will now buy more yen than before.
However, in the three instances where the U.S. dollar is not the base rate, a rising quote means a weakening dollar, as
it now takes more U.S. dollars to equal one pound, Euro or Australian dollar.
In other words, if a currency quote goes higher, that increases the value of the base currency. A lower quote means the
base currency is weakening.
Trades that do not involve the U.S. dollar are called cross rates, but the premise is the same. A quote of GBP/CHF 2.4577
signifies that one British pound is equal to 2.4577 Swiss francs.
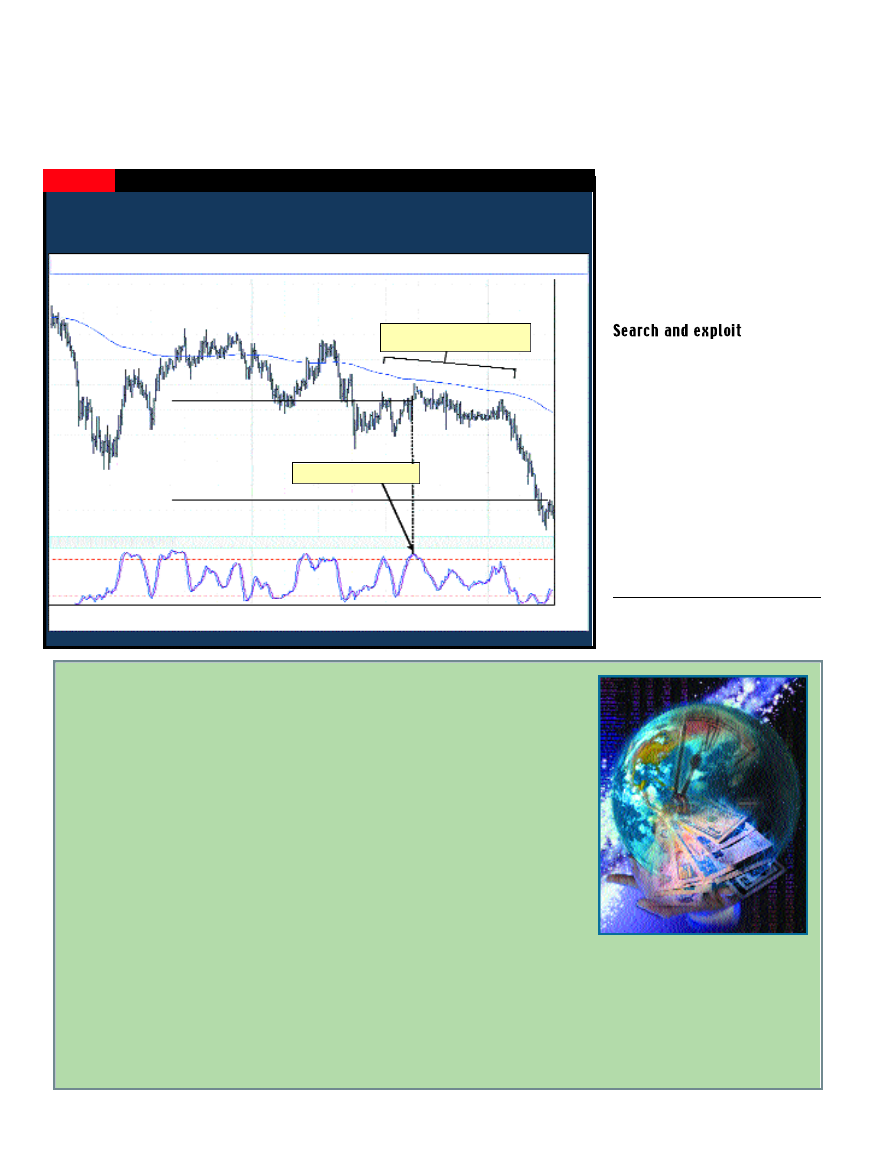
U.S. Dollar/Japanese Yen (USD/JPY), 10-minute
Stochastics (14, 3, 3) 28.9156, 30.0101
6:30 10:00 13:20 17:20 20:40
0:003:20 6:40 10:00 13:20 17:10 20:30 23:50 3:10 6:30
6/26
6/27
6/28
1 2 0 . 7 5
1 2 0 . 5 0
1 2 0 . 2 5
1 2 0 . 0 0
1 1 9 . 7 5
1 1 9 . 5 0
1 1 9 . 2 5
1 1 9 . 0 0
1 1 8 . 7 5
90
60
30
On the 10-minute USD/JPY chart, a stochastic crossover (above 80) occurred around
5 p.m. — while price was below (but within 20 points of) the 200-bar moving average
— signaling a short trade.
FIGURE 4 SHORT TRADE, 10-MINUTE TREND
Source: Gain Capital
Stop out @ 118.58
Sell entry @ 119.57
Market stays within 20 points
of moving average
Stochastic crosses above 80
Wyszukiwarka
Podobne podstrony:
ICWR Forex Trading Strategy
Identifying Active Trading Strategies in the Bitcoin Market
Forex Trading Strategy Learn how to day tradeswing trade major currency pairs(1)
11 FOREX Trading Strategies
Tradingmarkets Com Trading Strategies How To Use S&P 500 Futures To Get A Heads Up On Stock Price
Beating The Bear Short Term Trading Tactics for Difficult Markets with Jea Yu
Encyclopedia of Trading Strategies
LEAPS Trading Strategies Powerful Techniques for Options Trading Success with Marty Kearney
80 Trading strategies id 47247 Nieznany (2)
Alan Farley Pattern Cycles Mastering Short Term Trading With Technical Analysis (Traders Library)
Trading Setups Review Trading Strategies, Guides, and Articles for Active Tech
Drakoln Noble Trade Like A Pro 15 High Profit Trading Strategies
The Power Option Strategy The Ultimate Options Trading Strategy High
więcej podobnych podstron