Kordy, Mauw, and Pieters (Eds.):
Graphical Models for Security 2014 (GraMSec’14)
EPTCS 148, 2014, pp. 78–93, doi:10.4204/EPTCS.148.6
c
A. Couce Vieira, S.H. Houmb & D. Rios Insua
This work is licensed under the
Creative Commons Attribution License.
A Graphical Adversarial Risk Analysis Model for Oil and
Gas Drilling Cybersecurity
Aitor Couce Vieira
Siv Hilde Houmb
Secure-NOK AS
Stavanger, Norway
aitorcouce@securenok.com
sivhoumb@securenok.com
David Rios Insua
Royal Academy of Sciences
Madrid, Spain
david.rios@urjc.es
Oil and gas drilling is based, increasingly, on operational technology, whose cybersecurity is compli-
cated by several challenges. We propose a graphical model for cybersecurity risk assessment based
on Adversarial Risk Analysis to face those challenges. We also provide an example of the model
in the context of an offshore drilling rig. The proposed model provides a more formal and compre-
hensive analysis of risks, still using the standard business language based on decisions, risks, and
value.
1
Introduction
Operational technology (OT) refers to “hardware and software that detects or causes a change through
the direct monitoring and/or control of physical devices, processes and events in the enterprise” [19].
It includes technologies such as SCADA systems. Implementing OT and information technology (IT)
typically lead to considerable improvements in industrial and business activities, through facilitating the
mechanization, automation, and relocation of activities in remote control centers. These changes usually
improve the safety of personnel, and both the cost-efficiency and overall effectiveness of operations.
The oil and gas industry (O&G) is increasingly adopting OT solutions, in particular offshore drilling,
through drilling control systems (drilling CS) and automation, which have been key innovations over
the last few years. The potential of OT is particularly relevant for these activities: centralizing decision-
making and supervisory activities at safer places with more and better information; substituting manual
mechanical activities by automation; improving data through better and near real-time sensors; and op-
timizing drilling processes. In turn, they will reduce rig crew and dangerous operations, and improve
efficiency in operations, reducing operating costs (typically of about $300,000 per day).
Since many of the involved OT employed in O&G are currently computerized, they have become
a major potential target for cyber attacks [37], given their economical relevance, with large stakes at
play. Indeed, we may face the actual loss of large oil reserves because of delayed maneuvers, the death
of platform personnel, or potential large spills with major environmental impact with potentially catas-
trophic consequences. Moreover, it is expected that security attacks will soon target several production
installations simultaneously with the purpose of sabotaging production, possibly taking advantage of
extreme weather events, and attacks oriented towards manipulating or obtaining data or information. Cy-
bersecurity poses several challenges, which are enhanced in the context of operational technology. Such
challenges are sketched in the following section.
1.1
Cybersecurity Challenges in Operational Technology
Technical vulnerabilities in operational technology encompass most of those related with IT vulnerabil-
ities [7], complex software [5], and integration with external networks [16]. There are also and specific
A. Couce Vieira, S.H. Houmb & D. Rios Insua
79
OT vulnerabilities [41, 6]. However, OT has also strengths in comparison with typical IT systems em-
ploying simpler network dynamics.
Sound organizational cybersecurity is even more important with OT given the risks that these systems
bring in. Uncertainties are considerable in both economical and technical sense [2]. Therefore better
data about intrusion attempts are required for improving cybersecurity [31], although gathering them is
difficult since organizations are reluctant about disclosing such information [38].
More formal approaches to controls and measures are needed to deal with advanced threat agents
such as assessing their attack patterns and behavior [18] or implementing intelligent sensor and control
algorithms [9]. An additional problem is that metrics used by technical cybersecurity to evaluate risks
usually tell little to those evaluating or making-decisions at the organizational cybersecurity level. Under-
standing the consequences of a cyber attack to an OT system is difficult. They could lead to production
losses or the inability to control a plant, multimillion financial losses, and even impact stock prices [7].
One of the key problems for understanding such consequences is that OT systems are also cyber-physical
systems (CPS) encompassing both computational and complex physical elements [39].
Risk management is also difficult in this context [30]. Even risk standards differ on how to interpret
risk: some of them assess the probabilities of risk, others focus on the vulnerability component [18].
Standards also tend to present oversimplifications that might alter the optimal decision or a proper un-
derstanding of the problem, such as the well-known shortcomings of the widely employed risk matrices
[11].
Cyber attacks are the continuation of physical attacks by digital means. They are less risky, cheaper,
easier to replicate and coordinate, unconstrained by distance [8], and they could be oriented towards
causing high impact consequences [5]. It is also difficult to measure data related with attacks such as
their rate and severity, or the cost of recovery [2]. Examples include Stuxnet [6], Shamoon [6], and others
[9]. Non targeted attacks could be a problem also.
Several kinds of highly skilled menaces of different nature (e.g., military, hacktivists, criminal or-
ganizations, insiders or even malware agents) can be found in the cyber environment [5], all of them
motivated and aware of the possibilities offered by OT [7]. Indeed, the concept Advanced Persistent
Threat (APT) has arisen to name some of the threats [25]. The diversity of menaces could be classified
according their attitude, skill and time constraints [12], or by their ability to exploit, discover or even
create vulnerabilities on the system [5]. Consequently, a sound way to face them is profiling [3] and
treating [23] them as adversarial actors.
1.2
Related Work Addressing the Complexities of Cybersecurity Challenges
Several approaches have been proposed to model attackers and attacks, including stochastic modelling
[29, 35], attack graph models [21] and attack trees [27], models of directed and intelligent attacks [38];
models based on the kill chain attack phases [18], models of APT attack phases [25], or even frameworks
incorporating some aspects of intentionality or a more comprehensive approach to risk such as CORAS
[26] or ADVISE [10].
Game theory has provided insights concerning the behavior of several types of attackers – such as
cyber criminal APTs – and how to deal with them. The concept of incentives can unify a large variety of
agent intents, whereas the concept of utility can integrate incentives and costs in such a way that the agent
objectives can be modeled in practice [24]. Important insights from game theory are that the defender
with lowest protection level tends to be a target for rational attackers [20], that defenders tend to under-
invest in cybersecurity [1], and that the attacker’s target selection is costly and hard, and thus it needs
to be carefully carried on [14]. In addition to such general findings, some game-theoretic models exist
80
A Graphical ARA Model for O&G Drilling Cybersecurity
for cybersecurity or are applicable to it, modelling static and dynamic games in all information contexts
[34]. However, game-theoretic models have their limitations [17, 34] such as limited data, the difficulty
to identify the end goal of the attacker, the existence of a dynamic and continuous context, and that they
are not scalable to the complexity of real cybersecurity problems in consideration. Moreover, from the
conceptual point of view, they require common knowledge assumptions that are not tenable in this type
of applications.
Additionally, several Bayesian models have been proposed for cybersecurity risk management such
as a model for network security risk analysis [40]; a model representing nodes as events and arcs as
successful attacks [12]; a dynamic Bayesian model for continuously measuring network security [15]; a
model for Security Risk Management incorporating attacker capabilities and behavior [13]: or models
for intrusion detection systems (IDS) [4]. However, these models require forecasting attack behavior
which is hard to come by.
Adversarial Risk Analysis (ARA) [33] combine ideas from Risk Analysis, Decision Analysis, Game-
Theory, and Bayesian Networks to help characterizing the motivations and decisions of the attackers.
ARA is emerging as a main methodological development in this area [28], providing a powerful frame-
work to model risk analysis situations with adversaries ready to increase our threats. Applications in
physical security may be seen in [36].
1.3
Our Proposal
The challenges that face OT, cybersecurity and the O&G sector create a need of a practical, yet rigorous
approach, to deal with them. Work related with such challenges provides interesting insights and tools
for specific issues. However, more formal but understandable tools are needed to deal with such prob-
lems from a general point of view, without oversimplifying the complexity underlying the problem. We
propose a model for cybersecurity risk decisions based on ARA, taking into account the attacker behav-
ior. Additionally, an application of the model in drilling cybersecurity is presented, tailored to decision
problems that may arise in offshore rigs employing drilling CS.
2
Model
2.1
Introduction to Adversarial Risk Analysis
ARA aims at providing one-sided prescriptive support to one of the intervening agents, the Defender
(she), based on a subjective expected utility model, treating the decisions of the Attacker (he) as un-
certainties. In order to predict the Attacker’s actions, the Defender models her decision problem and
tries to assess her probabilities and utilities but also those of the Attacker, assuming that the adversary
is an expected utility maximizer. Since she typically has uncertainty about those, she models it through
random probabilities and uncertainties. She propagates such uncertainty to obtain the Attacker’s optimal
random attack, which she then uses to find her optimal defense.
ARA enriches risk analysis in several ways. While traditional approaches provide information about
risk to decision-making, ARA integrates decision-making within risk analysis. ARA assess intentionality
thoroughly, enabling the anticipation and even the manipulation of the Attacker decisions. ARA incor-
porates stronger statistical and mathematical tools to risk analysis that permit a more formal approach
of other elements involved in the risk analysis. It improves utility treatment and evaluation. Finally, an
ARA graphical model improves the understandability of complex cases, through visualizing the causal
relations between nodes.

A. Couce Vieira, S.H. Houmb & D. Rios Insua
81
The main structuring and graphical tool for decision problems are Multi-Agent Influence Diagrams
(MAID), a generalization of Bayesian networks. ARA is a decision methodology derived from Influence
Diagrams, and it could be structured with the following basic elements:
• Decisions or Actions. Set of alternatives which can be implemented by the decision makers. They
represent what one can do. They are characterized as decision nodes (rectangles).
• Uncertain States. Set of uncontrollable scenarios. They represent what could happen. They are
characterized as uncertainty nodes (ovals).
• Utility and Value. Set of preferences over the consequences. They represent how the previous
elements would affect the agents. They are characterized as value nodes (rhombi).
• Agents. Set of people involved in the decision problem: decision makers, experts and affected
people. In this context, there are several agents with opposed interests. They are represented
through different colors.
We describe now the basic MAID that may serve as a template for cybersecurity problems in O&G
drilling CS, developed using GeNIe [22].
2.2
Graphical Model
Our model captures the Defender cybersecurity main decisions prior to an attack perpetrated by an
APT, which is strongly “business-oriented”. Such cyber criminal organization behavior suits utility-
maximizing analysis, as it pursues monetary gains. A sabotage could also be performed by this type of
agents, and they could be hired to make the dirty job for a foreign power or rival company. We make
several assumptions in the Model, to make it more synthetic:
• We assume one Defender. The Attacker’s nodes do not represent a specific attacker, but a gener-
alization of potential criminal organizations that represent business-oriented APTs, guided mostly
by monetary incentives.
• We assume an atomic attack (the attacker makes one action), with several consequences, as well
as several residual consequences once the risk treatment strategy is selected.
• The Defender and Attacker costs are deterministic nodes.
• We avoid detection-related activities or uncertainties to simplify the Model. Thus, the attack is
always detected and the Defender is always able to respond to it.
• The scope of the Model is an assessment activity prior to any attack, as a risk assessment exercise
to support incident handling planning.
• The agents are expected utility maximizers.
• The Model is discrete.
By adapting the proposed template in Figure 1, we may generalize most of the above assumptions to the
cases at hand.
82
A Graphical ARA Model for O&G Drilling Cybersecurity
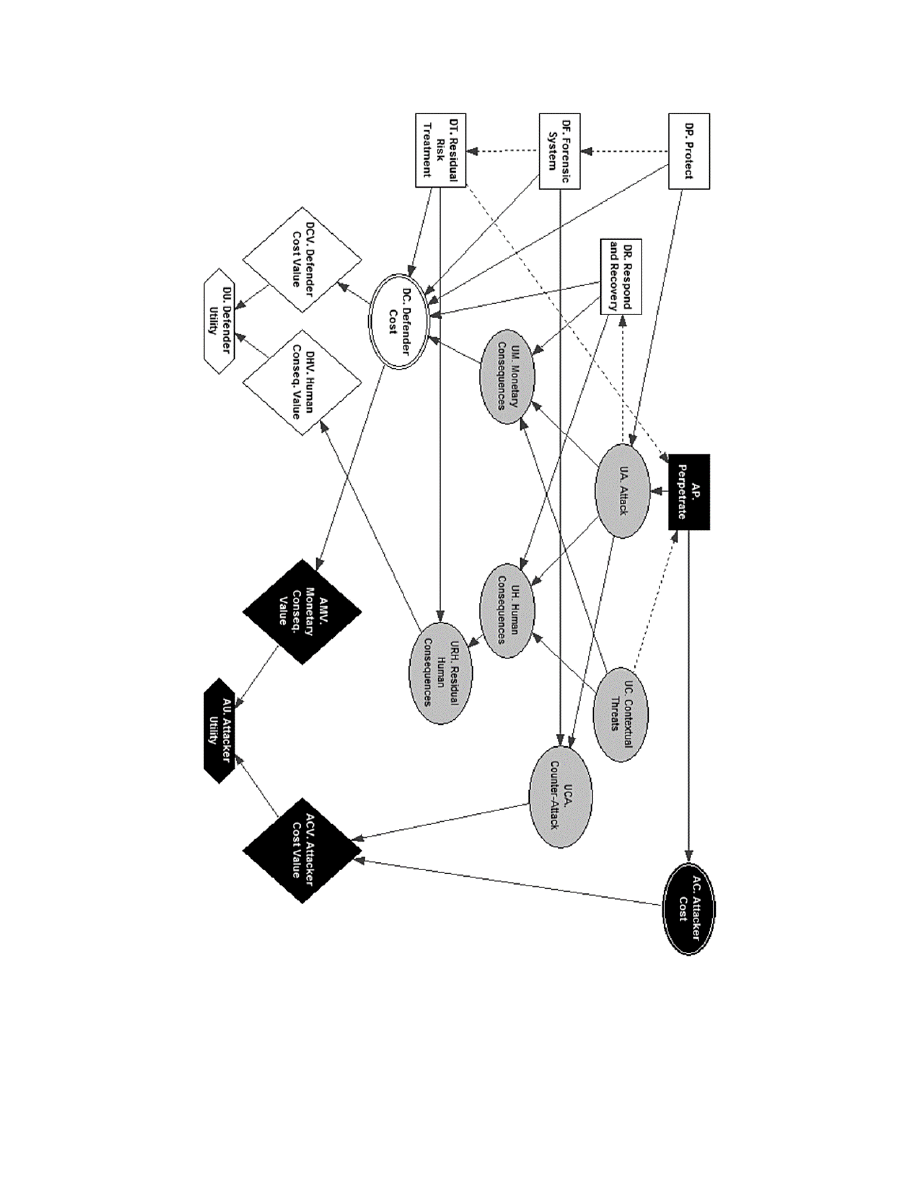
Figure 1. MAID of the ARA Model for O&G drilling cybersecurity.

A. Couce Vieira, S.H. Houmb & D. Rios Insua
83
2.2.1
Defender Decision and Utility Nodes
The Defender nodes, in white, are:
• Protect (DP) decision node. The Defender selects among security measures portfolios to increase
protection against an Attack, e.g., access control, encryption, secure design, firewalls, or personal
training and awareness.
• Forensic System (DF) decision node. The Defender selects among different security measures
portfolios that may harm the Attacker, e.g., forensic activities that enable prosecution of the At-
tacker.
• Residual Risk Treatment (DT) decision node. This node models Defender actions after the assess-
ment of other decisions made by the Defender and the Attacker. They are based on the main risk
treatment strategies excluding risk mitigation, as they are carried on through the Protect and the
Respond and Recovery nodes: avoiding, sharing, or accepting risk. This node must be preceded by
the Protect defender decision node, and it must precede the Attack uncertainty node (the residual
risk assessment is made in advance).
• Respond and Recovery (DR) decision node. The Defender selects between different response and
recovery actions after the materialization of the attack, trying to mitigate the attack consequences.
This will depend on the attack uncertainty node.
• Defender Cost (DC) deterministic node. The costs of the decisions made by the Defender are
deterministic, as well as the monetary consequences of the attack (the uncertainty about such
consequences is solved in the Monetary Consequences node). In a more sophisticated model,
most of the costs could be modeled as uncertain nodes. This node depends on all decision nodes
of the Defender and the Monetary Consequences uncertainty node.
• Value Nodes (DCV and DHV). The Defender evaluates the consequences and costs, taking into
account her risk attitude. They depend on the particular nodes evaluated at each Value node.
• Utility Nodes (DU). This node merges the Value nodes of the Defender. It depends on the De-
fender’s Value nodes.
The Decision nodes are adapted to the typical risk management steps, incorporating ways of evaluating
managing sound organizational cybersecurity strategy, which takes into account the business implications
of security controls, and prepare the evaluation of risk consequences. Related work (Section 1.2) on
security costs and investments could incorporate further complexities underlying the above nodes.
2.2.2
Attacker Decision and Utility Nodes
The Attacker nodes, in black, are:
• Perpetrate (AP) decision node. The [generic] Attacker decides whether he attacks or not. It could
be useful to have a set of options for a same type of attack (e.g., preparing a quick and cheap
attack, or a more elaborated one with higher probabilities of success). It should be preceded by
the Protect and Residual Risk Treatment decision nodes, and might be preceded by the Contextual
Threat node (in case the Attacker observes it).
• Attacker Cost (AC) deterministic node. Cost of the Attacker decisions. Preceded by the Perpetrate
decision node.

84
A Graphical ARA Model for O&G Drilling Cybersecurity
• Value Nodes (AMV and ACV). The Attacker evaluates the different consequences and costs, taking
into account his risk attitude. They depend on the deterministic or uncertainty nodes evaluated at
each Value node.
• Utility Nodes (AU). It merges the Value nodes of the Attacker to a final set of values. It must
depend on the Attacker’s Value nodes.
These nodes help in characterizing the Attacker, avoiding the oversimplification of other approaches.
Additionally, the Defender has uncertainty about the Attacker probabilities and utilities. This is propa-
gated over their nodes, affecting the Attacker expected utility and optimal alternatives, which are random.
Such distribution over optimal alternatives is our forecast for the Attacker’s actions.
2.2.3
Uncertainty Nodes
The uncertainty nodes in grey are:
• Contextual Threats (UC) uncertainty node. Those threats (materialized or not) present during the
Attack. The Attacker may carry out a selected opportunistic Attack (e.g. hurricanes or a critical
moment during drilling).
• Attack (UA) uncertainty node. It represents the likelihood of the attack event, given its conditioning
nodes. It depends on the Perpetrate decision node, and on the Protect decision node.
• Consequences (UM and UV) uncertainty node. It represents the likelihood of different conse-
quence levels that a successful attack may lead to. They depend on the Attack and Contextual
Threat uncertainty nodes, and on the Respond and Recovery decision node.
• Residual Consequences (URH) uncertainty node. It represents the likelihood of different conse-
quence levels after applying residual risk treatment actions. They depend on the Consequence
node modelling the same type of impact (e.g., human, environmental, or reputation).
• Counter-Attack (UCA) uncertainty node. Possibility, enabled by a forensic system, to counter-
attack and cause harm to the Attacker. Most of the impacts may be monetized. It depends on the
Forensic System decision node.
Dealing with the uncertainties and complexities and obtaining a probability distribution for these nodes
could be hard. Some of the methodologies and findings proposed in the sections 1.1 and 1.2 are tai-
lored to deal with some of these complexities. Using them, the Model proposed in this paper could
lead to limit the uncertainties in cybersecurity elements such as vulnerabilities, controls, consequences,
attacks, attacker behavior, and risks. This will enable achieving simplification, through the proposed
Model, without limiting the understanding of the complexities involved, and a sounder organizational
cybersecurity.
3
Example
We present a numerical example of the previous Model tailored to a generic decision problem prototyp-
ical of a cybersecurity case that may arise in O&G offshore rig using drilling CS. The model specifies
a case in which the driller makes decisions to prevent and respond to a cyber attack perpetrated by a
criminal organization with APT capabilities, in the context of offshore drilling and drilling CS. The
data employed in this example are just plausible figures helpful to provide an overview of the problems

A. Couce Vieira, S.H. Houmb & D. Rios Insua
85
that drilling cybersecurity faces. Carrying on the assessment that the Model enables may be helpful for
feeding a threat knowledge base, incident management procedures or incident detection systems.
The context is that of an offshore drilling rig, a floating platform with equipment to drill a well
through the seafloor, trying to achieve a hydrocarbon reservoir. Drilling operations are dangerous and
several incidents may happen in the few months (usually between 2 or 4) that the entire operation may
last. As OT, drilling CS may face most of the challenges presented in Section 1.1 (including being
connected to Enterprise networks, an entry path for attackers) in the context of high-risk incidents that
occur in offshore drilling.
3.1
Agent Decisions
3.1.1
Defender Decisions
The Defender has to make three decisions in advance of the potential attack. In the Protect decision
node (DP), the Defender must decide whether she invests in additional protection: if the Defender im-
plements additional protective measures, the system will be less vulnerable to attacks. In the Forensic
System decision node (DF), the Defender must decide whether she implements a forensic system or not.
Implementing it enables the option of identifying the Attacker and pursuing legal or counter-hacking ac-
tions against him. The Residual Risk Treatment decision node (DT) represents additional risk treatment
strategies that the Defender is able to implement: avoiding (aborting the entire drilling operation to elude
the attack), sharing (buying insurance to cover the monetary losses of the attack), and accepting the risk
(inheriting all the consequences of the attack, conditional on to the mitigation decisions of DP, FD, and
DR).
Additionally, the Respond and Recovery decision node (DR) represents the Defender’s decision
between continuing and stopping the drilling operations as a reaction to the attack. Continuing the
drilling may lead to worsen the consequences of the attack, whereas stopping the drilling will incur
in higher costs due to holding operations. This is a major issue for drilling CS. In general, critical
equipment should not be stopped, since core operations or even the safety of the equipment or the crew
may be compromised.
3.1.2
Attacker Decisions
For simplicity, in the Perpetrate decision node (AP) the Attacker decides whether he perpetrates the
attack or not, although further attack options could be added. In this example, the attack aims at manip-
ulating the devices directly under control of physical systems with the purpose of compromising drilling
operations or harming equipment, the well, the reservoir, or even people.
3.2
Threat Outcomes and Uncertainty
3.2.1
Outcomes and Uncertainty during the Incident
The Contextual Threats uncertainty node (UC) represents the existence of riskier conditions in the drilling
operations (e.g., bad weather or one of the usual incidents during drilling), which can clearly worsen the
consequences of the attack. In this scenario, the Attacker is able to know, to some extent, these contextual
threats (e.g., a weather forecast, a previous hacking in the drilling CS that permits the attacker to read
what is going on in the rig).

86
A Graphical ARA Model for O&G Drilling Cybersecurity
The Attack uncertainty node (UA) represents the chances of the Attacker of causing the incident. If
the Attacker decides not to execute his action, no attack event will happen. However, in case of perpetra-
tion, the chances of a successful attack will be lower if the Defender invests in protective measures (DC
node). An additional uncertainty arises in case of materialization of the attack: the possibility to identify
and counter-attack the node, represented by the Counter-Attack uncertainty node (UCA).
If the attack happens, the Defender will have to deal with different consequence scenarios. The
Monetary (UM) and Human Consequences (UH) nodes represent the chances of different consequences
or impact levels that the Defender may face. The monetary consequences refer to all impacts that can be
measured as monetary losses, whereas human consequences represent casualties that may occur during
an incident or normal operations. However, the Defender has the option to react to the attack by deciding
whether she continues or stops the drilling (DR node). If the Defender decides to stop, there will be
lower chances of casualties and lower chances of worst monetary consequences (e.g., loss of assets or
compensations for injuries or deaths), but she will have to assume the costs of keeping the rig held (one
day in our example) to deal with the cyber threat.
3.2.2
Outcomes and Uncertainty in Risk Management Process
The previous uncertainties appear after the Attacker’s decision to attack or not. The Defender faces
additional relevant uncertainties. She must make a decision between avoiding, sharing, or accepting the
risk (DT node). Such decision will determine the final or residual consequences. The final monetary
consequences are modeled through the Defender Cost deterministic node (DC node), whose outcome
represents the cost of different Defender decisions (nodes DP, DF, DT, and DR). In case of accepting or
sharing the risk, the outcome of the DC node will also inherit the monetary consequences of the attack
(UM node). Similarly, the outcome of the Residual Human Consequences uncertainty node (URH) is
conditioned by the risk treatment decisions (DC node) and, in case of accepting or sharing the risk, it will
inherit the human consequences of the attack (UH node). If the Defender decides to avoid the risk, she
will assume the cost of avoiding the entire drilling operations and will cause that the crew face a regular
death risk rather than the higher death risk of offshore operations. If the Defender shares the risk, she
will assume the same casualties as in UH and a fixed insurance payment, but she will avoid paying high
monetary consequences. Finally, in case the Defender accepts the risk, she will inherit the consequences
from the UM and UH nodes.
The Attacker Cost deterministic node (AC) provides the costs (non-uncertain by assumption) of the
decision made by the Attacker. Since he only has two decisions (perpetrate or not), the node has only two
outcomes: cost or not. This node could be eliminated, but we keep it to preserve the business semantics
within the graphical model.
3.3
Agent Preferences
The Defender aims at maximizing her expected utility, with the utility function being additive, through
the Defender Utility node (DU). The Defender key objective is minimizing casualties, but he also con-
siders minimizing his costs (in this example we assume she is risk-neutral). Each objective has its own
weight in the utility function.
The objective of the Attacker is to maximize his expected utility, represented by an additive utility
function, through the Attacker Utility node (AU). The Attacker key objective is maximizing the monetary
consequences for the Defender. We assume that he is risk-averse towards this monetary impact (he
prefers ensuring a lower impact than risking the operations trying to get a higher impact). He also

A. Couce Vieira, S.H. Houmb & D. Rios Insua
87
considers minimizing his costs (i.e., being identified and perpetrating the attack). Each of these objectives
has its own weight in the utility function, and its own value function. The Attacker does not care about
eventual victims.
3.4
Uncertainty about the Opponent Decisions
The Attacker is able to know to some extent the protective decisions of the defender (DP node), gathering
information while he tries to gain access to the drilling CS. While knowing if the Defender avoided the
risk (avoiding all the drilling operations) is easy, knowing if the Defender chose between sharing or
accepting the risk is difficult. The most important factor, the decision between continue or stop drilling
in case of an attack, could be assessed by observing the industry or company practices. The Defender may
be able to assess also how frequent similar attacks are, or how attractive the drilling rig is for this kind of
attacker. In ARA, and from the Defender perspective, the AP node would be an uncertainty node whose
values should be provided by assessing the probabilities of the different attack actions, through analyzing
the decision problem from the Attacker perspective and obtaining his random optimal alternative.
3.5
Example Values
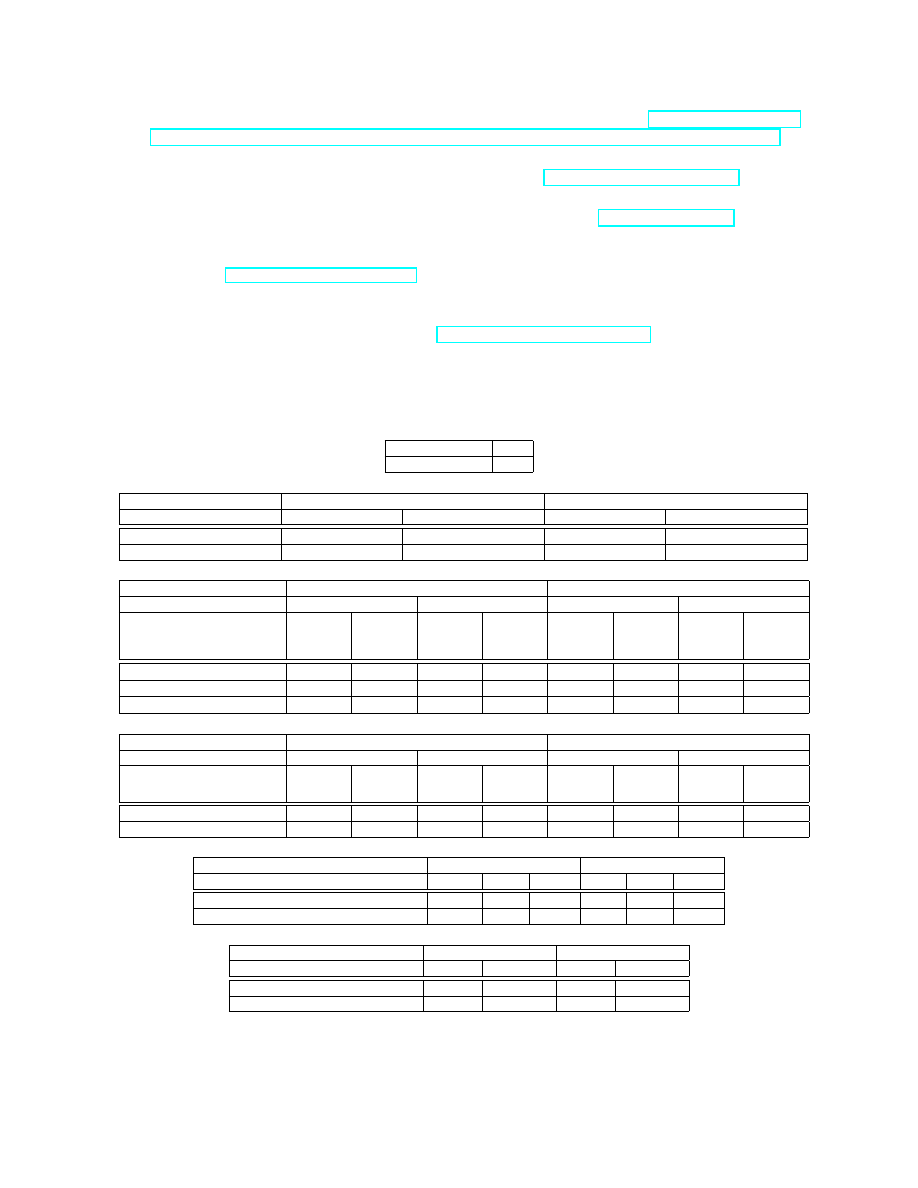
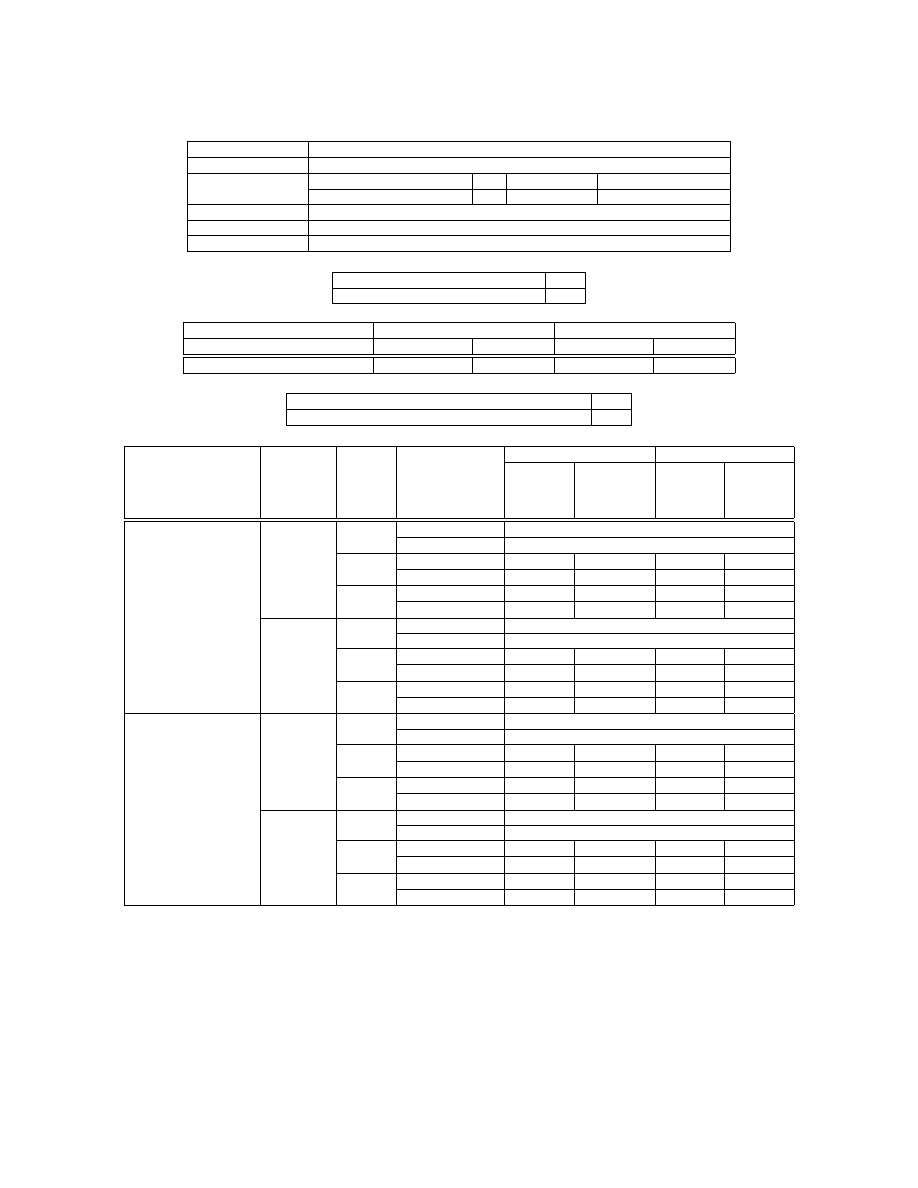
An annex provides the probability tables of the different uncertainty nodes employed to simulate the
example in Genie (Tables 1 to 7). It also provides the different parameters employed in the utility and
value functions (Tables 8 to 10). Additionally, the “risk-averse” values for AMV are obtained with
AMV
=
3
q
DC
10
7
; the “risk-neutral” values for DCV are obtained with DCV = 1 −
DC
10
7
; and, the values for
DHV are 0 in case of victims and 1 in case of no victims.
3.6
Evaluation of Decisions
Based on the solution of the example, we may say that the Attacker should not perpetrate his action
in case he believes the Defender will avoid or share the risk. However, the Attacker may be interested
in perpetrating his action in case he believes that the Defender is accepting the risk. Additionally, the
less preventive measures the Defender implements (DP and DT nodes), the more motivated the Attacker
would be (if he thinks the Defender is sharing the risk). The Attacker’s expected utility is listed in Table
11 in the Annex. The Defender will choose in this example not to implement additional protection (DP
node) without a forensic system (DF node). If the Defender believes that she is going to be attacked,
then she would prefer sharing the risk (DT node) and stop drilling after the incident (DR node). In case
she believes that there will be no attack, she should accept the risk and continue drilling. The Defender’s
expected utilities are listed in Table T12 in Annex.
Thus, the Defender optimal decisions create a situation in which the Attacker is more interested in
perpetrating the attack. Therefore, to affect the Attacker’s behavior, the Defender should provide the
image that her organization is concerned with safety, and especially that it is going to share risks. On the
other hand, if the Attacker perceives that the Defender pays no attention to safety or that she is going to
accept the risk, he will try to carry on his attack. The ARA solution for the Defender is the following:
1. Assess the problem from the point of view of the Attacker. The DT and DR nodes are uncertainty
nodes since that Defender decisions are uncertain for the Attacker. The Defender must model such
nodes in the way that she thinks the Attacker models such uncertainties. In general, perpetrating
an attack is more attractive in case the Attacker strongly believes that the Defender is going to
accept the risk or is going to continue drilling.

88
A Graphical ARA Model for O&G Drilling Cybersecurity
2. Once forecasted the Attacker’s decision, the Defender should choose between sharing and accept-
ing the risk. Accepting the risk in case of no attack is better than sharing the risk, but accepting
the risk in case of attack is worse.
Thus, the key factor for optimizing the decision of the Defender are her estimations on the uncertainty
nodes that represent the DT and DR nodes for the attacker. Such nodes will determine the Attacker best
decision, and this decision the Defender best decision.
4
Conclusions and Further Work
We have presented the real problem and extreme consequences that OT cybersecurity in general, and
drilling cybersecurity in particular, are facing. We also explained some of the questions that complicate
cybersecurity, especially in OT systems. The proposed graphical model provides a more comprehensive,
formal and rigorous risk analysis for cybersecurity. It is also a suitable tool, able of being fed by, or
compatible with, other more specific models such as those explained in Section 1.
Multi-Agent Influence Diagrams provide a formal and understandable way of dealing with com-
plex interactive issues. In particular, they have a high value as business tools, since its nodes translate
the problem directly into business language: decisions, risks, and value. Typical tools employed in
widely used risk standards, such as risk matrices, oversimplify the problem and limit understanding. The
proposed ARA-based model provides a business-friendly interpretation of a risk management process
without oversimplifying its underlying complexity.
The ARA approach permits us to include some of the findings of game theory applied to cyberse-
curity, and it also permits to achieve new findings. The model provides an easier way to understand the
problem but it is still formal since the causes and consequences in the model are clearly presented, while
avoiding common knowledge assumptions in game theory.
Our model presents a richer approach for assessing risk than risk matrices, but it still has the security
and risk management language. In addition, it is more interactive and modular, nodes can be split into
more specific ones. The proposed model can still seem quite formal to business users. However, data can
be characterized using ordinal values (e.g., if we only know that one thing is more likely/valuable than
other), using methods taken from traditional risk management, employing expert opinion, or using worst
case figures considered realistic. The analysis would be poorer but much more operational.
Using the nodes of the proposed model as building blocks, the model could gain in comprehensive-
ness through adding more attackers or attacks, more specific decision nodes, more uncertainty nodes, or
additional consequence nodes, such as environmental impact or reputation. Other operations with sig-
nificant business interpretation can be done, such as sensitivity analysis (how much the decision-makers
should trust a figure) or strength of the influence analysis (which are the key elements).
Its applicability is not exempt of difficulties and uncertainties, but in the same way than other ap-
proaches. Further work is needed to verify and validate the model and its procedures (in a similar way to
the validation of other ARA-based models[32]), and to identify the applicability and usability issues that
may arise. The model could gain usability through mapping only the relevant information to decision-
makers (roughly, decisions and consequences) rather than the entire model.
Acknowledgments
- Work supported by the EU’s FP7 Seconomics project 285223
- David Rios Insua grateful to the support of the MINECO, Riesgos project and the Riesgos-CM program

A. Couce Vieira, S.H. Houmb & D. Rios Insua
89
References
[1] S. Amin, G. A. Schwartz & S. S. Sastry (2011): On the interdependence of reliability and security in net-
worked control systems
. In: Decision and Control and European Control Conference (CDC-ECC), 2011 50th
IEEE Conference on, IEEE, pp. 4078–4083, doi:10.1109/CDC.2011.6161527.
[2] R. Anderson & S Fuloria (2010): Security economics and critical national infrastructure. In: Economics of
Information Security and Privacy, Springer, pp. 55–66, doi:10.1007/978-1-4419-6967-5_4.
[3] A. Atzeni, C. Cameroni, S. Faily, J. Lyle & I Fléchais (2011): Here’s Johnny: A methodology for developing
attacker personas
. In: Availability, Reliability and Security (ARES), 2011 Sixth International Conference
on, IEEE, pp. 722–727, doi:10.1109/ARES.2011.115.
[4] M. G Balchanos (2012): A probabilistic technique for the assessment of complex dynamic system resilience.
Ph.D. thesis, Georgia Institute of Technology. Available at https://smartech.gatech.edu/bitstream/
handle/1853/43730/balchanos_michael_g_201205_phd.pdf.
[5] Defense Science Board (2013):
Task Force report:
Resilient military systems and the advanced
cyber threat
.
Department of Defense.
Available at http://www.acq.osd.mil/dsb/reports/
ResilientMilitarySystems.CyberThreat.pdf.
[6] J. F. Brenner (2013): Eyes wide shut: The growing threat of cyber attacks on industrial control systems.
Bulletin of the atomic scientists (1974) 69(5), pp. 15–20, doi:10.1177/0096340213501372.
[7] E. Byres & J Lowe (2004): The myths and facts behind cyber security risks for industrial control systems. In:
Proceedings of the VDE Kongress, 116. Available at http://www.isa.org/CustomSource/ISA/Div_
PDFs/PDF_News/Glss_2.pdf.
[8] A. Cardenas, S. Amin, B. Sinopoli, A. Giani, A. Perrig & S. Sastry (2009): Challenges for securing cyber
physical systems
. In: Workshop on future directions in cyber-physical systems security. Available at http:
//cimic.rutgers.edu/positionPapers/cps-security-challenges-Cardenas.pdf.
[9] A. A. Cárdenas, S. Amin & S. Sastry (2008): Research challenges for the security of control systems.
In: HotSec. Available at http://robotics.eecs.berkeley.edu/~sastry/pubs/Pdfs%20of%202008/
CardenasResearch2008.pdf.
[10] Conning (2013):
ADVISE enterprise risk modeler
.
Available at https://www.conning.com/
risk-and-capital-management/software/advise.html.
[11] L Cox (2008): What’s wrong with risk matrices?
Risk analysis 28(2), pp. 497–512, doi:10.1111/j.1539-
[12] R. Dantu, P. Kolan, R. Akl & K Loper (2007): Classification of attributes and behavior in risk manage-
ment using bayesian networks
. In: Intelligence and Security Informatics, 2007 IEEE, IEEE, pp. 71–74,
[13] R. Dantu, P. Kolan & J Cangussu (2009): Network risk management using attacker profiling. Security and
Communication Networks 2(1), pp. 83–96, doi:10.1002/sec.58.
[14] D. Florêncio & C Herley (2013): Where do all the attacks go? In: Economics of Information Security and
Privacy III, Springer, pp. 13–33, doi:10.1007/978-1-4614-1981-5_2.
[15] M. Frigault, L. Wang, A. Singhal & S Jajodia (2008): Measuring network security using dynamic
bayesian network
. In: Proceedings of the 4th ACM workshop on Quality of protection, ACM, pp. 23–30,
[16] A. Giani, S. Sastry, K. H. Johansson & H Sandberg (2009): The VIKING project: an initiative on resilient
control of power networks
. In: Resilient Control Systems, 2009. ISRCS’09. 2nd International Symposium
on, IEEE, pp. 31–35, doi:10.1109/ISRCS.2009.5251361.
[17] S. N. Hamilton, W. L. Miller, A. Ott & O. Saydjari (2002): Challenges in applying game theory to the domain
of information warfare
. In: 4th Information survivability workshop (ISW-2001/2002), Vancouver, Canada.
Available at http://www.au.af.mil/au/awc/awcgate/afrl/hamilton-31-08-a.pdf.

90
A Graphical ARA Model for O&G Drilling Cybersecurity
[18] E. M. Hutchins, M. J. Cloppert & R. M. Amin (2011): Intelligence-driven computer network defense in-
formed by analysis of adversary campaigns and intrusion kill chains
. Leading Issues in Information Warfare
& Security Research 1, p. 80. Available at http://www.f35team.com/content/dam/lockheed/data/
corporate/documents/LM-White-Paper-Intel-Driven-Defense.pdf.
[19] Gartner
IT:
Gartner
IT
Glossary
.
Available
at
http://www.gartner.com/it-glossary/
[20] B. Johnson, J. Grossklags, N. Christin & J Chuang (2012): Nash equilibria for weakest target security
games with heterogeneous agents.
In: Game Theory for Networks, Springer Berlin Heidelberg, pp. 444–458,
doi:10.1007/978-3-642-30373-9_31.
[21] I. Kotenko & M Stepashkin (2006): Attack graph based evaluation of network security. In: Communications
and Multimedia Security, Springer, pp. 216–227, doi:10.1007/11909033_20.
[22] Decision Systems Laboratory: GeNIe. Available at http://genie.sis.pitt.edu/.
[23] Z. Li, Q. Liao & A Striegel (2009): Botnet economics: uncertainty matters. In: Managing Information Risk
and the Economics of Security, Springer, pp. 245–267, doi:10.1007/978-0-387-09762-6_12.
[24] P. Liu, W. Zang & M Yu (2005): Incentive-based modeling and inference of attacker intent, objectives,
and strategies
.
ACM Transactions on Information and System Security (TISSEC) 8(1), pp. 78–118,
[25] Command Five Pty Ltd (2011): Advanced persistent threats: A decade in review. Available at http://www.
commandfive.com/papers/C5_APT_ADecadeInReview.pdf.
[26] M. S. Lund, B. Solhaug & K Stolen (2011): Model-driven risk analysis: the CORAS approach. Springer,
doi:10.1007/978-3-642-12323-8.
[27] S. Mauw & M Oostdijk (2006): Foundations of attack trees. In: Information Security and Cryptology-ICISC
2005, Springer, pp. 186–198, doi:10.1007/11734727_17.
[28] J. Merrick & G. S. Parnell (2011): A comparative analysis of PRA and intelligent adversary methods for coun-
terterrorism risk management
. Risk Analysis 31(9), pp. 1488–1510, doi:10.1111/j.1539-6924.2011.01590.x.
[29] C. Muehrcke, E. V. Ruitenbeek, K. Keefe & W. H. Sanders (2010): Characterizing the behavior of cyber
adversaries: The means, motive, and opportunity of cyberattacks
. In: 2010 International Conference on De-
pendable Systems and Networks Supplemental, IEEE/IFIP International Conference on Dependable Systems
and Networks. Available at https://www.perform.illinois.edu/Papers/USAN_papers/10VAN01.
pdf.
[30] D. K. Mulligan & F. B. Schneider (2011): Doctrine for cybersecurity.
Daedalus 140(4), pp. 70–92,
[31] S. L. Pfleeger & R Rue (2008): Cybersecurity economic issues: Clearing the path to good practice. Software,
IEEE 25(1), pp. 35–42, doi:10.1109/MS.2008.4.
[32] D. Rios Insua & J. Cano (2013):
Basic models for security risk analysis (SECONOMICS D5.1)
.
Technical Report, SECONOMICS Project.
Available at http://seconomicsproject.eu/content/
d051-basic-models-security-risk-analysis.
[33] David Rios Insua, J. Rios & D Banks (2009): Adversarial risk analysis. Journal of the American Statistical
Association 104(486), pp. 841–854, doi:10.1198/jasa.2009.0155.
[34] S. Roy, C. Ellis, S. Shiva, D. Dasgupta, V. Shandilya & Q Wu (2010): A survey of game theory as applied to
network security
. In: System Sciences (HICSS), 2010 43rd Hawaii International Conference on, IEEE, pp.
1–10, doi:10.1109/HICSS.2010.35.
[35] K Sallhammar (2007): Stochastic models for combined security and dependability evaluation. Ph.D. thesis,
Norwegian University of Science and Technology. Available at http://www.diva-portal.org/smash/
get/diva2:123582/FULLTEXT01.
[36] J. C. Sevillano, D Rios Insua & J Rios (2012): Adversarial risk analysis: The Somali pirates case. Decision
Analysis 9(2), pp. 86–95, doi:10.1287/deca.1110.0225.
A. Couce Vieira, S.H. Houmb & D. Rios Insua
91
[37] Z. Shauk (2013): Hackers hit energy companies more than others. Available at http://fuelfix.com/
blog/2013/03/25/electronic-attacks-hit-two-thirds-of-energy-companies-in-study/.
[38] C.-W. Ten, C.-C. Liu & G Manimaran (2008): Vulnerability assessment of cybersecurity for SCADA systems.
Power Systems, IEEE Transactions on 23(4), pp. 1836–1846, doi:10.1109/TPWRS.2008.2002298.
[39] R. C. Thomas, M. Antkiewicz, P. Florer, S. Widup & M Woodyard (2013): How bad is it?–A branching
activity model to estimate the impact of information security breaches
[40] P. Xie, J. H. Li, X. Ou, P. Liu & R Levy (2010): Using Bayesian networks for cyber security analysis. In:
Dependable Systems and Networks (DSN), 2010 IEEE/IFIP International Conference on, IEEE, pp. 211–220.
Available at 10.1109/DSN.2010.5544924.
[41] B. Zhu, A. Joseph & S Sastry (2011): A taxonomy of cyber attacks on SCADA systems. In: Internet of Things
(iThings/CPSCom), 2011 International Conference on and 4th International Conference on Cyber, Physical
and Social Computing, IEEE, pp. 380–388, doi:10.1109/iThings/CPSCom.2011.34.
Appendix: Tables with Example Data
Table T1. Probability table for UC node.
Riskier conditions
30%
Normal conditions
70%
Table T2. Probability table for UA node.
Attacker’s Perpetrate decision
Perpetrate
No perpetrate
Defender’s Protect decision
Additional protection
Non additional protection
Additional protection
Non additional protection
Attack event
5%
40%
0%
0%
No attack event
95%
60%
100%
100%
Table T3. Probability table for UM node.
Attack event
Attack
No attack
Contextual Threat event
Riskier conditions
Normal conditions
Riskier conditions
Normal conditions
Defender’s Respond and
Recovery decision
Continue
drilling
Stop
drilling
Continue
drilling
Stop
drilling
Continue
drilling
Stop
drilling
Continue
drilling
Stop
drilling
Lossing 0 $ event
3%
0%
10%
0%
92%
0%
96%
0%
Lossing 0 - 1 Million $ event
12%
85%
20%
90%
7%
97%
4%
99%
Lossing 1 - 5 Million $ event
85%
15%
70%
10%
1%
3%
0%
1%
Table T4. Probability table for UH node.
Attack event
Attack
No attack
Contextual Threat event
Riskier conditions
Normal conditions
Riskier conditions
Normal conditions
Defender’s Respond and
Recovery decision
Continue
drilling
Stop
drilling
Continue
drilling
Stop
drilling
Continue
drilling
Stop
drilling
Continue
drilling
Stop
drilling
Non casualties event
96%
99.2%
99.4%
99.96%
99.6%
99.96%
99.9%
99.99%
Casualties event
4%
0.8%
0.6%
0.04%
0.4%
0.04%
0.1%
0.01%
Table T5. Probability table for URH node.
Human Consequences event
No casualties
Casualties
Defender’s Residual Risk Treatment decision
Avoid
Share
Accept
Avoid
Share
Accept
No casualties event
99.95%
100%
100%
0%
0%
0%
casualties event
0.05%
0%
0%
100%
100%
100%
Table T6. Probability table for UCA node.
Attack event
Attack
No attack
Defender’s Forensic System decision
Forensic
No forensic
Forensic
No forensic
No identification event
30%
90%
100%
100%
Identification event
70%
10%
0%
0%
92
A Graphical ARA Model for O&G Drilling Cybersecurity
Table T7. Probability table for DC node:
Avoiding the risk
10,000,000 $
Sharing the risk
500,000 $
Accepting the risk
Monetary Consequences event
0 $
0 - 1,000,000 $
1,000,000 - 5,000,000 $
Value assigned
0 $
500,000$
2,500,000 $
Additional protection
20,000 $
Forensic system
10,000 $
Stop drilling
300,000 $
Table T8. Weight table for DU node.
Importance of the Costs
5%
Importance of the Human Consequences
95%
Table T9. Value table for ACV node:
Attacker Cost event
Cost
No cost
Counter Attack Consequences event
No identification
Identification
No identification
Identification
Value
0.75
0
1
0.25
Table T10. Weight table for AU node.
Importance of the costs
3%
Importance of the Monetary Consequences on the Defender
97%
Table T11. Attacker expected utilities (in black the highest among the different Attacker’s decisions).
DP node
DF node
DT node
UC node
Defender continues drilling
Defender stops drilling
Perpetrate
decision
Non
perpetrate
decision
Perpetrate
decision
Non
perpetrate
decision
Additional protection
Forensic
Avoid
Riskier conditions
1
Normal conditions
1
Share
Riskier conditions
0.56074
0.56903
0.61138
0.61966
Normal conditions
0.56074
0.56903
0.61138
0.61966
Accept
Riskier conditions
0.36484
0.35433
0.61728
0.62458
Normal conditions
0.35170
0.34293
0.61375
0.62130
No forensic
Avoid
Riskier conditions
1
Normal conditions
1
Share
Riskier conditions
0.55938
0.56699
0.61060
0.61821
Normal conditions
0.55938
0.56699
0.61060
0.61821
Accept
Riskier conditions
0.34461
0.33241
0.61653
0.62315
Normal conditions
0.33055
0.32013
0.61299
0.61986
No additional protection
Forensic
Avoid
Riskier conditions
1
Normal conditions
1
Share
Riskier conditions
0.55116
0.56496
0.60295
0.61675
Normal conditions
0.55116
0.56496
0.60295
0.61675
Accept
Riskier conditions
0.45634
0.29898
0.61588
0.62173
Normal conditions
0.42794
0.28532
0.61058
0.61841
No Forensic
Avoid
Riskier conditions
1
Normal conditions
1
Share
Riskier conditions
0.55442
0.56282
0.60690
0.61530
Normal conditions
0.55442
0.56282
0.60690
0.61530
Accept
Riskier conditions
0.32392
0.07465
0.61990
0.62030
Normal conditions
0.28286
0.05131
0.61456
0.61696

A. Couce Vieira, S.H. Houmb & D. Rios Insua
93
Table T12. Defender expected utilities (in black the highest among the different Defender’s decisions).
DP node
DF node
DT node
DR node
Possible events
Riskier conditions
Normal conditions
Attack event
Non attack
event
Attack event
Non attack
event
Additional protection
Forensic
Avoid
Continue drilling
0.91154
0.94573
0.94383
0.94858
Stop drilling
0.94193
0.94915
0.94915
0.94943
Share
Continue drilling
0.95935
0.99355
0.99165
0.99640
Stop drilling
0.98825
0.99547
0.99547
0.99576
Accept
Continue drilling
0.95092
0.99575
0.98490
0.99880
Stop drilling
0.98675
0.99517
0.99447
0.99566
No forensic
Avoid
Continue drilling
0.91154
0.94573
0.94383
0.94858
Stop drilling
0.94193
0.94915
0.94915
0.94943
Share
Continue drilling
0.95940
0.99360
0.99170
0.99645
Stop drilling
0.98830
0.99552
0.99552
0.99581
Accept
Continue drilling
0.95097
0.99580
0.98495
0.99885
Stop drilling
0.98680
0.99522
0.99452
0.99571
No additional protection
Forensic
Avoid
Continue drilling
0.91154
0.94573
0.94383
0.94858
Stop drilling
0.94193
0.94915
0.94915
0.94943
Share
Continue drilling
0.95945
0.99365
0.99175
0.99650
Stop drilling
0.98835
0.99557
0.99557
0.99586
Accept
Continue drilling
0.95102
0.99585
0.98500
0.99890
Stop drilling
0.98685
0.99527
0.99457
0.99576
No Forensic
Avoid
Continue drilling
0.91154
0.94573
0.94383
0.94858
Stop drilling
0.94193
0.94915
0.94915
0.94943
Share
Continue drilling
0.95950
0.99370
0.99180
0.99655
Stop drilling
0.98840
0.99562
0.99562
0.99591
Accept
Continue drilling
0.95107
0.99590
0.98505
0.99895
Stop drilling
0.98690
0.99532
0.99462
0.99581
Document Outline
- 1 Introduction
- 2 Model
- 3 Example
- 4 Conclusions and Further Work
Wyszukiwarka
Podobne podstrony:
więcej podobnych podstron