Science
Topic
Astronomy
Subtopic
Professor David M. Meyer
Northwestern University
Course Guidebook
A Visual Guide
to the Universe
Smithsonian
®

PUBLISHED BY:
THE GREAT COURSES
Corporate Headquarters
4840 Westfields Boulevard, Suite 500
Chantilly, Virginia 20151-2299
Phone: 1-800-832-2412
Fax: 703-378-3819
www.thegreatcourses.com
Copyright © The Teaching Company, 2014
Printed in the United States of America
This book is in copyright. All rights reserved.
Without limiting the rights under copyright reserved above,
no part of this publication may be reproduced, stored in
or introduced into a retrieval system, or transmitted,
in any form, or by any means
(electronic, mechanical, photocopying, recording, or otherwise),
without the prior written permission of
The Teaching Company.
© 2014 Smithsonian Institution. The name “Smithsonian” and the
Smithsonian logo are registered trademarks owned by the
Smithsonian Institution.
Smithsonian
®

i
David M. Meyer, Ph.D.
Professor of Physics and Astronomy
Director of the Dearborn Observatory
Northwestern University
P
rofessor David M. Meyer is Professor of
Physics and Astronomy and Director of
the Dearborn Observatory in the Center
for Interdisciplinary Exploration and Research
in Astrophysics at Northwestern University. He
received his B.S. in Astrophysics at the University
of Wisconsin–Madison after completing a senior honors thesis on ultraviolet
interstellar extinction with Professor Blair Savage. Professor Meyer earned
his M.A. and Ph.D. in Astronomy at the University of California, Los
Angeles, working with Professor Michael Jura on measurements of the
cosmic microwave background radiation from observations of interstellar
cyanogen. He then continued his studies as a Robert R. McCormick
Postdoctoral Fellow at the University of Chicago’s Enrico Fermi Institute
before joining the Northwestern faculty in 1987.
Professor Meyer’s research focuses on the application of sensitive
spectroscopic techniques to astrophysical problems involving interstellar
and extragalactic gas clouds. Utilizing a variety of ground- and space-based
telescopes, he studies the optical and ultraviolet spectra of stars and quasars
to better understand the composition, structure, and physical conditions of
intervening clouds in the Milky Way and other galaxies. Over the past 25
years, much of his research has involved space telescopes in general and the
Hubble Space Telescope in particular. During this time, Professor Meyer and
his collaborators have been awarded more than $2 million in NASA research
funding to carry out space observations that have resulted in 32 peer-
reviewed publications on topics ranging from the abundance of interstellar
oxygen to the gaseous character of distant galaxies. Professor Meyer also has
VHUYHG¿YHWLPHVRQWKHFRPPLWWHHWKDWDQQXDOO\VHOHFWVWKHPRVWGHVHUYLQJ
proposals for Hubble observing time.

ii
ii
During his career at Northwestern, Professor Meyer has specialized in
designing and teaching introductory undergraduate courses in astronomy,
cosmology, and astrobiology for nonscience majors. A hallmark of his lectures
is the use of Hubble images to bring the latest research into the introductory
classroom. His success in such efforts has led to a number of teaching awards,
including Northwestern’s highest teaching honor, the Charles Deering
McCormick Professorship of Teaching Excellence. His other honors include
the Martin J. and Patricia Koldyke Outstanding Teaching Professorship, the
Weinberg College Distinguished Teaching Award, and the Northwestern
University Alumni Excellence in Teaching Award.
Professor Meyer’s previous Great Course is entitled Experiencing Hubble:
Understanding the Greatest Images of the Universe
Ŷ

iii
About our Partner
F
ounded in 1846, the Smithsonian Institution is the world’s largest
museum and research complex, consisting of 19 museums and
galleries, the National Zoological Park, and 9 research facilities. The
total number of artifacts, works of art, and specimens in the Smithsonian’s
collections is estimated at 137 million. These collections represent America’s
rich heritage, art from across the globe, and the immense diversity of the
natural and cultural world.
In support of its mission—the increase and diffusion of knowledge—the
Smithsonian focuses on four Grand Challenges that describe its areas
of study, collaboration, and exhibition: Unlocking the Mysteries of the
Universe, Understanding and Sustaining a Biodiverse Planet, Valuing
World Cultures, and Understanding the American Experience. The
Smithsonian’s partnership with The Great Courses is an opportunity to
encourage continuous exploration by learners of all ages across these areas
of study.
This course, A Visual Guide to the Universe, takes you on an enhanced tour
of the most interesting places in the universe, using images produced by
large space observatories, planetary probes, and a new generation of massive
ground-based telescopes. Destinations include the Martian surface, the rings
of Saturn, the star-forming Orion Nebula, and the massive black hole in the
center of the Milky Way.

Table of Contents
INTRODUCTION
Professor Biography ............................................................................i
Course Scope .....................................................................................1
LECTURE GUIDES
LECTURE 1
Probing the Cosmos from Space........................................................4
LECTURE 2
The Magnetic Beauty of the Active Sun............................................ 11
LECTURE 3
Mars—Water and the Search for Life ...............................................18
LECTURE 4
Vesta and the Asteroid Belt ..............................................................25
LECTURE 5
Saturn—The Rings of Enchantment .................................................32
LECTURE 6
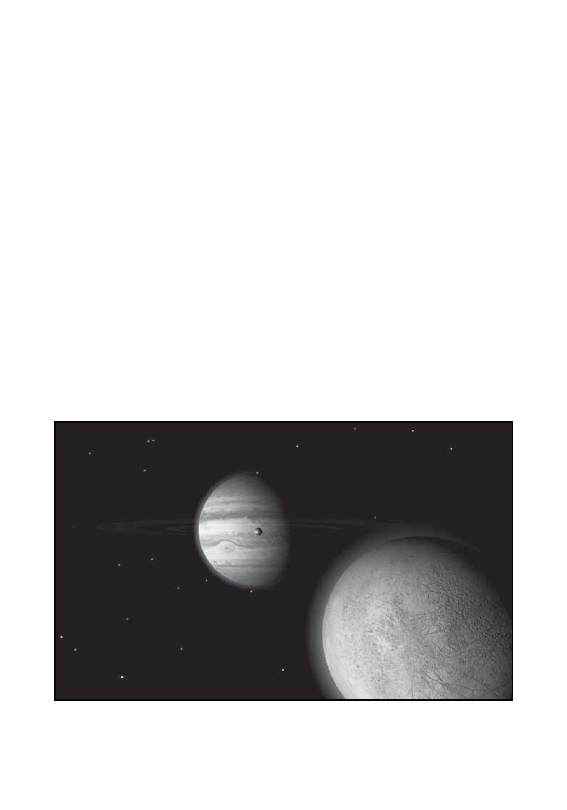
The Ice Moons Europa and Enceladus ............................................38
LECTURE 7
The Search for Other Earths ............................................................45
LECTURE 8
The Swan Nebula .............................................................................52
LECTURE 9
The Seven Sisters and Their Stardust Veil ......................................58
LECTURE 10
Future Supernova, Eta Carinae ........................................................65
iv

v
Table of Contents
LECTURE 11
Runaway Star, Zeta Ophiuchi ...........................................................71
LECTURE 12
The Center of the Milky Way ............................................................77
LECTURE 13
The Andromeda Galaxy ....................................................................84
LECTURE 14
Hubble’s Galaxy Zoo ........................................................................91
LECTURE 15
The Brightest Quasar .......................................................................98
LECTURE 16
The Dark Side of the Bullet Cluster ................................................105
LECTURE 17
The Cosmic Reach of Gamma-Ray Bursts .................................... 112
LECTURE 18
The Afterglow of the Big Bang ........................................................ 119
Bibliography ....................................................................................127
SUPPLEMENTAL MATERIAL

vi

1
Scope:
T
he tremendous growth in our understanding of the universe over the
past 50 years is due in large part to the pioneering views provided
E\DÀHHWRIVSDFHSUREHVDQGVSDFHREVHUYDWRULHV:HOLYHLQDQDJH
of amazing space discoveries where planets and moons are being seen up
FORVHIRUWKH¿UVWWLPHDQGWKHFRVPRVLVEHLQJLPDJHGLQZD\VWKDWDUHQRW
possible from the Earth’s surface. Through the eyes of robotic rovers on
the surface of Mars, we have learned that the Red Planet may have once
been like Earth. Infrared space telescopes have peered inside the optically
dark dust clouds of our Milky Way Galaxy and have directly observed star
formation in action. The optical acuity of the Hubble Space Telescope has
made it possible to image the evolution of distant galaxies in unprecedented
detail and map the gravitational signature of the invisible dark matter that
dominates the universe.
,Q WKLV LQWURGXFWRU\ FRXUVH ZH GLVFXVV WKH VFLHQWL¿F VWRULHV EHKLQG VRPH
of the most spectacular space images obtained during the past 20 years.
Through these images, we tour a variety of the most fascinating places in
the solar system, our Milky Way Galaxy, and the greater universe beyond.
We also explore in detail the space probes and telescopes themselves in the
context of their design, operation, and special imaging capabilities. The
lectures are organized to address the topical images from near to far in space
and time, beginning with the Sun and ending with the big bang. The image
highlighting each lecture is discussed in terms of its topical implications and
the broader astrophysical context. A key emphasis throughout the course is
how these images have made it possible to visualize and map a universe that
is mostly invisible to the Earth-bound human eye.
The course begins with an overview lecture on the expanding frontier of
space astronomy. It focuses on the motivations and limitations pushing
the robotic exploration of the solar system and the atmospheric constraints
driving the deployment of space telescopes to view the universe across the
HOHFWURPDJQHWLF VSHFWUXP 7KH ¿UVW VWRS RQ RXU VRODU V\VWHP WRXU LV WKH
A Visual Guide to the Universe

2
Sun, as seen through the X-ray and ultraviolet eyes of the Solar Dynamics
Observatory. At these wavelengths, it is possible to view in detail the
SRZHUIXOPDJQHWLF¿HOGVSURGXFLQJVRODUÀDUHVDQGFRURQDOPDVVHMHFWLRQV
that can impact the Earth. We then voyage to the surface of Mars, as seen
from rovers at ground level and orbiters imaging from above. This detailed
view makes it clear that Mars has evolved from a warm planet with liquid
water and a sunstantial atmosphere to a cold, dry, nearly airless desert today.
Beyond the orbit of Mars, we explore the nature of the asteroid belt and
study up close one of its largest inhabitants, Vesta, with the Dawn space
probe. Our visit to Saturn with the Cassini orbiter provides an opportunity
WR REVHUYH LWV PDJQL¿FHQW ULQJV IURP D YDULHW\ RI EUHDWKWDNLQJ YLVWDV DQG
to study their structure, dynamical interactions, and potential origin. We
close our tour of the solar system with stops at the ice moons Europa and
Enceladus, which orbit Jupiter and Saturn, respectively. As revealed by the
Galileo and Cassini orbiters, the surfaces of both of these worlds yield strong
evidence of internal heating and subsurface oceans of liquid water.
We begin our tour of the Milky Way Galaxy in search of the shadows of
Earth-sized planets around other stars with the Kepler Space Telescope.
Our next stop is the Swan Nebula, where infrared images obtained with the
Spitzer Space Telescope have revealed an evolving pattern of star formation
that may have been driven by the passage of its parent dark cloud complex
through a galactic spiral arm. The Spitzer image of the nearby Pleiades star
cluster provides an infrared perspective on one of the top optical sights in
WKHQLJKWVN\7KLVLQIUDUHGYLHZKLJKOLJKWVWKHVSHFWDFXODUZHERI¿QHVFDOH
structure in the cluster’s veil of stardust. We next gaze through Hubble for
the sharpest view yet of Eta Carinae, one of the most massive stars in the
Galaxy. Its dumbbell-shaped debris cloud from a violent eruption in 1843
is merely a prelude to its eventual explosion as a supernova. In contrast,
WKHUXQDZD\VWDU=HWD2SKLXFKLDSSHDUVWREHÀHHLQJWKHVLWHRIDPLOOLRQ
year-old supernova; its infrared Spitzer image reveals an interstellar bow
shock that points back to a massive star cluster. We conclude the Milky Way
segment of our cosmic tour with a multiwavelength visit to the menagerie of
unusual stars, hot gas clouds, and a supermassive black hole in the galactic
center region.

3
%H\RQG WKH 0LON\ :D\ ZH IRFXV ¿UVW RQ WKH XOWUDYLROHW LPDJH RI WKH
Andromeda Galaxy provided by the GALEX space telescope and discuss
Andromeda’s past and future interactions with its galactic neighbors. We then
turn to Hubble for a detailed look at some of the most peculiar galaxies in its
galaxy album. Hubble also has been vital in imaging the faint host galaxies
of distant quasars. We focus on the case of the brightest quasar, 3C 273, in
discussing the nature and evolution of these energetic objects. Our next stop
is a colliding pair of galaxy clusters known as the Bullet cluster. Hubble and
the Chandra X-ray Observatory have teamed up to visualize the invisible
dark matter in this colliding cluster and others. In the penultimate lecture, we
voyage to the sites of the most powerful explosions in the universe with the
Swift space observatory. The brief gamma-ray bursts from these explosions
appear to be due to the collapse of very massive stars into black holes at
distances typically exceeding 5 billion light-years. We close the course with
an exploration of the cosmic microwave background radiation imaged by the
WMAP space observatory. As the afterglow of the big bang, this ultimate
EDFNJURXQGIUDPHVDOORIRXURWKHUWRSLFDOLPDJHVLQGLVWDQFHDQGWLPHŶ

4
Lecture 1: Probing the Cosmos from Space
Probing the Cosmos from Space
Lecture 1
F
RUWKH¿UVWWLPHLQKXPDQKLVWRU\LWKDVEHFRPHSRVVLEOHWRYLVXDOL]H
and map a universe that is mostly invisible to the Earth-bound human
eye. Observations of the night sky have now expanded beyond the
(DUWK LQWR VSDFH ZLWK D ÀHHW RI VSDFHFUDIW WKDW KDYH XVKHUHG LQ D QHZ DJH
RI FRVPLF GLVFRYHU\ ,Q WKLV FRXUVH \RX ZLOO H[SORUH WKH VFLHQWL¿F VWRULHV
behind some of the most spectacular space images obtained during the past
20 years. In this lecture, you will be introduced to the key motivations and
limitations in expanding the frontier of space exploration.
Space Exploration
z
When most people think about space exploration, they typically
WKLQNLQ WHUPVRI KXPDQVSDFHÀLJKWDQG WKH1DWLRQDO$HURQDXWLFV
and Space Administration (NASA). But most people might not
realize that humans haven’t been to the Moon or beyond for more
WKDQ\HDUV6SDFHLVH[SHQVLYHSDUWLFXODUO\KXPDQVSDFHÀLJKW
Humans require air, food, and protection from radiation, among
other things.
z
In the 1960s, there was a lot of political motivation for the United
States to go to the Moon, because Russia was trying to do the same
thing. At its funding peak in 1966, NASA was over 4 percent of
the United States’s budget. Today, it’s about 0.5 percent of a
larger budget.
z
7KHPRVWREYLRXVWDUJHWEH\RQGWKH0RRQLV0DUV7KHVFLHQWL¿F
motivation for Mars is clear and important. The Martian surface
is most similar to Earth in the solar system. Evidence of past life
would imply that life is common.
z
But Mars is much farther away than the Moon. To travel to Mars,
it would be about a 6-month journey each way. How do we protect

5
astronauts from radiation for so long? The realistic cost of a human
Mars mission is more than 50 billion dollars.
z
We could avoid the various problems with sending a human by
sending robotic probes instead. Orbiters and rovers are so advanced
that it’s almost the same as being there. This would be more cost
effective than sending humans and also much safer.
z
The most sophisticated probe ever sent to Mars landed successfully
in August 2012. This roving science lab named Curiosity is the size
and weight of a small car. It is equipped with a host of cameras and
instruments, plus a nuclear power source. Its primary purpose is to
determine if Mars once had conditions suitable for life. The total
cost of the Curiosity mission is 2.5 billion dollars.
z
Its top speed is 1.5 inches per second, or about 0.1 miles per hour.
Why is it so slow? When driving a car on Earth, you can see
something in your path and brake almost instantaneous. This is not
so when driving Curiosity on Mars from Earth.
z
When closest, the Earth-Mars distance is 80 million kilometers. The
speed of light is 300,000 kilometers per second. The view through
the Curiosity “windshield” is always about 4.5 minutes old. We
would need more than 9 minutes to stop upon the sight of a big rock
RUKROHLQWKHSDWK$QGLWZRXOGEHVDGLIWKH¿UVW0DUVOLIHEHFDPH
WKH¿UVW0DUVURDGNLOO
z
This illustrates the key fact that distance equals time in astronomy.
Sunlight takes 8 minutes to reach the Earth 150 million kilometers
away. Consequently, we see the Sun as it was 8 minutes ago. In
terms of light travel time, the Sun’s distance is 8 light-minutes.
z
In contrast, Neptune, the most distant planet, is 4 light-hours away.
Although vast, this region is within range of our spacecraft. Indeed,
1$6$ KDV VHQW SUREHV WR DOO RI WKH SODQHWV 7KH À\E\ RI
Neptune by Voyager 2 took 12 years. The dwarf planet Pluto is next

6
Lecture 1: Probing the Cosmos from Space
XSDWDGLVWDQFHRIOLJKWKRXUV,Q1HZ+RUL]RQVZLOOÀ\
by Pluto after a 9-year trip.
z
Our tour of the Sun, planets, moons, and asteroids in this course
will demonstrate how the modern view of the solar system has been
transformed by space probes. In the case of Mars alone, we have
sent 50 probes to the Red Planet since 1960. Orbiters reveal ancient
ZDWHUÀRZVEXWQR0DUWLDQV5RYHUVVWXG\VXUIDFHURFNVWRFRQ¿UP
the evidence of past water. Why has Mars evolved into a cold, dry,
nearly airless desert? Did life form on Mars long ago?
z
How much farther can we directly probe with our spacecraft?
Among all of the space probes ever launched from Earth, the most
distant is currently Voyager 1, which was launched in 1977 on a
PLVVLRQWRÀ\E\-XSLWHUDQG6DWXUQ,WLVQRZOLJKWKRXUVDZD\
OHDYLQJ WKH 6XQ¶V DUHD RI LQÀXHQFH LQWR LQWHUVWHOODU PHGLXP ,W LV
PRYLQJWLPHVIDVWHUWKDQDULÀHEXOOHW
z
But the space between the stars is vast. The nearest star is Alpha
Centauri, which is 4.3 light-years away. Voyager 1 would need
76,000 years to cover that distance. We will not be going to the stars
anytime soon.
The Study of Light
z
Our exploration of the universe beyond the solar system is almost
entirely based on the study of the light emitted, absorbed, or
UHÀHFWHGE\GLVWDQWREMHFWV7KHOLJKWWKDWZHVHHZLWKRXUH\HVLV
just a tiny piece of a broad spectrum of electromagnetic radiation.
This radiation consists of particles called photons.
z
The energy of a photon is inversely tied to its wavelength: Higher-
energy photons have shorter wavelengths. The electromagnetic
spectrum describes photons as function of wavelength. The
spectrum runs from gamma rays (< 0.01 nm) to radio (> 1 mm).
The optical portion of the spectrum is just 400 nm (violet) to 700
nm (red). Each electromagnetic region gives a different view of the

7
universe. Hot stars are brightest in the ultraviolet region, while cool
stars are brightest in the infrared region.
z
This total electromagnetic view makes it to the top of our
DWPRVSKHUH%XWPXFKLVORVWLQWKH¿QDONPWRWKHVXUIDFH,W
is transparent only to optical, radio, and select infrared regions. The
other electromagnetic regions can only be observed from space.
This is the key motivation for gamma-ray, X-ray, ultraviolet, and
infrared space telescopes.
z
The atmosphere also plays a key role in limiting the sharpness of
optical images obtained with ground-based telescopes. Turbulence
scatters and blurs incoming starlight. Our eyes see this phenomenon
as stars “twinkling.” Our eyes have a sky angular resolution of
approximately 1 arc minute, which is equivalent to about 1/30 of
the full Moon width.
z
Telescopes improve on our eyes with bigger lenses and mirrors.
A small telescope has resolving power of about 1 arc second. It
also collects more photons, which allows us to see fainter objects.
The biggest (about 10m) optical scopes could have about 0.01
arc second resolving power, but the atmosphere typically limits
“seeing” to about 1 arc second. This is the key motivation for a
large optical space telescope.
The Great Observatory Program
z
In order to study the universe across the electromagnetic spectrum
with high-quality images, NASA launched four large space
telescopes between 1990 and 2003 as part of its Great Observatory
program. With a wavelength coverage from the ultraviolet to the
QHDULQIUDUHG +XEEOH ZDV WKH ¿UVW RI WKHVH$QG LWV LPDJHV KDYH
been fantastic.
z
The other Great Observatories include Compton (gamma-ray),
launched in 1991 and deorbited in 2000; Chandra (X-ray), launched
in 1999; and Spitzer (infrared), launched in 2003. There have been
over 70 other space telescopes over the past 40 years. Typically,
8
Lecture 1: Probing the Cosmos from Space
these have had
smaller scopes with a
VSHFL¿FSXUSRVH
z
Our Milky Way
Galaxy is a key focus
of the space telescope
ÀHHW 7KH 0LON\ :D\
is 100,000 light-years
across, with 300
billion stars. We live
in the thin disk that
is 28,000 light-years
from the galactic
center. As viewed
from the surface,
the Milky Way disk
is a band of light
across the sky. Space
observations provide
multiwavelength view
of the Milky Way disk.
z
Our tour of the Milky
Way will reveal how
the view from space
casts new light on the evolution of stars and the interstellar medium
in the Galaxy. This view has also enabled a pioneering search for
Earth-sized planets around other stars. Such planets are too faint to
GHWHFWYLDWKHLUUHÀHFWHGOLJKW
z
The Kepler Space Telescope searches for exoplanet shadows
instead. It monitors 150,000 stars for tiny periodic eclipses in
brightness. It is designed to determine if Earth-sized planets are
common in the Milky Way. The results to date indicate that there
are billions of exo-earths in the Milky Way.
Data from the Kepler Space Telescope
indicates that there are billions of exo-
earths in the Milky Way Galaxy.
© Oleh_Slobodeniuk/iStock/Thinkstock.

9
Beyond the Milky Way
z
Beyond the Milky Way is a universe of many billions of galaxies.
Hubble is exceptional at imaging distant galaxies. Hubble has
detected galaxies over 13 billion light-years away. It has witnessed
galaxy evolution consistent with the big bang 13.7 billion years ago.
z
Our space tour beyond the Milky Way will stretch from the
nearby Andromeda Galaxy to the cosmic microwave background
that provides the earliest view of the universe. In the case of
Andromeda, an ultraviolet image obtained with the Galaxy
Evolution Explorer space observatory has revealed a ring structure
indicative of a past collision.
z
The WMAP view from space of the microwave sky looks back 13.7
billion years ago. We see the universe as it was 400,000 years after
the big bang. It was much hotter and denser and was as bright as the
6XQ¶V LQWHULRU HYHU\ZKHUH 7LQ\ GHQVLW\ ÀXFWXDWLRQV WKHQ HYROYHG
into the galaxies of today. This ultimate background frames the
cosmos in distance and time.
z
$V ZH XWLOL]H 1$6$¶V ÀHHW RI VSDFH SUREHV DQG REVHUYDWRULHV WR
explore the universe in this course, it is important to remember that
these instruments are more than just machines. Each one has a team
of hundreds to thousands of technicians, engineers, and scientists
who have typically devoted at least a decade of their lives to the
design, construction, and operation of these sophisticated spacecraft.
z
7KLVGHGLFDWLRQLVUHÀHFWHGLQWKHMR\DQGH[FLWHPHQWRIWKHPLVVLRQ
control team upon learning of the Curiosity rover’s successful
landing on Mars. They know better than anyone the potential for
thrilling new discoveries as Curiosity explores a new frontier on
WKH5HG3ODQHW:KLOHKXPDQVSDFHÀLJKWKDVEHHQFRQ¿QHGWR(DUWK
orbit over the past 40 years, our robotic space avatars like Curiosity
and Hubble have been busy visualizing a universe hidden to our
eyes on Earth.

10
Lecture 1: Probing the Cosmos from Space
Gorn, NASA.
Pyne, Voyager.
Zimmerman, The Universe in a Mirror.
1.
If you had the resources to send a space probe to just one planet in the
solar system, which planet would you choose? Why?
2.
*LYHQ WKH VXFFHVV RI 1$6$¶V ÀHHW RI VSDFH SUREHV DQG REVHUYDWRULHV
ZKDWVKRXOGEHWKHREMHFWLYHVDQGDVSLUDWLRQVRIKXPDQVSDFHÀLJKW"
Suggested Reading
Questions to Consider

11
The Magnetic Beauty of the Active Sun
Lecture 2
D
XULQJLWV¿UVWIHZ\HDUVLQRUELWWKH6RODU'\QDPLFV2EVHUYDWRU\KDV
opened our eyes to the rich diversity and complexity of magnetic
phenomena on the Sun. Its detailed full-disk extreme-ultraviolet
LPDJHVDQGPRYLHVRIORRSVÀDUHVDQGFRURQDOPDVVHMHFWLRQVDUHSURYLGLQJ
new insight on the physics of solar activity, while also illustrating the beauty
and power of ionized gas in magnetic motion. Despite its optical constancy
in the daytime sky to human eyes, the space view shows that the Sun
frequently undergoes magnetic explosions with energies that dwarf anything
in our earthly experience. Most of the time, these explosions result in nothing
more than a nighttime auroral display on Earth. Other planets haven’t been
so lucky.
The Sun
z
Among all of the objects in the sky, the Sun clearly has the dominant
LQÀXHQFH RQ WKH (DUWK ,WV JUDYLW\ JRYHUQV RXU RUELWDO PRWLRQ ,WV
light rules the daytime sky and warms the planet. Life as we know it
on Earth would not be possible without the Sun. As it rises and sets
in the sky every day, the Sun’s optical appearance is a comfortable
constant in our lives.
z
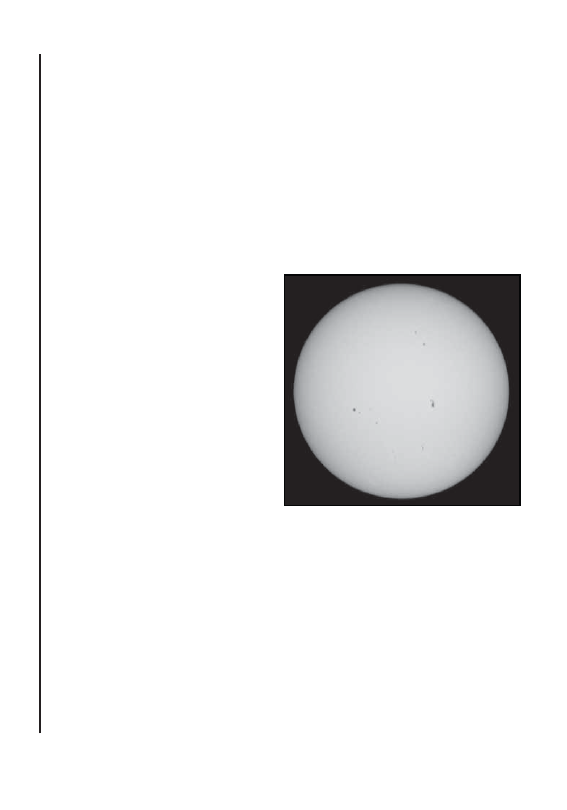
However, when viewed in detail, the Sun’s surface is anything
but constant. It exhibits optical patterns of dark spots that vary
over time. Such sunspots occur in regions where the Sun’s strong
PDJQHWLF ¿HOG LV SRNLQJ WKURXJK LWV VXUIDFH $V YLHZHG LQ WKH
extreme ultraviolet (EUV) from space, the magnetic loops and arcs
associated with sunspots are illuminated by the hot gas traveling
along them. Since its 2010 launch, the Solar Dynamics Observatory
(SDO) has been taking detailed high-time resolution images of the
full solar disk, from optical to EUV wavelengths.
z
A key goal of the SDO is to better understand how the Sun’s
FRPSOH[ PDJQHWLF ¿HOG SURGXFHV WKH VRODU ÀDUHV REVHUYHG LQ
12
Lecture 2: The Magnetic Beauty of the
Active Sun
VXQVSRW UHJLRQV 6XFK ÀDUHV FDQ H[SORGH ZLWK DQ HQHUJ\ RYHU
million times that of a 100-megaton nuclear bomb and spew clouds
of high-energy particles into space.
Sunspots
z
7KH¿UVWVWHSLQPDNLQJVHQVHRIVXQVSRWVLVXQGHUVWDQGLQJKRZWKH
Sun shines. Based on theoretical models and observations of many
stars, astronomers have a pretty good idea of how the Sun’s energy
is produced and how it gets to the surface.
z
Given the Sun’s mass, 4.6-billion-year age, and mostly hydrogen
composition, only
the nuclear fusion of
hydrogen into helium
can account for its
current energy output.
This process involves
smashing hydrogen
nuclei (protons) together.
It can only occur if the
temperature is more than
10 million kelvin and
under high pressure.
z
Core fusion produces
very energetic gamma-
ray photons. Beyond
the core, the Sun is still
very dense. The photons are scattered many times off of matter
particles. This radiative diffusion operates out to 70 percent of the
solar radius.
z
Photon energy takes about 100,000 years to cover about 400,000
kilometers. As the density thins, the photons cover the last 200,000
kilometers to the solar surface in about 3 months through the
process of convection.
Sunspots are optical patterns of dark
spots that occur on the Sun’s surface
and vary over time.
© andrzej5003/iStock/Thinkstock.

13
z
This is similar to a pot of water boiling on a stove. Before heat
is applied, all of the water has the same temperature, and there
is no boiling. Then, heated bottom blobs are lighter than their
surroundings, and they rise. At the top of the pot, the blobs lose
heat, become denser, and sink. In the solar case, hot gas parcels rise
and radiate photons at the surface. Radiating gas parcels then lose
heat and sink.
z
Radiated photons have mostly cooled to optical wavelengths.
The photosphere is the surface region where the photons escape
into space. The temperature of the photosphere is about 5800
kelvin. Detailed optical imaging reveals convection cells in the
photosphere.
z
Sunspots are dark localized regions on the solar surface that
are about 1500 kelvin cooler than their surroundings due to the
suppression of convection. They have lifetimes of days to weeks,
ZLWKVL]HVDERXWWZLFHWKDWRI(DUWK6XQVSRWVKDYHPDJQHWLF¿HOGV
1000 times stronger than Earth. They often appear in pairs where
WKH6XQ¶V¿HOGSRNHVWKURXJKWKHVXUIDFH,WLVWKHVHPDJQHWLF¿HOGV
that locally suppress convection.
z
Sunspots typically last long enough to trace the Sun’s rotation. The
Sun rotates faster at its equator than the poles. Also, the number of
sunspots varies with an 11-year cycle. Sunspot minima start with a
few high-latitude spots. As the maxima approach, more appear at
lower latitudes.
z
How can we make global sense of sunspots? The solar convective
zone is a hot gas of charged particles. Such a gas is an excellent
conductor of electricity. The gas convection and rotation generates
DPDJQHWLF¿HOG$VWKHJDVPRYHVWKHHPEHGGHGPDJQHWLF¿HOGLV
dragged along.
z
7KH6XQ¶VGLIIHUHQWLDOURWDWLRQWZLVWVWKH¿HOGWLJKWHUDQGWLJKWHU$V
WKH¿HOGOLQHVJHWVWDQJOHGQRUWKVRXWKORRSVSRSDERYHWKHVXUIDFH
0RGHOVVKRZWKDWWKH¿UVWORRSVSRSDWKLJKODWLWXGH$VWKH¿HOG

14
Lecture 2: The Magnetic Beauty of the
Active Sun
gets even more twisted, they pop toward the equator. After about 11
\HDUVWKH¿HOGLVVRWZLVWHGWKDWLWUHDUUDQJHVLWVHOI7KHVXQVSRWV
disappear, and a new cycle begins.
z
As the loops pop up, they drag hot gas with them. The evolution
RI WKHVH ORRSV FDQ OHDG WR VRODU ÀDUHV 6XFK PDJQHWLF DFWLYLW\
heats the outer solar atmosphere. Temperature actually rises with
height above the photosphere. The tenuous gas in the Sun’s corona
is over 1 million kelvin. Such hot gas is best observed in extreme
ultraviolet/X-ray.
The Solar Dynamics Observatory
z
The Solar Dynamics Observatory (SDO) is a multiwavelength
space mission designed to study the magnetic activity of the Sun
in unprecedented detail, from its photosphere through the corona.
Its ability to monitor the Sun at high time resolution 24/7 with
sharp full-disk extreme-ultraviolet images is unmatchable from
the ground and makes it possible to study the time evolution
of sunspots and the explosive phenomena associated with their
magnetic activity.
z
The spacecraft itself is about the size of a large sport-utility vehicle.
,QDGGLWLRQWRLQVWUXPHQWVWKDWPRQLWRUWKH6XQ¶VPDJQHWLF¿HOGDQG
its extreme-ultraviolet spectrum, it has four telescopes designed to
image the whole Sun at a resolution better than 1000 kilometers.
z
The SDO can take images in 1 optical, 2 ultraviolet, and 7 extreme-
ultraviolet wavelength bands. Shorter wavelengths sample higher
temperatures at higher solar heights. It can image 8 of these bands
every 10 seconds. The SDO sends back 150 megabytes of data per
second, 24/7. This is 50 times greater than any other NASA mission.
z
The SDO is in an inclined geosychronous orbit at 37,000 kilometers.
7KLVSXWVWKH6'2LQDQDSSUR[LPDWHO\¿[HGVN\SRVLWLRQOLNH79
satellites. It supports a high data rate. In addition, it is possible to
view the Sun 24/7 almost all year. The time-lapse movies that are

15
producible from so many images are extraordinary in revealing
how solar magnetic activity can evolve.
z
2QH RI WKH PRVW VSHFWDFXODU VRODU ÀDUHV REVHUYHG LQ UHFHQW \HDUV
occurred on June 7, 2011. As viewed over 2 hours with the SDO in
WKHNHOYLQH[WUHPHXOWUDYLROHWEDQGWKHUHZDVDVRODUÀDUH
ÀDVK DQG WKHQ DQ HQRUPRXV DPRXQW RI PDWHULDO ZDV EORZQ LQWR
VSDFH DQG IHOO EDFN RQ WKH 6XQ 7KH ÀDUH LWVHOI ZDV RI PRGHUDWH
intensity, equivalent to about a million 100-megaton nuclear bombs.
z
7KHNHOYLQ6'2YLHZVKRZVWKHEULJKWORRSÀDUHDQGWKH
coronal mass ejection (CME). Its darkness shows that much of it
ZDVXQXVXDOO\FRRO7KLVZDVWKH¿UVW6'2&0(ZKHUHPXFKIHOO
EDFNIDUIURPWKHÀDUH,WHMHFWHGDERXW
9
tons of ionized gas into
space at about 1000 kilometers per second, which is equivalent to
10,000 aircraft carriers being hurled at a speed 1000 times faster
WKDQDULÀHEXOOHW
z
:KHUHGRHVWKHHQRUPRXVVRODUÀDUHHQHUJ\FRPHIURP"7KHGHWDLOV
DUH XQFOHDU EXW ZH NQRZ WKDW PDJQHWLF ¿HOGV DUH NH\$V D ORRS
UHJLRQ H[SDQGV DQG VWUHWFKHV ¿HOG OLQHV FRQYHUJH 7KH EUHDNLQJ
and reconnecting of these lines releases energy. This energy, the
ÀDUHGULYHVWKH&0(
Geomagnetic Storms
z
:K\VKRXOGZHFDUHDERXWVRODUÀDUHVDQGFRURQDOPDVVHMHFWLRQV
&0(V")LUVWWKH;UD\VIURPLQWHQVHVRODUÀDUHVFDQUHDFK(DUWK
in 8 minutes, increase the ionization of the upper atmosphere, and
disrupt long-range radio communications. A few days later, if a
CME is directed toward Earth, its high-speed bubble of ionized gas
ZLOOEHJLQWRLQWHUDFWZLWKWKHSODQHW¶VPDJQHWLF¿HOG
z
(DUWK¶V PDJQHWLF ¿HOG LV GXH WR LWV PROWHQ LURQ RXWHU FRUH ,W
PRVWO\GHÀHFWVWKHVRODUZLQG¶VFKDUJHGSDUWLFOHV$GHQVHUIDVWHU
&0( SXOVH FDQ FRPSUHVV WKH (DUWK¶V ¿HOG 7KH ÀRRG RI FKDUJHG
SDUWLFOHV FDQ VWDUW D JHRPDJQHWLF VWRUP 6RPH IROORZ ¿HOG OLQHV
into polar regions. They collide with and ionize air atoms in the
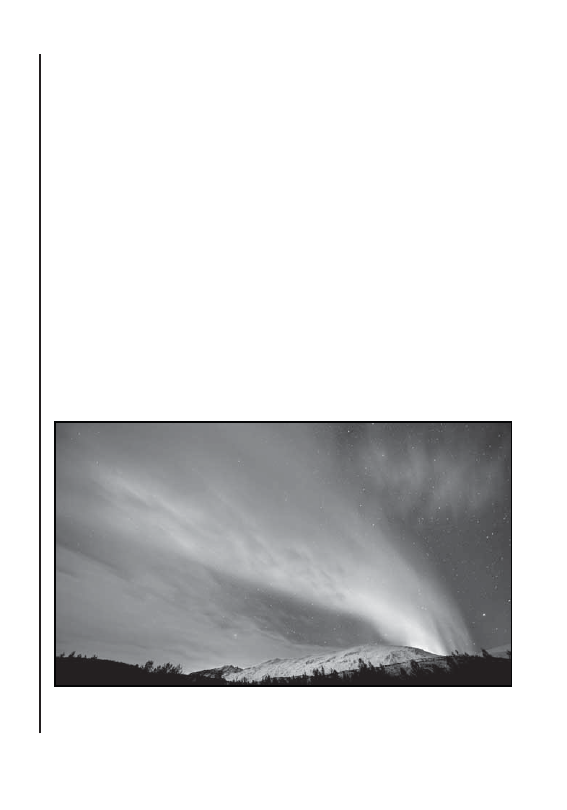
16
Lecture 2: The Magnetic Beauty of the
Active Sun
upper atmosphere. Oxygen and nitrogen ions then recombine and
emit light of different colors. The resulting auroras occur at 100- to
300-kilometer altitudes.
z
Unfortunately, such storms can also create serious problems. For
example, the charged particles can damage satellites. They can
also induce currents in long electric transmission lines. These can
disable transformers and bring down grids.
z
A strong 1989 storm cut power to 6 million people in Canada.
Much stronger storms have occurred in the past and will occur in
the future. The strongest storm in the past 500 years or so occurred
in 1859. The aurora could be seen in the Caribbean, and people
could read by its light in the northeastern United States. There was
widespread disruption of telegraph service. Today, a widespread
blackout could take months or years to recover from.
z
Can we predict a severe geomagnetic storm well in advance? We
know crudely that the fastest, most massive CMEs that produce the
The interaction of the solar wind’s electrons and protons with atoms of the
upper atmosphere causes auroras.
© Bensop/iStock/Thinkstock.

17
strongest storms are more likely when the 11-year sunspot cycle
UHDFKHV LWV SHDN RI VRODU DFWLYLW\ 7KH KRSH LV WKDW ZLWK WKH ÀRRG
of data from the SDO and other solar missions, we can eventually
understand solar activity well enough to predict particularly active
cycles and perhaps provide more than a few days’ warning of a
severe geomagnetic storm. However, it will not be easy given the
HYHUFKDQJLQJFRPSOH[LW\RIWKH6XQ¶VPDJQHWLF¿HOG
Moldwin, An Introduction to Space Weather.
Pesnell, “Opening a New Window on the Sun.”
Wilkinson, New Eyes on the Sun.
1.
Why doesn’t nuclear fusion occur in the solar corona? Why can’t it be
WKHGLUHFWSRZHUVRXUFHIRUVRODUÀDUHV"
2.
,V WKH (DUWK¶V PDJQHWLF ¿HOG RU LWV DWPRVSKHUH PRUH LPSRUWDQW LQ
SURWHFWLQJWKHVXUIDFHIURPWKH;UD\UDGLDWLRQRIDQLQWHQVHVRODUÀDUH"
Why?
Suggested Reading
Questions to Consider

18
Lecture 3: Mars—W
ater and the Search for Life
Mars—Water and the Search for Life
Lecture 3
W
ith an atmospheric pressure less than 1 percent of Earth’s and
temperatures typically well below freezing, the surface conditions
of Mars cannot currently maintain even puddles of liquid water.
However, the existence of riverlike surface features and mineralogical
HYLGHQFH LQGLFDWH WKDW ODUJHVFDOH ÀRZV RI OLTXLG ZDWHU RFFXUUHG RQ 0DUV
GXULQJWKH¿UVWWRELOOLRQ\HDUVRILWVKLVWRU\:KHUHGLGWKHZDWHUJR":DV
there ever life on Mars? Over the past 40 years, NASA has sent a number of
spacecraft to orbit and land on Mars to better address such questions.
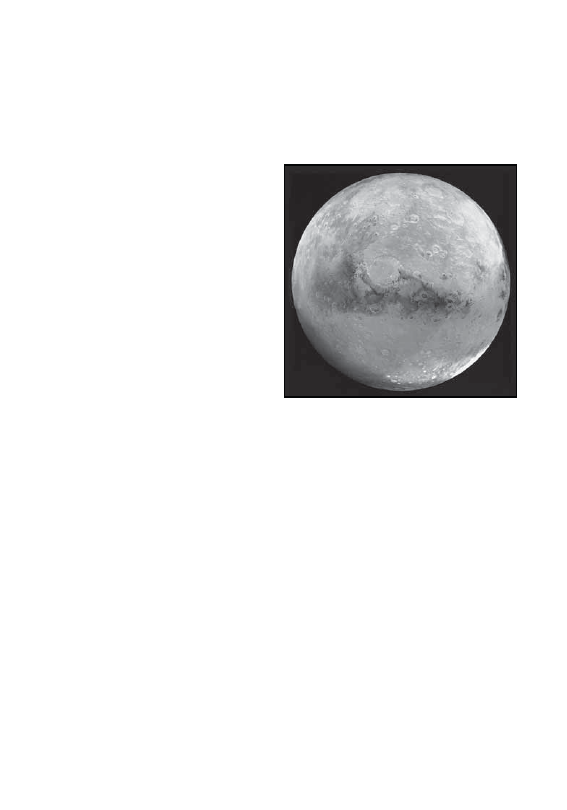
Comparing Earth and Mars
z
One of the best reasons to study other planets in detail is to gain a
better understanding of the physical processes that have shaped the
Earth. Let’s begin by comparing the similarities and differences of
Earth and Mars. The radius of Mars is about half that of Earth. The
total Mars surface area is about equal to the land surface area of
Earth. The mass of Mars is only about 10 percent that of Earth. A
150-pound person on Earth weighs 55 pounds on Mars.
z
Mars is about 1.5 times farther away from the Sun than Earth, and
it receives 2.3 times less sunlight than the Earth. Mars exhibits
seasons like Earth; its rotation axis has a similar tilt. A Martian day
is 24.67 hours, and a Martian year is 1.88 Earth years. Seasons are
most noticeable at the polar caps on Mars.
z
Hubble offers a view of the north cap from early spring to early
summer. As the cap warms, frozen carbon dioxide (dry ice)
sublimates into the air. What remains by summer is underlying
water ice. The cycling of carbon dioxide between caps generates
seasonal winds, which can produce local and global dust storms. As
dust settles, it can change the surface appearance.
19
z
Atmospheric surface pressure is less than 1 percent of Earth. The
composition is 95 percent carbon dioxide, with traces of nitrogen,
argon, and oxygen. The carbon dioxide greenhouse effect only
adds about 5°C of warming. The daily temperature range near the
HTXDWRULVDERXWí&WR&
z
The surface of Mars has
a number of interesting
features that offer clues
to its geological past. The
Mars Global Surveyor
orbiter shows that impact
craters are not distributed
evenly. Most impacts
are from early (about
4 billion years ago) in
Mars’s history.
z
The Tharsis highlands
of Mars have a number
of extinct volcanoes,
including Olympus
Mons, the largest volcano
in the solar system. It has an Arizona-sized width and a height of 26
kilometers. Why is it so big? There are no earthlike plate tectonics
on Mars. Earth’s crustal motions spread the impact of mantle
plumes, so Earth has a chain of volcanic islands while Mars has one
big volcano.
z
Higher-resolution surface views of Mars reveal narrow channels.
The Mars Global Surveyor orbiter views of a 2.5-kilometer-wide
canyon at 12-meter resolution show features that suggest ancient
ZDWHU ÀRZV %\ DJHGDWLQJ FUDWHUV LW FDQ EH GHWHUPLQHG WKDW
channels were carved about 3 billion years ago.
z
Based on these observations, a picture has emerged where Mars
PLJKWKDYHHYROYHGVLPLODUWR(DUWKGXULQJLWV¿UVWELOOLRQRUVR\HDUV
Mars, the fourth planet from the Sun, is
similar to Earth in many ways.
© Digital
V
ision/Photodisc/Thinkstock.

20
Lecture 3: Mars—W
ater and the Search for Life
in terms of its water, atmosphere, and volcanic activity. Indeed, it
may have once had a vast Martian sea in its now northern lowlands.
A substantial carbon dioxide atmosphere could’ve provided enough
warming through the greenhouse effect to keep the water liquid.
z
Mars ended up differently due to its smaller size and mass. This
led to more rapid cooling of its molten interior. Volcanic activity
slowed, which led to less outgassing of carbon dioxide. It would
KDYH DOVR ORVW LWV PDJQHWLF ¿HOG &KDUJHG SDUWLFOHV IURP WKH VRODU
ZLQG ZRXOG QR ORQJHU EH GHÀHFWHG DQG WKLV ZRXOG VORZO\ VWULS
away the atmosphere.
z
Meanwhile, solar ultraviolet light broke up water vapor into
hydrogen and oxygen. The light hydrogen atoms escaped the weak
Mars gravity. Much of Mars’s initial water was lost to space. As the
atmosphere thinned, the remaining water froze out at the poles and
underground. Some of the underground water may still be liquid.
z
The Mars Global Surveyor orbiter has imaged gully systems on some
FUDWHU ZDOOV ,PDJHV UHYHDO VKDUS ÀRZOLNH FKDQQHOV DW PHWHU
resolution. A few have revealed changes over the past few years.
3HUKDSVDQLFHSOXJRQWKHFUDWHUZDOOEUHDNVDQGVDOW\ZDWHUÀRZV
EULHÀ\:DWHUTXLFNO\YDSRUL]HVOHDYLQJDGHSRVLWWUDLOEHKLQG
Sojourner
z
The search for ground-based evidence of past and present water
has been a key science driver for the land rovers sent to Mars over
WKHSDVW\HDUV7KH¿UVWRIWKHVHPLVVLRQVZDV0DUV3DWK¿QGHU
which successfully landed in 1997. It consisted of a base station
equipped with weather instrumentation and a camera, plus a small
10-kilogram rover named Sojourner. It wandered out 100 meters
DPLGVWDQHDUE\URFN¿HOG
z
Equipped with its own cameras and instrumentation, Sojourner
measured the composition and rounded shape of the rocks. The
¿QGLQJV DUH FRQVLVWHQW ZLWK WKH ODQGLQJ VLWH EHLQJ DQ DQFLHQW
21
ÀRRGSODLQ 7KH 3DWK¿QGHU ZDV D ORZFRVW DERXW PLOOLRQ
dollars) proof of concept for bigger rovers.
Spirit and Opportunity
z
The Exploration Rovers Spirit and Opportunity successfully arrived
RQ0DUVLQ6SLULWODQGHGLQWKHÀDWSODLQVRIWKHODUJH*XVHY
crater, while Opportunity set down half the planet away in a small
crater on the plains of Meridiani Planum. These large rovers were
equipped for a much longer and deeper exploration of Mars than
Sojourner, at a total cost of about 800 million dollars.
z
These solar-powered 180-kilogram rovers have a top speed of
2 inches per second. They were designed to overcome holes and
rocks, and they have a variety of cameras and instruments that are
used to analyze rocks.
Spirit, a rover that was launched from Earth in 2003 and arrived on Mars’s
surface in 2004, was tasked with studying the chemical and physical
composition of the surface of Mars.
© Stocktrek Images/Thinkstock.

22
Lecture 3: Mars—W
ater and the Search for Life
z
The rovers had a quick, exciting landing after their 7-month trip.
In space, the rover and lander are encased in a 2.6-meter-diameter
aeroshell. This aeroshell heat shield hits the Mars atmosphere
at 5.4 kilometers per second. Within 4 minutes, the atmospheric
friction reduces the speed by 90 percent. Two minutes before
landing, a parachute opens. Eight seconds before landing, airbags
LQÀDWHDURXQGWKHURYHUDQGODQGHU,WERXQFHVDERXWWLPHVRYHU
DGLVWDQFHRIDERXWWRPHWHUV$LUEDJVGHÀDWHWKHODQGHU
petals open, and the rover drives off.
z
Some of Opportunity’s most photogenic views have come in the
YLFLQLW\ RI 9LFWRULD FUDWHU 7KLV VDQG¿OOHG FUDWHU LV DERXW
meters across and 70 meters deep, with scalloped edges due to
wind erosion.
z
Opportunity traveled about 9 kilometers over 32 months from the
ODQGLQJ VLWH 2SSRUWXQLW\¶V ¿UVW FOXHV WR 0DUV¶V ZDWHU\ SDVW FDPH
at the landing site: rock outcrop on the edge of the small (20-meter)
Eagle crater. The layering seen in the rocks likely formed in moving
water. These rocks are rich in sulfate-salt minerals, which means
that they were soaked with salty water at some point.
z
Millimeter-sized “blueberries” are also found in Eagle crater. These
are found in other places, too, such as in Endurance crater, which
has been imaged by both Opportunity and Spirit. They are similar
to those on Earth; they are made of iron-rich hematite. They are
formed by the percolation of water through sediments.
z
The bottom line is that the rovers have found strong ground-based
evidence for a watery past on Mars. They also have provided
beautiful other-worldly views. Spirit has imaged the Mars sunset,
which has a long twilight due to high-altitude dust.
z
There were initial concerns about dust buildup on rover solar
panels. But despite the thin air on Mars, cleansing winds keep the
power up. The rovers have lasted long beyond their initial 90-day

23
mission. Spirit lasted about 6 years, while Opportunity has traveled
35 kilometers through 2013.
Curiosity
z
The next step in the robotic exploration of Mars is the roving Mars
Science Laboratory named Curiosity. Its key science goals include
compositional studies of rocks and soil in search of organic carbon
compounds and potential biosignatures. Curiosity is 5 times heavier
than Opportunity and has a roving lifetime of up to 14 years with its
nuclear power source. In August 2012, it landed inside Gale crater,
which is 150 kilometers across and over 3.5 billion years old. Mt.
Sharp rises 5.5 kilometers from the center of Gale crater.
z
This landing site was chosen due to its likely geologic history. The
FUDWHU¿OOHGZLWKVHGLPHQWZKHQ0DUVZDVZDUPDQGZHW0DUWLDQ
winds later sculpted out much of the sediment, and Mt. Sharp is the
sedimentary mound that was left behind.
z
Its exposed clay layers allow a study of Mars’s chemical history.
Curiosity can look far and already sees these layers. This is truly the
most photogenic Mars landing site yet. Curiosity has 8 kilometers
to travel to the clay base of Mt. Sharp. It will take 6 to 9 months
to reach this region. It already found evidence of an ancient
VWUHDPEHGRQWKHFUDWHUÀRRUDQGWKHDVVRFLDWHGDQFLHQWURFNKDG
key ingredients for life.
z
Of course, any life that may have once existed on the surface of
Mars is long gone. In addition to a lack of liquid water, the topsoil
appears to be devoid of organic molecules.
z
Although much of the Mars surface appears similar to Earth
desert terrain, such as the Sahara, it could not accommodate even
the hardiest of terrestrial microorganisms today. However, we
have found microbial life-forms inside the Earth that feed off the
hydrogen produced by water interacting with underground rock.

24
Lecture 3: Mars—W
ater and the Search for Life
z
If life formed on Mars long ago when the surface was warm and
wet, perhaps some of it retreated to a warm, wet underground as the
surface evolved into a cold, dry desert. As crazy as this idea sounds,
the study of life on Earth shows that it has an amazing ability to
evolve and adapt to changing environments.
z
It is this possibility of past and present life that continues to drive
the orbital and surface exploration of Mars. It may eventually lead
to humans visiting the Red Planet and extending the search to the
deep underground. If evidence of past or present life is eventually
found on Mars and is shown to have arisen independently of Earth
life, it would strengthen enormously the case for life being common
in the universe.
Bell, Postcards from Mars.
Squyres, Roving Mars.
Taylor,
7KH6FLHQWL¿F([SORUDWLRQRI0DUV.
1.
Should the human colonization of Mars be encouraged or discouraged if
DURERWLFURYHU¿QGVHYLGHQFHRIPLFURELDOOLIHXQGHUWKHVXUIDFH":K\"
2.
How could humans eventually “terraform” Mars to make it more
like Earth?
Suggested Reading
Questions to Consider

25
Vesta and the Asteroid Belt
Lecture 4
B
etween Mars and the gas giant Jupiter are millions of rocky objects
that make up the asteroid belt, which consists of material dating back
to the formation of the solar system 4.6 billion years ago. Due to
WKH VWURQJ JUDYLWDWLRQDO LQÀXHQFH RI -XSLWHU WKH DVWHURLGV ZHUH XQDEOH WR
aggregate into a planet. In 2007, NASA launched the Dawn space probe
to explore the two most massive asteroids, Ceres and Vesta. Its images of
Vesta have revealed a heavily cratered object with a metal-rich core that is
structured much more like a planet than just a big rock. It may well be the
last of the large building blocks that merged in the early solar system to form
the Earth and the other rocky planets.
The Asteroid Belt
z
The asteroid belt can genuinely be considered a fossil of the early
solar system. The oldest rocks on Earth are actually refugees from
the asteroid belt that have fallen from the sky as meteorites. They
collectively set the formation age of the Sun and its orbiting planets,
moons, and asteroids at 4.6 billion years.
z
The nebular model for the formation of the Sun and its planets
begins with the slow gravitational collapse of a dense pocket of
gas and stardust in an interstellar cloud. As the pocket contracts,
it heats up and rotates faster. Most of the mass forms a protostar in
WKHFHQWHU7KHUHVWÀDWWHQVLQWRDGLVNGXHWRJUDYLW\DQGURWDWLRQ
This disk of gas and dust coalesces into planets around the star. This
formation process takes about 100 million years.
z
Let’s focus on the details of planet accretion in the nebular disk.
Gaseous hydrogen and helium constitutes 98 percent of the disk
material. The rest is mostly hydrogen compounds plus some rock
and metals. The inner disk is too warm for water to condense into
solid particles.
26
Lecture 4: V
esta and the
Asteroid Belt
z
Ice particles only form past the “frost line” at about 2.7 astronomical
units. Inside this line, rock/metal particles accrete into bigger and
ELJJHUURFNV&ROOLVLRQVRIWR³PRRQV´OHDGWRWKH¿QDOIRXU
inner rocky planets. Outside the frost line, ices allow much bigger
ice and rock cores to form. Their gravity attracts hydrogen and
helium gas and leads to the gas giants. The solar wind clears out
the remaining proto-gas, and the gas giants become scattered, icy
leftovers to the far outer solar system.
z
6R KRZ GR WKH DVWHURLGV LQ WKH DVWHURLG EHOW ¿W LQWR WKLV SLFWXUH"
Essentially, they are the mostly rocky leftovers from the inner
planet formation. Originally, the belt had an Earth mass, or more
material. With the frost line in its midst, there was some ice among
the rock. Like the inner regions, the belt had likely built up some
Moon-sized objects. But young Jupiter’s gravity acted to increase
their velocities. Faster collisions broke up objects and scattered
many out of the belt. Thus, no planet formed, and the belt reduced
to a tiny sub-Moon mass.
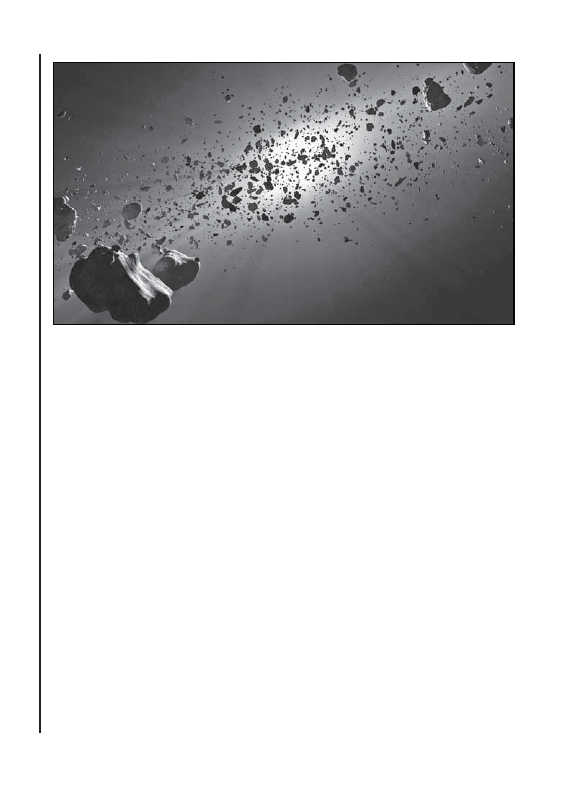
The asteroid belt is located between 2.3 and 3.3 astronomical units from the Sun.
© Johan Swanepoel/Thinkstock.

27
z
Jupiter continues to shape the remaining asteroid belt orbits.
Asteroid counts reveal that certain orbit sizes have few asteroids.
These Kirkwood gaps, discovered by Daniel Kirkwood in 1866,
correspond to orbital periods that are integer fractions of Jupiter’s
orbital period. These lead to resonances that push asteroids to other
orbits.
z
Among the larger asteroids, Ceres and Vesta stand out. Ceres is big
HQRXJKWREHFODVVL¿HGDGZDUISODQHWOLNH3OXWR,WDSSHDUVIURP
Earth to be composed of a rock-ice mix. It probably formed just
EH\RQG WKH IURVW OLQH 7KH 'DZQ VSDFHFUDIW ZLOO SURYLGH WKH ¿UVW
close-up view of Ceres in 2015.
z
Vesta’s diameter is about 15 percent of the Moon’s diameter and
is 500 times farther away. Not even Hubble reveals much surface
detail. Its mass (about 9 percent of the belt) and size indicate its
rocky nature. It is the most massive of the rocky belt asteroids.
Vesta and Dawn
z
Vesta provides the best opportunity for the Dawn spacecraft to
explore the kind of planetesimals that built up the Earth and the
other inner planets. Because the asteroids in the belt are spread out
over a huge volume, they do not present a serious collision threat
for transiting spacecraft. Dawn, about the size of a subcompact car,
has a high-gain antenna and three ion thrusters.
z
Dawn’s mission is the most ambitious mission to use ion propulsion,
which uses solar power to accelerate a beam of xenon ions to 40
kilometers per second. After rocket launch, ion propulsion provides
slow, steady acceleration—unlike chemical propulsion’s quicker,
KDUGHUWKUXVWV,RQWKUXVWLVDOVRWLPHVPRUHHI¿FLHQW2QO\
kilograms of xenon are needed; Dawn used 275 kilograms over 4
years and 2.8 billion kilometers to Vesta.
z
Steady ion thrust led Dawn to an expanding spiral loop trajectory.
Dawn also utilized Mars’s gravity assist to catch up to Vesta. Then,
it utilized ion thrust to slow into survey orbit. Two months later,

28
Lecture 4: V
esta and the
Asteroid Belt
it slowed further into high-altitude mapping orbit (HAMO). Two
months later, it went into low-altitude mapping orbit (LAMO) 210
kilometers above Vesta. From survey orbit to LAMO, resolution
improves by over 10 times.
z
Images from Dawn highlight some of Vesta’s remarkable features.
From these images, it is clear that it has been hit by many other
asteroids over time. The “snowman,” a set of three big craters, is
the most obvious. There is also a huge mountain near the south
pole. Global features are also evident in video views of the entire
surface. Vesta has twice the surface area of California. The grooves
circling most of the equator region are about 10 kilometers wide
and about 5 kilometers deep.
z
The largest of the snowman craters has a diameter of 60 kilometers.
The ages of the large craters are estimated by the number of small
craters within them. The largest two snowman craters are both the
same young age. Perhaps they were formed by a binary asteroid hit.
The smallest snowman crater appears to be even younger.
z
Views of the south pole reveal a mountain at the center of a huge
crater. This crater, named Rheasilvia, has a diameter of about 500
kilometers. Analysis indicates that it is about a billion years old.
It partially covers an older crater spanning about 400 kilometers.
The peak at Rheasilvia’s center rises about 25 kilometers above the
FUDWHUÀRRUPDNLQJLWWKHVHFRQGWDOOHVWLQWKHVRODUV\VWHPQH[WWR
Olympus Mons on Mars.
z
The impacts that formed these two craters had global effects. They
probably account for Vesta’s oval rather than spherical shape. The
equatorial grooves are also likely due to the impact shocks. The
Rheasilvia impact itself came close to shattering Vesta. It excavated
about 1 percent of Vesta out into the asteroid belt. This Vestoid
family of small asteroids has Vesta-like orbits.

29
z
In addition to broad-spectrum images that highlight Vesta’s
WRSRJUDSK\WKH'DZQFDPHUDKDVVHYHUDOFRORU¿OWHUVWKDWDOORZLW
to explore the mineralogical makeup of its surface.
z
Unlike other asteroids, Vesta must have been molten in the past,
due to heating from radioactive element decay and impacts. When
molten, differentiation would have occurred. Heavy metals (iron)
mostly sink to the core, while lighter silicate rocks rise.
z
Dawn indicates that Vesta has a high density consistent with
differentiation. The best model has an iron core of radius 110
kilometers, surrounded by a rocky mantle and a basalt-rich crust.
Thus, Vesta’s structure is like a planet and not an asteroid. This
suggests that Earth didn’t make its own iron core. Maybe it was
mostly delivered by large planetesimals.
Near-Earth Asteroids
z
Due to gravitational interactions and collisions, many thousands
of the millions of asteroids in the belt have been redirected into
the inner solar system. The ones that are big enough to have been
detected from Earth are almost all are over 50 meters in diameter.
7KRVHWKDWKDYHRUELWVWKDWLQWHUVHFW(DUWK¶VRUELWDUHFODVVL¿HGDV
near-Earth asteroids (NEAs). Such redirected asteroids occasionally
impact Earth. The most frequent impacts are by objects too small
to detect from afar. Most of these are very small and burn up
harmlessly in the atmosphere as a meteor.
z
But some are big and dense enough to reach the ground as
meteorites. About 6 percent of all recovered meteorites are actually
pieces of Vesta; they are redirected Vestoids from the Rheasilvia
impact. These howardite-eucrite-diogenite meteorites are matched
to Vesta by spectral similarities. They are iron-poor and are
consistent with the crust on the differentiated Vesta.
z
With thousands of larger NEAs intersecting Earth’s orbit, the odds
are that one of these will eventually make an impact of serious
proportions. The good news is that it is extremely unlikely that any

30
Lecture 4: V
esta and the
Asteroid Belt
of the largest 9000 NEAs detected and monitored to date will hit us
anytime during the next 100 years. However, most of the less-than-
50-meter-wide NEAs are undetected so far.
z
There was excitement about the discovery of an approximately
40-meter-wide NEA in 2012 labeled DA14. Its orbital track put it
within 27,000 kilometers of Earth on February 15, 2013. This is a
record-close approach for its size. This only happens about once
every 40 years.
z
$PD]LQJO\MXVWKRXUVEHIRUHLWVÀ\E\WKHUHZDVDELJVXUSULVH
in Russia. An unrelated, smaller NEA streaked across the sky and
exploded. Many automobile dashboard cameras in Chelyabinsk
FDSWXUHGWKHHYHQW$WLWVSHDNWKHH[SORVLRQZDVEULHÀ\EULJKWHU
than the Sun.
z
The NEA had a 30-kilometer-per-second atmospheric entry 1000
kilometers above China at a shallow angle. About 1 minute later,
it exploded 20 kilometers south of Chelyabinsk. About 3 minutes
later, a shock wave hit the city. Approximately 100,000 windows
were smashed, and more than 1500 injuries needed attention.
z
,WZDVWKH¿UVWPHWHRULQUHFRUGHGKXPDQKLVWRU\WRFDXVHPXOWLSOH
injuries. It had an explosive energy equivalent to 440 kilotons of
TNT, which is 30 times the explosive energy of the atomic bomb
at Hiroshima. A lower-altitude explosion closer to the city could’ve
been devastating.
z
The size of the meteorite was only about 17 meters across, which is
VRPHZKDWVPDOOHUWKDQWKH'$DVWHURLGÀ\E\WKDWRFFXUUHG
a few hours later. Such 17-meter-sized objects hit the Earth
approximately every 100 years.
z
It is amazing to think that the remnants of the planetesimals that
built up the Earth 4.6 billion years ago can still impact the planet.
As revealed by Dawn, Vesta appears to be the only survivor of
the differentiated planetoids that came together to form the inner

31
planets. Jupiter’s gravity prevented Vesta and its shattered brethren
in the asteroid belt from forming their own planet. Instead, they
continue to be a source of Earth-impacting objects that are no
longer massive or frequent enough to shape the planet but certainly
VXI¿FLHQWWRDIIHFWWKHHYROXWLRQRIWKHOLIHIRUPVRQLWVVXUIDFH
Bell, “Dawn’s Early Light”
———, “Protoplanet Close-Up.”
Yeomans, Near-Earth Objects.
1.
Would you expect a 1-kilometer-wide, oblong-shaped asteroid to have
an iron core? Why or why not?
2.
How might the history of life on Earth have been different if Jupiter’s
gravity had not prevented the accretion of the asteroid belt into a planet?
Suggested Reading
Questions to Consider

32
Lecture 5: Saturn—The Rings of Enchantment
Saturn—The Rings of Enchantment
Lecture 5
A
s viewed by the naked eye, Saturn doesn’t appear much different
from the other points of light in the sky, except that it is much brighter
than most and doesn’t twinkle as much as the stars. However, as
viewed through a small telescope, Saturn is revealed as a planet with bright
rings around it. What are these rings? Where did they come from? How old
are they? In order to better answer such questions, the orbiting space probe
Cassini began a detailed study of Saturn’s rings and moons in 2004. It has
obtained spectacular images of the rings in shadow and light from a variety
of orbital perspectives with respect to the planet and the Sun.
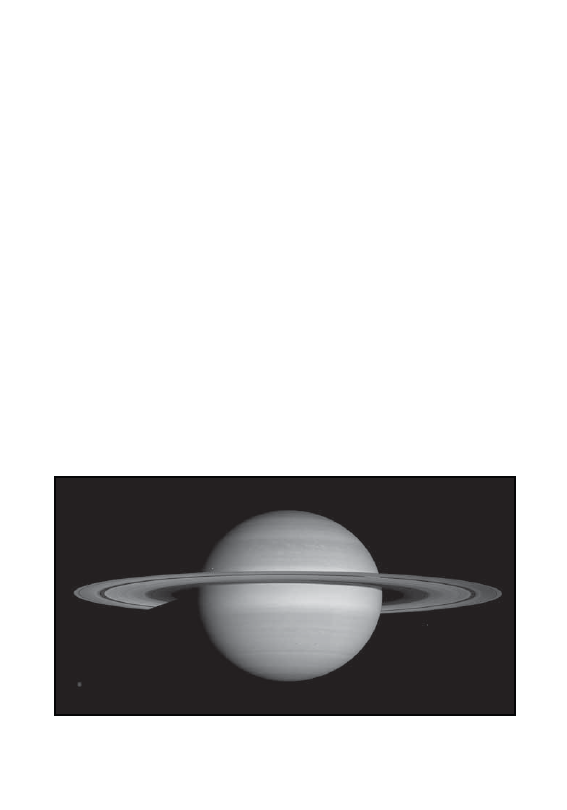
Saturn: The Basics
z
Saturn is about 10 times farther away than the Earth is from the
Sun. Consequently, the Sun is only 1 percent as bright near Saturn
as it is on the Earth. Saturn itself is the second most massive planet
in the solar system. With a radius of nearly 10 times Earth’s, it
dwarfs our planet in size.
z
Like Jupiter, it is a gas giant composed mostly of hydrogen. Its
gaseous outer layer is over 1000 kilometers deep. It has a liquid
(metallic hydrogen) interior surrounding a small rocky core.
2YHUDOO 6DWXUQ LV WKH OHDVW GHQVH SODQHW ,Q IDFW LW ZRXOG ÀRDW LQ
a big enough bathtub. The key point is that there is no “landing”
on Saturn.
z
The size of Saturn is even more pronounced when one considers its
rings. The diameter of the outermost bright ring is over 70 percent
of the distance between the Earth and the Moon. Over 60 moons,
ranging in size from a few kilometers to 5000 kilometers, also orbit
the planet. The nine largest moons (all with diameters greater than
200 kilometers) orbit beyond the bright rings. The rings themselves
consist of a vast number of dust- to boulder-sized chunks of mostly
water ice.
33
z
Why are there rings, and why are no large moons close to Saturn?
At the Roche limit, the planet’s tidal forces can break up a moon.
For a moon orbiting Saturn, the limit is 2.4 times Saturn’s radius.
Saturn’s main rings are all inside its Roche radius.
z
Imagine the scenario of an ice moon approaching Saturn. As it
nears the Roche limit, it is tidally stretched. At the limit, it is
stretched beyond the gravitational breaking point. Broken pieces
join Saturn’s ring particles.
z
The concept behind a ring forming is that different speeds of broken
pieces lead to a ring. Collisions and Roche tidal forces prevent a
moon from reforming. Is this how Saturn’s rings formed—an icy
moon came too close? If so, how long ago did this happen? How
big was the moon? Alternatively, could rings date back to Saturn’s
formation?
z
Such questions require close ring examination from space. The
view from Earth is limited by perspective. As years go by, ring tilt
slowly changes. An edge-on view shows that the rings are very thin.
We can see this edge-on view every 15 years from Earth. This is
due to Saturn’s 27-degree ring tilt and 30-year solar orbit.
Saturn, the sixth planet from the Sun, is encircled by rings that consist of mostly
water ice.
© NASA/JPL/Space Science Institute.

34
Lecture 5: Saturn—The Rings of Enchantment
Studying Saturn Up Close
z
Given Saturn’s billion-mile distance, there have been only a few
efforts to study it up close. The Cassini spacecraft is the fourth
to visit Saturn (after Pioneer 11 (1979), Voyager 1 (1980), and
9R\DJHUDQGWKH¿UVWWRJRLQWRRUELWDURXQGWKHSODQHWIRU
a long-term mission. It carried a secondary probe named Huygens,
which successfully landed on Saturn’s moon Titan in 2005.
z
With an overall size comparable to that of a school bus, Cassini is
the largest interplanetary spacecraft launched to date with a complex
array of instruments, ranging from imagers to spectrometers and a
4-meter high-gain antenna.
z
There are no obvious solar-power panels. The Sun is only 1
percent as bright at Saturn as it is at Earth. Cassini would need
power panels the size of 2 tennis courts. Instead, it is powered by
radioisotope thermoelectric generators, which make electricity
from the radioactive decay of plutonium.
z
Cassini was launched in 1997 with a Titan rocket, and it utilized a
looping gravity-assist trajectory to Saturn. It used Venus, Earth, and
-XSLWHUÀ\E\VWRJDLQYHORFLW\,WFRYHUHGELOOLRQPLOHVLQLWV
year trip to Saturn.
z
It slowed to enter Saturn’s orbit with a 95-minute engine burn. It
passed within 20,000 kilometers of Saturn’s cloud tops. It passed
WKURXJKDULQJSODQHWUDYHOLQJWLPHVIDVWHUWKDQDULÀHEXOOHW,W
led with an antenna to shield its instruments. Since its insertion,
Cassini has completed over 200 orbits.
z
By imaging Saturn’s rings in shadow and sunlight from a variety
of angles at high resolution, Cassini has revealed their structure
in glorious detail. The rings can be seen edge-on with the moon
Enceladus in the foreground. Sunlight casts shadows of the three
main rings on Saturn: A, B, and C. The C ring is closest to Saturn
and casts a faint structured shadow. In images, the darkest shadow
corresponds to the densest B ring.

35
z
Another (almost) edge-on view has the moon Titan in the
foreground. The Sun is shining on Saturn from above the ring
plane. The closest C ring is the top-most shadow. Such edge-on
views emphasize the thinness of the rings: Their average thickness
is only 20 meters.
z
Detailed studies of light interactions with the rings at optical,
ultraviolet, and radio wavelengths makes it possible for Cassini to
estimate their mass and composition. The Sun is too big and bright
IRU D ¿QHVFDOH DEVRUSWLRQ SUREH +RZHYHU &DVVLQL FDQ REVHUYH
bright stars through the rings—for example, Antares can be seen
through the A ring.
z
Scanning the star across rings yields the opacity of the structure.
These results indicate that the B ring has higher opacity than the A
and C rings. This method can also provide indications of clumpiness,
ZKLFKPDNHVPDVVHVWLPDWHVGLI¿FXOW7KH¿QHVWUXFWXUHRIULQJOHWV
and gaps is also evident.
z
Cassini can also probe rings through radio signals to Earth. This
can reveal the ring structure down to a resolution of 10 kilometers.
It can also yield information on the small end of ring particle sizes.
Cassini ultraviolet observations also reveal the most ice-rich ring
regions. The trend from outer to inner rings is from cleaner to
dirtier ice.
z
Thanks to Cassini, we know that clumps of ice particles in the
rings are constantly aggregating and breaking up. Collisions and
tidal forces keep ice clumps smaller than houses. The total ring
mass is about the same as the Saturn ice moon Mimas—although it
could be more depending on ring clumpiness. Mimas looks like the
Death Star in Star Wars due to a 130-kilometer-wide crater on this
400-kilometer-diameter moon. Of Saturn’s seven largest moons,
Mimas orbits closest to the rings.

36
Lecture 5: Saturn—The Rings of Enchantment
Mimas: A Key Player
z
The detailed Cassini observations have been especially revealing in
terms of the dynamical complexity of Saturn’s rings. The images
show that they are subdivided into hundreds of thousands of gaps
and ringlets, most of them very narrow. The origin of this structure
is not yet completely understood. However, key drivers include small
moons within the rings and orbital resonances with the larger moons
outside the rings. It turns out that Mimas itself is a key player.
z
In images from Cassini, Mimas can be seen beyond the A and B
rings. The darker Cassini division is between these rings. Particles in
the inner Cassini division orbit twice for every orbit of Mimas. This
2-to-1 resonance is like repeatedly pushing someone on a swing. It
pushes particles to other orbits and creates the dark gap seen.
z
Many ring features are due to the resonances of Mimas and other
moons. But the Encke gap in the outer A ring has a different origin.
The tiny moon Pan exists within this 325-kilometer-wide gap. Its
gravity keeps the gap mostly free of particles. Cassini has resolved
the walnut shape of this 30-kilometer object. Pan is just rigid
enough to escape tidal breakup. Its gravity wake scallops the inner
edge of the Encke gap. A tinier moon is seen in the Keeler gap on
the outer A ring’s edge. With a size of 7 kilometers, Daphnis also
scallops this 42-kilometer gap’s edges.
z
Cassini has made the rings a lab for many-body gravity physics.
But despite the wealth of information from Cassini, the origin and
age of Saturn’s main rings remain a puzzle. The following evidence
points to a young age of less than a few hundred million years.
o The rings are 90 to 95 percent water ice. Old rings should be
“dirtier.” The constant rain of small meteors tend to dirty the
solar system, but constant ring particle collisions may keep
ice “fresh.”
o The rings should spread out and disperse over time. Small-ring
moons might prolong ring life, but not for long. Old ring age
for Saturn seems unlikely given the dynamic ring activity.

37
z
If the ring age is young, we would need the recent breakup of a
Mimas-mass ice moon inside the Roche limit. This is even more
challenging if the ring mass is indeed greater than Mimas. Why
would this have taken billions of years to happen? Perhaps a
massive comet hit the moon, or the comet itself broke up. But such
massive collisions most likely occurred billions of years ago.
z
Perhaps Saturn’s rings formed 4.6 billion years ago along with
Saturn, with the migration of a Titan-mass ice moon in a proto-
6DWXUQJDVDQGGXVWGLVN2XWHULFHOD\HUVEUHDNXS¿UVWDVWKHPRRQ
moves inside the Roche limit. The rocky core eventually plunges
into Saturn, leaving an ice ring behind.
z
The mystery behind the age and origin of Saturn’s rings only adds
to their enchantment. Perhaps Cassini will still reveal the key
clues to solve their riddles. Perhaps it will require an even more
sophisticated space probe decades from now. Perhaps we’ll never
be certain. In any case, the beautiful complexity of Saturn’s rings
will continue to entice the experts and inspire the novices who
observe them from near and far.
Beatty, “Saturn’s Amazing Rings.”
Benson, Planetfall.
Lovett, Horvath, and Cuzzi, Saturn.
1.
Why doesn’t Earth have a ring system of ice particles/rocks like Saturn?
2.
Describe the night sky as viewed from Saturn’s moon Mimas.
Suggested Reading
Questions to Consider

38
Lecture 6: The Ice Moons Europa and Enceladus
The Ice Moons Europa and Enceladus
Lecture 6
T
he discoveries on Europa and Enceladus by the Galileo and Cassini
space probes have opened our eyes to new possibilities for life in the
universe. Coupled with the discovery of life in extreme environments
on Earth, we now recognize that even frigid, distant ice moons can have
eco-friendly subsurface habitats. As a result, Europa and Enceladus have
EHFRPHKLJKSULRULWLHVIRUIXWXUHVSDFHH[SORUDWLRQ,IZH¿QGHYLGHQFHWKDW
life—even microbial life—has arisen in their subsurface oceans, it raises the
likelihood that life is common throughout the universe. The odds for life
elsewhere would be further increased if it could be determined that earthlike
planets are common in our Milky Way Galaxy. Amazingly, we are close to
answering this long-standing question.
The Moons of Jupiter and Saturn
z
Many of the most fascinating places to visit in the nearby universe
are found in orbit around the giant planets of the outer solar system.
In addition to its rings, Saturn has more than 60 moons in orbit
that are over a kilometer in size. Many of these moons, such as
Enceladus, have an icy surface, and some have ice-rich interiors
based on their measured densities. Such ice moons are common
among the giant outer planets due to the feeble warmth from the
distant Sun and the abundance of water in the solar system.
z
Before the space probe exploration of Jupiter and Saturn, their
moons were expected to be cold and geologically inert, with little
internal heating due to their relatively small size. Given that energy
and liquid water are key ingredients for life, the ice moons of
Jupiter and Saturn appeared to be among the most unlikely places in
the solar system to support an extraterrestrial biosphere. However,
detailed surface studies of the ice moons Europa and Enceladus
with the Galileo and Cassini orbiters have revealed strong evidence
of internal heating and subsurface oceans of liquid water.
39
z
The Galileo images of Europa reveal a young icy surface devoid of
impact craters, but with a patchwork quilt of ridge features, such as
an arctic ice pack. In the case of Enceladus, which has a diameter
one-sixth that of Europa, Cassini has found towering surface
geysers spewing water and organic molecules into space.
Europa
z
Europa is one of Jupiter’s four largest moons. These moons were
discovered by the Italian astronomer Galileo in 1610, shortly after
he began his pioneering sky exploration with a small telescope.
As he charted in his notebook, the moons moved nightly with
respect to Jupiter. This discovery—that celestial objects could orbit
something other than Earth—was key to the eventual acceptance of
the Sun, rather than the Earth, as the center of the solar system.
z
We now refer to these four moons as the Galilean satellites of
Jupiter. Io orbits closest to Jupiter, followed by Europa, Ganymede,
and Callisto. Ganymede is the solar system’s largest moon. Indeed,
LWZRXOGEHFODVVL¿HGDVDSODQHWLILWRUELWHGWKH6XQ*DQ\PHGH¶V
Europa, one of the four large moons that orbits Jupiter, is a little smaller than
Earth’s Moon.
© Lars Lentz/iStock/Thinkstock.

40
Lecture 6: The Ice Moons Europa and Enceladus
diameter is 1.5 times the diameter of Earth’s Moon. Europa’s
diameter is 90 percent that of the Moon.
z
Based on its density, Io is made of rock. Europa is mostly rock
with some ice. Ganymede and Callisto are a mix of rock and
LFH 7KHLU VXUIDFH WHPSHUDWXUHV DUH DOO ORZHU WKDQ í& 7KH\
were all measurable from Earth before space probes, and this fed
expectations that they were geologically dead.
z
7KXV LW ZDV D ELJ VXUSULVH ZKHQ WKH ¿UVW FORVHXS YLHZ RI ,R
SURYLGHG E\ WKH 9R\DJHU -XSLWHU À\E\ PLVVLRQ UHYHDOHG
an active volcano. Its volcanic plume hit an altitude of 100 miles.
,R¶V\RXQJVXUIDFHLVGRWWHGZLWKYROFDQRHVDQGODYDÀRZV6XOIXU
deposits make it look like a rotting orange.
z
What is heating the interior of Io into molten rock? The gravity
between Jupiter and Io is 318 times that of Earth and the Moon.
Io is also being tugged by Europa and Ganymede. This gives Io
a slightly elliptical 1.7-day orbit around Jupiter. This leads to
tidal bulges on Io that oscillate in size and location. This constant
stretching and squeezing heats Io’s interior, which produces 200
times as much heating as radioactive decay.
z
What about the ice moon Europa? It is farther from Jupiter, and
its orbit is less elliptical than Io. But tidal heating could produce
a subsurface ocean. We needed a more detailed study than was
possible with Voyager.
z
The Galileo space probe was designed to orbit Jupiter and conduct
long-term, high-resolution observations of the gas giant and its
moons. It was scheduled for shuttle launch in 1985 and to arrive
in 1987. It was actually launched in 1989 due to delays and the
Challenger disaster. Safety concerns led to the use of a slower,
solid-fuel booster.
z
Galileo utilized a gravity-assist trajectory to Jupiter and Venus
DQG (DUWK À\E\V WR JDLQ YHORFLW\ ,W FRYHUHG ELOOLRQ PLOHV LQ

41
its 6-year trip to Jupiter. Along the way, the main antenna failed
to deploy, and data transmission was adapted to a smaller antenna.
The data rate dropped about 100 times, but most science goals were
still achieved.
z
As Galileo passed very close to Europa during several of its Jupiter
orbits, it exhibited slight perturbations in its trajectory that provided
a better idea of the moon’s gravity and internal density structure. It
has a dense metallic core and a thick rock mantle. It’s topped off
by an approximately 100-kilometer layer of ice and/or water. Ice,
water, and slush have similar densities. Gravity data allows both
subsurface ice and ocean models.
z
Global imaging shows that Europa’s surface is very young. It is the
third shiniest ice moon in the solar system. The few impact craters
it has indicate a cycle of resurfacing, which suggests subsurface
water/ice breakthroughs.
z
Detailed imaging shows Europa’s many surface features. Complex
networks of cracks and ridges are evident. May form, open, and close
GXH WR WLGDO ÀH[LQJ7KH UHGGLVK UHJLRQV DUH LFHSRRU DQG SUREDEO\
salt-rich. This may be due to material brought up from below.
z
Some regions show very chaotic terrain, including huge chunks of
ice scattered like jigsaw puzzle pieces. Ice-pack patterns resemble
the Arctic thawing and refreezing. This is certainly suggestive of
warm water rising from below.
z
Europa’s surface is clearly multi-fractured. This circumstantial
evidence indicates a thin ice crust, perhaps no more than 1 to 10
kilometers in thickness. If this is so, Europa’s ocean could be
100-kilometers deep. It would have twice the water of all Earth’s
oceans. However, there are other possibilities. Perhaps this ocean
froze up years ago. Perhaps it is an ocean of slushy ice rather than
water.

42
Lecture 6: The Ice Moons Europa and Enceladus
z
Galileo found yet one more clue for a liquid ocean. Europa has a
ZHDN PDJQHWLF ¿HOG LQGXFHG E\ -XSLWHU 7KLV UHTXLUHV DQ HOHFWULF
conductor inside Europa. Such a conductor is most likely a salty
liquid ocean.
z
Even if Europa has a tidally heated subsurface ocean of liquid
water, why should this moon be an attractive target to search for
life? Its icy surface is brutally cold, with essentially no atmosphere.
The intensity of sunlight on Europa is only 4 percent that on Earth,
and none of it could make it through even a thin ice crust to the
RFHDQ EHORZ +RZHYHU WLGDO KHDWLQJ PLJKW EH VXI¿FLHQW WR PHOW
some of the rock in its mantle and drive hydrothermal vents on its
RFHDQÀRRU
z
6XFKYHQWVDQGYROFDQRHVDUHIRXQGRQWKH(DUWK¶VVHDÀRRU7KH\
pump hot water and minerals into the ocean. Such “black smokers”
were discovered in 1977. Surprisingly, many vents have thriving
ecosystems, despite total darkness and high pressure on the
VHDÀRRU %DVH EDFWHULD IHHG RII WKH YHQW¶V VXOIXU FRPSRXQGV DQG
chemosynthesis, not photosynthesis, drives the food chain.
z
Could there be such life deep inside Europa’s dark ocean? NASA
has long-term Europa plans. The ultimate goal is ocean exploration
via cryobot. But complexity and cost easily make this decades
away. In addition, contamination by Earth bacteria is an issue.
Galileo ended its mission in 2003 with a dive into Jupiter, thereby
avoiding any chance of contaminating Europa.
Enceladus
z
Enceladus is the sixth largest of Saturn’s moons and has a size
similar to that of England. With a surface that is mostly covered
with fresh ice, it is the shiniest object in the solar system. Prior to
the arrival of the Cassini probe in 2004, Enceladus was basically
regarded as a small, cold ice ball with a curiously young surface.
z
As Cassini made its initial close passes of Enceladus while orbiting
Saturn, the slight alterations in its trajectory indicated that the moon
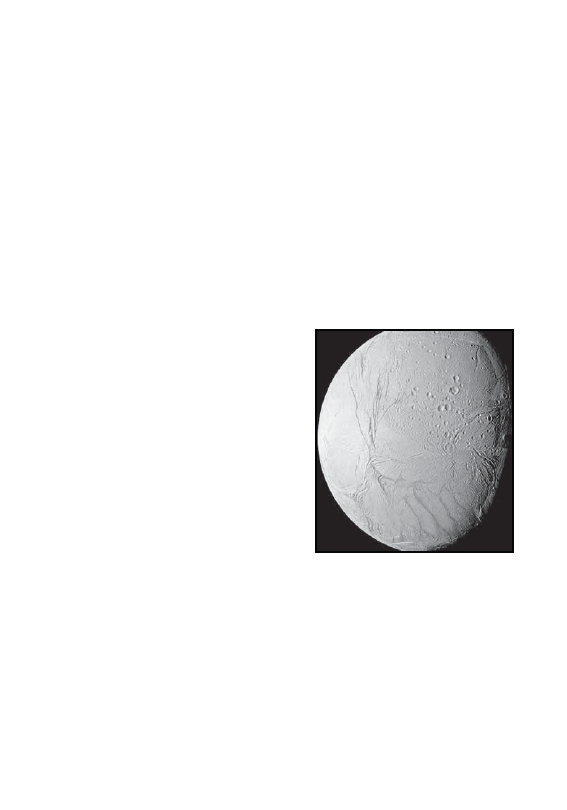
43
is denser than originally thought, with a value greater than that of
Saturn’s other ice moons. Thus, it’s likely that there is a rocky core
underneath the icy exterior of Enceladus.
z
Cassini’s images reveal a variety of surface features. There are
extensively cratered regions in the north. The younger, smoother
VRXWK WHUUDLQ KDV IHZ FUDWHUV &UDFNV ULGJHV DQG ¿VVXUHV DUH
common everywhere. Most prominent are the “tiger stripes” near
the south pole. Cassini infrared images show heat rising from the
VWULSHVZKLFKDUHDERXW&ZDUPHUWKDQWKHí&QHDUE\LFH
z
The big discovery was ice geysers from the stripes. The geyser
plumes reach heights over 100 kilometers. Some of these ice
crystals fall back to the surface. Drifts of fresh surface ice suggest
that they have more than
1,000,000-year lifetimes.
z
Imagine the spectacular surface
view. Most of the geyser ice is
blasted into space with ejection
velocities over half the speed
RI D ULÀH EXOOHW 7KHVH LFH
crystals form Saturn’s outer
ring. Ring maintenance also
supports the notion of long
geyser lifetimes.
z
Like Europa, internal tidal
heating is likely to play an
important role in the geyser
activity observed on Enceladus by Cassini. Enceladus orbits
close to Saturn with a period of only 33 hours, and its orbit is
slightly elliptical. Furthermore, with its rocky core, Enceladus
PD\ KDYH D PRUH VLJQL¿FDQW KHDWLQJ FRQWULEXWLRQ IURP WKH GHFD\
of radioactive elements than would the less-dense ice moons
of Saturn.
Enceladus is the brightest moon
that orbits Saturn.
© Stocktrek Images/Thinkstock.

44
Lecture 6: The Ice Moons Europa and Enceladus
z
Heat leads to subsurface reservoirs of water. These lakes and
oceans are highly pressured within the ice. Any vent to the surface
means an explosive escape. Cassini images show that Enceladus’s
VWULSHVÀH[ZLWKLWVRUELW6XFKWLGDOHIIHFWVRSHQWKHVXUIDFHJDSV
IRUJH\VHUV6XFKVXUIDFHÀH[VXJJHVWVDODUJHVXEVXUIDFHRFHDQ
z
Cassini has made passes through geyser plumes and has measured
their composition with a mass spectrometer. It has found mostly
water, some ammonia and carbon dioxide, and hydrocarbons like
propane and acetylene.
z
Thus, Enceladus has subsurface organics, water, and heat—in other
words, all of life’s raw materials. Samples are blasted into space for
³HDV\´DQDO\VLV7KLVLVDQHDV\À\E\FRPSDUHGWRWKHLFHGULOOLQJ
that has to be done on Europa. A future mission is to collect samples
from Enceladus and return to Earth. The round trip will take less
than 15 years.
z
Cassini’s mission ends in 2017 with a Saturn impact, thereby
avoiding any Enceladus contamination.
Bennett and Shostak, Life in the Universe.
Benson, Planetfall.
Greenberg, Unmasking Europa.
1.
Should the contamination of Europa by Earth bacteria be a serious issue
in planning its exploration for an underground ocean?
2.
If you had the resources to send a fully instrumented orbiter/lander to
either Europa or Enceladus in search of life, which would you choose?
Why?
Suggested Reading
Questions to Consider

45
The Search for Other Earths
Lecture 7
T
hanks to the Kepler mission, we now know that there are many
billions of Earth-sized planets in the Milky Way Galaxy, and it
LV SRVVLEOH WKDW WKH ¿UVW (DUWKVL]HG (DUWKPDVV H[RSODQHW LQ WKH
habitable zone of its host star will be discovered very soon. Within a decade,
we will have a large sample of such exoplanets. The search for other Earths
will then become a hunt for those habitable worlds that are most likely to
support life. It is amazing how much we can learn about exoplanets without
actually imaging them. It is also amazing how much we can learn about the
Milky Way by imaging it in detail at a variety of wavelengths.
Exoplanets
z
The solar system consists of a wide variety of objects orbiting the
Sun. The many billions of smaller ones range in size and character,
from the rocks in the asteroid belt to the ice moons Europa and
Enceladus. The largest ones are the planets, and there are only eight
of them.
z
The king of the planets is Jupiter, and it has more mass than all
of the others combined. Yet this gas giant has no discernable
solid surface below its colorful atmospheric features. Among the
smaller rocky planets, Mars has similarities to Earth, including its
polar ice caps, extinct volcanoes, and thin ice clouds. However, it
has no liquid water on its surface and only a very thin atmosphere
consisting mostly of carbon dioxide.
z
Among all of these worlds, only the Earth has surface oceans of
liquid water, an oxygen-rich atmosphere, and abundant life. Is Earth
just a rarity in the solar system or a rarity in the entire Galaxy?
z
Actually, up until the early 1990s, the only planets known in the
entire universe were located in the solar system. Since that time,
many hundreds of exoplanets have been found around other stars

46
Lecture 7: The Search for Other Earths
using a variety of indirect techniques. Initially, these techniques
were only sensitive enough to detect Jupiter-mass exoplanets.
z
The Kepler space observatory was launched in 2009 with the
primary objective of determining whether or not Earth-sized planets
are common in the Galaxy. Kepler detects exoplanets by observing
and timing tiny eclipses in the brightnesses of stars as any satellite
exoplanets pass in front. During the course of its mission to date,
Kepler has detected thousands of exoplanet candidates, of which
many are Earth-sized. The holy grail in this effort is the detection of
WKH¿UVW(DUWKVL]HG(DUWKPDVVH[RSODQHWRUELWLQJLQWKHKDELWDEOH
zone of its host star.
The 51 Pegasi System
z
It has been necessary to develop indirect methods of detecting
exoplanets because almost all are too faint to directly image in the
glare of their host stars. No ground-based or space-based telescope
is currently capable of imaging an Earth-sized or Jupiter-sized
planet in an Earth-sized or Jupiter-sized orbit around any solar-type
star at optical wavelengths.
© blueringmedia/iStock/Thinkstock.
Mercury
Venus
Earth
Mars
Jupiter
Saturn
Uranus
Neptune

47
z
The Cassini eclipse image of Saturn illustrates the problem. In the
image, there is a faint point-like Earth just beyond the rings. Imagine
trying to see it without Saturn blocking the Sun. Imagine seeing it
from the nearest star 30,000 times farther than Saturn. The optical
IDLQWQHVVLVGXHWRSODQHWVL]HDQGWKHVRXUFHEHLQJUHÀHFWHGVXQOLJKW
z
Only 30 exoplanets (all big and far from a star) have been imaged
(mostly using infrared). The best case is the HR 8799 multiple
exoplanet system. Ground-based detection of the near-infrared
emission revealed a system of three exoplanets in 2008 and a
fourth in 2010. A 2009 study of a 1998 Hubble near-infrared image
FRQ¿UPHGWKHRXWHUWKUHHH[RSODQHWV
z
All four planets have masses about 5 times that of Jupiter. The
innermost planet has an orbital radius 1.5 times that of Saturn. The
planets are especially infrared-bright due to the youth (about 30
million years) of the star system.
z
7KH¿UVWH[RSODQHWDURXQGDVRODUW\SHVWDUZDVIRXQGLQ,W
just so happens that this star, 51 Pegasi, is only 2.3 degrees on the
sky away from HR 8799 near the Great Square in the constellation
Pegasus. Besides being bright, imaging reveals nothing out of the
ordinary. It is through spectroscopy that 51 Pegasi yielded a big
surprise. The star exhibited tiny velocity “wobbles,” which are due
to the gravitational tug of an unseen orbiting planet.
z
Data from 51 Pegasi showed 55 meter-per-second shifts to and fro
over 4.2 days. This is indicative of a 0.5-Jupiter-mass planet 0.05
astronomical units away. This “hot Jupiter” is 8 times closer to 51
Pegasi than Mercury is to the Sun. This was a surprise because
massive planets are expected to form much farther out.
z
Was the 51 Pegasi system the oddball, or is the solar system the
oddball? Most of the initial Doppler exoplanets after 51 Pegasi are
also hot Jupiters. But the Doppler method is biased toward such
systems. Close, massive planets pull harder on stars and have larger
velocity shifts. They also have shorter periods that are faster to detect.

48
Lecture 7: The Search for Other Earths
z
As sensitivity has improved, many more less-massive planets have
been discovered. Over 500 exoplanets have been detected via the
'RSSOHUPHWKRG+RW-XSLWHUVDUHGH¿QLWHO\QRWWKHQRUP%XWLW¶V
YHU\GLI¿FXOWIRU'RSSOHUWRGHWHFW(DUWKPDVVSODQHWV
The Transit Method
z
Given the limitations of the Doppler approach, the transit method is
WKHOLNHO\¿UVWVWHSLQWKHHYHQWXDOGLVFRYHU\RIDQ(DUWKOLNHRXUV
around a solar-type star. Like the Doppler technique, this method
is an indirect one, where the exoplanet is not detected through its
emission of radiation. It involves searching for the small fraction of
stars exhibiting periodic drops in their light output due to transiting
exoplanets in edge-on orbits to our line of sight.
z
In June of 2012, Venus provided a close-up example. It transited
across the Sun’s disk over the course of a few hours. We won’t see
it aligned again on Earth until 2117.
z
The stars are too far away to see as anything but points. Exoplanets
won’t be visible as small, dark disks, but stars will show periodic
brightness drops. In the case of a solar-sized host star, a Jupiter-
sized exoplanet transit dims light 1 percent, and an Earth-sized
transit dims light 0.01 percent.
z
More than 100 transiting exoplanets have been discovered from
ground observation. These are mostly all large, close-in exoplanets.
We need to get above the atmosphere to detect Earth-sized exoplanet
transits. Space also provides continuity for complete orbit coverage.
z
The Kepler space observatory was launched by NASA in 2009
with the primary goal of determining if Earth-sized exoplanets
are common. It is essentially a really big camera designed to take
a picture of the same 150,000 stars every 30 minutes in a single
part of the sky. By monitoring so many stars simultaneously, Kepler
LQVXUHVWKDWPDQ\HGJHRQV\VWHPVZLOOEHVDPSOHG6SHFL¿FDOO\LI
Earth-sized exoplanets are common, Kepler is expected to detect
hundreds over the course of its multiyear mission.

49
z
Kepler is the size of a car, with a 1.4-meter mirror. The heart of
the instrument is its 95-megapixel detector array, which consists of
42 charge-coupled devices each with 2200 × 1024 pixels. Kepler’s
¿HOGRIYLHZFRYHUVVTXDUHGHJUHHVLQWKHFRQVWHOODWLRQ&\JQXV
This is equivalent to about 0.3 percent of the entire sky. It is located
just above the Milky Way to maximize the number of stars without
overcrowding. Each pixel covers 16 square arc seconds on the sky.
z
Kepler was launched into an Earth-trailing orbit around the Sun.
With no Earth occultations, it falls behind at a rate of about 7 days
per year. The spacecraft rolls 4 times per year to keep its solar arrays
pointed at the Sun. It’s always in a position to continue observing
LWV¿HOGRIYLHZLQ&\JQXV
z
Because the transit method is most sensitive to large planets with
VKRUWRUELWDOSHULRGVLWZDVQRVXUSULVHWKDWWKH¿UVWQHZH[RSODQHWV
discovered by Kepler were appreciably larger than Earth with
periods of a few days.
z
,GHQWLI\LQJDQH[RSODQHWFDQGLGDWHUHTXLUHVWKUHHWUDQVLWV7KH¿UVW
WUDQVLWUDLVHVDÀDJDQGWKHVHFRQGVLPLODUWUDQVLWVHWVWKHSHULRG
If the third similar transit occurs at this period, the candidate is
FRQ¿UPHG7KXVDGD\SHULRGWDNHVDPLQLPXPWRWDORIGD\V
WRFRQ¿UP$\HDURUELWDOSHULRGOLNH(DUWK¶VZRXOGWDNH\HDUV
WR FRQ¿UP .HSOHU KDV DOVR GHWHFWHG H[RSODQHW V\VWHPV DURXQG
some stars.
z
As of Jan 2013, Kepler has detected 2740 exoplanet candidates
EDVHGRQLWV¿UVWPRQWKVRIGDWD7KHVHSODQHWVDUHSORWWHGKHUH
as a function of their size and orbital period. With each yearly data
release, there is an increasing number of smaller-sized planets
GHWHFWHG 7KLV WUHQG UHÀHFWV WKH JUHDWHU VHQVLWLYLW\ SURYLGHG E\
D ORQJHU WLPH EDVH WR VXP PRUH LQGLYLGXDO WUDQVLW SUR¿OHV DQG
convincingly detect the shallow light drops of smaller planets.
z
The statistics show that these small planets are common. In fact, 20
percent of solar-type stars have a super-Earth with a period of less

50
Lecture 7: The Search for Other Earths
than 150 days, while 17 percent of solar-type stars have an Earth-
sized planet with a period of less than 85 days.
z
Over time, Kepler will detect more Earths with longer periods.
The bottom line is that the Milky Way has billions of Earth-sized
planets. But are these Earth-sized planets actually like Earth? The
habitable zone is the orbital region where surface liquid water can
exist. Factors include stellar luminosity, planet atmosphere, etc. In
our present solar system, only Earth is in the habitable zone.
z
Earths detected by Kepler so far are closer than Mercury to the
host star. None of them are in the habitable zone. A case in point is
the Kepler-20 planetary system, which consists of two Earth-sized
planets: Kepler-20e and Kepler-20f. They are sandwiched between
WKUHHODUJHUSODQHWV$OO¿YHDUHFORVHUWKDQ0HUFXU\WRWKHLUVRODU
type star. The surface temperatures of Kepler-20e and Kepler-20f
are about 760°C and 430°C, respectively.
z
.HSOHUELVWKH¿UVWWUDQVLWLQJSODQHWIRXQGLQWKHKDELWDEOH]RQH
Kepler-22b orbits 0.85 astronomical units from its solar-type star. If
its atmosphere is like Earth’s, then it has a surface temperature of
about 20°C. If its mass and composition are poorly constrained, it
could be an ocean world.
z
The case of Kepler-22b highlights a key limitation of the transit
method: It typically does not provide a tight constraint on an
exoplanet’s mass, like the Doppler method. If both the size and
mass of an exoplanet can be measured, its overall composition can
be estimated based on the derived density.
z
For example, a water world would be bigger than a similar-mass
rocky planet. Depending on the water world temperature, it might be
a steam world, ocean world, or ice world. Our best bets for life would
be warm rocks or ocean worlds of approximately Earth’s size.
z
There is a current list of 25 potentially habitable exoplanets.
However, none are Earth-sized; all are super-Earths. Most—18 of

51
the 25—are Kepler exoplanet candidates with size only. Over 70
SHUFHQWRIVXFKFDQGLGDWHVZHUHHYHQWXDOO\FRQ¿UPHG
z
The Kepler map of Earth-sized planets as of January 2013 shows
that all are too close to their host stars to be habitable. But soon,
more Earth-sized planets will be found farther out. Some of those
will be in the habitable zone with known masses. The map will
become a target list of warm rocks and ocean worlds.
z
A future telescope will be able to take infrared spectra of these
exoplanets. Such spectra will allow studies of their atmospheres.
We can then compare them to those of Earth, Venus, and Mars.
This could reveal water, ozone, methane, carbon dioxide, etc.
7KH UHODWLYH PL[ RI WKHVH JDVHV ZLOO KHOS XV ¿QG D WUXH (DUWK
Furthermore, they could provide strong evidence of life.
Bennett and Shostak, Life in the Universe.
Kasting, How to Find a Habitable Planet.
Lemonick, Mirror Earth.
1.
Why might it be advantageous for Kepler to search for the transits of
Earth-sized exoplanets around stars that are smaller in size than the Sun?
2.
What other factors besides the distance from the host star should
be involved in evaluating the surface temperature of an Earth-sized
exoplanet? Could the shape of the exoplanet orbit (circular or elliptical)
LQÀXHQFHLWVKDELWDELOLW\"
Suggested Reading
Questions to Consider

52
Lecture 8: The Swan Nebula
The Swan Nebula
Lecture 8
A
s viewed in detail through an optical telescope, many of the dark
clouds in the Milky Way are associated with nebulas of glowing gas.
With a diameter of about 20 light-years at its distance of 7000 light-
years, the Swan Nebula is one of the brightest gaseous nebulas in the sky. It
is part of a star-forming dark cloud complex that stretches over 200 light-
years in length and has a total mass over 200,000 times that of the Sun. The
Spitzer Space Telescope’s infrared view of the entire Swan Nebula region
reveals a wide variety of detail inside its dusty gas clouds that is hidden at
optical wavelengths.
One of the Brightest Nebulas
z
0DQ\RIXVFDQUHFDOOWKH¿UVWWLPHWKDWZHUHDOO\VDZWKHQLJKWVN\
from a truly dark location. The most striking aspect of such a view
is the sheer number of stars observable with the naked eye. Such a
view also makes it clear that the stars are not scattered randomly
DFURVVWKHVN\6SHFL¿FDOO\LWLVKDUGWRPLVVDGLIIXVHEDQGRIOLJKW
with embedded dark patches stretching from horizon to horizon.
This band is called the Milky Way. It is home to the 300 billion
stars and the dark clouds of dust and gas that comprise the disk of
our Galaxy.
z
The constellation of stars known as Sagittarius lies amidst the
Milky Way in the direction of the galactic center. Its brightest stars
are easily recognizable to the naked eye in the form of a teapot. The
Swan Nebula is about 9 degrees or 18 full-moon widths north of the
teapot top.
z
Because the Sun is located inside the dusty disk of the Milky Way,
our optical view of its structure is rather restricted. However,
various techniques, including infrared and radio observations, have
allowed us to map the Galaxy.
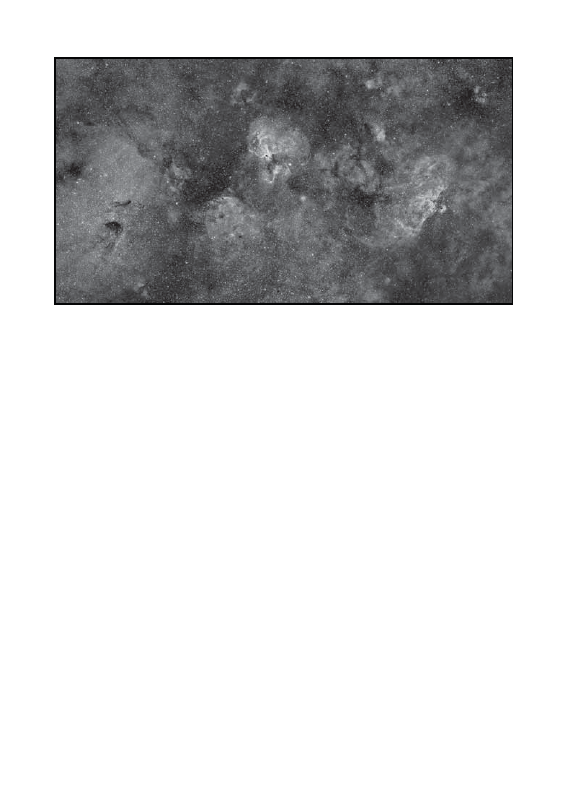
53
z
It has a thin (about 1000 light-years) stellar disk that is about
100,000 light-years across. The Sun is located 28,000 light-years
from the galactic center. A bulge of stars surrounds the center out
to 3000 light-years. A sparsely populated stellar halo surrounds the
disk. Most notable are about 200 globular cluster “star islands.”
z
Through the halo, other galaxies can be observed. We have edge-on
examples of the Milky Way from afar, like NGC 891, which looks
like a thin, dusty stellar disk with a central bulge. Viewed face-on,
such galaxies exhibit a spiral structure.
z
M74 is a classic example of a spiral galaxy. Its spiral arms are traced
in blue by hot, young, massive stars. Its reddish arm regions are due
to nebulas near hot stars. Dusty, dark cloud regions are also evident
in the arms. Clearly, spiral arms are associated with star formation.
z
Radio observations of hydrogen gas support the Milky Way’s spiral
disk structure. Its nearby spiral arms are traced by hot, young stars;
nebulas; etc.
Images of the Swan Nebula taken by the Spitzer Space Telescope show details
of its gas clouds that are usually hidden at optical wavelengths.
© Neutronman/iStock/Thinkstock.

54
Lecture 8: The Swan Nebula
z
The structure of spiral galaxies like the Milky Way and the
association of star formation with the spiral arms are best understood
in terms of density waves. Rotating-disk galaxies develop in areas
of greater mass density. These density waves rotate slower than the
stars and gas outside the waves. Both stars and gas slow down as
they encounter waves.
z
The compressed gas and dust clouds begin star formation. The
young, luminous, hot, blue OB stars are the most evident. Their
ultraviolet radiation heats the nearby gaseous nebulas. As stars and
clouds move past the arm, star formation ebbs. Luminous, blue OB
VWDUVGLH¿UVWLQDIHZPLOOLRQ\HDUV7KXVWKHDUPVVWDQGRXWLQ
blue (along with red nebulas).
z
As viewed at optical wavelengths, the dark clouds associated with
the Swan Nebula in the Sagittarius arm are evident as regions of
lower stellar density. The number of stars seen in these regions is
consistent with the expected stellar foreground for a Sagittarius
dark cloud complex 7000 light-years away.
z
The power of infrared observations to peer inside and beyond a dust
cloud is best shown with a small, nearby, dark cloud that has no
foreground stars. For example, Barnard 68 is 500 light-years away
and 0.5 light-years across. As wavelength increases into infrared,
more stars are visible through the cloud.
z
The cloud’s dust absorbs and scatters optical wavelengths more
HI¿FLHQWO\ WKDQ LQIUDUHG 7KH JUDLQV DUH PRVWO\ VXEPLFURQVL]HG
carbon, oxygen, and silicon particles (smog). Longer-wavelength
infrared is less scattered by such small particles.
z
Infrared is also more sensitive than optical to cool objects. Stars,
planets, and dust can be approximated as blackbody radiators. The
spectra of such objects peak as a function of temperature. With a
surface temperature of 5800 kelvin, the Sun peaks in the optical.
In contrast, a dust-enshrouded protostar could be about 500 kelvin.
Such an object would only be detectable in the infrared.

55
The Spitzer Space Telescope
z
The Spitzer Space Telescope was designed to explore the universe
in the large part of the infrared spectrum that is unobservable from
the Earth’s surface. With instruments optimized for wavelengths
from the near- to far-infrared, Spitzer is sensitive to both stars and
dust at a variety of temperatures within dark clouds. The Infrared
Array Camera (IRAC) is a 256-by-256-pixel-array four-band near/
mid-infrared camera. The Infrared Spectrograph is a mid-infrared
spectrograph suited for composition studies. The Multiband
Imaging Photometer for Spitzer (MIPS) is a smaller-array three-
band far-infrared camera.
z
These instruments are fed by a 0.85-meter-diameter mirror. They
are made of strong, lightweight beryllium and are designed to
operate at low temperatures. Low temperatures are important for
infrared observations. They minimize the contaminating heat of the
WHOHVFRSHRULQVWUXPHQWV$FU\RVWDW¿OOHGZLWKOLWHUVRIOLTXLG
helium coolant is designed to cool the telescope and instruments
down to about 5 kelvin.
z
The Spitzer Space Telescope launched into Earth-trailing
heliocentric orbit in 2003. In this orbit, Spitzer drifts away from
Earth about 0.1 astronomical units per year. It thereby avoids the
250-kelvin Earth-heat in the near-Earth orbit. This helped the
coolant last for almost 6 years, until 2009. Since then, it has been
observed only with the IRAC 3.6- and 4.5-micron bands.
z
The Spitzer observations of the Swan Nebula region were
obtained as part of two large-scale IRAC and MIPS surveys of the
galactic plane that were completed before the coolant ran out. In
a composite of IRAC 3.6- and 8.0-micron and MIPS 24.0-micron
images, the blue, green, and red colors are assigned to 3.6-, 8.0-,
and 24.0-micron brightnesses.
z
The stars typically appear blue due to their relatively high
temperatures. The widespread green glow is due to nebular
emission at 8.0 microns. This arises from the ultraviolet excitation

56
Lecture 8: The Swan Nebula
of large molecules. Diffuse red patches are due to warm dust. The
brightest infrared region corresponds to the optical Swan Nebula.
z
By combining the infrared color information with the morphology
of the gas and dust they illuminate, it is possible to trace the
evolution of star formation in the Swan Nebula region, which can
be broken down into three components associated with the passage
of this cloud complex through the Sagittarius spiral arm: star-form
dark cloud to star-form nebula to remnant bubble.
z
7KH EODFN SDWFKHV LQ WKH ¿UVW UHJLRQ DUH GXH WR GHQVH FROG GXVW
clouds. Thus, they appear dark even in infrared images. This
“dragon” of infrared dark clouds stretches about 150 light-years.
A detailed study shows that 488 young stars are associated with
the dragon. Infrared colors indicate that some have dust shells
and some have disks. These represent various stages in the star-
formation process.
z
The process begins with triggered pockets of gravitational collapse
in a dense cloud. As its gas-and-dust core contracts, it heats up and
becomes infrared-visible. As the protostar contracts, it also rotates
faster. It forms a dusty disk around the protostar with a warmer
infrared signature. Over millions of years, the disk may become a
planetary system.
z
The infrared colors also provide stellar mass estimates.
Interestingly, no massive O stars are among the dragon’s newborn.
Perhaps the formation of O stars occurs after the initial starburst.
They are illuminated and shaped by radiation and winds of many
massive stars. The dragon may become a Swan Nebula if and when
the O stars turn on.
z
A more detailed Spitzer close-up on the Swan Nebula uses a mix of
IRAC 3.6- (blue), 4.5- (green), 5.8- (orange), and 8.0-micron (red)
images. An encircled cluster of 35 massive stars drive the action. It
has 9 massive O stars, each with 100,000 to 1,000,000 times solar
luminosity. O-star winds blow ionized gas at more than 1000 times

57
ULÀH EXOOHW VSHHG 8SVWUHDP RI WKH 2 FOXVWHU DUH ³ERZ VKRFNV´
where O winds hit weaker winds of less-massive stars.
z
O winds and radiation have opened an optical window into Swan.
They also show the sculpting of the interior nebular gas-and-dust
wall. An optical Hubble image reveals the wall in greater detail.
In a close-up on a 3-light-year section at a resolution of 500
astronomical units, O-star evaporation sculpts the cavity down to
dense gas and dust. When O stars turn off in about a million years,
the cavity will remain.
z
Spitzer reveals such a cavity left of the Swan Nebula. This bubble
appears to be 2 to 5 million years old. As it passed the Sagittarius
arm, it may have looked like the Swan. Its O stars are now gone;
its nebula is much fainter. The cavity’s interior is illuminated by
the remaining stars. An epoch of massive-star formation in this
ORFDWLRQ LV ¿QLVKHG %XW WKH EXEEOH¶V H[SDQVLRQ LV WULJJHULQJ QHZ
modest-star formation. Spiral arms may be a global trigger, but star
formation can propagate. Spitzer has revealed many bubbles hidden
from optical view inside the dusty clouds of the Milky Way.
+DUWTXLVW'\VRQDQG5XIÀH Blowing Bubbles in the Cosmos.
Rowan-Robinson, Night Vision.
Waller, The Milky Way.
1.
Why hasn’t the process of star formation already converted all of the
interstellar gas and dust in the Milky Way into stars?
2.
7KH UDGLDWLRQ HPLWWHG QRW UHÀHFWHG E\ OLYLQJ KXPDQV DQG GXVW
enshrouded protostars both peak in what part of the electromagnetic
spectrum?
Suggested Reading
Questions to Consider

58
Lecture 9: The Seven Sisters and Their Stardust V
eil
The Seven Sisters and Their Stardust Veil
Lecture 9
T
he Spitzer image of the Pleiades provides a different perspective on
one of the top sights in the night sky. At optical wavelengths, the
bright blue stars of the cluster stand out amidst wisps of nebulosity.
In the color-enhanced infrared, this veil of stardust takes front stage with
LWV VSHFWDFXODU ZHE RI ¿QHVFDOH VWUXFWXUH7KLV FKDQFH HQFRXQWHU ZLWK WKH
bright blue Pleiades stars has illuminated a cloud of stardust into a shining
infrared veil. It turns out that the most massive stars can have an even more
dramatic effect on their surroundings.
The Pleiades
z
As we scan the night sky, our eyes are naturally drawn to the
brightest stars in search of recognizable patterns. Since ancient
times, various cultures have mapped and navigated the sky in terms
of such patterns. Building up their traditions, modern astronomers
have established a global sky map covered by 88 of these stellar
constellations.
z
Unlike a constellation, a star cluster is a group of stars that are
physically associated with one another. The brightest and most
famous star cluster is the Pleiades. It is easily recognizable to the
naked eye as a tight group of at least 6 stars. It is located about
20 full-moon widths away from the bright star Aldebaran in the
constellation Taurus. The brightest stars in the Pleiades are named
after the Seven Sisters in Greek mythology and their parents. The
cluster has been known since antiquity by many other names,
including Subaru in Japan.
z
As viewed in detail with a ground-based optical telescope, many
more of the thousand stars comprising the Pleiades cluster come
into view. Even more striking is the bluish nebulosity associated
with the brightest stars. When observed at infrared wavelengths
with the Spitzer Space Telescope, this nebulosity appears to be
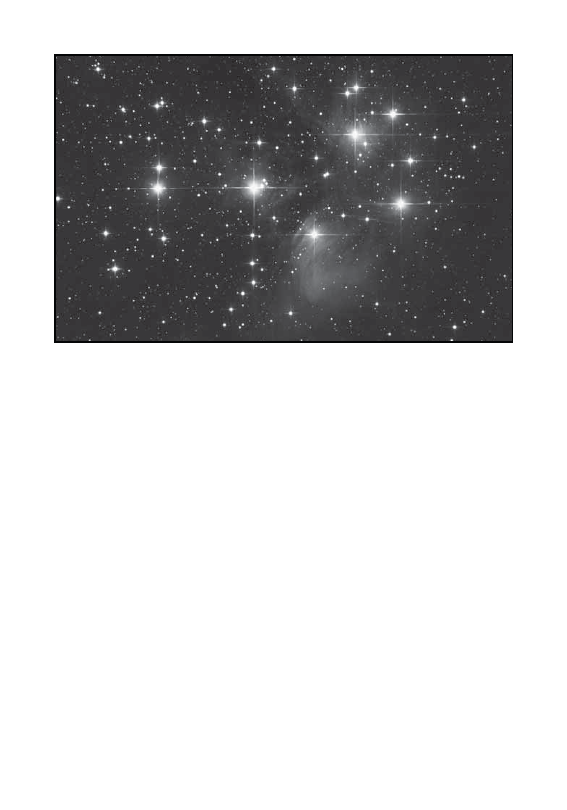
59
pervasive in the Pleiades region. Indeed, it appears that the Seven
Sisters cluster is covered by a wispy veil of stardust heated by the
star cluster.
z
Are we observing a situation where the Pleiades stars are emerging
from their remnant birth cloud of interstellar gas and dust, like the
Swan Nebula? Or is this beautiful image the result of a chance
encounter between the star cluster and an interstellar cloud along
its path?
7KH&ODVVL¿FDWLRQRI6WDUV
z
Given that the Pleiades is bright enough to be easily seen with the
naked eye, one might guess that the cluster is relatively nearby
as compared to the other stars in the sky. However, the apparent
brightness of a star is a function of the star’s distance and its
intrinsic luminosity. How do we sort out these factors?
The Pleiades, an open cluster of young stars, contains more than 1000 stars.
© valeriopardi/iStock/Thinkstock.

60
Lecture 9: The Seven Sisters and Their Stardust V
eil
z
Fortunately, there is a very straightforward way to determine
the distances to nearby stars. It involves stellar parallax: the
measurement of a star’s position change from two points of view.
z
Imagine that we observe a star in January and July, when the Earth
is on opposite sides of the Sun. A nearby star’s position shifts
with respect to distant stars. It can be shown that d(parsecs) =
1/p(arcsec). An arc second is just a tiny angle. The full moon has an
angular extent of 1800 arc seconds. A parsec is equivalent to 3.26
light-years.
z
All of the stars in the sky have p < 1 arc seconds. As d increases,
p decreases beyond measure. Parallax only works for nearby
stars (< 200 parsecs). The Pleiades parallax distance is about 130
parsecs, or about 420 light-years. This makes it one of the nearest
star clusters.
z
Knowing the distances to the Pleiades and other nearby stars makes
it possible to determine their luminosities and relate them to other
stellar characteristics. A star’s brightness decreases with d
2
. For
example, doubling d decreases the brightness by 4 times. If you can
measure the brightness and determine the distance of star, you can
learn the star’s luminosity.
z
You can also measure brightness as a function of wavelength. A
prism can be used to break up starlight into colors, like a rainbow.
Such stellar spectra reveal absorption lines due to atoms and
molecules in the star’s atmosphere.
z
You can classify stars based on their optical spectrum appearance.
The spectral types OBAFGKM are linked to the star’s surface
temperature. Hot blue O-type stars have highly ionized lines, and
cool red M-type stars have molecular lines.
z
Patterns emerge when luminosity and type are compared. Such
plots are called Hertzsprung–Russell (H–R) diagrams. Most stars
are found in the band called the main sequence, which is where stars

61
spend most of their energy-producing lives. Main-sequence stars
are powered by the core nuclear fusion of hydrogen into helium.
z
Stars above and below the main sequence constitute later-life stages.
Main-sequence stars exhibit a spectrum of properties as a function
of type. These properties are determined through observations and
stellar models. Type-O main-sequence stars have the most mass,
the most luminosity, and the shortest lives. Type-M main-sequence
stars have the least mass, the least luminosity, and the longest lives.
The Sun is a middle-aged G main-sequence star. It has lived 4.6 of
its expected 10-billion-year main-sequence life.
z
In essence, the H–R diagram can be used to chart the life histories
of stars. Because the stars in a star cluster are typically all born at
about the same time, the main-sequence population in their H–R
diagrams can reveal the cluster age.
z
The Pleiades H–R is missing O and some B main-sequence stars.
These stars have used up their core hydrogen and have evolved
off the main sequence. The longest lived of these “missing” main-
sequence stars gives the cluster its age. The Pleiades main-sequence
“turnoff” age is about 100 million years.
z
The Pleiades is one of about 1000 “open” star clusters found in the
Milky Way. These open star clusters are loosely bound by gravity
as they form in their natal, or birth, cloud. The cluster gradually
disperses as it orbits in the Milky Way.
z
The youngest star clusters are associated with natal gas and dust.
The Rosette Nebula cluster is only a few million years old. Its
O stars excite the glowing nebular gas. The double cluster h and
c (chi) Persei is about 10 million years old. Its many stars are a
spectacular sight through a small telescope. It’s about 2 full-moon
widths across and 7000 light-years distant.
z
The nearest star cluster is the Hyades; it is 150 light-years away.
Its approximately 300 stars are about 18 full-moon widths from

62
Lecture 9: The Seven Sisters and Their Stardust V
eil
the Pleiades. Its age is about 650 million years with no O or B
main-sequence stars. One of the oldest open clusters at 7 billion
years is NGC 188. Its 150 stars are clustered at a distance of 5000
light-years. It is missing O, B, A, and some F main-sequence stars.
Cluster differences are easily seen in a composite H–R diagram. As
the cluster ages, main-sequence turnoff moves steadily down the
main sequence.
z
With an H–R lifetime of 100 million years, the Pleiades cluster
is well past the age when star clusters typically escape from
and disperse the cloud of gas and dust from which they formed.
However, the blue nebulosity in optical images of the Pleiades does
not appear to be a distant background or foreground.
z
It tends to be brightest near the brighter stars. It is a textbook example
RIDUHÀHFWLRQQHEXOD,WLVSURGXFHGE\DFORXGRIGXVWJUDLQVQHDU
a star. It redirects some incident starlight toward the observer. A
brighter star with a closer dust cloud leads to a brighter nebula.
z
The Pleiades stars are within a light-year or so of a dust cloud. Its
blue color comes from the fact that its dust grains scatter blue light
more than red light. The shorter blue wavelengths are closer in size
to the tiny grains that are doing the scattering. There is a similar idea
behind the Earth’s blue sky: Air molecules scatter blue light across
the sky. This is also why a rising or setting Sun often appears red.
z
$ERXWUHÀHFWLRQQHEXODVKDYHEHHQLGHQWL¿HGLQWKH0LON\:D\
The photogenic Witch Head Nebula is another famous example. It
is about 900 light-years distant and is much fainter than the Pleiades
Nebula. It is illuminated by the blue supergiant star Rigel, which is
about 40 light-years away from the Witch Head Nebula.
Merope
z
7KH 3OHLDGHV UHÀHFWLRQ QHEXOD WHOOV XV WKDW WKHUH LV GXVW LQ FORVH
proximity to the cluster. This optical view of the blue starlight
scattered by the dust is most sensitive to the grains closest to the
brightest blue stars. In contrast, the infrared view from the Spitzer

63
Space Telescope provides a deep image of the radiation emitted by
the warm dust throughout the Pleiades region.
z
The Spitzer image covers 1 square degree, or about 4 full moons,
on the sky. It is a composite of images taken with Spitzer’s mid-
infrared IRAC and far-infrared MIPS cameras. It includes images
in the 4.5-, 8.0-, and 24.0-micron bands. Blue, green, and red colors
are assigned to these wavelengths, respectively.
z
Stars typically appear blue due to their relatively higher
temperatures. The diffuse green light we see throughout the Pleiades
region arises from large molecules called polycyclic aromatic
hydrocarbons (PAHs). Ultraviolet starlight excites PAHs to glow at
wavelengths near 8.0 microns. The red regions are due to the warm
dust emission. Various yellows and oranges are dust-PAH mixtures.
z
$ZLVS\¿ODPHQWDU\VWUXFWXUHVHHPVFRPPRQSODFHWKURXJKRXWWKH
Pleiades nebulosity. The origin of this structure is not at all clear.
The Pleiades star Merope is amidst the brightest reds and yellows
in the Spitzer image that correspond to the densest dust and gas in
the nebulosity.
z
A close-up of the 1.5-light-year region around Merope reveals the
¿ODPHQWVLQJUHDWHUGHWDLO:HFDQVHHIHDWXUHVGRZQWRUHVROXWLRQV
of about 400 astronomical units. This is suggestive of a nebular
interaction with the star.
z
Optical images show a bright knot (IC 349) close to Merope. It is
located just 3500 astronomical units south of the star. Hubble has
imaged IC 349 at a resolution of about 10 astronomical units. At the
top if the image are scattered starlight rays due to telescope optics.
7KH WLQ\ UHÀHFWLRQ QHEXOD VKRZV DPD]LQJ VPDOOVFDOH VWUXFWXUH
Long, thin tendrils extend past its wispy main body. Smaller grains
in the body are slowed by radiation pressure. The picture indicates
that the cloud is moving with respect to the star.

64
Lecture 9: The Seven Sisters and Their Stardust V
eil
z
The apparent motion of IC 349 relative to Merope is consistent
with the velocities measured spectroscopically through the Doppler
effect for the other Pleiades stars and the gas associated with the
UHÀHFWLRQ QHEXORVLW\ 7KLV WHOOV XV WKDW WKH FOXVWHU LV PRYLQJ DW D
speed of about 11 kilometers per second relative to the nebula.
Given the cluster motion and its age, it is not a natal cloud. Pleiades
is actually just passing through a diffuse cloud region.
z
$ GHHS ZLGH¿HOG YLHZ VKRZV RWKHU IDLQW FORXGV$V LW PRYHV LW
may brighten some of these in less than a million years. Over time,
hundreds of millions of years, its B stars will evolve off the main
VHTXHQFH7KHUHÀHFWLRQQHEXODSRWHQWLDOZLOOGHFUHDVHDFFRUGLQJO\
z
Also, over such times, it will travel far through the Milky Way. It will
complete a galactic “orbit” every 200 million years. It will interact
with denser clouds and other stars. Over time, gravity will peel off
star after star. Within a few orbits, the Pleiades is likely to disperse.
z
The Sun was likely born a star cluster member about 4.6 billion
years ago. It is now orbiting solo at 240 kilometers per second
around the galactic center. Its brothers and sisters evolved or
dispersed long ago.
Pasachoff and Filippenko, Cosmos.
Rowan-Robinson, Night Vision.
Waller, The Milky Way.
1.
Describe the differences in the optical and infrared views of the Pleiades
and its surroundings if the cluster were 1 billion years older.
2.
Besides measuring its stellar parallaxes, how else could we determine
that the Pleiades is relatively nearby?
Suggested Reading
Questions to Consider

65
Future Supernova, Eta Carinae
Lecture 10
T
he Carina Nebula is a vast molecular cloud region where the births
and deaths of many massive stars over the past few million years
have sculpted and illuminated a complex nebular structure. With a
luminosity several million times that of the Sun, Eta Carinae is the nearest
example of a rare type of star whose brightness can vary dramatically over
time due to large mass-loss episodes. As viewed by Hubble, Eta Carinae
is surrounded by an expanding dumbbell-shaped debris cloud that was
produced by a violent eruption in 1843. Such outbursts are merely a prelude
to its eventual explosion as a supernova sometime during the next several
hundred thousand years.
The Births and Deaths of Stars
z
The trajectory of a star’s life and death is largely determined by its
initial mass. Observations and theoretical models show that stars
born with more than 8 solar masses evolve quite differently off
the main sequence than those of lower mass. Over 99 percent of
the stars in the Milky Way, including the Sun, belong to this latter
group. After nuclear fusion has exhausted the core hydrogen in
these stars, they evolve into red giants.
z
The Sun will undergo this transformation in about 5 billion years.
The core begins to contract slowly because there’s not enough
nuclear energy being produced to hold off gravity. As the core
contracts, it heats up. Then, the shell of hydrogen around this
now-helium core gets hot enough to ignite hydrogen into helium
fusion. Eventually, millions of years later, this helium core, which
continues to contract slowly, will become hot enough to burn
helium into carbon and produce energy.
z
With these energy sources, the solar surface will expand out to
almost Earth’s orbit. During this expansion, the Sun’s surface will
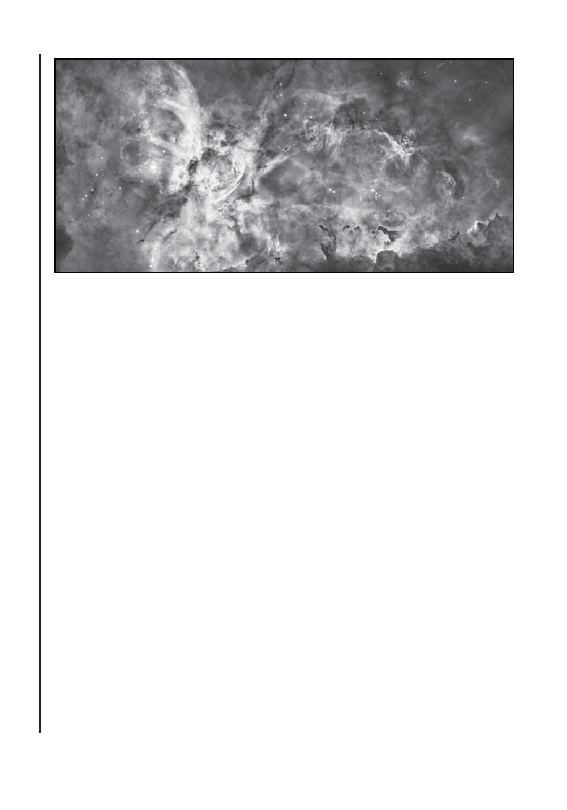
66
Lecture 10: Future Supernova, Eta Carinae
redden as it cools from 6000 to 3000 kelvin. The Sun will be a red
giant for about 1 billion years.
z
7KH6XQZLOOVSHQGLWV¿QDOIHZPLOOLRQ\HDUVDVDUHGJLDQWSRZHUHG
by helium fusion into carbon in a shell around the core. This leads
to thermal pulses that will blow off the Sun’s outer layers. The Sun
will lose about 40 percent of its mass as a red giant. Its exposed
core will cause this expanding gas shell to light up as a nebula.
z
Such objects are called planetary nebulas—for example, the Ring
Nebula. There are many of these in the Milky Way, despite their
short life of about 50,000 years. This is consistent with 99 percent
of all the stars in the Milky Way evolving this way.
z
What’s left behind after the planetary nebula stage is a faint, dense,
carbon-rich white dwarf star. It’s about the size of Earth with the
mass of about half that of the Sun. In fact, a teaspoonful would
ZHLJKVHYHUDOWRQV,WVORZO\FRROVOLNHDG\LQJ¿UHSODFHFRDO
z
In contrast, stars of 8 solar masses or more evolve much more
dramatically off the main sequence and leave behind much denser,
compact objects. In these cases, core hydrogen fusion is followed
Eta Carinae, one of the most massive evolved stars in the Milky Way, might be
our next supernova.
© Stocktrek Images/iStock/Thinkstock.

67
by core helium fusion, followed by a sequence of carbon, neon,
oxygen, silicon core fusion. When such a star becomes a supergiant,
the surface expands beyond the size of Mars’s orbit. Such supergiant
luminosities can reach 1,000,000 times that of the Sun. Supergiant
lifetimes are only about a million years.
z
If we could take a snapshot of the deep interior of such a star during
its last hour, it would look just like an onion. In its deep insides, it
would have mostly an iron core encircled by silicon, oxygen, neon,
carbon, helium, and hydrogen fusion shells.
z
Iron does not produce energy through fusion. With no core energy
source, gravity is unopposed. In less than 1 second, the core
collapses. It goes from Earth-sized to city-sized. Neutrinos come
RXW ZLWK D ÀRRG RI HQHUJ\ DQG WKH LQQHU SDUW RI WKH VWDU LV QRZ
collapsing. The remaining gas is collapsing down. This collision
produces an outgoing shock wave that ripples through the star and
blows it away. It reaches the surface in just a few hours. The visible
result is a supernova explosion.
z
Most supernovas leave behind tiny, dense, neutron-rich cores.
These neutron stars typically have masses of about 1.5 solar masses
and diameters of about 25 kilometers. A teaspoonful would weigh 1
billion tons on Earth.
z
Such a core-collapse, or Type II, supernova can achieve a
luminosity of up to 1 billion Suns at maximum brightness. They
rise to this maximum within a few days, and then they fade slowly
over subsequent weeks and months.
z
Hundreds of supernovas are seen in other galaxies every year. The
nearby galaxy M51 has had two since 2005. Supernovas stand out
even at distances of many millions of years. Their rarity indicates
that there is a Milky Way Type II supernova every 100 years. The
last one widely seen on Earth was in 1604.

68
Lecture 10: Future Supernova, Eta Carinae
Eta Carinae
z
As one of the most massive evolved stars in the Milky Way, Eta
Carinae is a leading candidate to be our next supernova. It is a
prototypical example of a luminous blue variable (LBV) star. Such
blue supergiants are not only large, massive, and luminous, but they
also can undergo dramatic variations in brightness that are extreme
enough to almost mimic a supernova.
z
LBV stars are rare. Only about 20 are known in the Milky Way.
The Pistol Star is an LBV that is located near the galactic center. Its
near-infrared Hubble image reveals expanding gas shells. This is
indicative of giant eruptions 4000 and 6000 years ago. It lost about
10 of its over 100 solar masses in these events.
z
At 7500 light-years away, Eta Carinae is closer to Earth than the
Pistol Star. And with much less dust, it is easily studied at optical
ZDYHOHQJWKV,WZDV¿UVWFDWDORJXHGLQ$WWKLVWLPHLWKDGD
rather modest naked-eye brightness. By the 1700s it became one of
the brightest stars in the whole constellation Carinae. By 1843, it
was the second brightest star in the sky. At that time, it reached its
peak luminosity of about 30 million Suns. By the 1860s, it faded
below naked-eye view. It then became naked-eye again in the 1950s
and continues brightening.
z
7KH ¿UVW HYLGHQFH WKDW (WD &DULQDH ZDV PRUH WKDQ D VLPSOH SRLQW
source came from a ground-based image in 1945. Subsequent
images over the years showed an expansion in its associated
Homunculus Nebula. Imaging this nebula in detail was a key goal
of Hubble when it was launched. With Hubble, we could apply
observations in terms of resolution down to scales of about 0.05
of an arc second. This resolution shows expanding bipolar lobes of
dust and gas that enshroud Eta Carinae.
z
An instrument on board the telescope called the Space Telescope
Imaging Spectrograph allows us to take spectra of objects across the
nebula. This indicates that lobes are expanding over 600 kilometers
per second. Lobe size and expansion velocity are consistent with its

69
1843 outburst. Abundances indicate that several solar masses were
ejected in 1843. Eta Carinae is currently losing 0.001 solar masses
per year.
z
Among the many questions posed by the Hubble observations and
others are why is Eta Carinae losing so much mass, and why was
the 1843 outburst bipolar? LBV stars like Eta Carinae that have
masses well over 100 solar masses have very strong stellar winds.
Their hot fusion cores produce huge amounts of energy—so much
energy that the energy itself exerts a radiation pressure on the gas.
How pressure build-up can lead to outbursts is not clear.
z
%LSRODU RXWÀRZ SDWWHUQV DUH QRW XQXVXDO LQ DVWURQRP\ 6RPH
planetary nebula, such as Hubble 5, exhibit such structure.
3HUKDSV WKLV NLQG RI ELSRODU VWUXFWXUH LV GXH WR WKH PDJQHWLF ¿HOG
RI WKH ZKLWH GZDUI VWDU RU LW LV SRVVLEOH WKDW WKH JUDYLW\ ¿HOG KDV
a companion star. Many ideas have been offered to explain Eta
Carinae’s bipolar lobes, ranging from its asymmetric burst to the
notion of a circumstellar disk around Eta Carinae.
z
In addition, there is strong evidence that Eta Car is a binary object.
Its spectral and light curve variations show a 5.5-year periodicity.
This indicates that Eta Carinae is actually a binary of a 30-solar-
mass star and that the main body is a 100-solar-mass star. They’re
orbiting around each other at a distance of about 15 astronomical
units. This notion is unresolvable due to obscuration, even in the
Hubble image.
z
The space telescope Chandra took an X-ray image that reveals
DQ RXWHU ULQJ RI KRW JDV DURXQG WKH ELSRODU RXWÀRZ $ OLJKW
year-diameter ring suggests that there was another outburst in Eta
Carinae over 1000 years ago. The reason it’s shining so brightly
now in X-rays is perhaps because it’s being heated by some of the
high-velocity gas from the 1843 outburst slamming into it.
z
Interestingly, it is possible to better understand Eta Carinae through
observations of the 1843 outburst itself. We can effectively go back

70
Lecture 10: Future Supernova, Eta Carinae
in time to study such an explosive event through a phenomenon
NQRZQ DV D OLJKW HFKR 5HFDOO WKH 3OHLDGHV UHÀHFWLRQ QHEXOD LQ
ZKLFKWKHGXVWJUDLQVQHDUWKHVWDUVUHÀHFWWKHLUOLJKW7KHEULJKWHVW
patches are located a few light-years from the stars. Thus, the nebula
light is about a year older than the starlight. The starlight among the
stars in the Pleiades is more or less constant, so the nebular light is
more or less constant.
z
In terms of brightness, the Eta Carinae 1843 outburst has been
considered the prototype for a class of very luminous extragalactic
outbursts known as “supernova impostors,” which reach peak
brightnesses similar to faint supernovas, but the star remains after
the subsequent fade. They typically exhibit outburst spectra similar
to that of LBVs.
z
How are Eta Carinae, LBVs, and supernova impostor outbursts
linked? This question provides great motivation to improve our
understanding of this kind of linkage. Perhaps we can better predict
the timing of Eta Carinae’s explosion into a supernova. Is it years or
hundreds of thousands of years in the future?
Kaler, The Hundred Greatest Stars.
Mazure and Basa, Exploding Superstars.
Wheeler, Cosmic Catastrophes.
1.
Is it possible that there may have been galactic supernovas over the past
several hundred years that went unobserved by anyone on Earth?
2.
What will happen to Eta Carinae’s binary companion star when Eta
Carinae explodes as a supernova?
Suggested Reading
Questions to Consider

71
Runaway Star, Zeta Ophiuchi
Lecture 11
B
ecause the lifetimes of O stars are so short, we don’t expect
WR ¿QG RQH IDU IURP WKH JDV FORXG RU VWDU FOXVWHU LQ ZKLFK LW ZDV
born. However, 15 degrees north of Antares, Scorpius’s bright red
supergiant, is a very bright O star named Zeta Ophiuchi in splendid isolation.
A beautiful clue to its origin can be found in an infrared image obtained with
the Spitzer Space Telescope. Based on its age and the velocity and direction
of its motion, the star was born as a member of the Upper Scorpius cluster
located in Antares.
Runaway Stars
z
The primary component to the motion of most of the stars and gas
clouds in the disk of the Milky Way is the rotation of the Galaxy.
Because the Sun participates in this motion, it is important to
recognize that the measurement of velocity is a relative one and is
usually referenced to the Sun or the galactic center or a group of
QHDUE\VWDUVFROOHFWLYHO\GH¿QHGDVWKHORFDOVWDQGDUGRIUHVW/65
z
The Sun is orbiting the galactic center at an average velocity of
about 240 kilometers per second. The Sun is moving about 10
kilometers per second relative to the LSR. This velocity is typically
called a “peculiar velocity.” The Sun’s peculiar velocity is quite
typical for other stars and gas clouds in the disk of the Milky Way.
z
Closer to home, Earth rotates at about 1 kilometer per second. The
Earth orbits the Sun at 30 kilometers per second. Indeed, at its
distance from the galactic center, with its velocity of over 200 times
WKHVSHHGRIDULÀHEXOOHWLWVWLOOWDNHVWKH6XQPLOOLRQ\HDUVWR
make a single orbit around the galactic center.
z
In comparison to the Sun and its peculiar velocity of about 10
kilometers per second with respect to the stars in its neighborhood,
UXQDZD\VWDUVDUHGH¿QHGDVWKRVHVWDUVWKDWKDYHSHFXOLDUYHORFLWLHV

72
Lecture 1
1: Runaway Star
, Zeta Ophiuchi
measured in tens to over a hundred kilometers per second. About 15
percent of O and B types of stars are runaway stars. Many appear to
be moving away from star clusters.
z
Among this group of high-velocity runaway stars, a few stars are
found with peculiar motions of over 300 kilometers per second. At
these kinds of velocities, it’s possible for a star to actually escape
WKHJUDYLWDWLRQDO¿HOGRIWKHJDOD[\7KHVHVRFDOOHGK\SHUYHORFLW\
VWDUV FDQ À\ DZD\ RII LQWR H[WUDJDODFWLF VSDFH 0RVW RI WKHVH
hypervelocity stars appear to be coming from the vicinity of the
galactic center region.
z
So how do we measure the space velocity of a star? We typically
break the velocity down into its two component parts: the transverse
component across our line of sight and the radial component along
our sight line. These two components require different types of
measurements.
z
The transverse velocity is measured by a star’s proper motion,
which is the angular motion a star makes across the sky over time.
This is, for almost every star, a very tiny amount. The typical units
we measure proper motion in are milliarc seconds per year. Even
for the nearest stars, even though they’re moving quite fast, the
proper motions are very small. How can peculiar velocities of 10
kilometers per second lead to such tiny proper motions? The simple
answer is because the stars are so far away.
z
In the case of stellar proper motions, let’s consider a real grouping
of stars in the sky: the Big Dipper. Bright stars form and deform the
Big Dipper’s shape over 200,000 years. Small proper motions are
why constellations last so long.
z
/LNHSDUDOOD[SHUVRQDOPRWLRQVDUHGLI¿FXOWWRPHDVXUHIRUGLVWDQW
stars. Also, you need to know distance to the star to convert
personal motions to transverse velocity. Thus, this particular
velocity component, the transverse velocity component, is typically
WKHPRVWGLI¿FXOWWRPHDVXUHLQVWDUVLQWKHJDOD[\
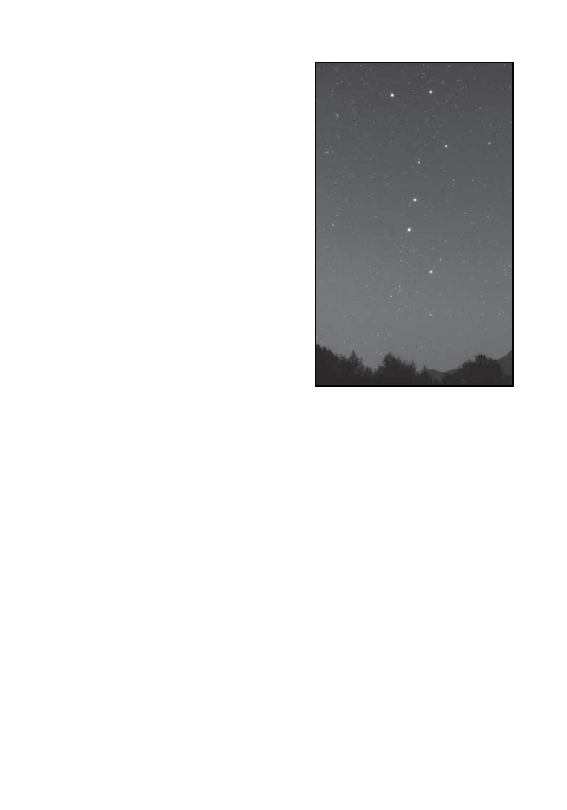
73
z
Measuring the radial velocity
of a star through the Doppler
effect is easy to do, provided
that the star is bright enough
and that we’ve got a telescope
big enough with a good
spectrograph. The Doppler
effect tells us that if the star
is moving toward us, the
wavelengths of light get shorter
and, therefore, bluer. If the
star is moving away from us,
the wavelengths of light get
stretched, shifting to redder
wavelengths. The amount of the
wavelength shift is proportional
to its velocity, so the blueshift
and redshift of lines give
velocity and direction.
z
In the case of the nearest star
system, Alpha Centauri, that
star exhibits a relatively large
proper motion of 3.9 arc seconds per year. It’s also the nearest
star, at a distance of 1.3 parsecs, or 4.3 light-years. Putting these
numbers together, we can determine that the transverse velocity of
Alpha Centauri is 24 kilometers per second.
z
The Doppler effect gives us the radial velocity of Alpha Centauri.
The spectrum of Alpha Centauri—and we interpret that in terms of
the Doppler effect—tells us that the radial velocity of the star is 20
kilometers per second toward us. Together, they indicate that Alpha
Centauri has a true space velocity of 31 kilometers per second.
z
The determination of both of these velocity components has been
particularly important in understanding the hypervelocity star HE
0437-5439. This B star has a radial velocity of 720 kilometers
Ursa Major, also known as the Big
Dipper, is a grouping of stars in
the northern sky.
© shihina/iStock/Thinkstock.

74
Lecture 1
1: Runaway Star
, Zeta Ophiuchi
per second away from the Sun. Based on its spectral type and
measured brightness, we can infer that its distance is about 200,000
light-years. It’s just 16 degrees on the sky away from the Large
Magellanic Cloud, which is a satellite galaxy of the Milky Way at a
distance of about 160,000 light-years.
z
Was this hypervelocity star HE 0437-5439 ejected from the Milky
Way or from the Large Magellanic Cloud? Only Hubble can
measure the proper motion of such a distant star. Astronomers used
comparisons of high-resolution images of this star taken about
3.5 years apart to determine that this star has a proper motion. It’s
less than a milliarc second per year, but they have enough of a
measurement to determine its direction: This hypervelocity star is
moving away from the Milky Way’s galactic center at a velocity of
about 550 kilometers per second.
z
Given the position of the star on the sky and its distance, it indicates
WKDW WKLV VWDU KDV EHHQ À\LQJ RXW IURP WKH JDOD[\ IRU DERXW
million years. That’s a bit of a puzzle, because this start is a B star,
and B stars typically have main-sequence lifetimes on the order of
about 20 million years.
z
The explanation that astronomers have come up with is that
originally this particular star was part of a triple-star system
including a close binary star—two stars orbiting really close to each
other and another one orbiting around them. What happened is this
triple system came very close to the 4 million-solar-mass black
hole at our galactic center. The black hole captured the outer star
in the triple system in orbit and kicked the binary away through
gravitational interaction at high velocity out of the galaxy.
z
$V WKLV VWDU ÀHZ DZD\ RII LQWR VSDFH EH\RQG WKH 0LON\:D\ WKH
more massive one of this pair of stars would have evolved off the
PDLQVHTXHQFH¿UVW$VLWJRWEORDWHGDQGJRWELJJHUWKHRWKHUVWDU
actually merged with it into a single star. It basically rejuvenated
the one that was getting old and created a new star, sometimes
called a blue straggler, which has all the characteristics of a blue

75
B star. These gravitational encounters between binaries or triples
and black holes can be gravity-simulated with computers. Such
encounters can produce hypervelocity stars with speeds up to 1000
kilometers per second.
z
Binary encounters with massive stars rather than a black hole
could explain some of the observed runaway stars. A good
example involves the Large Magellanic Cloud, which is a gas-rich
star-forming irregular galaxy. If we look closely into the Large
Magellanic Cloud, we see a very exciting nebula where there’s an
active starburst going on—all kinds of star formation. This nebula,
called 30 Doradus, is about 650 light-years wide. At its core is a
young, massive star cluster called R136.
z
,Q D GHHS RSWLFDO LPDJH RI 'RUDGXV \RX ¿QG D VRODUPDVV
runaway star that’s 375 light-years away from R136. We can glean
its direction from a Hubble view of its nebular interaction, and it
appears to be moving away from R136 at about 100 kilometers per
second. It turns out that this star could have gone these 375 light-
years in a travel time of about a million years. That’s less than the
main-sequence lifetime of this kind of star.
z
Perhaps this runaway was once part of a massive binary in R136.
It’s possible that a more massive star interacted with the binary and
that the runaway got kicked out of the binary and cluster by gravity,
leaving behind a new binary. These kinds of interactions can eject
runaways up to velocities of hundreds of kilometers per second.
Zeta Ophiuchi
z
In the case of Zeta Ophiuchi, an optical image alone gives no hint
that it is a runaway star. All that appears in this sky region are stars
amidst a very faint gaseous nebula. The corresponding infrared
LPDJH RI =HWD 2SKLXFKL SURYLGHG E\ 6SLW]HU VKRZV ¿ODPHQWDU\
wisps of glowing dust and gas in a graceful arc around the star. This
is called a bow shock. The bow shock is especially evident in the
warm dust.

76
Lecture 1
1: Runaway Star
, Zeta Ophiuchi
z
Zeta Ophiuchi, a runaway star, is moving at high speed through
a nebula. As it runs through the gas and dust in the nebula, it’s
compressing and heating due to the high star velocity of Zeta
Ophiuchi, plus Zeta Ophiuchi’s intense stellar wind pushing on this
gas and dust.
z
The infrared bow shocks of many runaway stars have been revealed
at lower resolution through images obtained with the Wide-Field
Infrared Survey Explorer (WISE) satellite observatory.
z
What about Zeta Ophiuchi? How did it become a runaway from
the bright stars and glowing clouds of the young Upper Scorpius
cluster? Was it once part of a cluster binary that was disrupted
by a collision with another star? Actually, there is another binary
possibility. What if its companion blew up as a supernova?
z
Various binary supernova cases have been simulated. Given the
current position of Zeta Ophiuchi and its 35 kilometers per second
motion away from Upper Scorpius, it was part of the cluster about a
million years ago. If a corresponding runaway neutron star could be
found whose motion puts it in the cluster near Zeta Ophiuchi at that
time, then a supernova origin would be quite likely.
Kaler, Extreme Stars.
Pasachoff and Filippenko, Cosmos.
Waller, The Milky Way.
1.
Are runaway stars serious threats to disrupt the planetary orbits in the
solar system? Why or why not?
2.
Imagine a binary star system consisting of two solar-type stars. Would the
evolution of this system eventually lead to the production of a runaway star?
Suggested Reading
Questions to Consider

77
The Center of the Milky Way
Lecture 12
S
ince the 1970s, a series of increasingly sensitive ground- and space-
based observations have revealed the galactic center region to be like
nowhere else in the Milky Way Galaxy. One of the most striking views
is a recent composite of Hubble near-infrared, Spitzer infrared, and Chandra
X-ray images across the central 250 light-years of the Milky Way. It shows
pervasive clouds of very hot gas and a complex variety of nebular structures
shaped by supernovas, massive stellar winds, and a 4-million-solar-mass
black hole at its heart.
The Galactic Center of the Milky Way
z
Unlike the Earth, which we can study from a variety of vantage
points, the Galaxy is so large that our view is limited to just
one perspective, and that view is from inside the Galaxy itself.
Nevertheless, through a variety of multiwavelength observations
and studies of other galaxies, we have pieced together a global
picture of the Milky Way and our location within it.
z
At optical wavelengths, our view of the Galaxy is clearest above
and below the galactic disk through the galactic halo. Although
sparsely populated with stars and interstellar matter, the halo is
home to about 170 globular star clusters.
z
A typical globular cluster has about 100,000 stars and is about 100
OLJKW\HDUVLQGLDPHWHU7KHVHGHQVHVSKHULFDOVWDU¿HOGVDUHJUHDW
Hubble targets. They are much richer and older than disk open
clusters. An H–R diagram of a typical globular cluster shows that
these clusters have ages over 10 billion years. Amazingly, it is these
clusters that pinpoint the galactic center.
z
At radio wavelengths, we can directly observe the galactic center
region inferred from the globular cluster distribution. The most
powerful tool in this effort has been the Very Large Array (VLA)

78
Lecture 12: The Center of the Milky W
a
y
telescope in New Mexico. It consists of 27 dishes that are each about
25 meters in diameter and are arranged in a Y-shaped array. The
baseline is adjustable up to 36 kilometers. The interferometer acts
as a single baseline-sized dish. The angular resolution you get with
a telescope on the sky is proportional to the wavelength that you’re
observing divided by the baseline, or the size of your telescope.
z
2XU ¿UVW ]RRPHGLQ YLHZ ZLWK WKH 9/$ LV D ZLGH¿HOG YLHZ RI
the central 1800 light-years of the galactic center at 6-light-year
resolution. In this image, we see a variety of structures along a
GLDJRQDO 7KHVH VWUXFWXUHV DORQJ WKLV GLDJRQDO GH¿QH WKH JDODFWLF
plane. The emission at radio wavelengths is being produced by
high-velocity electrons moving in ionized gas. Some of this ionized
gas is associated with star formations, such as Sagittarius B2 and
Sagittarius B1 in this image.
z
You can also get emission from electrons and ionized gas spiraling
DORQJ PDJQHWLF ¿HOG OLQHV 2IWHQ ZH VHH WKLV DVVRFLDWHG ZLWK
VXSHUQRYDUHPQDQWVDQG¿ODPHQWDU\VWUXFWXUHV6HSDUDWLQJRXWWKH
LRQL]HGJDVWKHHOHFWURQVÀ\LQJWKURXJKLRQL]HGJDVDQGHPLWWLQJ
UDGLDWLRQ DQG WKHQ VSLUDOLQJ DORQJ PDJQHWLF ¿HOG OLQHV ZH FDQ
¿JXUHRXWZKLFKLVZKLFKE\ORRNLQJDWWKHVSHFWUDRIWKLVHPLVVLRQ
z
The galactic center is in the Sagittarius A region. There are two large
FRPSRQHQWV WR WKH 6DJLWWDULXV$ HPLVVLRQ VRXWK RI WKH ¿ODPHQWV
Sagittarius A East is a 30-light-year-wide supernova remnant.
Sagittarius A West is a mini-spiral of ionized gas, and that’s where
the heart of the galactic center is. The gas is ionized by hot, massive
stars in the central parsec around the galactic center. The gas and
stars in this region orbit a compact radio source called Sagittarius
A*, which is located at the dynamical galactic center of our Galaxy.
z
At near-infrared wavelengths, the orbits of the massive stars
near the galactic center can be studied with large ground-based
telescopes. The motivation for such observations is to determine the
mass of Sagittarius A* and determine if it is indeed a supermassive
black hole.

79
z
The Keck 10-meter telescopes on Mauna Kea on the island of
Hawaii have been key because they allow us to look at faint objects.
They achieve sky resolutions of about 0.05 of an arc second through
adaptive optics technology. They use laser guide stars to correct for
the turbulence as the light goes through the atmosphere.
z
:LWKWKLVVKDUSQHDULQIUDUHGLPDJLQJZH¿QGWKDWWKHFHQWUDOOLJKW
year of our Galaxy has hundreds of stars in it. This is amazing.
Recall that the distance between the Sun and Alpha Centauri is 4.3
OLJKW\HDUV6RZHKDYHWRJROLJKW\HDUVWR¿QGWKHQHDUHVWVWDU
and in the galactic center region in that inner light-year, there are
hundreds of stars. Many of these stars are very young. They have
ages less than 10 million years. Their origin is unclear.
z
The central 1 arc second around the galactic center corresponds to
a size of only about 0.1 of a light-year, or 8000 astronomical units.
With the Keck Telescope and other telescopes, the positions of
these stars have been monitored since 1995, getting very accurate
measurements to see if they move. Some clearly show orbital
motion around the Sagittarius A* position.
z
The motions of these stars tell us there’s something enormously
massive at the Sagittarius A* position. Indeed, a complete orbit has
actually been observed for a star called SO-2, with a period of 16
years, and a fainter star called SO-102, with a period of 11.5 years
around the galactic center. The latter star, SO-102, at its closest
approach to Sagittarius A*, is just 260 astronomical units. The
orbital velocity of this star is 5000 kilometers per second.
z
Based on the motions of these stars, this object Sagittarius A* has
about 4 million solar masses inside a radius of just 20 astronomical
units. That’s twice the distance between the Earth and Saturn. Only
a black hole could pack that much mass in such a space. In the case
of a 4-million-solar-mass black hole, such an object has an event
horizon with a radius of about 0.1 of an astronomical unit.

80
Lecture 12: The Center of the Milky W
a
y
z
7KH HYHQW KRUL]RQ DURXQG D EODFN KROH GH¿QHV WKH GLVWDQFH IURP
the black hole where the escape velocity is greater than the speed
of light. Nothing at that radius or closer can escape the black
hole, because nothing can go faster than the speed of light. Such
a thing has enormous gravity. A star that passes really close to the
black hole at the galactic center could be tidally disrupted, and the
infalling matter would basically create a glowing disk of material
around that black hole called an accretion disk.
z
Sagittarius A* is faint in the near-infrared with modest, short bursts,
but there’s no evidence that it has eaten a star recently. That’s aligned
with our expectations, because we expect, based on the stellar density
at the galactic center, that you wouldn’t get a disruption event where
a black hole would rip a star apart through tidal effects. That should
happen only about once every 100,000 years.
Evidence for a Supermassive Black Hole
z
The ground-based evidence for a supermassive black hole and other
phenomena at the galactic center have made it a primary target for
space observations. In particular, the Chandra X-ray Observatory
has provided a pioneering high-resolution view of high-energy
sources and hot gas in this region.
z
Chandra was launched in 1999 on the shuttle Columbia. When the
shuttle went off, it went off not only with Chandra, but also with a
rocket to boost it into higher orbit around the Earth. At the time, this
constituted the heaviest payload ever launched on the space shuttle.
z
Chandra is similar in size to Hubble. Chandra focuses X-ray light
with low-incident angle mirrors. High-energy photons, like X-rays,
would be absorbed by a typical mirror. With low-incident angle
mirrors, the photons graze off these nested mirrors, and that’s how
they’re focused with the Chandra telescope. These nested mirrors
DUHUDQJHLQVL]HXSWRPHWHUV7KH\SURYLGHGHJUHHRI¿HOG
of view at 0.5 arc seconds of resolution. This is 8 times better
resolution than any previous X-ray telescope. It can also detect 20
times fainter sources than before.
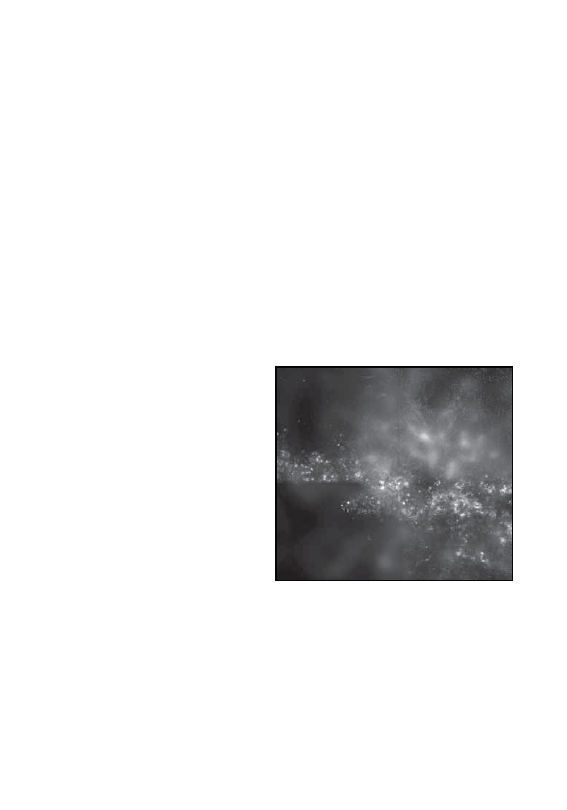
81
z
A considerable amount of time has been spent focusing on Sagittarius
$LWVHOI&KDQGUDKDVGLVFRYHUHG;UD\ÀDUHVIURP6DJLWWDULXV$
Typically, they occur once a day and have a duration of a few hours,
and the object increases in brightness by about a factor of 10. They’re
QRWDVFRPPRQDVWKHVKRUWHUPRUHPRGHVWLQIUDUHGÀDUHV+RZHYHU
W\SLFDOO\DQLQIUDUHGÀDUHDFFRPSDQLHVDQ;UD\ÀDUH
z
,W¶VQRW\HWFOHDUZKDW¶VFDXVLQJWKHVHÀDUHV$QHIIRUWFRQWLQXHVWR
FRPSDUHWKHVHÀDUHVDWYDULRXVZDYHOHQJWKV2QHLGHDLVWKDWWKH\
could be due to asteroids.
z
On a larger scale surrounding Sagittarius A*, Chandra has revealed
widespread diffuse X-ray emission indicative of hot gas and a
number of point sources corresponding to hot, massive stars. The
hot gas indicates a very turbulent interstellar medium in this region.
It’s heated by a supernova explosion, vigorous stellar winds, and
the Sagittarius A*
itself. This is not the
ideal medium for star
formation. However,
we see all these very
young stars with ages
indicative that they
formed less than 10
million years ago.
z
Where did the massive
stars around Sagittarius
A* come from? One
idea is that perhaps
there’s a giant gas
accretion disk around
Sagittarius A*. It’s less likely that a young cluster, or somehow a
cluster of stars, migrated to Sagittarius A*. There’s no evidence of
many corresponding low-mass stars.
The Chandra X-ray Observatory has
provided high-resolution views of
gamma-ray bursts.
© Getty Images/Getty Images News/Thinkstock.

82
Lecture 12: The Center of the Milky W
a
y
z
On an even larger scale, the Chandra data shows that the diffuse
X-ray emission is prominent over much of the inner 500 light-years
of the Milky Way. In a Chandra image, we see that the Sagittarius
A region itself has lots of high-energy emission from hot gas, and
particularly we see diffuse X-ray emission north and south of
6DJLWWDULXV$SHUKDSVLQGLFDWLYHRIDQRXWÀRZRIKRWJDVIURPWKLV
particular object. There’s also hot gas throughout this region. We
expect that there have been supernova explosions and associated
remnants, and massive stars are everywhere in this region.
z
Another way to get a view of this is to look at this region with other
VSDFH WHOHVFRSHV²VSHFL¿FDOO\ ZLWK 6SLW]HU DQG ZLWK WKH +XEEOH
Space Telescope. Astronomers have compared what the central part
of the galaxy looks like by comparing both these Chandra X-ray
images to Spitzer infrared and Hubble near-infrared, and they have
surveyed this central 250 light-year region.
z
Spitzer observations are particularly suited through its infrared view
looking for heated dust. In the case of Hubble, you get a very high-
resolution view in the near-infrared that gives us some indication
of the nebular structure—what the gas is doing. When you put all
of this together, you get a composite of the Chandra, Spitzer, and
Hubble observations. There are many features in the composite
image beyond Sagittarius A*, including the Quintuplet cluster, the
Arches cluster, and the Arc Filaments.
z
Indeed, with its widespread hot gas, high massive-star density,
and supermassive black hole, the galactic center is the most exotic
region of the Galaxy. A clue to the extent that its phenomena might
be related was recently provided by another space observatory: the
Fermi Gamma-Ray Telescope. Through its observations, it revealed
two huge gamma-ray bubbles rising north and sinking south from the
galactic center. The total length of this structure is 50,000 light-years.
z
3HUKDSVWKHVHDUHGXHWRWKHRXWÀRZVRIJDODFWLFFHQWHUVWDUEXUVWV
Perhaps in the recent past, there was a huge infall of mass on the
EODFNKROHDWRXUJDODFWLFFHQWHUDQGWKDWOHGWRDQRXWÀRZHYHQW

83
Perhaps it’s not just these massive stars around the galactic center
in these clusters. Perhaps the black hole itself is driving these big,
high-energy lobes. Central supermassive black holes are common
LQRWKHUJDOD[LHV$QGVRPHVKRZSRODURXWÀRZV
Melia, The Black Hole at the Center of the Galaxy.
Scharf, Gravity’s Engines.
Weaver, The Violent Universe.
1.
Describe the night sky as viewed from a planet around a star in the
Arches cluster.
2.
Contrast the patterns of star formation at the galactic center with those
in the Swan Nebula. What could explain the differences?
Suggested Reading
Questions to Consider

84
Lecture 13: The
Andromeda Galaxy
The Andromeda Galaxy
Lecture 13
S
pace observations of Andromeda have been vital not only in telling us
where its going in terms of its motion, but also where its been in terms
of its recent star-formation history. The ringlike disk distribution
of young hot stars and dust clouds revealed by GALEX and Spitzer is not
readily apparent at optical wavelengths from the ground. It is a key clue that
some of the star formation in Andromeda has been triggered by a galaxy
collision in the recent past. Such collisions and other unusual factors can
alter the appearance of spiral galaxies far beyond the case of Andromeda.
GALEX
z
Andromeda and the other galaxies are not distributed randomly
across the sky. They are typically found in clusters held together by
their mutual gravity. These galaxy clusters range in size from small
groups to rich 1000-member associations.
z
The Milky Way, Andromeda, and more than 50 other nearby
galaxies form a cluster that was named the Local Group by Edwin
Hubble. Its members stretch across about 10 million years of
space. The inter–Local Group space is vaster and emptier than
the interstellar medium in the Milky Way. The space between
the clusters of galaxies is even more vast and empty. Indeed, the
universe is mostly empty space.
z
The Milky Way and Andromeda (M31) within the Local Group are,
by far, the two most massive galaxies. With a diameter of more than
200,000 light-years, M31 is larger than the Milky Way. There is a
distance of 2.5 million light-years between the Milky Way and M31.
z
The Triangulum Galaxy (M33) is the only other Local Group spiral.
Its diameter is about half that of the Milky Way. The other Local
Group galaxies are small irregulars and dwarf ellipticals. Most of
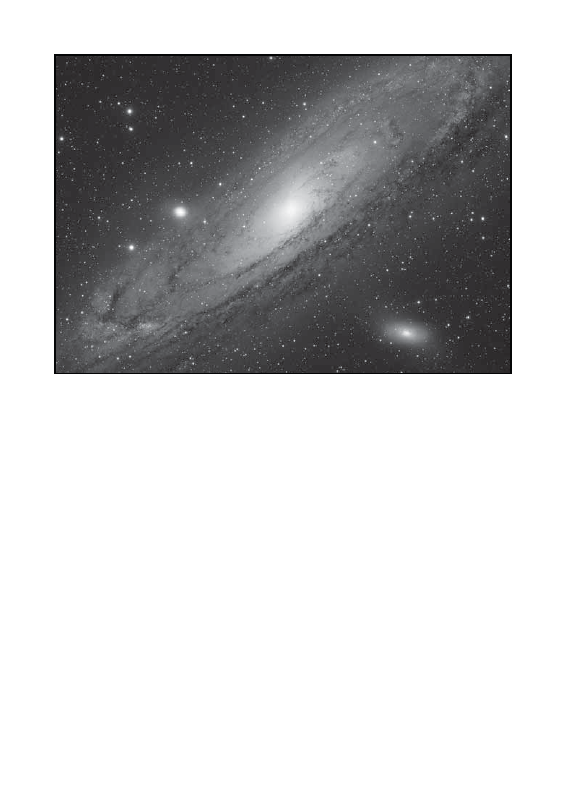
85
these smaller galaxies are satellites of the Milky Way and M31.
And M33 itself may be a satellite of M31.
z
The evolution of galaxies in the Local Group and beyond is strongly
tied to their rate of star formation. Ultraviolet images of galaxies
provide an excellent measure of the rates and locations of star
formation because the hot O and B stars that lead the shortest lives
on the main sequence are the most luminous stars in the ultraviolet.
In other words, two galaxies of similar brightness in the optical
can look quite different in the ultraviolet if one has undergone a
VLJQL¿FDQW EXUVW RI VWDU IRUPDWLRQ RYHU WKH SDVW IHZ KXQGUHG
million years and the other has not. The Galaxy Evolution Explorer
(GALEX) satellite observatory was launched in 2003 to study the
ultraviolet evolution of galaxies over the past 10 billion years.
The Andromeda Galaxy, the nearest large galaxy, is one of the few galaxies that
is visible to the naked eye.
© m-gucci/iStock/Thinkstock.

86
Lecture 13: The
Andromeda Galaxy
z
$NH\IHDWXUHLVLWVODUJH¿HOGRIYLHZ,WLVRYHUWZLFHDVZLGHDV
a full moon. It can observe many distant galaxies at a time. For a
really big galaxy on the sky, like M31 or Andromeda, you only need
DIHZSRLQWLQJVWRFRYHULW+XEEOH¶VXOWUDYLROHW¿HOGRIYLHZKDVD
diameter that is 0.5 percent of GALEX. That means that Hubble
would need about 100,000 pointings to image M31.
z
*$/(;¶VODUJH¿HOGRIYLHZLVGXHWRLWVVPDOOPHWHUPLUURU
With that mirror size, it has reasonable resolution, but certainly
not as high resolution as with Hubble. The imaging resolution for
GALEX is about 5 arc seconds. It does this imaging basically with
two wide wavelength bands in the ultraviolet. The far-ultraviolet
band is centered at about 150 nanometers, and that’s the best band
for looking at the hottest stars. The near-ultraviolet band, centered
at 230 nanometers, is best for looking at somewhat cooler but still
rather hot stars.
z
Putting together the optics in this package, it’s actually quite a
small spacecraft. You can put this kind of technology together to
do this kind of work with just a small spacecraft. Indeed, GALEX
weighs only about 280 kilograms. With the solar panels unfurled,
the whole spacecraft is about 2 meters tall by 3 meters wide. Due
to its small size, it was launchable with a Pegasus rocket off an
DLUSODQH*$/(;FRXOGEHVTXHH]HGDQG¿WLQWRDWLQ\VSDFHDERXW
1.1 meters wide within the nose cone of this rocket.
z
So, GALEX is attached to the nose cone of the Pegasus rocket.
Then, the rocket is attached to the belly of an L-1011 jumbo jet.
The jet takes off, goes up to about 40,000 feet, and then drops the
URFNHW 7KH URFNHW HQJLQHV ¿UH DQG WKHQ DERXW PLQXWHV ODWHU
GALEX is in orbit around the Earth.
z
Pegasus works great for payloads that are smaller than about 450
kilograms. The advantage of this is that Pegasus is much cheaper to
launch probes and observatories into space than large ground rockets,
which need a lot more fuel to get it off the ground out into orbit.

87
z
*$/(; ZDV ODXQFKHG VSHFL¿FDOO\ LQWR D ORZ(DUWK RUELW DW DQ
altitude of about 700 kilometers. Until its recent decommissioning
in 2013, it surveyed the extragalactic sky above and below the plane
of our Galaxy. It has measured the star-formation rates in millions
of galaxies. The total cost of this mission was about 150 million
dollars, which is a relatively low cost.
When Two Galaxies Collide
z
As the closest spiral galaxies to the Milky Way, Triangulum and
Andromeda have been observed in greater detail with GALEX
than any other spiral. This level of detail allows for excellent
comparisons of their ultraviolet indications of star formation with
those at other wavelengths.
z
,QWKHFDVHRI7ULDQJXOXPDGHHSZLGH¿HOGRSWLFDOLPDJHUHYHDOV
a small nucleus with loosely wound spiral arms. The ongoing star
formation in the spiral arms is delineated by the blue light of young
hot stars and the pinkish patches of emission nebulas heated by
those stars.
z
Hubble has imaged the brightest pink area in M33, which is
associated with one of the largest star-formation regions in the
Local Group. This gaseous nebula is called NGC 604. It is 1500
light-years across. At its heart, it has a 3-million-year-old star
cluster that includes over 200 O stars.
z
On the larger scale, GALEX can look at the whole of M33, and it
can trace these arms we see at optical wavelengths and study what
they look like in the ultraviolet. There is a GALEX image that is a
composite of both the far-ultraviolet and near-ultraviolet bands.
z
In addition to GALEX observations of M33 looking at the
ultraviolet, Spitzer can also give us some information about the
infrared in terms of its dust comparisons. There are many regions
where the dust is so dense that it blocks the ultraviolet starlight. In
other regions, like NGC 604, the ultraviolet is very bright because
there’s a little bit less dust in that particular region.

88
Lecture 13: The
Andromeda Galaxy
z
,Q WKH FDVH RI WKH $QGURPHGD *DOD[\ D GHHS ZLGH¿HOG RSWLFDO
image reveals a larger nucleus and more tightly wound spiral arms
than M33. Older stars make the nuclear region look yellowish.
Because Andromeda is inclined much more than M33, its spiral
pattern is less obvious at optical wavelengths. It’s actually inclined
by an angle of 77 degrees to our line of sight.
z
The most evidence of this spiral pattern is in the inner arms; it
seems to be more obvious in terms of the dust lanes. The outer arms
of Andromeda are where you see more of the blue stars and the
more reddish-pinkish nebulas associated with those blue stars.
z
It’s also important to note Andromeda’s dwarf satellites nearby—
M32 (above the disk) and M110 (below the disk). Such dwarfs are
typically made of old stars, and they typically have little interstellar
matter in them. M32 is about 7000 light-years across, and it has a
mass of about 0.5 percent of M31’s. A close-up of M110 reveals a
couple of dust clouds. Also, there is some evidence that there was
recent star formation that went on in this particular dwarf elliptical.
M110 is just a little bit larger and fainter than M32.
z
Hubble has imaged the central 35 light-years of M31 at high
resolution. It reveals an about 200-million-year-old central cluster
of blue stars. Also evident around this cluster of blue stars is an
outer ring of older red stars. Spectroscopic data of these stars and
determination of their velocities based on those velocities indicates
that these stars are orbiting an object at the center—essentially a
black hole that has a mass on the order of 100 million solar masses.
z
What could have caused a burst of star formation near Andromeda’s
central black hole about 200 million years ago? We have asked a
similar question regarding the even younger stars near the Milky
Way’s central black hole.
z
In the case of M31, Spitzer and GALEX have provided a clue. This
clue begins if we compare optical images of M31 and the 8-micron
Spitzer image of M31. The Spitzer view shows that the dust does

89
not exhibit a classical spiral pattern in Andromeda. There appears
to be an inner ring and an outer ring. A typical spiral shouldn’t have
this kind of structure. Astronomers have been able to model this
kind of structure with the idea that the small dwarf elliptical M32
actually collided with Andromeda some 200 million years ago. That
collision may have stimulated star formation at the core of M31.
z
This non-spiral structure in Andromeda is also evident in the
GALEX images. The observations from the GALEX images in
the ultraviolet along with the Spitzer images in the infrared are
consistent with a collision scenario, and that was not apparent from
optical observations.
z
Besides the M32 scenario, there is considerable evidence that both
M31 and the Milky Way have interacted with their small satellite
galaxies in the past and indeed have absorbed some. Despite their
huge 2.5-million-light-year separation, is it possible that these two
large spirals could also eventually collide? Based on information
from Hubble, it does indeed look like Andromeda will make a head-
on or nearly head-on collision with the Milky Way in the future.
z
The collision of two massive galaxies each with hundreds of
billions of stars, vast amounts of interstellar gas and dust, and a
VXSHUPDVVLYH EODFN KROH LV GLI¿FXOW WR LPDJLQH )RUWXQDWHO\ VXFK
complicated interactions can now be modeled using high-speed
computers and sophisticated software that takes into account the
HIIHFWVRIJUDYLW\JDVÀRZVDQGFROOLVLRQLQGXFHGVWDUIRUPDWLRQ
z
What these models show us is that over the next 4 billion years,
Andromeda will slowly approach the Milky Way Galaxy. The act
RIERWKJDOD[LHV¿UVWSDVVLQJE\HDFKRWKHUZLOOOHDGWRWLGDOWDLOVRI
gas and stars being ripped from both galaxies and thrown off into
extragalactic space. The collisions between these two galaxies will
actually lead to very, very few, if any, star-on-star collisions, because
the space between the stars on average in these galaxies is vast.

90
Lecture 13: The
Andromeda Galaxy
z
The gravity associated with all of these stars would have amazing
effects on stirring up stars and sending them all over the place. As
this dance continues, the two galaxies would go through basically a
dance, passing closer and closer over the following 3 billion years.
Eventually, the two galaxies will merge into what essentially will
be gas-free elliptical galaxies. Some gas would be tidally expelled
into intergalactic space, and some would be collision-shocked into
a starburst.
Rich, “Galaxies Seen in a New Light.”
Van Den Bergh, The Galaxies of the Local Group.
9LOODUG³6N\¿UH´
1.
Is it likely that the Local Group included another large spiral galaxy like
Andromeda or the Milky Way billions of years ago? Why or why not?
2.
Why is it unlikely that the solar system will be ripped apart when the
Milky Way and Andromeda collide?
Suggested Reading
Questions to Consider

91
Hubble’s Galaxy Zoo
Lecture 14
T
he Hubble Space Telescope has focused its sharp eye on some of the
most unusual looking galaxies in the local universe. Many of these
peculiar cases can be understood in terms of geometrical effects,
starbursts, and gravitational interactions with other galaxies. With its ring
of blue young stars circling a yellow nucleus of older stars, Hoag’s Object
is the most photogenic example of a celestial rarity known as a ring galaxy.
Although ring galaxies are often understood as the result of a collision between
a small galaxy and a large spiral, the beautiful symmetry of Hoag’s Object is a
fascinating puzzle due to the conspicuous absence of a collision partner.
The Appearance of Galaxies
z
The appearance of galaxies on the sky is a function of many
factors, including their physical size, distance, intrinsic shape,
and inclination. The foundation for understanding these factors
was largely established by Edwin Hubble. Through this work,
he became the most famous astronomer of the 20
th
century. It is
SDUWLFXODUO\ ¿WWLQJ WKDW WKH VKDUSHVW LPDJHV RI WKH H[WUDJDODFWLF
universe are being taken with the telescope that bears his name.
z
With the Mt. Wilson 100-inch telescope, Hubble looked at
$QGURPHGDDQG¿JXUHGRXWDZD\WRJHWWKHGLVWDQFHVWRVRPHRI
those stars. At the same time, Hubble was studying spiral nebulas,
and some had elliptical symmetry. Hubble used the Mt. Wilson
to accumulate unprecedented photos of many galaxies. Using
his photos, Hubble developed what we now call the tuning fork
FODVVL¿FDWLRQVFKHPHZKLFKLVDZD\WRVHSDUDWHRXWGLIIHUHQWNLQGV
of galaxies.
z
Hubble found that within about 100 million light-years, about 90
percent of the galaxies are either ellipticals or spirals. The rest
DUHOXPSHGLQNLQGRIDQLUUHJXODUPRUSKRORJ\FODVVL¿FDWLRQ7KH
ellipticals are typically gas-poor systems of old stars. All of their
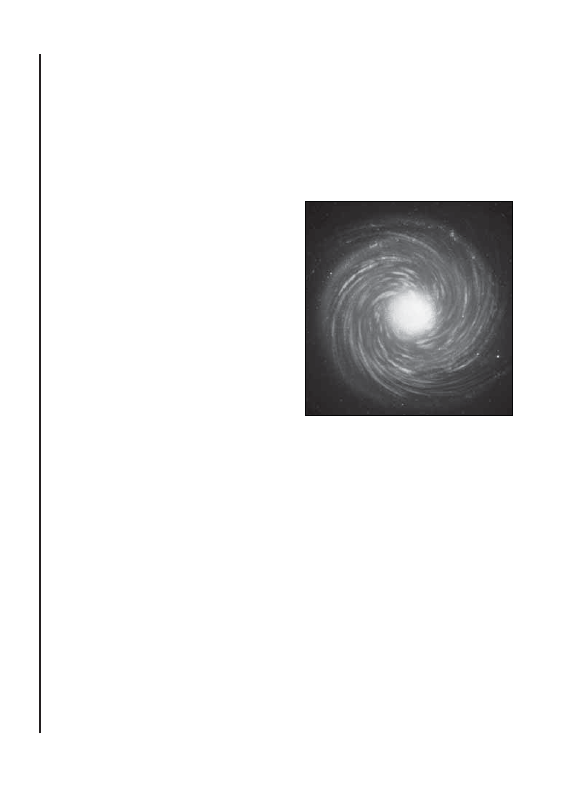
92
Lecture 14: Hubble’
s Galaxy Zoo
stars are very old—10 billion years old or more—and it appears that
all of the stars in these galaxies formed at one time. These elliptical
JDOD[LHVUDQJHLQVKDSH6RPHDUHYHU\FLUFXODUFODVVL¿HGDV(V
and some are very elongated and cigar-like (E7s).
z
The spiral galaxies are disks, and they’re gas-rich systems of both
old and young stars. In spiral galaxies, spiral stars form continuously
over the past 10 billion years.
+XEEOH FODVVL¿HG WKH VSLUDOV
by the shapes and sizes of
the central bulges of these
spirals. He noted that about
half of the spirals have a bar-
shaped bulge. The origin of
these bars is still unclear. It
may be an evolutionary stage
in the evolution of many
large spiral galaxies.
z
The optical cameras
onboard the Hubble Space
Telescope are capable of
imaging galaxies with an
angular resolution of 0.05
arc seconds. This resolution is about a factor of 10 better than
that typically possible with the largest ground-based telescopes. It
means that Hubble can resolve out comparable galaxy structures at
distances 10 times greater than that from the ground.
z
In generally, galaxy images give no more than crude distance
information. If you want to get the distances to galaxies, you’ve
got to rely on Edwin Hubble’s most famous achievement. In 1929,
he found this amazing linear relationship between the distance of a
galaxy and its radial velocity. Today, we call this Hubble’s law. It
tells us that as we look at galaxies that are farther and farther away,
they’re moving away from us faster and faster. Indeed, essentially
all the galaxies beyond the Local Group exhibit redshifts.
Spiral galaxies, named for their
VSLUDOVWUXFWXUHFDQEHFODVVL¿HGDV
either normal or barred spirals.
© cherezof
f/iStock/Thinkstock.

93
z
The simplest interpretation of these observations is that the universe
is expanding. No matter which cluster of galaxies you call home, as
you look out into space and as the universe expands, all the other
galaxies will appear to move away from you. The galaxies that are
farther away from you will move even faster away from you. The
longer the distance—the longer the photon travel time—the more
that their wavelengths will be stretched by the expanding universe
and the higher the redshift velocity measured on Earth.
Peculiar Cases in the Galaxy Zoo
z
Now that we’ve covered a bit of the basics about galaxies, let’s try
to interpret some of the more peculiar cases in Hubble’s galaxy
]RR7KH¿UVWFODVVRIFXULRVLWLHVLQYROYHVJHRPHWULFDOHIIHFWVGXH
to special observer-dependent views. In other words, these cases
might not look as peculiar if viewed from a galaxy with a different
vantage point.
z
The galaxy NGC 3314 appears to have two different sets of spiral
arms. Is this actually a collision between two spiral galaxies? That
can’t be, because when spiral galaxies collide, you see tidal tails. And
we don’t see any evidence of tidal tails in an image of NGC 3314.
What’s going on here is actually just a chance grouping, where one
spiral, the face-on spiral, is just in front of the inclined one.
z
Applying Hubble’s law, we get that the face-on galaxy is at a distance
of 117 million light-years, and the more distant inclined galaxy is at
a distance of 140 million light-years. They’re over 20 million light-
years apart; they’re not interacting. It’s just a matter of perspective.
This perspective issue is particularly key with spiral galaxies.
z
There is a face-on Hubble image of the spiral M101, sometimes
called the Pinwheel Galaxy. It is twice the diameter of the Milky
Way, and it’s at a distance of 25 million light-years. In the image,
we see the familiar spiral arms in the dust, and we also see young
stars. How thick is this galaxy? It’s not that obvious from a face-
on perspective. But if you look closely at the Pinwheel image and
focus on the 10:30 position on a clock in this image near the edge of

94
Lecture 14: Hubble’
s Galaxy Zoo
the arms, you can see that the dust is actually thin enough to see a
distant barred spiral galaxy.
z
In terms of spiral galaxies, you can use the angular size as a very
crude gauge of distance. The reason you can do it very crudely
is that spiral galaxies typically are within a factor of a few the
physical size of the Milky Way Galaxy. You really can’t do that with
elliptical galaxies, though, because ellipticals have a much greater
range in their sizes—a factor of 1000. Also, with an elliptical, they
often look similar from different perspectives.
z
Such is not the case for another one of the galaxies in the zoo, the
45-million-light-year distant Spindle Galaxy. It has an extended
halo of stars that make it look like an elliptical galaxy. However, its
thin dust lane, which is less than 1000 light-years across, indicates
an edge-on disk. This galaxy seems to have characteristics both of
an elliptical galaxy and a spiral galaxy, which is called a lenticular
galaxy (S0). It’s an elliptical-spiral hybrid.
z
In the case of this galaxy, we don’t know its exact spiral pattern,
because we’re seeing it on the edge. Nevertheless, we see
characteristics on the edge that are characteristic with other spirals,
such as the red bulge around the bright nucleus and the blue stars
DORQJWKHGLVN$FORVHXSDOVRUHYHDOVOLWWOHGXVW¿ODPHQWVULVLQJIURP
the disk. The dust is being lifted through stellar winds from massive
stars and supernova explosions from the massive-star formation.
z
Not all edge-on spirals reveal linear dust lanes. A Hubble image
of another galaxy called ESO 510-G13 reveals a warped disk.
This galaxy is at a distance of about 150 million light-years, and
it’s roughly the same size as the Milky Way, but its disk is warped.
These kinds of warps suggest recent interactions with another
galaxy. It may have actually generated a starburst as well, because
there is a bluish region in the right part of the disk of this galaxy
that may be related to a starburst associated with that closer pass of
another galaxy.

95
z
NGC 6670 is a pair of edge-on spirals that are actually in the
process of colliding. It is about 400 million light-years away. In
an image of NGC 6670, the nuclei of the two galaxies are about
50,000 light-years apart. Amidst the dust, you see the bright blues,
which indicate a starburst. The infrared luminosity due to heated
dust in this colliding pair is equal to 100 billion Suns.
z
The most famous starburst galaxy is located only 12 million light-
years away. The Hubble image of this galaxy, known as M82 or the
Cigar Galaxy, looks like its middle has exploded. You see reddish
plumes of nebular gas and dust rising 10,000 light-years from the
core. But when you look away from what’s going on at the core, its
bluish main body looks like an inclined spiral.
z
Hubble can peer inside the core of M82, and a core close-up reveals
about 200 fuzzy bright spots, each of which is a cluster of stars
about 20 light-years across with up to a million young, massive
stars. The innermost 1000 light-years of this galaxy have 10 times
the star birth rate of the entire Milky Way Galaxy.
z
When so many massive stars are formed at the same time, this
massive starburst generates what’s called a galactic super-wind. All
of the strong stellar winds and the supernova explosions associated
with these massive stars are blowing out tremendous amounts of
gas. At the same time, it’s compressing gas in other places and
making more stars. This kind of tremendous starburst activity not
only leads to forming more stars, but it also blows a lot of gas out of
the inside of the galaxy.
z
You see this not only at high resolution with Hubble, but when you
take images of M82 with the Chandra X-ray Observatory and the
Spitzer infrared observatory, you see the same kind of starburst
HIIHFWV DVVRFLDWHG ZLWK WKH VWDUEXUVW LQ WKHVH RXWÀRZV <RX VHH
bright X-ray sources near the core and diffuse hot gas rising from
it. In the infrared, Spitzer reveals even larger plumes of heated dust
coming out of the center of M82. Indeed, this galaxy is the brightest
infrared galaxy in the entire sky.

96
Lecture 14: Hubble’
s Galaxy Zoo
z
:K\ LV 0 XQGHUJRLQJ VXFK D PDVVLYH VWDUEXUVW" $ ZLGH¿HOG
optical view shows a large spiral galaxy called M81 that’s about
130,000 light-years away from M82. Based on the motion measured
of these galaxies, it appears that M81 passed very close to M82 a
few hundred million years ago. What could have happened as M81
came close to M82 is that the tidal force associated with its gravity
could have compressed the core gas clouds on M82 and begun this
massive starburst. Even close “misses” between galaxies can have
VLJQL¿FDQWLPSDFWVRQWKHLUDSSHDUDQFHDQGHYROXWLRQ
Hoag’s Object
z
Our feature galaxy in the Hubble zoo was discovered by the
American astronomer Arthur Hoag in 1950. Given its beautiful
symmetry, it would seem to be a far less likely product of an
interaction with another galaxy than the cosmic violence associated
with M82. Hoag’s Object is about 10,000 times fainter than the
naked-eye limit, and it’s only about 45 arc seconds across. Its
yellow core of old stars is about 17,000 light-years across, and the
blue ring of young stars has inner and outer diameters of 75,000
and 120,000 light-years. The galaxy space between the core and the
ring appears almost essentially empty.
z
+RDJ¶V2EMHFWLVFODVVL¿HGDVDULQJJDOD[\7KH&DUWZKHHO*DOD[\
is also a member of this rare class. The idea of ring galaxies and
how they’re produced can be explored further with snapshots in
time of other ring galaxies. Arp 148 is an interacting pair of galaxies
about 500 million light-years away. Ring evolution is farther along
in another galaxy called AM 0644-741, which is about 300 million
light-years away. Arp 147, which is 400 million light-years away, is
another case that is well past a collision.
z
In all of these other ring cases, the likely collision partner that
stimulated the formation of the ring was nearby. Such is not the
case for Hoag’s Object. There is no other galaxy anywhere near it.
Some non-collision ideas have been put forward, but all of them
have trouble explaining the simple symmetry of the ring structure
in Hoag’s Object.

97
Mackie, The Multiwavelength Atlas of Galaxies.
Sparke and Gallagher, Galaxies in the Universe.
Struck, Galaxy Collisions.
1.
Describe the night sky as viewed from a planet around a star on the
inner edge of the blue ring of stars in Hoag’s Object.
2.
How could one distinguish two similar elliptical galaxies in the same
line of sight at distances of 100 million and 120 million light-years?
Suggested Reading
Questions to Consider

98
Lecture 15: The Brightest Quasar
The Brightest Quasar
Lecture 15
T
he supergiant elliptical galaxy M87 is larger and much more massive
than the Milky Way, with a 6-billion-solar-mass black hole at its
center. M87 has grown over time through collisions with other
galaxies in the Virgo cluster. Such collisions can trigger the infall of gas onto
the black hole, leading to the observed jet of material being ejected from
LWVFRUH$ERXWGHJUHHVRQWKHVN\DZD\IURP0OLHVWKH¿UVWTXDVDU
WR EH LGHQWL¿HG NQRZQ DV & ,W LV DOVR WKH EULJKWHVW RQH RQ WKH VN\
Viewed up close with Hubble, 3C 273 reveals a 100,000 light-year-long jet
consistent with its power source being a supermassive black hole.
Exploring the Sky with New Technology
z
The biggest discoveries in astronomy often originate from observing
the sky at previously unexplored wavelengths with new technology.
As radio astronomy began to blossom in the 1950s, astronomers
detected a number of bright radio sources on the sky and began to
catalogue their positions. One of the most famous such catalogues
was compiled by scientists at Cambridge University in England and
is known as the third Cambridge, or 3C, catalogue.
z
These radio sources that were discovered couldn’t be due to normal
stars, because stars are typically radio-faint. If you have unusual
sources emitting radio light, you really want to observe them at
other wavelengths—in particular, optical observations. But this
ZDVYHU\GLI¿FXOWDWWKHWLPHEHFDXVHWKHSRVLWLRQVRIWKHVHUDGLR
sources on the sky were poorly known.
z
The reason these positions were poorly known is because of the
limitations of imaging the sky in terms of resolution with single-
dish radio telescopes. For example, the Parkes radio telescope in
Australia has a dish that is 64 meters in diameter. With this dish at
UDGLRZDYHOHQJWKV²VSHFL¿FDOO\DWFHQWLPHWHUV²3DUNHVUHVROYHV
WKHVN\DWDUHVROXWLRQRIDUFPLQXWHVZKLFKLVWRRORZWR¿[RQ

99
any particular optical source. But as the Moon passes in front of that
REMHFW\RXFDQXVHWKHRFFXOWDWLRQWR¿[WKHUDGLRSRVLWLRQ
z
In 1962, astronomers realized that the 273
rd
object in the 3C catalog
would be occulted by the Moon. The Moon would be passing
over that part of the sky. At that time, the Parkes radio telescope
was used to observe 3C 273, and the position of this radio source
corresponded to, at optical wavelengths, a blue starlike object. This
object was bright enough to be seen with a small telescope.
z
Eventually, a few other radio sources were pinpointed like 3C
273 was. Interestingly, they also matched up with what looked to
be bluish-looking stars. These objects became known as quasi-
stellar radio sources, which was shortened to the word “quasar.”
The nature of these quasars was a complete mystery, even though
WKH\¶GEHHQLGHQWL¿HGDWRSWLFDOZDYHOHQJWKVEHFDXVHVWDUVVLPSO\
shouldn’t be radio-bright.
z
Among the astronomers puzzling over the nature of quasars during
the early 1960s was Maarten Schmidt, a young astronomy professor
at CalTech, which had access to the world’s largest telescope: the
3DORPDULQFK7KLVWHOHVFRSHKDGLWV¿UVWOLJKWLQDQGLWZDV
the largest ground-based optical telescope on the planet for 45 years.
z
With the Palomar, Schmidt obtained a spectrum of 3C 273, which
looked nothing like a galactic star. Typically, galactic stars exhibit
narrow absorption lines in their spectrum, but this object exhibited
EURDGHPLVVLRQOLQHV$W¿UVWKHFRXOGQ¶WPDWFKWKHHPLVVLRQOLQHV
he found with any known element. He then realized that these were
actually hydrogen emission lines, and they had been redshifted by
a tremendous amount. The redshift velocity measured was 48,000
kilometers per second.
z
7KLVREMHFW&ZDVÀ\LQJDZD\IURPWKH0LON\:D\DWRQH
sixth the speed of light. In terms of Hubble’s law, this implied
that 3C 273 was 2 billion light-years away. In 1963, Schmidt

100
Lecture 15: The Brightest Quasar
published a paper that quasars were likely extragalactic—a
breakthrough discovery.
z
An extragalactic origin for 3C 273 led to even more astonishing
implications. With a redshift distance of 2 billion light-years,
the quasar’s brightness requires an intrinsic optical luminosity
equivalent to 100 Milky Way Galaxies.
z
How could a starlike object be that luminous? First, we need
to estimate its physical size. This can be done by monitoring its
brightness. 3C 273 can vary by about 0.6 magnitude, or 2 times
over a month. The timescale of variation gives us an indication of
how big the light-emitting region is of the object that’s varying.
z
Imagine an object with a radius of a light-month. Imagine that it
brightens throughout in an instant. A distant observer would see
variation over a month. This implies that the light-month-sized 3C
273 can emit 100 Milky Ways’ worth of light. It is too tiny to power
100 Milky Ways. A supermassive black hole would be the only
thing that could be small enough and powerful enough to power
such a thing.
z
Such a black hole would require infall of a few solar masses per
year on a black hole that measures about a billion solar masses.
Such a supermassive black hole would have an event horizon radius
of 20 astronomical units. The matter falling onto this black hole
would form a large accretion disk around the black hole. The disk
itself could be light-days to perhaps light-weeks in radius.
z
As the matter falls into this disk, the gravitational energy of the
infalling matter heats up the disk. Through this gravitational energy,
the black hole unlocks about 10 percent of the infall mass and
converts it to energy. The radiation of this disk energy matches
quasar luminosity. The radiation from the disk also causes any
surrounding gas clouds in the vicinity to glow, and that’s what
produces the emission lines seen in optical spectra of 3C 273.

101
z
The radio emission produced by 3C 273 would be produced by the
fast electrons in the hot gas associated with this system. Due to the
PDJQHWLF ¿HOGV DVVRFLDWHG ZLWK WKLV DFFUHWLRQ GLVN MHWV RI KLJK
speed particles can be emitted from this object. Mass infall rate
ÀXFWXDWLRQVPD\OHDGWRTXDVDUYDULDELOLW\
Quasars
z
Since Schmidt’s discovery paper on 3C 273, the idea that quasars
are powered by supermassive black holes at the cores of distant
galaxies has found wide support from a variety of ground- and
space-based observations. In particular, high-resolution optical
images of 3C 273 taken with two different cameras onboard the
Hubble Space Telescope have revealed structure in its associated jet
and the faint host galaxy of the quasar.
z
Even at Hubble’s fantastic resolution, 3C 273 looks like a star.
The only unusual hint is a clumpy line of light pointing to it—a
jet. The jet of 3C 273 is the brightest optical quasar jet ever found.
It was noted in 1963 by Maarten Schmidt. It begins at an angular
distance of about 12 arc seconds from the quasar, and it’s about 10
arc seconds long. At the distance of 3C 273, this length corresponds
to about 100,000 light-years. In other words, this jet has the same
width as the Milky Way Galaxy.
z
The jet is not only observed at optical wavelengths; it’s also seen in
the radio from the ground and at infrared and X-ray wavelengths.
Chandra observations show that the closer clumps in this jet are
brightest in X-rays. The clumps that are farther away from 3C 273 are
brighter in radio and at infrared wavelengths as observed by Spitzer.
z
The jet is caused by hard-charged particles like electrons and protons
moving at extremely high speed—almost at the speed of light. As
WKHVHSDUWLFOHVDUH¿UHGRXWIURPWKHVXSHUPDVVLYHEODFNKROHWKH\
VSLUDODORQJWKHPDJQHWLF¿HOGOLQHVDVVRFLDWHGZLWKWKHVHMHWV
z
The whole idea behind this model begins with this rotating accretion
GLVNDQGWKHPDJQHWLF¿HOGDVVRFLDWHGZLWKLW$QGWKLVWZLVWHG¿HOG
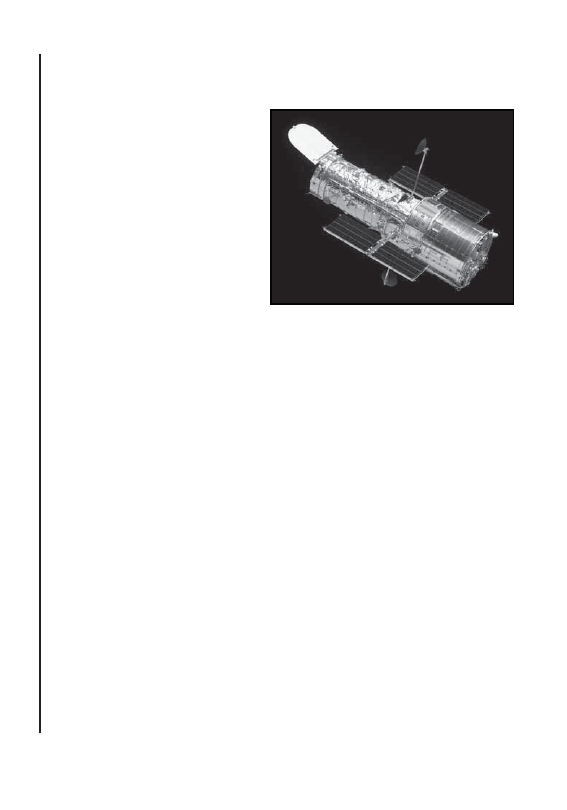
102
Lecture 15: The Brightest Quasar
IRFXVHV DQG DFFHOHUDWHV WKHVH SRODU MHW RXWÀRZV RU WKHVH FKDUJHG
particles, to very high velocity. The exact jet mechanism is not yet
completely understood.
However, only a
supermassive black
hole has the power
to drive such a large,
energetic jet.
z
Because a
supermassive black
hole needs to eat a
steady and healthy
supply of matter to
maintain the energy
output of a quasar, one
would typically expect
quasars to be associated with gas-rich galaxies. Hubble observations
of the faint nebulosity around 3C 273 and other quasars have been
vital in clearly establishing this link.
z
Hubble shows a 30-arc-second close-up on 3C 273 as observed with
its advanced camera. The occulting disk on the camera eclipses
the bright quasar point source, revealing a faint underlying spiral
galaxy that’s over 60,000 light-years across.
z
Hubble has imaged many other host galaxies to quasars, including
ones ranging from 1.5 to 3 billion light-years away. Some of the
quasars are at cores of seemingly normal spirals, and some are
at the cores of seemingly normal elliptical galaxies. But many
are associated with interacting galaxies—galaxies colliding with
one another.
z
Hubble also has imaged the aftermath of a collision between
two galaxies hitting each other at a speed of 500 kilometers per
second. The topmost point source is actually a foreground galactic
The incredible discoveries of the Hubble
Space Telescope have revolutionized the
¿HOGRIDVWURQRP\
© NASA/W
ikimedia Commons/Public Domain.

103
star, but below the quasar, we see evidence of the starburst in this
spiral remnant.
z
The Hubble images show us that quasars can be found in a
variety of galaxies. Interacting cases are understandable. If there
is a supermassive black hole in the mix, if you have two galaxies
colliding, a lot of gas can be dumped on that supermassive black
hole, which stimulates quasar activity. But how can so-called
normal ellipticals and normal spirals house quasars? Note that the
supermassive black hole is just a tiny fraction of the galaxy size and
PDVV7KHNH\FKDOOHQJHLV¿JXULQJRXWKRZWKH\GHOLYHUPDVVWR
the quasar.
z
A key to better understanding the connection between quasars and
galaxies is the distribution of quasars on the sky as a function of
distance. Surveys have mapped over 200,000 quasars and have
found that there are very few of them nearby. 3C 273 is actually
among the closest 1 percent. Quasars peak in number at a distance
of 10 billion light-years. This means that quasars were much more
common long ago. The idea behind this evolution is that the quasars
faded as their supermassive black holes ran out of gas. If this idea is
WUXHRQHZRXOGH[SHFWWR¿QGPDQ\VXSHUPDVVLYHEODFNKROHVVWLOO
around at the centers of galaxies we see nearby.
z
M87 is the largest elliptical galaxy in the Virgo cluster. It’s a strong
radio emitter, and it has a conspicuous jet. In studying this jet over
WLPH+XEEOHKDVVHHQÀDUHVLQWKHMHW,QGHHGDÀDUHFDOOHG+67
was found to be only 200 light-years from the core of the galaxy.
:KDWLVWKLVÀDUHGXHWR"3HUKDSVWKHUHZDVDÀDUHLQWKHPDJQHWLF
¿HOG DVVRFLDWHG ZLWK WKH MHW RU SHUKDSV D JDV FORXG LQDGYHUWHQWO\
wandered in front of the jet and the jet hit an intervening gas cloud
and lit it up.
z
The deep Hubble image of the core of M87 also indicates that its
supermassive black hole is just a bit off-center. Perhaps this is due
to a semi-recent collision with another galaxy, maybe even a merger
with another supermassive black hole.

104
Lecture 15: The Brightest Quasar
z
When we look at M87 with radio wavelengths, we see that the
jet emission that we see at optical extends out many thousands of
light-years. If we look at radio wavelengths very close to the center,
we see that there is radio emission within 0.1 of a light-year at the
core of M87. These observations are indicative of a semi-retired
6-billion-solar-mass black hole. Perhaps long ago, with more infall
and steadier infall, it was a quasar.
z
Overall, the observations clearly indicate that supermassive
black holes are commonly found at the centers of large galaxies
in the local universe. The level of activity associated with these
supermassive black holes varies and is typically a function of recent
interactions with other galaxies leading to an episode of mass infall.
There are two other nearby cases: Alpha Centauri and M31, our
nearest neighbor.
Bartusiak, Archives of the Universe.
Kitchin, Galaxies in Turmoil.
Scharf, Gravity’s Engines.
1.
Describe the night sky as viewed from a planet around a star in the
outskirts of the spiral host galaxy of 3C 273.
2.
How might one interpret a quasar with no optically observable host
galaxy?
Suggested Reading
Questions to Consider

105
The Dark Side of the Bullet Cluster
Lecture 16
T
he existence of dark matter is key to our understanding of a wide range
of phenomena in the universe, ranging from its large-scale structure
to the collisions of galaxy clusters. Through space observations of
gravitational lensing and hot gas with Hubble and Chandra, the image of
the Bullet cluster provides one of our best visualizations of dark matter.
However, the answer to the fundamental question regarding the composition
of this dark stuff remains elusive.
Dark Matter
z
'DUNPDWWHULVEDVLFDOO\GH¿QHGDVPDWWHUWKDWLQWHUDFWVZLWKYLVLEOH
matter through gravity but not through electromagnetic radiation.
Consequently, it can be detected through its gravitational effects on
visible matter and radiation, but it does not emit or absorb photons.
z
Where is this dark matter? Let’s start with our neighborhood. Is
there gravitational evidence for a large amount of dark matter in the
Milky Way?
z
The Sun has more mass than everything else in the solar system
combined. The outer planets orbit much slower than the inner
planets. This is exactly what one would expect gravity to do if,
indeed, the Sun has most of the mass in the solar system. In other
words, there’s no need for any dark matter in the solar system to
explain the gravitational interactions of the planets.
z
The orbital velocities of the stars around the center of the Milky
:D\ UHÀHFW WKHLU PDVV LQWHULRU WR WKHP EHWZHHQ WKHP DQG WKH
galactic center. The mass inside a particular star’s orbit around the
galactic center is proportional to the rotational velocity of that star
squared, times the distance of that star to the galactic center. The
amount of mass interior to the Sun’s orbit around the galactic center
is about 100 billion solar masses.

106
Lecture 16: The Dark Side of the Bullet Cluster
z
If light in the Galaxy traces mass—the light is decreasing as we go
to the outer part of the Galaxy—the velocities of these stars should
decrease and end up with velocities less than what we see at the
Sun’s velocity around the galactic center. Indeed, we can measure
the velocities well past the Sun’s orbit to sparse regions, and we
¿QG WKDW WKH YHORFLWLHV GRQ¶W GHFOLQH DV H[SHFWHG ,Q RWKHU ZRUGV
light doesn’t trace mass. Therefore, we say that the Galaxy exhibits
DÀDWURWDWLRQFXUYHZKLFKLQGLFDWHVWKDWWKHUHPXVWEHDVXEVWDQWLDO
amount of dark matter in the Milky Way.
z
This is best understood in terms of a vast halo of dark matter. The
amount of mass in this dark matter halo is appreciably greater
than the amount of mass in the visible disk. The dark matter that
ZH H[SHFWLV ¿OOLQJWKHEURDGKDORDURXQGWKHGLVN RI RXU *DOD[\
is most likely some kind of non-baryonic particle. Protons and
neutrons are particles we call baryons.
z
Almost every spiral galaxy in the universe that we study exhibits
WKHVH ÀDW URWDWLRQ FXUYHV ,Q RWKHU ZRUGV ZH FDQ REVHUYH WKH
rotational velocities out as far as we can see the stars, and they
don’t drop off, whereas they should if the only amount of matter in
these galaxies were the matter tied to the stuff that’s shining. These
REVHUYDWLRQVWHOOXVWKDWWKHUHLVLQGHHGDVLJQL¿FDQWDPRXQWRIGDUN
matter associated with individual galaxies.
z
Distant rich clusters of galaxies provide an opportunity to explore
the presence of dark matter on a larger scale. Abell 1689 is one of
the most massive clusters known. It is located at a distance of 2.2
billion light-years. A high-resolution Hubble image of the cluster
spans 2 million light-years and reveals its high density of many
hundreds of galaxies.
z
It also reveals hundreds of thin, arc-like structures. Indeed, many of
them appear to partially encircle the cluster core. If we look at them
close up, we see a variety of cases. We see some arcs that are short
and some that are long. We also see multicolor arcs.

107
z
Amazingly, Hubble is able to see these arcs and these rich clusters
because of its sharp eye. In the case of Abell 1689, these arcs are
due to galaxies that are far beyond this galaxy cluster. As they go
through the cluster’s gravitational
¿HOG WKHVH LPDJHV RI YHU\
GLVWDQWJDOD[LHVDUHDPSOL¿HGDQG
distorted. In other words, Abell
1689 is a gravitational lens. Such
a lens is due to the space curvature
around massive objects.
z
This kind of space curvature
was predicted by Einstein’s
general theory of relativity in
1916. In this theory, gravity is
effectively a manifestation of
this space curvature. The idea
is that when you have massive
objects in space, they curve the
space around them such that
less-massive objects follow that
space. If they travel through space, they follow the curvature of
space when they pass through a massive object. Light must also
follow this curvature of space.
z
A good example of this is the case of our solar system. The Sun
itself curves the space around it, and the planets orbit in this curved
space surrounding the Sun’s mass. Starlight passing right near the
edge of the Sun is bent by an angle of 1.7 arc seconds due to the
space curvature associated with the mass of the Sun. Evidence
of this was seen during a solar eclipse in 1919. This was a key
FRQ¿UPDWLRQRI(LQVWHLQ¶VJHQHUDOUHODWLYLW\
z
The extent to which the space curvature around a massive cluster of
galaxies makes it a gravitational lens depends on a number of factors,
including its mass distribution, size, and distance, plus its alignment
with the background galaxies and the distances of those galaxies.
Albert Einstein (1879–1955)
predicted space curvature in his
general theory of relativity.
© Library of Congress, Prints and Photographs Division, LC-USZ62-60242.

108
Lecture 16: The Dark Side of the Bullet Cluster
z
A background galaxy can be lensed into multiple images. Lensing
produces arc-like images bent from “true” positions. Through this
lensing, you can brighten some of these galaxies, making them
brighter than they would appear if you didn’t have this kind of lens.
z
The lensed images can change over time due to the changing mass
distribution in an intervening cluster of galaxies. The structure of
the arcs is sensitive to this complex cluster mass distribution. If
you can measure actively the positions and shapes of these lensed
images, you can get a map of the lensing mass of the intervening
cluster of galaxies.
z
The many lensed images we see in the case of Abell 1689 makes
this particular case ideal for working out the mass distribution
of the total mass in this cluster. The lensing yields the total mass
distribution—both the mass that’s dark and the mass that’s shining
at different wavelengths. It does not differentiate between visible
and dark matter.
z
The lensing gives you the total amount of mass, and then you
assess the dark contribution by subtracting the matter you see—
by estimating how much mass is associated with the stuff that’s
shining. In this case, the subtracted visible part for the map has two
components. First, the optical galaxy light gives us a mass estimate
of the stars in Abell 1689. (The dark matter appears to correlate
quite well with the visible galaxy density.) Second, the X-ray image
of the cluster gives us a mass estimate of the hot gas between the
galaxies in Abell 1689.
z
Intracluster hot gas is common in rich clusters. Overall, individual
cluster studies show that dark matter is dominant in these clusters.
6SHFL¿FDOO\GDUNPDWWHULVDERXWWLPHVPRUHDEXQGDQWWKDQYLVLEOH
matter. In addition, the dark matter is distributed more smoothly,
like the intercluster hot gas, than galaxies.

109
The Bullet Cluster
z
Observing the collision aftermath of two galaxy clusters provides
an opportunity to test this composition and our understanding of
dark matter. In such a collision, the colliding clouds of hot gas
should slow due to ram pressure, while the dominant dark matter
should not if it only interacts with itself and the gas through gravity.
z
The textbook case of a galaxy cluster collision is located at a distance
of 3.4 billion light-years. At optical wavelengths, the Bullet cluster
appears as a large group of galaxies separated by about 2 million
light-years from a smaller group. The Hubble optical image alone
doesn’t indicate a collision; the Chandra X-ray image is the key.
z
An optical/X-ray image shows that the collision separated the
galaxies and the hot gas. But what about the dark matter? With
Hubble’s fantastic detail, we can study the lensing effects and
understand the total amount of mass associated with this cluster.
The derived lensing mass, which is dominated by dark matter, is
clearly separated from the hot gas. This observation is completely
consistent with the idea that the cluster is dominated by dark matter.
z
Since the original study of the Bullet cluster, several other colliding
galaxy clusters have been observed in detail with Chandra and
Hubble. For example, the Musket Ball cluster is at a distance of 5.2
billion light-years, and the rich cluster Cl 0024+17 is at a distance
of 5 billion light-years.
z
The rich cluster Abell 520 is at a distance of 2.4 billion light-
years. Comparing Hubble’s image with Chandra’s X-ray image
and information about total mass from the lensing studies, we see
that the hot gas is in the middle and is consistent with a collision
between two clusters. The optical luminosity is the light associated
with the galaxies in these clusters and is consistent with the cluster
separating. But the lensing mass that is dominated by the dark
matter is mostly in the middle.

110
Lecture 16: The Dark Side of the Bullet Cluster
z
Why didn’t the dark matter separate with the galaxies? This is a
puzzle. But there are several possibilities to explain this complex
composite, which looks like a train wreck. The most revolutionary
possibility would be that some dark matter is a bit sticky. When
the clusters collided, their dark matter interacted like the hot
gas. However, other cluster collision cases show non-sticky dark
matter behavior.
z
Alternatively, perhaps Abell 520 is a collision of three clusters,
or perhaps the core dark matter clump involves matter far from
Abell 520. The bottom line is that Abell 520 is a puzzle for further
observations to answer.
z
It is possible to use weak gravitational lensing to map the
distribution of dark matter on scales much larger than that of
clusters of galaxies. Such studies utilize high-resolution optical
images to accurately measure the shapes of distant galaxies and
statistically look for subtle distortions due to the space curvature
provided by foreground concentrations of mass.
z
A number of observatories both from space and the ground have
worked together to produce something called the COSMOS survey.
The Hubble Space Telescope covered 2 square degrees of the sky,
and for Hubble, that’s a lot of space to cover. Indeed, the COSMOS
Hubble image is a mosaic of 575 individual pointings with Hubble
and a total of 1000 hours of observation, which is a tremendous
amount of time to put into a Hubble observation. This Hubble map
shows that the visible matter appears to accumulate where the dark
matter is densest.
z
Measured galaxy distances provide a three-dimensional perspective
of how the dark matter changes with distance and with time deep into
the universe in one particular place in the sky. A three-dimensional
PDSVKRZVDQHWZRUNRIGDUNPDWWHU¿ODPHQWV%HFDXVHRIJUDYLW\
GDUNPDWWHU¿ODPHQWVJHWFOXPSLHUDVWKHXQLYHUVHDJHV7KHLGHDLV
WKDW GRPLQDQW GDUN PDWWHU ¿ODPHQWV IRUPHG HDUO\ LQ WKH KLVWRU\ RI

111
the universe. Then, visible matter is drawn by dark matter gravity to
WKHVH¿ODPHQWVDQGYLVLEOHJDOD[LHVDQGFOXVWHUVHYROYHDORQJWKHP
z
0RGHOVSUHGLFWDSUHVHQWGD\FRVPLFZHERIGDUNPDWWHU¿ODPHQWV$
simulation of this web that is a little over 1 billion light-years across
SUHGLFWVWKDWWKHUHVKRXOGEH¿ODPHQWVRIFOXVWHUVRIJDOD[LHVDFURVV
the sky and voids tens of millions of light-years across. In fact, this
prediction of this web of structure in the universe is matched pretty
well by the observed large-scale distribution of galaxies.
Gates, Einstein’s Telescope.
Panek, The 4 Percent Universe.
Weaver, The Violent Universe.
1.
Why are space observations vital to the study of dark matter?
2.
If dark matter is the dominant form of matter in the universe, why don’t
we see any evidence of it on Earth?
Suggested Reading
Questions to Consider

112
Lecture 17: The Cosmic Reach of Gamma-Ray Bursts
The Cosmic Reach of Gamma-Ray Bursts
Lecture 17
I
t is amazing to think of all the discoveries of gamma-ray bursts that have
followed from the serendipitous space discovery of a few brief gamma-
UD\ ÀDVKHV RYHU \HDUV DJR :LWKRXW WKH YLHZ IURP VSDFH RI WKHVH
initial clues, we might still be missing the most powerful explosions in the
universe and some of the deepest views into the cosmic past. The rich history
and science of gamma-ray bursts are reminders that it is important to explore
the entire electromagnetic spectrum for new cosmic phenomena, especially
in the case of the transient sky.
Gamma-Ray Bursts
z
The brightnesses of many stars vary on timescales ranging from
hours to years. Most of these variations are either too slow or too
small to be easily discernable to the naked eye. The rarest cases
involve a huge increase in brightness on a very short timescale,
where it looks like a new star has suddenly appeared. Such optical
transients are typically associated with an explosive event, such as
a supernova.
z
7KH PRVW SHUSOH[LQJ WUDQVLHQWV ZHUH ¿UVW GHWHFWHG WKURXJK VSDFH
observations of the gamma-ray sky in the late 1960s. These
gamma-ray bursts lasted only a few seconds, left no detectable
WUDFHV DW RWKHU ZDYHOHQJWKV DQG ZHUH GLI¿FXOW WR ¿[ RQ WKH VN\
Consequently, their origin was completely unknown.
z
The discovery of astronomical gamma-ray bursts was completely
serendipitous. Amazingly, it came about as a result of the treaty
signed by the Soviet Union, Great Britain, and the United States
in 1963 to ban tests of nuclear weapons anywhere above ground,
including outer space and underwater.
z
In order to ensure treaty compliance, the United States launched
the Vela series of satellites in the 1960s to monitor the Earth and
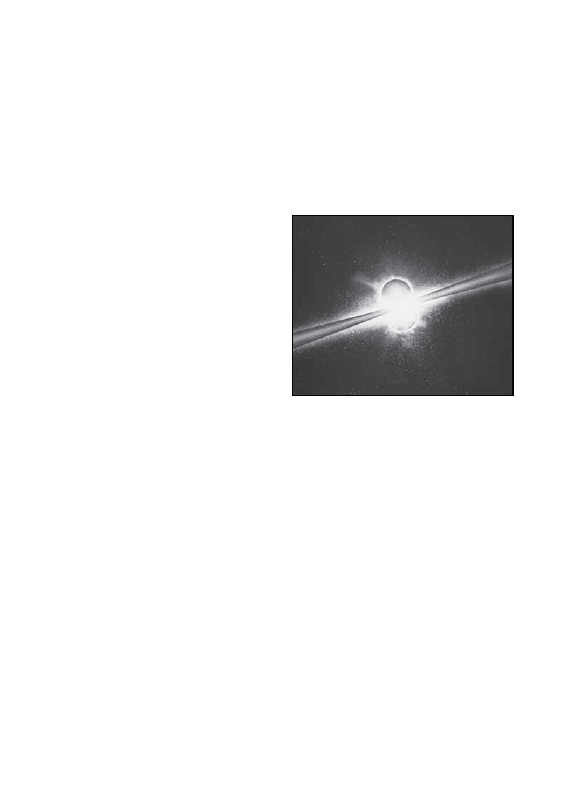
113
its environment for the gamma-ray signature of any nuclear
explosions. The Velas never detected any nuke signatures, multiple
Velas did detect brief gamma-ray bursts.
z
+RZHYHULWZDVYHU\GLI¿FXOWWRORFDWHWKHVRXUFH(QHUJHWLFJDPPD
UD\VDUHYHU\GLI¿FXOWWRIRFXV0XOWLSOH9HODVDWHOOLWHVFRXOGJLYH
you a rough triangulation by the arrival time of the pulse, and this
triangulation showed that the source was not a solar system object.
Over the subsequent 3
years, the Vela satellites
detected 16 such bursts.
In 1973, a discovery
paper was published,
heralding this new
cosmic phenomenon.
z
The keys to understanding
the gamma-ray bursts
were to identify the
sources on the sky at other
wavelengths, measure
their distances, and
determine their true energies. As the 1970s turned into the 1980s,
the observational effort thus focused on better localizing the sky
ORFDWLRQVRIWKHJDPPDUD\ÀDVKHV
z
Other spacecraft far from Earth with gamma-ray detectors were
utilized to get much better triangulation and focus of where on the
sky these gamma-ray bursts were. Among the hundreds of new
gamma-ray bursts that were discovered during this interval, dozens
were actually located to a few arc minutes. But a few arc minutes
is still a big hunk of sky, and there are many thousands of stars and
galaxies in such a small space. Through the late 1980s, no one found
any counterparts to the gamma-ray bursts at any other wavelengths.
z
By the time NASA launched the Compton Gamma Ray Observatory
in 1991, almost 20 years had passed since the discovery of gamma-
Gamma-ray bursts collect a massive
amount of energy into narrow beams.
© Digital
V
ision/iStock/Thinkstock.

114
Lecture 17: The Cosmic Reach of Gamma-Ray Bursts
ray bursts, and there was still no convincing evidence of their
origin. The Burst and Transient Source Experiment (BATSE)
onboard Compton was designed to be 10 times more sensitive to
gamma-ray bursts than all previous missions.
z
BATSE had eight detectors on the corners of the spacecraft, and
with these different detectors, it could isolate a gamma-ray burst
on the sky to a window of 10 degrees. This is too large to identify a
FRXQWHUSDUWWRDVSHFL¿FJDPPDUD\EXUVW
z
However, the greater sensitivity of BATSE on board Compton led it
to actually discover one gamma-ray burst every day. In other words,
if you build up a large number of statistics of where they occurred
on the sky, you can look at all of those sky locations and deduce
ZKDWPLJKWEHJRLQJRQ6SHFL¿FDOO\LIWKHVRXUFHRIWKHVHJDPPD
ray bursts were in the galaxy, we would expect that they would be
concentrated on the Milky Way, because that’s where most of the
stars in the Milky Way are.
z
Over the course of its 9-year life, over 2700 gamma-ray bursts were
detected with BATSE. And it discovered that their sky distribution
was completely isotropic. They were found all over the sky. This
¿QGLQJZDVPRVWFRQVLVWHQWZLWKDQH[WUDJDODFWLFLQWHUSUHWDWLRQ,I
these gamma-ray bursts were occurring far beyond the Milky Way,
that would imply that they have huge energies.
z
BATSE also was able to establish that there were two different
gamma-ray burst populations. Most of them are long-duration
bursts, which tend to last more than 2 seconds, but there are also
smaller populations of bursts that have a somewhat shorter duration.
z
,Q RUGHU WR FRQ¿UP DQ H[WUDJDODFWLF RULJLQ LW ZRXOG EH QHFHVVDU\
WR QDLO GRZQ D JDPPDUD\ EXUVW VRXUFH 7KLV IHDW ZDV ¿UVW
accomplished by the Italian-Dutch X-ray satellite observatory
BeppoSAX with a gamma-ray burst on February 28, 1997. It caught
the fading X-ray afterglow of the gamma-ray burst and isolated its
position within 1 arc minute.

115
z
This position was quickly advertised, and a ground-based image
was taken 20 hours after the gamma-ray burst. The fading optical
GRW ¿[HG WKH SRVLWLRQ ZLWKLQ DUF VHFRQG$ ODWHU +XEEOH LPDJH
found a faint galaxy around this spot. Its redshift indicates a
distance of 5 billion light-years.
z
Several other BeppoSAX gamma-ray bursts were soon tied to distant
galaxies. Their implied burst energetics were enormous. Given the
brightnesses and huge distances, these gamma-ray bursts were the
most powerful explosions since the big bang. Their peak power was
millions of times more powerful than that of a supernova.
z
What could explain an explosion that appears much more powerful
than a supernova? The leading possibility for the long-duration
bursts is a supernova where much of the energy is tightly beamed
into opposing jets—one of which is pointed at the observer. Such a
supernova can arise when the core of a very massive star collapses
into a rapidly rotating black hole and an accretion disk.
z
There is a reasonable amount of initial supporting evidence for this
so-called hypernova model. First, the host galaxies of these gamma-
ray bursts typically appeared to be star-forming galaxies with many
massive stars in them. Second, several of the nearest gamma-ray
bursts had bright supernovas accompanying the gamma-ray burst.
Third, gamma-ray bursts basically take all the energy that you
could imagine coming out isotropically in a typical supernova and
collect it into narrow beams of energy. This beamed model implies
that there are many more gamma-ray bursts than we can see.
The Swift Space Observatory
z
In order to test the hypernova model and explore other gamma-ray
burst possibilities, it would be necessary to systematically study
a large number of gamma-ray bursts, their afterglows, and their
host galaxies. The Swift space observatory launched by NASA in
2004 was designed to respond to gamma-ray bursts faster than any
mission that had come before it.

116
Lecture 17: The Cosmic Reach of Gamma-Ray Bursts
z
Swift and its three instruments can detect and localize a gamma-ray
burst within seconds to a few arc minutes in position and then pivot
the spacecraft so that it can image the gamma-ray burst at X-ray,
ultraviolet, and optical wavelengths to arc-second precision within
a few minutes. Gamma-ray burst position is then quickly advertised
for ground follow-up. By 2010, Swift had detected 500 gamma-
ray burst, and it found that over 90 percent of them had X-ray
afterglows, and over 50 percent had optical afterglows. Through
this kind of information, distances have now been determined for
well over 100 of these gamma-ray bursts.
z
Perhaps the most remarkable gamma-ray burst observed by Swift
occurred on March 19, 2008. Its long gamma-ray pulse lasted about
60 seconds, with an energy among the highest ever measured for a
gamma-ray burst. Its X-ray and optical afterglow initially blinded
the Swift detectors. Indeed, the optical afterglow was by far the
brightest ever recorded for a gamma-ray burst.
z
It was easily seen by ground-based all-sky monitors. It was bright
enough to be seen with the naked eye for 30 seconds. It then
quickly faded by 100 times in about 3 minutes. Its redshift indicates
a distance of 7.5 billion light-years. This is the most distant thing
ever detectable by eye by far. It easily beats M33 at 2.8 million
light-years, and it’s even farther than 3C 273 and the Bullet cluster.
z
Why was this gamma-ray burst so luminous? Indeed, it was
2.5 million times more luminous than a typical supernova. It’s
possible for such a gamma-ray burst to be that bright in the
context of the hypernova model, but it would require an extremely
narrow jet. In other words, we just were lucky enough to be within
that jet, which must have been on the order of 0.4 degrees wide.
And the jet ejecta had to be moving at a speed on the order of
99.99995 percent the speed of light. That is a rare view inside the
beam of such a narrow jet.
z
What if a gamma-ray burst like this one occurred in the Milky
Way? The very massive star Eta Carinae will likely explode as a

117
supernova sometime in the next several 100,000 years. Suppose
that it explodes as a gamma-ray burst just like the one on March 19,
2008, with a jet pointed right at Earth. Given Eta Carinae’s distance
of 7500 light-years, such a gamma-ray burst would be almost as
bright as the Sun on the sky.
z
7KHRSWLFDOÀDVKIURP(WD&DULQDHDVDJDPPDUD\EXUVWZRXOGQ¶W
hurt the Earth, but the gamma rays themselves, even though they
might not last for a long time, would have a dramatic effect on
the atmosphere.
z
The gamma rays would destroy much of the ozone layer on the
facing hemisphere of Earth. Globally, the ozone layer would be
reduced by more than 30 percent. The solar ultraviolet increase
would kill many microorganisms. This effect could ripple up the
food chain, resulting in a possible mass extinction. It would take
years for the atmosphere to recover. Other radiation effects could
also help promote an extinction.
z
Should we add gamma-ray bursts to our cosmic worry list? There
LV QR GH¿QLWLYH HYLGHQFH RI SDVW JDPPDUD\EXUVWFDXVHG PDVV
extinctions. In addition, Eta Carinae’s rotation axis is not pointed
at Earth. And long gamma-ray bursts are rare in mature spirals like
the Milky Way. Their galaxy hosts are mostly distant star-forming
dwarf irregulars. These young galaxies have low metals and many
massive stars. NGC 4214, which is 5000 light-years across, is a
nearby example, at a distance of 10,000,000 light-years.
z
Such young galaxies were much more common when the universe
was younger. Thus, it is not surprising that most of the long gamma-
ray bursts correspond to distances greater than 7 billion light-years.
The Hubble Ultra Deep Field is the deepest optical image of the
universe made to date. Among the 10,000 galaxies in this image
spanning a few arc minutes, the most distant are small, active star-
formers dating back to less than a billion years after the big bang.

118
Lecture 17: The Cosmic Reach of Gamma-Ray Bursts
Bloom, What Are Gamma-Ray Bursts?
Mazure and Basa, Exploding Superstars.
Wheeler, Cosmic Catastrophes.
1.
:K\KDVWKHRULJLQRIJDPPDUD\EXUVWVEHHQVRGLI¿FXOWWRSLQGRZQ"
Would it have been easier if they were similarly brief, non-repeating
radio bursts?
2.
According to the hypernova model, why is it extremely unlikely
that any gamma-ray burst in the local universe would originate in an
elliptical galaxy?
Suggested Reading
Questions to Consider

119
The Afterglow of the Big Bang
Lecture 18
A
s the ultimate background, the cosmic microwave background frames
all of the foreground dust, stars, and galaxies that you have learned
about throughout this course. The cosmic microwave background also
provides a background in time as the afterglow of the big bang. The signature
RILWVDQLVRWURSLHVUHÀHFWVWKHHYROYLQJFRVPRVWKURXJKZKLFKZHREVHUYHWKLV
most ancient light. In this course, as you have traveled from the Earth through
the solar system and the Milky Way to the most distant galaxies, quasars,
and gamma-ray bursts, you have learned how vital space probes and space
observatories have been to our understanding of the cosmos.
The Big Bang
z
As we gaze out farther into space with Hubble, we see galaxies
at distances of millions to billions of light-years in images that
span over 10 billion years in time. At optical wavelengths, all
of these galaxies are framed in a background of darkness. Does
this ultimate background extend back to a particular time, or is it
LQ¿QLWHLQLWVGHSWK"
z
The key clue to its understanding comes from much longer
wavelengths, where the sky is bathed in a background of microwave
radiation. The simplest interpretation of this radiation is that it dates
back to a time 13.7 billion years ago, when the universe was much
smaller, hotter, denser, and as bright as the Sun.
z
Detailed observations of the cosmic microwave background with
the Wilkinson Microwave Anisotropy Probe space observatory have
UHYHDOHGWLQ\YDULDWLRQVLQGLFDWLYHRIGHQVLW\ÀXFWXDWLRQVLQWKHHDUO\
XQLYHUVH $V WKH XQLYHUVH H[SDQGHG DQG FRROHG WKHVH ÀXFWXDWLRQV
evolved into the large-scale structure of galaxies seen today.
z
The view that the cosmos is evolving from a singular origin in time
is consistent with observations of quasars as a function of distance

120
Lecture 18: The
Afterglow of the Big Bang
and Edwin Hubble’s discovery that the universe is expanding.
However, prior to 1965, there was no smoking gun pointing
conclusively to a hot big-bang model.
z
7KHLGHDRIVXFKDELJEDQJZDV¿UVWH[SORUHGTXDQWLWDWLYHO\E\WKH
physicist George Gamow and his students Ralph Alpher and Robert
Herman shortly after World War II. They really weren’t focused on
what caused the big bang itself; instead, they were thinking about
what would have happened shortly after the big bang. At those
times, such a universe would be very hot and very dense and have
FKDUDFWHULVWLFVYHU\VLPLODUWRZKDWZH¿QGDWWKHFHQWHUVRIVWDUV
today: nuclear fusion, or the conversion of hydrogen into helium
and heavier elements.
z
In 1949, Alpher and Herman published a paper that looked at the
radiation that would be associated with a big-bang universe. At these
early times, they realized that there would be a lot of radiation, and
the radiation would acquire a blackbody spectrum. At those early
times, this would be a very hot blackbody spectrum. It would peak
at X-ray to gamma-ray wavelengths. As the universe expanded and
cooled off, this blackbody radiation would also slowly cool off.
z
In thinking about this, Alpher and Herman realized that this
radiation signature could still be observed today. They predicted
that even today there should be existing afterglow of the big bang
observable as an approximately 5-degree-kelvin blackbody that
would peak at microwave wavelengths. At the time, they also
realized that the technology didn’t exist to try to detect such a faint
signal peaking at microwave wavelengths.
z
By the 1950s, it became clear that the big-bang fusion of the
elements didn’t work beyond helium and lithium. The reason
is, simply, that the universe expanded too fast. During this same
time, other scientists discovered that the bulk of the elements in
the periodic table are produced through stellar nucleosynthesis, not
big-bang nucleosynthesis. As a result of this evolution in thinking,

121
the work that Alpher and Herman did on the cosmic microwave
background was essentially forgotten.
z
In 1965, at Bell Labs in New Jersey, Arno Penzias and Robert
Wilson were testing sensitive microwave-receiving systems for
satellite communications. They were doing this work with a 20-foot
horn antenna, working at a radio wavelength of about 7 centimeters.
z
In doing this work, they found that there was always a source
of noise in their measurements. This noise was equivalent to
something with a radiation temperature of about 3.5 degrees kelvin.
It was completely isotropic across the sky, and there were no
variations with time. They checked their antenna to see if there was
some kind of problem with it or if there was some source of noise in
the neighborhood. They found no terrestrial explanation. They were
also completely unaware of the prediction that Alpher and Herman
had made about 16 years earlier.
z
Eventually, they made contact with a group of Princeton
astrophysicists who had independently repredicted Alpher and
Herman’s original calculations. Together they realized that
Penzias and Wilson had discovered the afterglow signature of the
big bang itself—this cosmic microwave background. In 1978,
Penzias and Wilson won the Nobel Prize for this completely
serendipitous discovery.
z
Perhaps the most amazing twist to this story is that indirect evidence
RIWKHFRVPLFPLFURZDYHEDFNJURXQGDFWXDOO\¿UVWDURVHLQ
This evidence involved the nearby runaway star Zeta Ophiuchi. The
Spitzer infrared images of Zeta Ophiuchi had a beautiful infrared
bow shock. Any optical light that might be associated with this
bow shock would be obscured by the dust cloud in front of Zeta
Ophiuchi, making it so much fainter than it would be without the
dust in front of it. In addition to the dust in this cloud, the cloud also
contains simple molecules, including cyanogen molecules. This
molecule can be found in an optical spectrum of Zeta Ophiuchi.

122
Lecture 18: The
Afterglow of the Big Bang
z
In 1941, Canadian astronomer Andrew McKellar set out to
analyze this weak cyanogen absorption. He found that the
cyanogen molecules were being heated up by something. This
seemed to indicate that space had a temperature of about 2 degrees
kelvin. He published this result in an optical astronomy journal.
If Gamow, Alpher, and Herman had read McKellar’s paper in
1949, they could have seen that the microwave background they
predicted had been discovered.
z
After Penzias and Wilson, it was realized that the cyanogen
was sampling this cosmic microwave background radiation
at a wavelength near the wavelength peak of the radiation—a
wavelength where we can’t directly see it because of our
atmosphere’s obscuration.
The Cosmic Background Explorer
z
In order to better measure the predicted blackbody spectrum
and isotropy of the cosmic microwave background beyond the
obscuration of our atmosphere, space observations of increasing
sensitivity have been carried out over the past 25 years.
z
The Cosmic Background Explorer (COBE) was launched in 1989 to
pioneer this space effort. It was equipped with three instruments—
DIRBE, DMR, and FIRAS—and cooled by liquid helium and
a thermal shield to block any contaminating radiation from the
(DUWKDQGWKH6XQ),5$6\LHOGHGWKH¿UVWUHDOO\LPSRUWDQWUHVXOW
from COBE. It found that this radiation had essentially a perfect
blackbody spectrum with a temperature of 2.73 degrees kelvin,
which was exactly as predicted by standard big-bang cosmology.
z
In the standard big bang, the early universe is as bright as the Sun’s
interior everywhere and consists of a dense, hot gas of mostly
ionized hydrogen. As the photons scatter off the electrons in this
gas, they acquire a blackbody spectrum in thermal equilibrium with
the gas and keep the universe bright.

123
z
As the universe expands, it cools to 3000 kelvin after 380,000
years. The photons in the early universe no longer have the energy
to keep the hydrogen ionized. Then, the electrons and the protons
recombine into hydrogen atoms, and the electrons that have been
keeping the photons basically bottled up are gone. Then, the
universe goes dark, and photons stream through the gas.
z
Since this so-called recombination epoch, the universe has
expanded a factor of 1000 in size. Due to this huge expansion,
the blackbody photons have been redshifted—their wavelengths
stretched from the optical to the microwave. Thus, the observed
microwave background we see today is a picture of the universe
when it was 380,000 years old. We can’t see beyond this ultimate
background—we can’t look back farther than this time—because at
earlier times, the universe was opaquely bright.
z
The goal of the COBE cosmic microwave background isotropy
REVHUYDWLRQVZDVWRVHDUFKIRUWKHVPDOOVFDOHGHQVLW\ÀXFWXDWLRQV
in the 380,000-year-old universe that gave rise to the large-
scale galaxy structures observed today. The entire sky was
surveyed at high sensitivity and 7 degrees resolution in search
of the corresponding spatial variations in the cosmic microwave
background temperature. A key challenge in analyzing any such
all-sky map is separating out the true background from foreground
radiation sources.
z
For example, consider the DIRBE infrared sky map. In the case of
the microwave background using the COBE DMR experiment, the
cosmic microwave background radiation is completely isotropic,
down to a sensitivity of just 0.2 percent. But as you increase the
sensitivity higher, you see a dipole anisotropy, where anisotropy
means that you see different temperatures in different directions.
&2%(ZDVWKH¿UVWRQHWRFRQYLQFLQJO\¿QGVPDOOVFDOHYDULDWLRQV
in the temperature of the cosmic microwave background. In other
ZRUGVLWZDVWKH¿UVWFOHDUGHWHFWLRQRIVPDOOVFDOHDQLVRWURS\LQ
the cosmic microwave background.
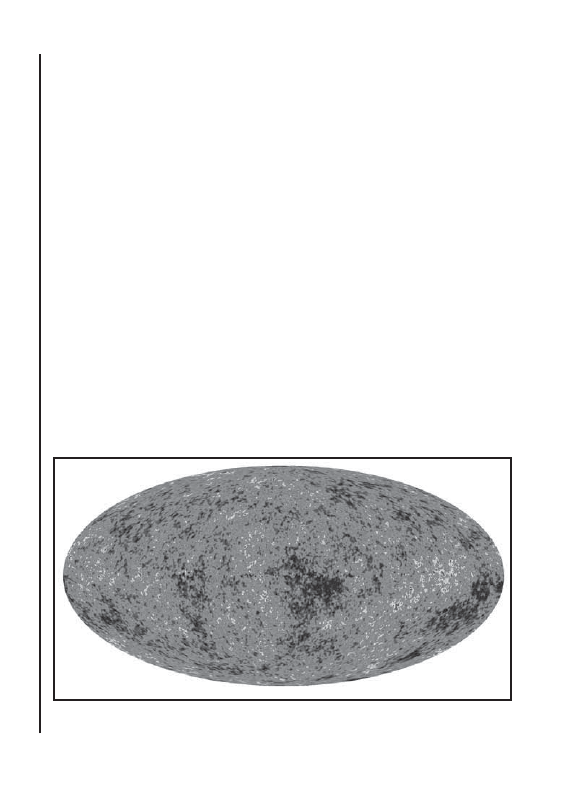
124
Lecture 18: The
Afterglow of the Big Bang
WMAP and Planck
z
The Wilkinson Microwave Anisotropy Probe (WMAP) space
observatory was launched in 2001 to better measure and
characterize the cosmic microwave background anisotropy at
much smaller angular scales than COBE. The WMAP 10-arc-
minute resolution is over 30 times higher than COBE. It collects
microwaves with two 1.5-meter dishes. It orbits Earth from about
1.5 million kilometers away.
z
With the map of the cosmic microwave background provided by
WMAP, and then with other data showing how the universe has
evolved over time in terms of galaxies, we can model what the
cosmic microwave background should be, in terms of its tiny
anisotropies, with the gravity and physics we know about. And
the amazing thing is that we can reproduce the large-scale galaxy
structure we see today evolving over time.
z
Of course, there are still many questions remaining about this
evolving universe. We still don’t know what caused the big bang.
:KDWLVWKHGDUNPDWWHU":H¶UHVWLOOWU\LQJWR¿JXUHWKDWRXW7KHUH
The cosmic microwave background reveals the slight patchiness coming from
glowing sound waves that become, over time, galaxies and stars.
© NASA/W
ikimedia Commons/Public Domain.

125
is a lot that we don’t know, but the point is that the big picture
VHHPVWR¿WWRJHWKHU
z
Because the seeds of today’s universe are embedded in the cosmic
microwave background, it continues to be a focus of detailed
investigation. The very latest all-sky map of the cosmic microwave
background just released is from the Planck Space Observatory.
%DVHGRQ3ODQFN¶V¿UVWPRQWKVRIGDWDWKLVLVWKHPRVWVHQVLWLYH
map yet of the cosmic microwave background.
z
Its angular resolution is 2.5 times that of WMAP. The science
UHVXOWVLQWKH¿UVWGDWDUHOHDVHIURP3ODQFNVKRZDXQLYHUVHWKDW¶V
PRVWO\FRQVLVWHQWZLWKZKDWZH¶YHIRXQGIURP:0$33ODQFN¿QGV
that the universe is about 13.8 billion years old instead of WMAP’s
13.7. Planck also tells us close to what WMAP tells us—that the
universe has about 5.5 times as much dark matter as the stuff we’re
made out of. The Planck map also shows us that the universe is
indeed dominated by this thing called dark energy, which is causing
an accelerated expansion of the universe.
z
Over the ensuing years, Planck will continue to dig more and more
cosmic clues from this cosmic microwave background radiation,
which is so important because it unlocks all the secrets in the early
universe. There is a lot more we can learn from this radiation.
Lemonick, Echo of the Big Bang.
Loeb, How Did the First Stars and Galaxies Form?
Singh, Big Bang.
Suggested Reading

126
Lecture 18: The
Afterglow of the Big Bang
1.
Why isn’t it possible to measure the isotropy of the cosmic microwave
background radiation using the temperatures provided by cyanogen
molecules in different sight lines through the galactic interstellar
medium?
2.
If cyanogen molecules could be detected in a spiral galaxy at a distance
of 1 billion light-years, they should indicate a higher microwave
background temperature than those in the Milky Way. Why?
Questions to Consider

127
Bibliography
Bartusiak, Marcia. Archives of the Universe: 100 Discoveries That
Transformed Our Understanding of the Cosmos. New York: Vintage
Books, 2004. A masterful compilation of the original discovery papers of
astrophysical phenomena ranging from exoplanets to the cosmic microwave
background radiation—all presented with insightful introductions for the
general reader.
Beatty, J. Kelly. “Saturn’s Amazing Rings.” Sky and Telescope 125 (May
2013): 18–25. An informative, well-illustrated, popular article about
Cassini’s observations of Saturn’s rings.
Bell, Jim. “Dawn’s Early Light: A Vesta Fiesta!” Sky and Telescope 122
(November 2011): 32–37. An excellent, well-illustrated, popular article
about Dawn’s mission to the asteroid Vesta.
———. Postcards from Mars: The First Photographer on the Red Planet.
New York: Penguin Books, 2006. A beautiful album of the Mars rovers and
their images from the surface of the Red Planet.
———. “Protoplanet Close-Up.” Sky and Telescope 124 (September 2012):
32–37. An informative, well-illustrated, popular article about the nature and
history of Vesta as revealed by the Dawn spacecraft.
Bennett, Jeffrey, and Seth Shostak. Life in the Universe. 3
rd
ed. San
Francisco: Addison-Wesley, 2012. A thorough, well-illustrated introductory
textbook on astrobiology.
Benson, Michael. Planetfall: New Solar System Visions. New York: Abrams,
2012. A beautiful compilation of some of the most spectacular space images
of the solar system.

128
Bibliography
Bloom, Joshua S. What Are Gamma-Ray Bursts? Princeton, NJ: Princeton
University Press, 2011. A thorough introduction to the astrophysics of
gamma-ray bursts.
Devorkin, David, and Robert W. Smith. Hubble: Imaging Space and Time.
New York: Random House, 2008. A beautiful compilation and discussion of
the most spectacular images taken by the Hubble Space Telescope.
Duncan, Todd, and Craig Tyler. Your Cosmic Context: An Introduction to
Modern Cosmology. San Francisco: Pearson Addison-Wesley, 2009. A
thorough, well-written introductory textbook on cosmology.
Gates, Evalyn. Einstein’s Telescope: The Hunt for Dark Matter and Dark
Energy in the Universe. New York: W. W. Norton, 2009. A well-written
introduction to the astrophysics of gravitational lenses, dark matter, and dark
energy.
Gorn, Michael. NASA: The Complete Illustrated History. London: Merrell,
2005. A well-written, well-illustrated introduction to the history of NASA.
Greenberg, Richard. Unmasking Europa: The Search for Life on Jupiter’s
Ocean Moon. New York: Copernicus Books, 2008. A detailed introduction to
the Jovian ice moon Europa and its strong evidence for a subsurface ocean
of liquid water.
+DUWTXLVW 7 : - ( '\VRQ DQG ' 3 5XIÀH Blowing Bubbles in the
Cosmos: Astronomical Winds, Jets, and Explosions. New York: Oxford
University Press, 2004. A detailed introduction to the astrophysics of mass
loss from stars and active galactic nuclei.
Kaler, James B. Extreme Stars: At the Edge of Creation. Cambridge, UK:
Cambridge University Press, 2010. A well-written introduction to the
astrophysics of stars and the Hertzsprung–Russell diagram.
———. The Hundred Greatest Stars. New York: Springer, 2002. A well-
illustrated introduction to the wide variety of stars in the Milky Way Galaxy.

129
Kasting, James. How to Find a Habitable Planet. Princeton, NJ: Princeton
University Press, 2010. A thorough introduction to the search for habitable
planets around other stars.
Kay, Laura, Stacy Palen, Bradford Smith, and George Blumenthal. 21
st
Century Astronomy. 4
th
ed. New York: W. W. Norton, 2013. A thorough,
well-illustrated introductory textbook on astronomy.
Kitchin, Chris. Galaxies in Turmoil: The Active and Starburst Galaxies and
the Black Holes That Drive Them. New York: Springer, 2007. A well-written
introduction to the astrophysics of quasars and active galaxies.
Lemonick, Michael D. Echo of the Big Bang. Princeton, NJ: Princeton
University, 2003. A well-written introduction to WMAP and its observations
of the cosmic microwave background radiation.
———. Mirror Earth: The Search for Our Planet’s Twin. New York: Walker
& Company, 2012. A well-written introduction to the Kepler mission and the
search for earthlike exoplanets.
Loeb, Abraham. How Did the First Stars and Galaxies Form? Princeton,
NJ: Princeton University Press, 2010. A detailed introduction to our current
XQGHUVWDQGLQJRIKRZWKH¿UVWVWDUVDQGJDOD[LHVIRUPHGLQWKHXQLYHUVH
Lovett, Laura, Joan Horvath, and Jeff Cuzzi. Saturn: A New View. New York:
Abrams, 2006. A beautiful album of images from Cassini’s view of Saturn,
its rings, and its moons.
Mackie, Glen. The Multiwavelength Atlas of Galaxies. Cambridge, UK:
Cambridge University Press, 2011. A well-illustrated introduction to the
multiwavelength appearance of a variety of galaxies.
Mazure, Alain, and Stephane Basa. Exploding Superstars: Understanding
Supernovae and Gamma-Ray Bursts. New York: Springer, 2009. A well-
written introduction to the astrophysics of supernovas and gamma-ray bursts.

130
Bibliography
Melia, Fulvio. The Black Hole at the Center of the Galaxy. Princeton, NJ:
Princeton University Press, 2003. An excellent introduction to the physics of
black holes and the galactic center.
Moldwin, Mark. An Introduction to Space Weather. Cambridge, UK:
Cambridge University Press, 2008. A concise introduction to the astrophysics
of solar activity and its impact on the Earth’s environment.
Panek, Richard. The 4 Percent Universe: Dark Matter, Dark Energy, and
the Race to Discover the Rest of Reality. New York: Mariner Books, 2011. A
popular introduction to the scientists behind the search for dark matter and
dark energy in the universe.
Pasachoff, Jay M., and Alex Filippenko. The Cosmos: Astronomy in the New
Millenium. 4
th
ed. Cambridge, UK: Cambridge University Press, 2013. A
thorough, well-illustrated introductory textbook on astronomy.
Pesnell, W. Dean. “Opening a New Window on the Sun.” Astronomy 39
(May 2011): 24–29. An informative, well-illustrated, popular article about
the Solar Dynamics Observatory.
Pyne, Stephen J. Voyager: Exploration, Space, and the Third Great Age
of Discovery. London: Penquin Books, 2010. An excellent, well-written
account of the exploration of the solar system by the Voyager space probes.
Rich, Michael. “Galaxies Seen in a New Light.” Sky and Telescope 123
(April 2012): 20–25. An informative, well-illustrated, popular article about
the GALEX mission and its ultraviolet observations of Andromeda and other
galaxies.
Rowan-Robinson, Michael. Night Vision: Exploring the Infrared Universe.
Cambridge: Cambridge University Press, 2013. A well-written introduction
to the history and modern science of infrared astronomy.
Scharf, Caleb. Gravity’s Engines: How Bubble-Blowing Black Holes Rule
Galaxies, Stars, and Life in the Cosmos
1HZ <RUN 6FLHQWL¿F$PHULFDQ

131
2012. A well-written introduction to the astrophysics of black holes and
quasars.
Singh, Simon. Big Bang: The Origin of the Universe. New York:
HarperCollins, 2004. An excellent, well-written introduction to the history
and astrophysics of big-bang cosmology.
Sparke, Linda S., and Jay S. Gallagher III. Galaxies in the Universe. 2
nd
ed.
Cambridge, UK: Cambridge University Press, 2007. A detailed introductory
textbook on the structure and astrophysical characteristics of the Milky Way
Galaxy and other galaxies.
Squyres, Steve. Roving Mars: Spirit, Opportunity, and the Exploration of the
Red Planet. New York: Hyperion, 2005. A well-written insider’s account of
the development, launch, and operation of the Spirit and Opportunity rovers
on Mars.
Struck, Curtis. Galaxy Collisions: Forging New Worlds from Cosmic
Crashes. New York: Springer, 2011. A well-written introduction to the
astrophysics of interacting galaxies.
Taylor, Fredric W.
7KH 6FLHQWL¿F ([SORUDWLRQ RI 0DUV. Cambridge, UK:
Cambridge University Press, 2010. A detailed introduction to the past,
present, and future space exploration of Mars.
Van Den Bergh, Sidney. The Galaxies of the Local Group. Cambridge, UK:
Cambridge University Press, 2000. A thorough introduction to the galaxies
of the Local Group.
9LOODUG5D\³6N\¿UH7KH,PSHQGLQJ%LUWKRI2XU6XSHUJDOD[\´Astronomy
41 (April 2013): 24–29. An excellent, well-illustrated, popular article about
the future collision of the Andromeda Galaxy with the Milky Way.
Waller, William H. The Milky Way: An Insider’s Guide. Princeton, NJ:
Princeton University Press, 2013. A well-written introduction to the Milky
Way Galaxy revealed by the latest multiwavelength observations.

132
Bibliography
Weaver, Kimberly. The Violent Universe: Joyrides through the X-ray
Cosmos. Baltimore, MD: Johns Hopkins University Press, 2005. A well-
illustrated introduction to the Chandra X-ray telescope and its observations
of the X-ray universe.
Wheeler, J. Craig. Cosmic Catastrophes: Exploding Stars, Black Holes,
and Mapping the Universe. 2
nd
ed. Cambridge, MA: Cambridge University
Press, 2007. A thorough introduction to the astrophysics of stellar evolution
and supernovas.
Wilkinson, John. New Eyes on the Sun: A Guide to Satellite Images and
Amateur Observation. New York: Springer, 2012. A detailed introduction to
solar astrophysics and space observations of the Sun.
Yeomans, Donald K. Near-Earth Objects: Finding Them Before They
Find Us. Princeton, NJ: Princeton University Press, 2012. A well-written
introduction to comets and asteroids and the threat posed by those in Earth’s
vicinity.
Zimmerman, Robert. The Universe in a Mirror: The Saga of the Hubble
Space Telescope and the Visionaries Who Built It. Princeton, NJ: Princeton
University Press, 2008. An excellent behind-the-scenes history of the Hubble
Space Telescope, from its original idea through its many discoveries in orbit.
Wyszukiwarka
Podobne podstrony:
Guide to the properties and uses of detergents in biology and biochemistry
A Guide to the Law and Courts in the Empire
Jouni Yrjola Easy Guide to the Classical Sicilian (feat Richter Rauzer and Sozin Attacks)
Players Guide to the Sabbat (Text Only) 1992
Newbie's Guide to the AVR ADC
Guide to the installation of PV systems 2nd Edition
Guide to the Gods A fuller and more detailed list of Asatru heathen deities
Guide to the properties and uses of detergents in biology and biochemistry
A Guide to the Law and Courts in the Empire
Guide to the Picatrix
Guide to the Names in The Lord J R R Tolkien
Jouni Yrjola Easy Guide to the Classical Sicilian (feat Richter Rauzer and Sozin Attacks)
Narratology A Guide to the Theory of Narrative
FLOTATION TOY WARNING Bluffers Guide to the Flight Deck CD (MSR36, Misra)msr36
Guide to the Names in The Lord J R R Tolkien
więcej podobnych podstron