Grupa AiR 4 Data wykonania ćwiczenia
1999-04-19
LABORATORIUM
PODSTAW
ELEKTRONIKI
Sekcja 2
Piotr Lubszczyk
Jacek Macioła
Jakub Trznadel
1. OPIS ĆWICZENIA
W ćwiczeniu dokonujemy pomiarów charakterystyk elementów optoelektronicznych:
Fotorezystora
Fotodiody
Fototranzystora
transpotora
2.SCHEMATY POMIAROWE
Schemat obwodu do badania fotorezystora
Schemat obwodu do pomiaru fotodiody
2.3. Schemat obwodu do pomiaru transoptora
2.4. Schemat obwodu do pomiaru fototranzystora
W schemacie 2.1 dla różnych prądów żarówki oświetlającej fotorezystor dokonujemy pomiaru prądu przepływającego przez fotoelement w funkcji zmieniającego się napięcia. Podobnie dla fotodiody (2.2) oraz fototranzystora(2.4). W schemacie z 2.3 dokonujemy pomiaru prądu wyjściowego transoptora w funkcji prądu wejściowego
Opracowanie wyników
3.1. Tabela pomiarowa fotorezystora
Żarówka |
0 mA |
25 mA |
30 mA |
35 mA |
40 mA |
U [V] |
IR[μA] |
IR[μA] |
IR[μA] |
IR[μA] |
IR[μA] |
-10 |
-1,8 |
-33 |
-198,0 |
-704 |
-1846 |
-9 |
-1,5 |
-29,6 |
-178,4 |
-623 |
-1634 |
-8 |
-1,4 |
-25,8 |
-155,5 |
-545 |
-1433 |
-7 |
-1,2 |
-22,1 |
-133,7 |
-469 |
-1240 |
-6 |
-1 |
-18,5 |
-112,5 |
-393 |
-1052 |
-5 |
-0,8 |
-15,1 |
-92,2 |
-316 |
-870 |
-4 |
-0,6 |
-11,8 |
-72,8 |
-247 |
-691 |
-3 |
-0,5 |
-8,7 |
-53,1 |
-182 |
-499 |
-2 |
-0,3 |
-5,6 |
-36,3 |
-124 |
-325 |
-1 |
-0,2 |
-2,8 |
-17,2 |
-62 |
-160 |
0 |
0,0 |
0,0 |
0,0 |
0 |
0 |
1 |
0,1 |
2,6 |
15,6 |
59 |
160 |
2 |
0,2 |
5,5 |
32,6 |
121 |
323 |
3 |
0,4 |
8,7 |
50,4 |
185 |
492 |
4 |
0,5 |
12,0 |
69,0 |
252 |
672 |
5 |
0,7 |
15,5 |
88,5 |
321 |
851 |
6 |
0,9 |
19,1 |
108,5 |
392 |
1034 |
7 |
1 |
22,8 |
129,4 |
465 |
1225 |
8 |
1,2 |
26,8 |
150,5 |
540 |
1414 |
9 |
1,4 |
30,8 |
172,9 |
618 |
1603 |
10 |
1,5 |
35,1 |
195,5 |
696 |
1797 |
Tabela pomiarowa fotodiody
Żarówka |
0 mA |
25 mA |
30 mA |
35 mA |
40 mA |
UD[V] |
ID[μA] |
ID[μA] |
ID[μA] |
ID[μA] |
ID[μA] |
1 |
21 |
29,9 |
29,8 |
30,1 |
30 |
0,9 |
16,9 |
16,9 |
16,9 |
18 |
18 |
0,8 |
8 |
7,7 |
7,9 |
8,3 |
8 |
0,7 |
2,86 |
2,9 |
2,92 |
2,87 |
2,78 |
0,6 |
1,49 |
1,44 |
1,45 |
1,44 |
1,44 |
0,5 |
0,53 |
0,52 |
0,52 |
0,51 |
0,51 |
0,4 |
0,099 |
0,097 |
0,095 |
0,091 |
0,084 |
0,3 |
0,0096 |
0,0082 |
0,0057 |
0,0017 |
-0,0062 |
0,2 |
0,0006 |
-0,0014 |
-0,0038 |
-0,0099 |
-0,0196 |
0,1 |
0 |
-0,0016 |
-0,0051 |
-0,0111 |
-0,0202 |
0 |
0 |
-0,002 |
-0,0062 |
-0,0123 |
-0,0236 |
-2 |
0 |
-0,002 |
-0,0054 |
-0,0117 |
-0,0224 |
-5 |
0 |
-0,002 |
-0,0052 |
-0,0116 |
-0,0231 |
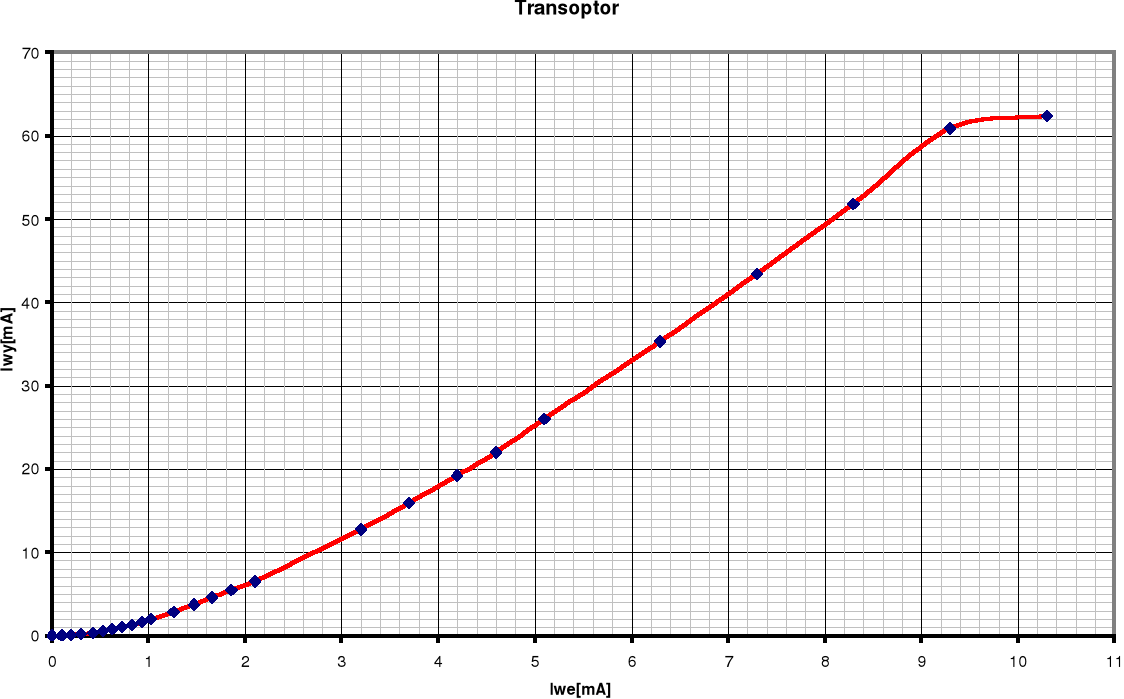
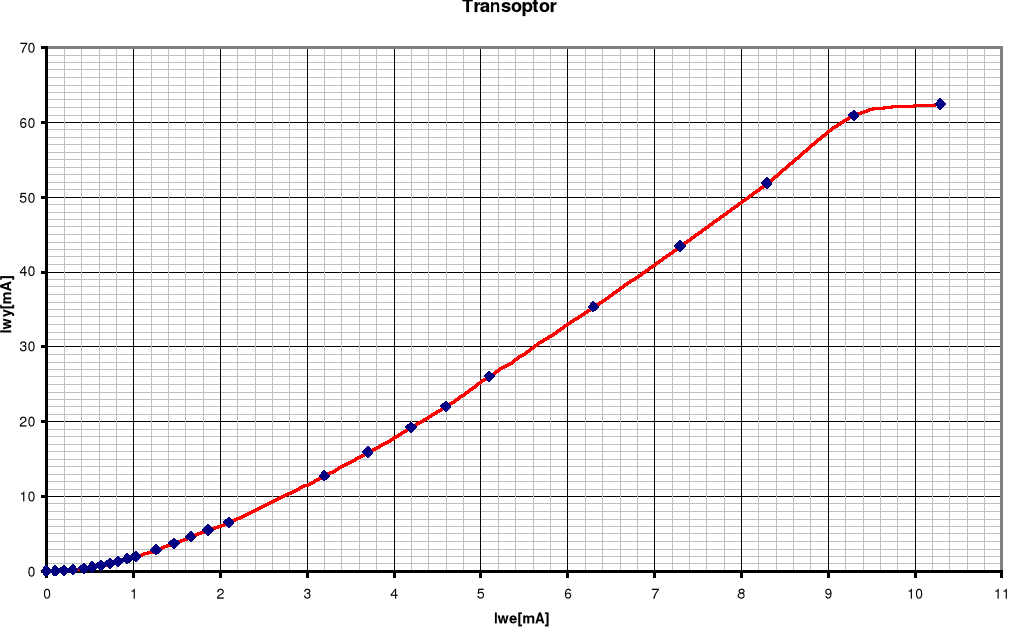
3.3. Tabela pomiarowa transoptora
Iwe |
0 |
0,11 |
0,22 |
0,32 |
0,42 |
0,53 |
0,63 |
0,73 |
0,83 |
0,93 |
1,03 |
1,26 |
1,47 |
Iwy |
0 |
0,01 |
0,11 |
0,19 |
0,34 |
0,53 |
0,77 |
1,03 |
1,32 |
1,63 |
1,97 |
2,86 |
3,7 |
Iwe |
1,66 |
1,86 |
2,10 |
3,2 |
3,7 |
4,2 |
4,6 |
5,1 |
6,3 |
7,3 |
8,3 |
9,3 |
10,3 |
Iwy |
4,58 |
5,52 |
6,52 |
12,7 |
15,9 |
19,2 |
22 |
26 |
35,3 |
43,4 |
51,8 |
60,9 |
62,4 |
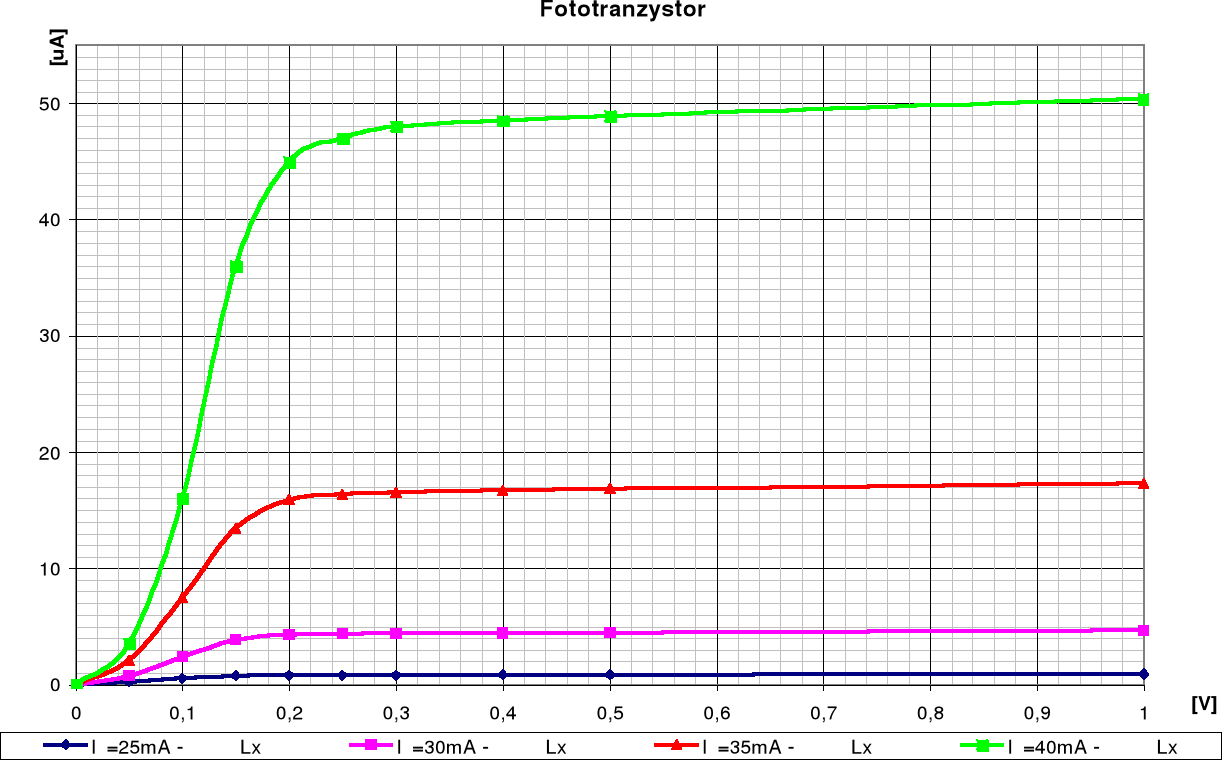
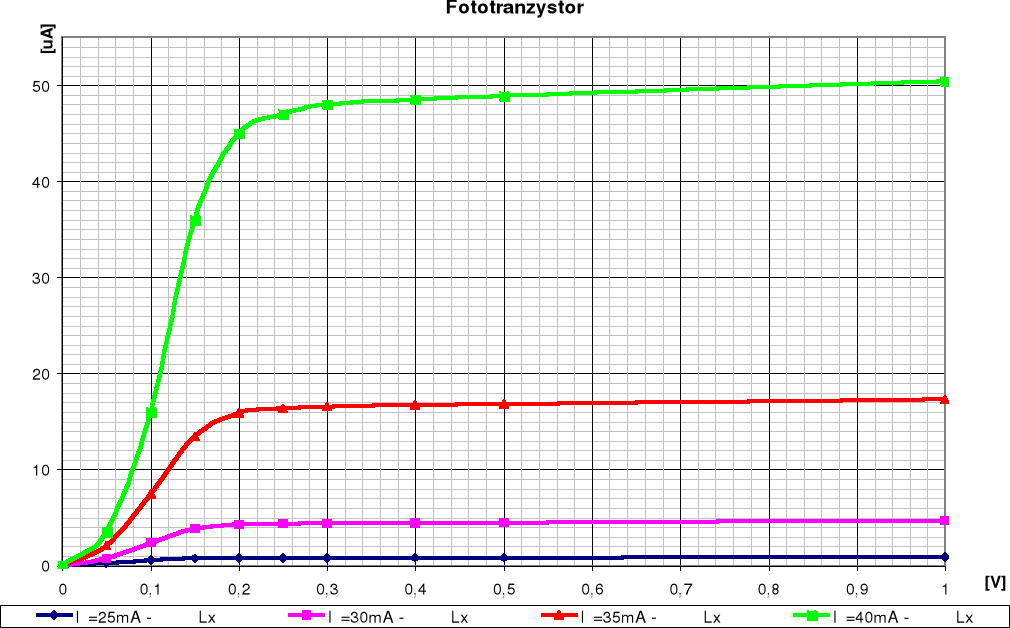
Tabela pomiarowa fototranzystora
Żarówka |
25 mA |
30 mA |
35 mA |
40 mA |
UCE[V] |
IC[uA] |
IC[uA] |
IC[uA] |
IC[uA] |
0,00 |
0,00 |
0,00 |
0,00 |
0,00 |
0,05 |
0,23 |
0,76 |
2,07 |
3,52 |
0,10 |
0,55 |
2,41 |
7,46 |
15,99 |
0,15 |
0,73 |
3,83 |
13,47 |
36,00 |
0,20 |
0,78 |
4,28 |
15,88 |
45,00 |
0,25 |
0,79 |
4,37 |
16,37 |
47,00 |
0,30 |
0,80 |
4,41 |
16,55 |
48,00 |
0,40 |
0,82 |
4,45 |
16,70 |
48,54 |
0,50 |
0,83 |
4,49 |
16,82 |
48,90 |
1,00 |
0,90 |
4,65 |
17,29 |
50,40 |
3.4. Czułość fotodiody.
![]()
Kolejne wartości dla poszczególnych ΔI i ΔE
S1=1.287
S2=0.946
S3=0.641
Przekładnia transoptora

Wyznaczona dla prądu wejściowego i wyjściowego odpowiadającym liniowej części charakterystyki transoptora :
K = 35.3/6.3 ≅ 5.65
Wartości K dla kolejnych punktów ch-ki :
K= |
0,140 |
0,525 |
0,620 |
0,806 |
1,000 |
1,222 |
1,411 |
1,590 |
1,753 |
1,913 |
2,270 |
2,517 |
2,759 |
2,968 |
3,105 |
3,975 |
4,297 |
4,571 |
4,783 |
5,098 |
5,603 |
5,945 |
6,241 |
6,548 |
6,058 |
Wnioski
Charakterystyka prądowo-napięciowa fotorezystora jest liniowa - tzn. jest on rezystorem. Jego opór wachał się od 5,6 MΩ (przy braku oświetlenia) do 5,5 kΩ (przy oświetleniu żarówką z płynącym przez nią prądem 40 mA )
Prąd płynący przez fotodiodę w kierunku zaporowym zależy od jej oświetlenia, natomiast nie zależy od napięcia. W kierunku przewodzenia powyżej napięcia około 0,3 V dioda zaczyna przewodzić prąd (rezystancja dynamiczna bliska 0), natomiast poniżej napięcia 0,3 V dioda działa jako źródło prądu. Prąd zwiększa się ze wzrostem natężenia światła
Dla transoptora ch-ka początkowo, jest nieliniowa, po czym staje się ch-ką liniową. Dla prądu powyżej 60 mA następuje jej załamanie z powodu ograniczeń źródła prądowego. Prąd tak jak w diodzie zwiększa się ze wzrostem natężenia światła. Ch-ki są podobne do ch-k wyjściowych normalnego tranzystora
mA
Temat: Elementy optoelektroniczne

mA
mA
mA
Wyszukiwarka