10ddg12

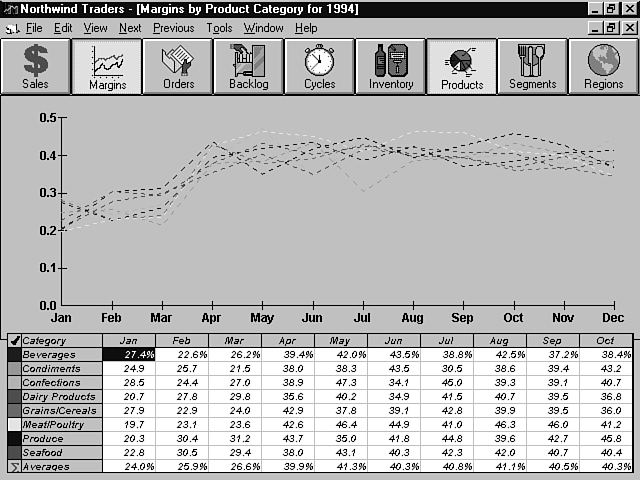
stfNoithwind Traders - [Margins by Producl Cal ego ry for 1994]
SuL File Edil View Nexl Previous Tools Window Help -Ifll X
|
$ |
'6 |
0 |
W |
W |
& | |||||
|
Sales |
Margins |
Orders |
Backlog |
Cycles |
lnvenlory |
Producls |
Segmenls |
Regions | ||
0.5-r

0.1 -
0.0-1-1-1-1-1-1-1-1-ł-1-1
Jan Feb Mar Apr May Jun Jul Aug Sep Oct Nov Dec
|
1 y | Category \ Jan |
Feb |
Mar |
Apr |
| May |
Jun |
Jul |
I Aug | |
Sep |
Oct | |
|
BBSe^rsges Condiments |
27.4% |
22.6% 25.7 |
26.2% 21.5 |
39.4% 38.0 |
42.0% 38.3 |
43.5% 43.5 |
38.8% 30.5 |
42.5% 38.6 |
37.2% 39.4 |
38.4% 43.2 |
|
1 Confections ^Ęoairy Products |
28.5 20.7 |
24.4 27.8 |
27.0 29.8 |
38.9 35.6 |
47.3 40.2 |
34.1 34.9 |
45.0 41.5 |
39.3 40.7 |
39.1 39.5 |
40.7 36.8 36.0 |
|
prażrts/Ceres/s |
27.9 |
22.9 |
24.0 |
42.9 |
37.8 |
39.1 |
42.8 |
39.9 |
39.5 | |
|
\~\Meaf/Poulfry |
19.7 |
23.1 |
23.6 |
42.6 |
46.4 |
44.9 |
41.0 |
46.3 |
46.0 |
41.2 46.8 40.4 40.3% |
|
^^Produce |
20.3 |
30.4 |
31.2 |
43.7 |
35.0 |
41.8 |
44.8 |
39.6 |
42.7 | |
|
1 | SeaFood IyM yeraoes |
22.8 24.0% |
30.5 25.9% |
29.4 26.6% |
38.0 39.9% |
43.1 41.3% |
40.3 40.3% |
42.3 40.8% |
42.0 41.1% |
40.7 40.5% | |
Wyszukiwarka
Podobne podstrony:
10ddg12 stfNoithwind Traders - [Margins by Producl Cal ego ry for 1994] SuL File Edil View Nexl Prev
10ddg12 stfNoithwind Traders - [Margins by Producl Cal ego ry for 1994] SuL File Edil View Nexl Prev
12ddg05 ;> Northwind Traders - [Sales by Product Category for 1994 - July] X File Edit View Next
slide0016 image071 TIA V5 - [Productl] n Start TeamPDM File Edit View Insert lools Ąnalyze Window He
slide0001 image013 0CATIA V5 - [Productl] ł3 Start TeamPDM File Edit View Insert lools Ąnalyze Windo
slide0005 image022 0CATIA V5 - [Productl] □ Start TeamPDM File Edit View Insert lools Ąnalyze Window
slide0008 image037 0CATIA V5 - [Productl] Start TeamPDM File Edit View Insert lools Ąnalyze Window H
slide0009 image042 0CATIA V5 - [Productl] Start TeamPDM File Edit View Insert lools Ąnalyze Window H
slide0011 image050 0CATIA V5 - [Productl] □ Start TeamPDM File Edit View Insert lools Ąnalyze Window
slide0012 image054 0CATIA V5 - [Productl] Start TeamPDM File Edit View Insert lools Ąnalyze Window H
slide0013 image058 0CATIA V5 - [Productl]3HE] Start TeamPDM File Edit View Insert lools Ąnalyze Wind
slide0015 image066 (a]CATIA V5 - [Productl] l!1 Start TeamPDM File Edit View Insert lools Ąnalyze Wi
slide0017 image075 HCATIAV5-[Product1] n Start TeamPDM File Edit View Insert lools Analyze Window He
slide0018 image081 0CATIA V5 - [Productl] □ Start TeamPDM File Edit View Insert lools Ąnalyze Window
slide0019 image085 0CATIA V5 - [Productl] Start TeamPDM File Edit View Insert lools Ąnalyze Window H
slide0020 image089 (a]CATIA V5 - [Productl] Cl Start TeamPDM File Edit View Insert lools Ąnalyze Win
slide0022 image098 CATIA V5 - [Productl] □ Start TeamPDM File Edit View Insert lools Ąnalyze Window
więcej podobnych podstron