promieniowanie�8
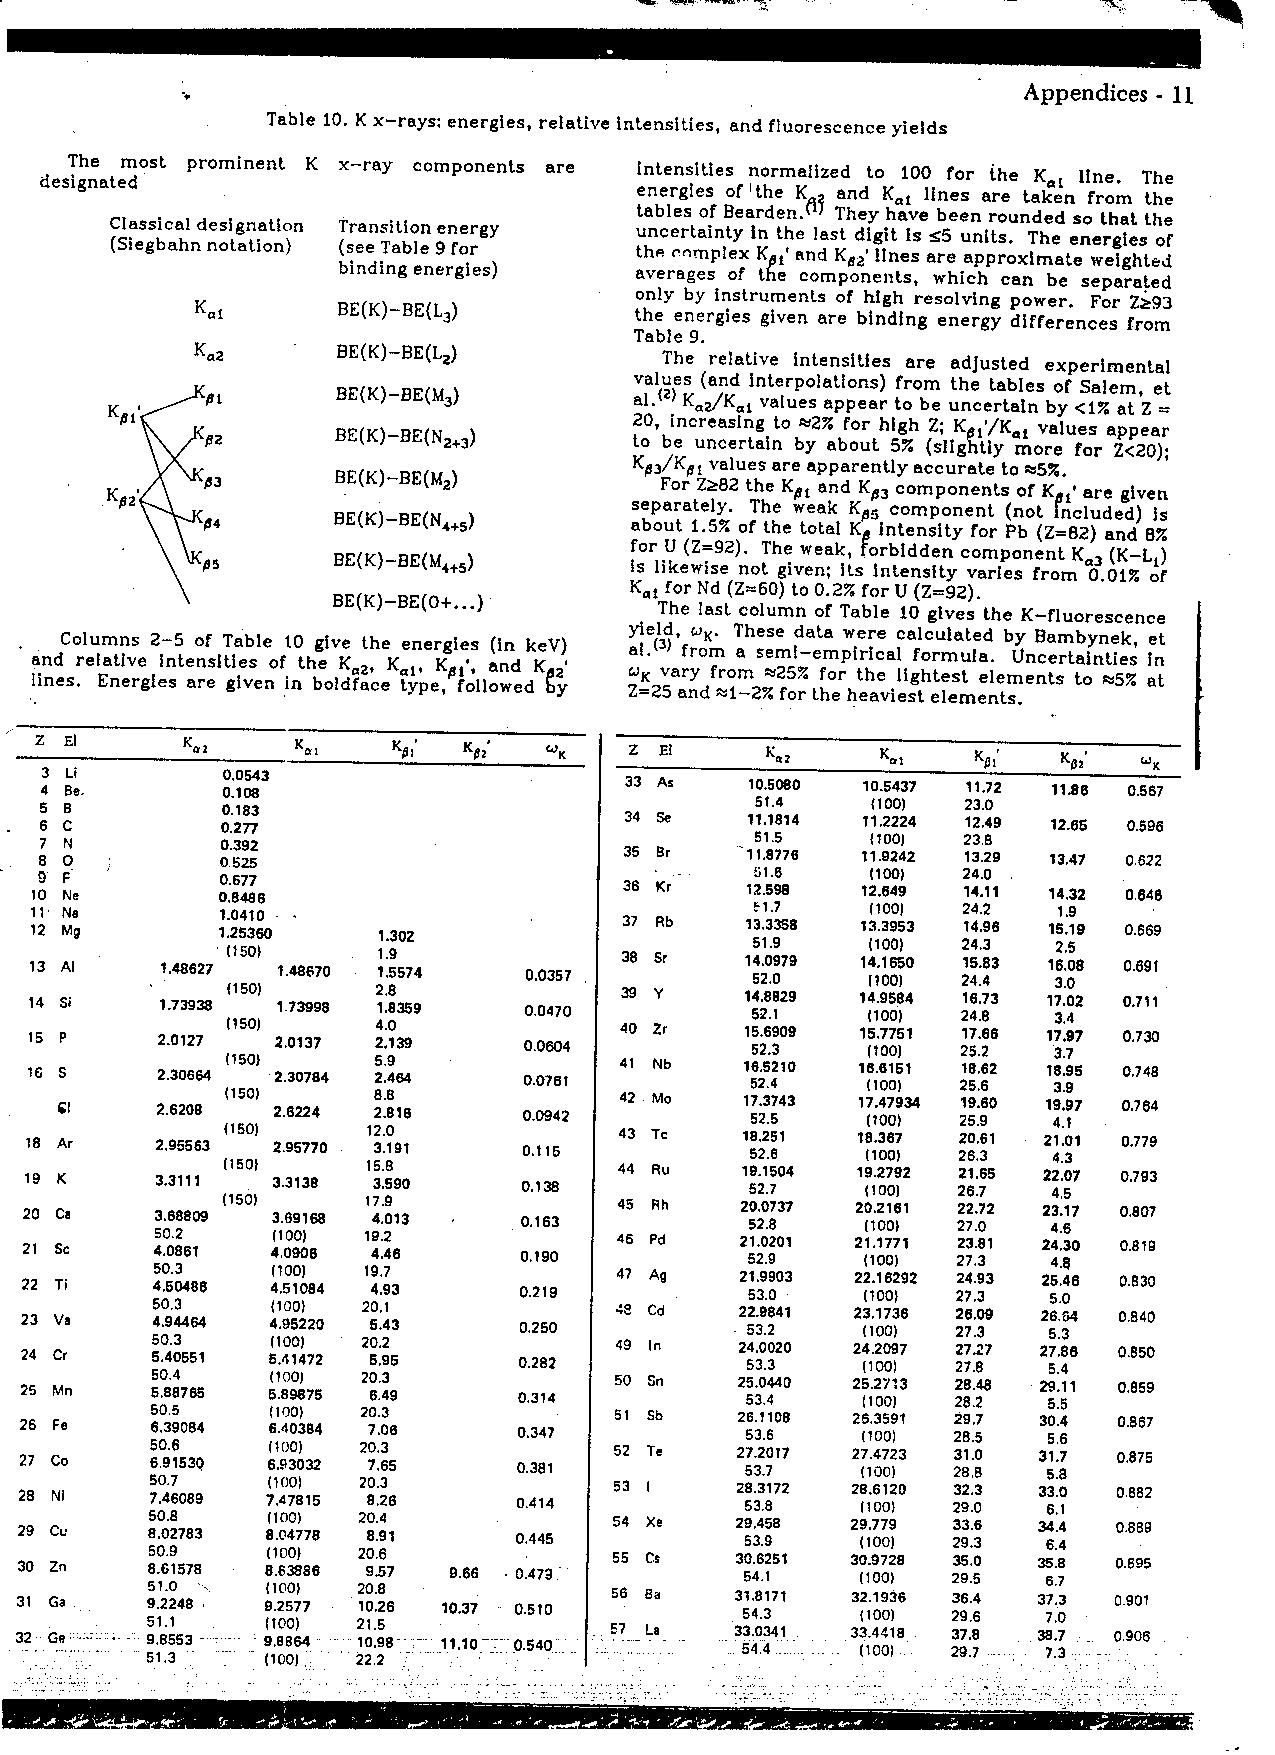
Table 10. K x-rays: energies, relative intenslties, and fiuorescence yields
Transition energy (see Table 9 for binding energies)
BE(K)-BE{L3)
BE(K)-BE(L2)
BE{K)-BE(M3)
BE(K)-BE(N2+3)
BE(K)-BE(M2)
BE(K)-BE(Nx+5)
BE{K}-BE{M4+5)
BE(K)-BE(0+...)
The most prominent K x-ray components are designated
Classical designatlon (Siegbahn notation)
Kai
Ka2
K
\\'ł4
Columns 2-5 of Table 10 give the energies (in keV) and relative intenslties of the Ka2, Kal, K^,', and Ka2‘ iines. Energies are given in boidface type, followed by intenslties normeiized to 100 for ihe Kal linę. The energies of'the Ka, and Kal lines are taken from the tables of Bearden.^ They have been rounded so that the uncertainty In the last digit is £5 unlts. The energies of the enmp!ex Kgt' and Ka2’ lines are approximate weighted averages of the components, which can be separaled only by Instruments of high resolving power. For Zi93 the energies given are binding energy differences from Table 9.
The re!ative intenslties are adjusted experlmental values (and interpolations) from the tables of Salem, et al.*^ Ka2/Kal values appear to be uncertain by <1% at Z -20, increasing to «2% for high Z; Kfil’/Kal values appear to be uncertain by about 5% (sllghtly morę for Z<20); Ka3/Kas values are apparently accurate to »5%.
For Z&82 the Kat and components of Kai' are given separately. The weak Kas component (not fncluded) is about 1.5% of the total Ka intensity for Pb (Z=B2) and B% for U (Z=92). The weak, forbldden component Ka3 (K-Lt) is likewise not given; its Intensity varies from 0.01% of Kfll for Nd (Z~60) to 0.2% for U (Z=92).
The last column of Table 10 glves the K-fluorescence yield, wK. These data were calculated by Bambynek, et ai.(3> from a semi-empiricai formula. Uncertainties In wK vary from »25% for the lightest elements to «5% at Z=25 and wl-2% for the heaviest elements.
|
Z |
El |
Ka2 |
K«. |
V |
WK |
Z |
El |
K.t |
KPi' |
V |
“k | ||
|
3 |
U |
0.0543 |
33 |
As |
10.5080 |
10.5437 |
11.72 |
11.86 |
0.567 | ||||
|
4 |
Be. |
0.108 |
51.4 |
(100) |
23.0 | ||||||||
|
5 |
B |
0.183 |
34 |
Se |
11.1814 |
11.2224 |
12.49 |
12.6$ |
0.596 | ||||
|
6 |
c |
0.277 |
51.5 |
(100) |
23.8 | ||||||||
|
7 |
N |
0.392 |
35 |
Br |
11.8776 |
11.9242 |
13.29 |
13.47 |
0622 | ||||
|
8 |
O ; |
0 525 |
51.6 |
1100) |
24.0 . | ||||||||
|
9 |
F |
0.577 |
36 |
Kr |
12.598 |
12.649 |
14.11 |
14,32 |
0.648 | ||||
|
10 |
Ne |
0.8488 |
51.7 |
(100) |
24.2 |
1.9 | |||||||
|
11 |
Ne |
1.0410 ■ • |
37 |
Rb |
13.3358 |
13.3953 |
14.96 |
15.19 |
0.669 | ||||
|
12 |
Mg |
1.25360 |
1.30Z |
51.9 |
(100) |
24.3 |
2,5 | ||||||
|
' (150) |
1.9 |
38 |
Sr |
14.0979 |
14.1650 |
15.83 |
16.08 |
0.691 | |||||
|
13 |
Al |
1.48627 |
1.48670 |
1.5574 |
0.0357 |
52.0 |
II00) |
24.4 |
3.0 | ||||
|
(150) |
2.8 |
39 |
Y |
14.8029 |
14.9584 |
16.73 |
17.02 |
0.711 | |||||
|
14 |
Si |
1.73938 |
1.73998 |
1.8359 |
0.0470 |
52.1 |
(100) |
24.8 |
3.4 | ||||
|
(150) |
4.0 |
40 |
Zr |
15.6909 |
15.7751 |
17.66 |
17.97 |
0.730 | |||||
|
15 |
P |
2.0127 |
2.0137 |
2.139 |
0.0604 |
52.3 |
(100) |
25.2 |
3.7 | ||||
|
(150) |
5.9 |
41 |
Nb |
16.5210 |
16.6151 |
18,62 |
18.95 |
0,748 | |||||
|
16 |
S |
2.30664 |
2.30784 |
2.464 |
0.0761 |
52.4 |
(100) |
25.6 |
3.9 | ||||
|
(150) |
8.6 |
42 |
Mo |
17.3743 |
17.47934 |
19.80 |
19.97 |
0.764 | |||||
|
Cl |
2.6208 |
2.8224 |
2.816 |
0.0942 |
52.5 |
(100) |
25.9 |
4.1 | |||||
|
(150) |
12.0 |
43 |
Tc |
18.251 |
18.367 |
20.61 |
21.01 |
0.779 | |||||
|
18 |
Ar |
2.95563 |
2.95770 |
3.191 |
O.t 15 |
52.8 |
(100) |
26.3 |
4.3 | ||||
|
(150) |
15.B |
44 |
Ru |
19.1504 |
19.2792 |
21.65 |
22.07 |
0.793 | |||||
|
19 |
K |
3.3111 |
3.3138 |
3.590 |
0.138 |
52.7 |
(100) |
26.7 |
4.5 | ||||
|
(150) |
17.9 |
45 |
Rh |
20.0737 |
20.2161 |
22.72 |
23.17 |
0.807 | |||||
|
20 |
Ca |
3.68809 |
3.09168 |
4.013 |
0.163 |
52.8 |
(100) |
27.0 |
4.6 | ||||
|
50.2 |
(100) |
19.2 |
46 |
Pd |
21.0201 |
21.1771 |
23.81 |
24.30 |
0.8 IB | ||||
|
21 |
Sc |
4.0861 |
4.0906 |
4.46 |
0.190 |
52.9 |
(100) |
27.3 |
4.8 | ||||
|
50.3 |
(100) |
19.7 |
47 |
Aa |
21.9903 |
22.16292 |
24.93 |
25.46 |
0.830 | ||||
|
22 |
Ti |
4.50486 |
4.51084 |
4.93 |
0.219 |
53.0 |
(100) |
27.3 |
50 | ||||
|
50.3 |
(100) |
20.1 |
43 |
Cd |
22.9841 |
23.1736 |
26,09 |
26.04 |
0.840 | ||||
|
23 |
Va |
4.94464 |
4.95220 |
5.43 |
0.250 |
53.2 |
(100) |
27.3 |
5.3 | ||||
|
50.3 |
(100) |
20.2 |
49 |
In |
24.0020 |
24.2097 |
2727 |
27,86 |
0.B50 | ||||
|
24 |
Cr |
5.40551 |
B.41472 |
5,95 |
0.282 |
53.3 |
(100) |
27.6 |
5.4 | ||||
|
E0.4 |
(100) |
20.3 |
50 |
Sn |
25.0440 |
25.2713 |
28.48 |
29.11 |
0.059 | ||||
|
25 |
Mn |
5,88765 |
5.89875 |
6.49 |
0.314 |
53.4 |
(100) |
28.2 |
5.5 | ||||
|
50.5 |
(100) |
20.3 |
51 |
Sb |
26.1106 |
26.3591 |
29.7 |
30.4 |
0.867 | ||||
|
26 |
Fe |
6.39084 |
6.40384 |
7.00 |
0,347 |
53.6 |
(1001 |
28.5 |
5.6 | ||||
|
50.6 |
(100) |
20.3 |
52 |
Te |
27.2017 |
27.4723 |
31.0 |
31.7 |
0.875 | ||||
|
27 |
Co |
691530 |
6.93032 |
7,65 |
0.381 |
53.7 |
(100) |
28.8 |
5.3 | ||||
|
50.7 |
(100) |
20.3 |
53 |
1 |
28.3172 |
28.6120 |
32.3 |
33.0 |
0882 | ||||
|
28 |
NI |
7.46089 |
7.47815 |
8,28 |
0.414 |
53.8 |
(100) |
29.0 |
6.1 | ||||
|
50.8 |
(100) |
20.4 |
54 |
Xe |
29.458 |
29.779 |
33.6 |
34.4 |
0.88B | ||||
|
29 |
Cu |
8.02783 |
8.04778 |
8.91 |
0.445 |
53.9 |
(100) |
29.3 |
6.4 | ||||
|
50.9 |
(100) |
20.6 |
55 |
Cs |
30.6251 |
30.9728 |
35.0 |
35.8 |
0.895 | ||||
|
30 |
Zn |
8.61578 |
8.63886 |
9.57 |
9.66 |
0.479 |
54.1 |
(100) |
29.5 |
6.7 | |||
|
51.0 |
(100) |
20.8 |
56 |
8a |
31.8171 |
32.1936 |
36.4 |
37.3 |
0.901 | ||||
|
31 |
Ga |
9.2248 |
9.2577 |
10.26 |
10.37 |
0.510 |
54.3 |
(100) |
29.6 |
7.0 | |||
|
51.1 |
(100) |
21.5 |
57 |
La |
33.0341 |
33.4418 |
37.8 |
36.7 . |
0.906 | ||||
|
32 |
Ge • |
•• - 9.8553 |
9.B864 - |
10.98' - |
11.1 o;;: |
0.540 .. |
54.4 ........ |
. . (100) |
29.7 ...... |
7.3 | |||
51.3 .......... (1001 . 22.2
Wyszukiwarka
Podobne podstrony:
promieniowanie�9 Appendices - 12 Table 10. K x-rays: energies, relatlve intensities, and ffuoresccnc
DSC00026 (4) Chapter 10. APPENDIX TO LABORATORY i 10.5. Writing programs from the signai diagrams kC
00146 &5dd89e4c9f1d1c9b9ade934fbf44bb 147 Optimization and Sensitivity Analysis Table 10. Compariso
IMG$77 7 1 10 118 5 9 ____ 4 1 12 f 3 1 2 1 6 5 2 1 4 1 8 1 3 1 1 1 11
IMG?88 PRZYKŁAD 4.11 Obliczyć roczne straty energii czynnej w napowietrznej linii trójfazowej o napi
AGH, nr planu koordynacyjnego 5/321/11 z dnia 10 VI1981 r. W ich trakcie przebadano 635 prób warzyw,
P 11 110713�6 10 10 GROSZY11. 20 GROSZY 0 20 mm 2,97 g rant gładki 1923 Zn 40 025
56 Table 2.1 Sample sizes presented relative to the number of capture per bird. 1 Number of
więcej podobnych podstron