00455 Mae7911ed8149972f2d9d752b7ff4b2
460
Russell
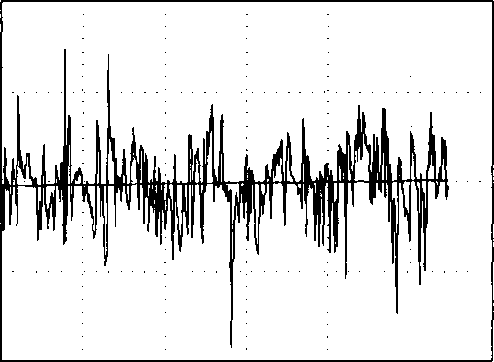
The Yarian Data Set
Time Plot
1.0 tt.7
200.1 2(6.7 ttt.t 401.0
Tl ino
Figurę 20. A time order plot of the Varian SPC data. The data consists of averages of nine measurements.
Yarian SPC data
Tlm Plot_ T\Plot
|
( |
- |
Im .i ii .. i . i . 1 . |
|
ll“l‘|!ul'l|l‘ u "H|i|||i||"|i||i‘"‘ " ' |
i |
. ' ' ,II I ,T|111|| I | ■ ...... |
Ul ii X-«tt Lii ii x-«m
Figurę 21. The plot on the left is of the autocorrelations and the plot on the right is of the partial autocorrelations of the Yarian SPC sputterer data.
Wyszukiwarka
Podobne podstrony:
00452 [b83fbdf33219bc7f51baecf023d533 A Graphical Aid for Analyzing Autocorrelated Dynamical System
00450 Tfcdd17b63a13cc1b464032a941c721 A Graphical Aid for Analyzing Autocorrelated Dynamical System
00457 ?c9724a5349b9ca020fa0b800a81195 462 Russell The Geophysical Sonic Log Data Set The author s f
Data Set If you selected morę than one data set to search. use the dropdown to see the search result
OulT4.0.0 PayPal Donatę Idle Oh Om Os min at the beginnmg min at the end Large Data Set Intel(R)
00065 ndb3dfcfa3fd16c12bb4b6de5950d85 64 Hembree & Zimmer X where Y, is the entire data sample
00463 bcaec2dfad584cf6031b64ffdea014 468 Russell The second segment is of shorter duration than th
IMGR33 (2) GILDING AND TECHNIQUES OF DECORATION sunulatcd in che woodcn moulds. When complctcd the w
Effect Of Dividends On Stock Prices 12 4. Research Methodology This paper has used the Panel data ap
27ddg05 llVisual Basic 4.0 SetupWizard - Ślep 2 of 7 ES Would you like to distribute any of the fol
and rcstructure the display. Data analysis is quick and casy. Inter-val time measurements can be pcr
17 and budgets based on submissions from Research Program Coordinators and Statlon Hanagers. The pro
13 Anthropogenic changes in the suspended.. DATA USED AND CALCULATION METHODS Analysis of the presen
więcej podobnych podstron