8083678566
FlNANCING RENEWABLE ENERGY PROJECTS THROUGH REGIONAL OPERATIONAL PROGRAMMES
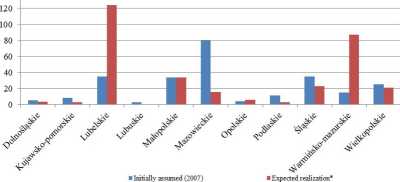
Figurę 4. Additional installed capacity of renewable energy sources co-fmanced from regional operational programmes 140 -i-

Source: specifications of the regional operational programmes for 2007-2013; Reports on implementation of the regional operational programmes for 2007-2013.
There are 3 regional programmes where the indicators related to energy production from renewable sources are reported (Table 4). Hence, it is possible to estimate CO2 emission savings. As one can see in warmińsko-mazurskie voivodship initiatives resulted in avoided emissions of about 6.3 percent. This should be interpreted with caution as the warmińsko-mazurskie region is dependent on extemal energy supplies (Zarząd Województwa Warmińsko-Mazurskiego 2007).
Table 4. Additional energy production from renewable sources (MWh per annum)
|
Voivodship |
Expected energy production from installations supported (GWh per annum) |
Estimated C02 emission savings (thousand tonnes) |
% of total annual C02 emissions in a voivodship |
|
Dolnośląskie |
33.7 |
27.4 |
0.2 |
|
Warmińsko- Mazurskie |
123.1 |
100.0 |
6.3 |
|
Zachodniopomorskie |
256.3 |
20.1 |
2.2 |
Źródło: specifications of the regional operational programmes for 2007-2013; Reports on implementation of the regional operational programmes for 2007-2013; Bank Danych Lokalnych.
According to some evaluation studies of the regional operational programmes the impact of the support on increasing the production of energy from renewable sources is important (Fundeko Korbel, Krok-Baściuk Sp. J. 2014). However it is sometimes assumed that climate and
135
Wyszukiwarka
Podobne podstrony:
FlNANCING RENEWABLE ENERGY PROJECTS THROUGH REGIONAL OPERATIONAL PROGRAMMES Projects that could be s
FlNANCING RENEWABLE ENERGY PROJECTS THROUGH REGIONAL OPERATIONAL PROGRAMMES Przewodnik po kryteriach
FlNANCING RENEWABLE ENERGY PROJECTS THROUGH REGIONAL OPERATIONAL PROGRAMMES3. Renewable energy proje
FlNANCING RENEWABLE ENERGY PROJECTS THROUGH REGIONAL OPERATIONAL PROGRAMMES were awarded to municipa
FlNANCING RENEWABLE ENERGY PROJECTS THROUGH REGIONAL OPERATIONAL PROGRAMMES (Zarząd Województwa Lube
Michał PTAK Figurę 3. Number of projects on renewable energy supported through regional operational
Michał PTAK Figurę 2. The structure of the support for renewable energy sources provided by regional
Biuletyn Nabytków CBS Mediun-term renewable energy market report 2012 : market trends and projection
Biuletyn Nabytków CBS Mediun-term renewable energy market report 2012 : market trends and projection
Uniwersytet Ekonomicznywe WrocławiuKatedra Gospodarki Regionalnej RAMOWY PROGRAM KONFERENCJI Wtorek,
Michał PTAK regulations affecting the energy sector and about price of green certificates which rene
Michał PTAK zloty) were implemented at a central level under the Operational Programme Infrastructur
Projekt współfinansowany jest ze środków Europejskiego Funduszu Rozwoju Regionalnego w ramach Progra
% Projekt współfinansowany ze środków Europejskiego Funduszu Rozwoju Regionalnego w ramach Programu
IT Project Manager Koncpecja kształcenia Program studiów podyplomowych w specjalności IT Project Man
402 TA BI- 1.1(391). PKODlkCJA ENERGII ODNAWIALNEJ WFDł.Tfr. ŹRÓDEŁ PRODUCTIO.K OF RENEWAPLE ENERGY
evropskA unie Evropsky fond pro regionalni rozvoj lntegrovany regionalni operaćni program MINISTERST
Ertckwnki*z €kvib€r Humaneróforras-fejlesztesi Operativ Program Agardy Gyula - Lublóy
więcej podobnych podstron