3850953064
D f'gure 1
File Edit View Insert Tool: Desktop Window Help
Dl^HS li 81^08 « 00 o □

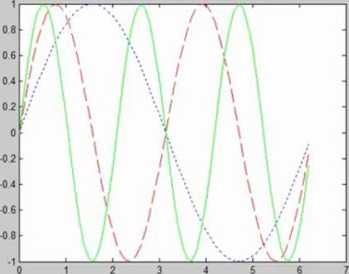
% define x x=[O:O.1:2*pi];
% compute yl, y2 and y3 yl=sin(x); y2=sin(2*x); y3=sin(3*x) ;
% open a figurę window % and plot the trig functions figurę
plot(x,yl,'b:'); hołd on
plot (x,y2 , 'r— ') ; hołd on plot (x,y3 , 'g- ') ; axis([0 4*pi -2 2]);
legend('sin(x)','sin(2x)','sin(3x)');
xlabel('elements in vector x')/
ylabel('elements in vector yl, y2 and y3');
title('The sine function at different frequencies');
grid on
Plot a graph using variable x for the x-coordinates, y3 for the y-coordinates, and 'g-' to define a solid green linę.
Wyszukiwarka
Podobne podstrony:
wykresy1 s Figurę 1 File Edit View Insert Tools Desktop Window Help
wykresy2 a File Edit View InsertFigurę 3 Tools Desktop Window Help o X Pole-Zero Map 0.025 0.02 -0.0
wykresy3 Figurę 3 X □ □ File Edit View Insert Tools Desktop Window Help o Pole-Zero Map
wykresy4 aFigurę 1□x File Edit View Insert Tools Desktop Window Help * □ a y & a □ 13 o 0
rekursywnyB □ File Edit View Insert Tools Desktop Window Help -a File Edit View Insert Tools Desktop
Figurę 2□d)® File Edit View Insert lools Desktop Window Help Sygnał zrodlowy
Figurę 2 □Ul® File Edit View Insert lools Desktop Window Help P i5 A & k * - © v. & • a
T^JiiP.ure : File Edit View Insert lools Desktop Window Help □o® Sygnał zrodlowy Funkcja autokorelac
^ Figurę 3 File Edit View Insert lools Desktop Window Help Sygnał zrodlowy Funkcja autokorelacji
Figurę 7 □Ul® File Edit View Insert lools Desktop Window Help P i5 A k * - © v. s. ■ a □ ini
^ Figurę 7 File Edit View Insert lools Desktop Window Help Sygnał zrodlowy 61-1-1-1- 4 -2 -oL__I__ 0
więcej podobnych podstron