3513659538
i
(month)
i
WT
KO
Molo
Femolo
B
Małe
Female
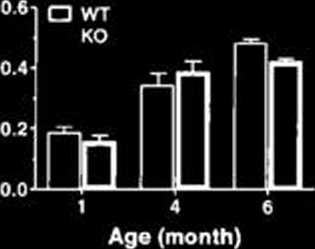
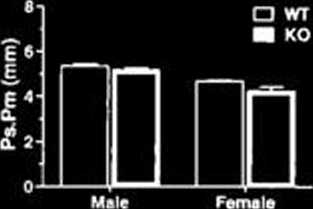
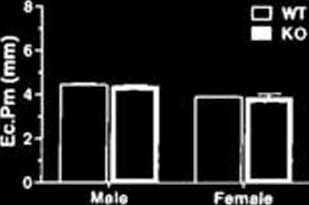
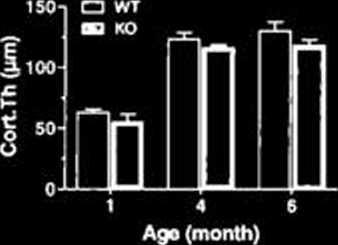
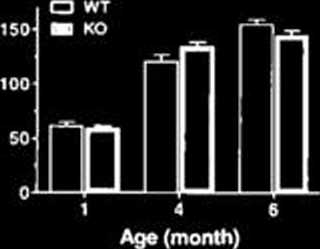
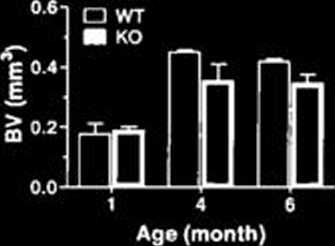
Figurę 2.3 : Microarchitecture analysis of cortical femoral bonę of WT and Cd36KO mice
A) Representative 3D microCT images of cortical bonę in the femurs of 1 to 6 month female mice. B) Bonę volume (BV), C) cortical thickness (Cort.Th), D) periosteal perimeter (Ps.Pm) and endocortical perimeter (Ec.Pm) of cortical portion from femurs of 1 month małe and female WT and Cd36KO mice. Values are means ± SEM from 6-14 mice per group of age.
Wyszukiwarka
Podobne podstrony:
F00574 003 f007 □ oo 0 d. 50 y Małe. female. unknown sex Clinically affected (specify condition in k
01ccw06 Małe Female
image102 Fig. 82. Fischerinsel. The female figurę, a - the front view, b - the side view. After E. G
kolibry II (1) Broad-Tailed (Małe & Female) Design found on pages 3 & 4. Fuli Crosses
Ageinyears Pri n ci pal c au se of death Małe Female 5-9 Transport accidents 10-14 Transport
essent?rving?28 E S S E N T I A L W O O D C A R V I N G T E C H X I Q f E S FlCS 12,1 -12.4 Female f
eu gender?u loca Gentlei Education Małe Female No College Some College Graduate
australia gender?u loc Geiulei Education Małe Female No College Some College Graduate
afryka gender?u loca GendeiEducation Małe Female No College Some College Graduate
więcej podobnych podstron