5192606014
pik Edycja ffiidok Historia Zakładki fjareędzia Pomo£
|;jart%3A10.1007%2Fsl0856-010-4... ♦
◄i 1 rj. dow.-i o.^i springer.com fta;:c.pr;- lbi:.i.t ^b3A10 1007<*252F5l08S6-010-4194-2.pdf?auth66-1396129646_aa6c4S2c3dM3S9dOcl55a6cC ▼ O | |Ot O-JCkGuckGo O? {} A
•‘r; Czosto odwiedza... ▼ Linux Mint Community = Forums Błog gjNews*
|
4- Strona: |
6 |
z 10 - |
■f Skala automatyczna : |
i »

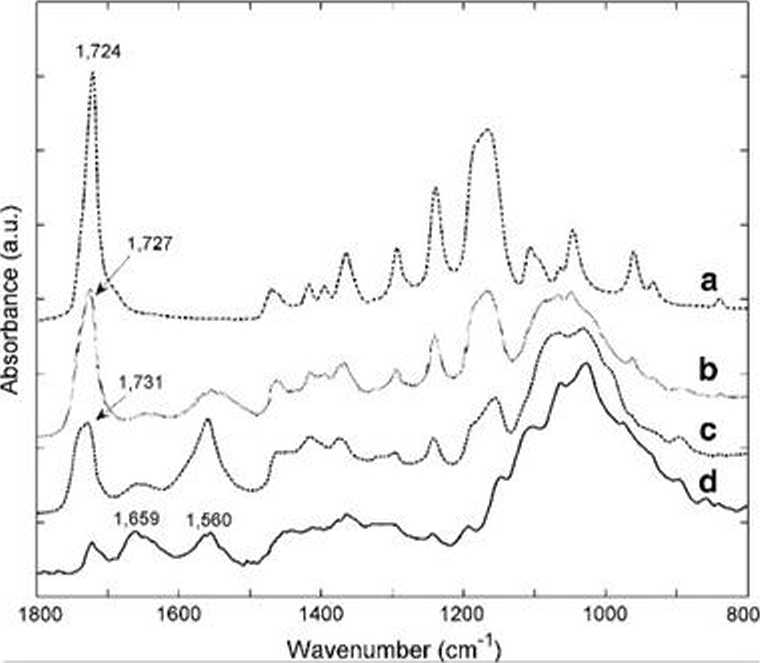
Fig. 5 ATR-FTIR spectra of a pure PCL b chitosan/PCL (50/ 50 wt%) c chitosan/PCL (75/25 wt%) and d pure chitosan
O Menu Q
|
1 |
9fcfd50bde... j |
|L |
IR-Introduct... 1, |
Ę Fabrkation ... j. 'Niezapisan... 1.1_j Bez tytułu 1... [j *** Połymer Ide... |t Lj Bez tytułu 1... l |f art%3A10.1... ^ D czw 27 mar, 22:51
detector. The integrated absorbance of characteristic band for each compound was plotted to denionstrate its distribu-tion in a compcgite. It is critical to identify characteristic spectral bands for each component that can be used for constructing images for the distribution of a specific poly-mer. The amide II band at 1,560 cm-1 (rangę used forgen-erating the image was 1.617-1,490 cm-1) and the carbonyl band at 1,727 cm”1 (1,740-1.710 cm-1) were used to characterise chitosan and PCL, respectively. The surfactant span-80 (5 v/v%) which was used as the emulsifier in this study was also detected within wavenumbers ranging from 1.750 to 1,735 cm As shown in Fig. 6. the distribution of chitosan and PCL in both 25 and 50 wt% PCL composites was uniform at both surface and cross sections. Comparing the images generated for the specimen containing 25 wtc/c PCL to the one with 50 wt% PCL. the reduction in amide II group absorbance was observed. which was attributed to the decrease of the eontent of chitosan in the blends. Meanwhile the absorbance of the corresponding band of PCL was
Wyszukiwarka
Podobne podstrony:
art%3A10.1007%2Fsl0856-010-4194-2.pdf- Mozilla Firefox pik £dycja 5#idok Historia Zakładki Narzędzia
index 2 ® Mozilla Firefox *iMx Plik Edycja Widok Historia Zakładki Narzędzia Pomoc O lŁT Ć]
! 3 Kubuś Puchatek - Mozilla Firefox JSJxJ Plik Edycja Widok Historia Zakładki Narzędzia Pomoc • ©
Cwiczenie-20 - Mozilla Firefox I o i Cwiczenie-20Plik Edycja Widok Historia Zakładki Narzędzia Pomoc
50 W O YOACAP Online Coverage Area Maps - Mozilla Firefox 01 Plik Edycja Widok Historia Zakładki Nar
firefox bmp abouticonfig - Mozilla Firefox BM Plik Edycja Widok Historia Zakładki
l^MIMUW - Strona Główna - Mozilla Firefox ,jnjxj Plik Edycja Widok Przejdź Zakładki Narzędzia Pomoc3
p) RapidShare AG, Cham, Switzerland - Mozilla Firefox EJ@L Plik Edycja Widok Histo
dyski 03 O Dysk Twardy - Mozilla Firefox .Jej*! Plik Edycja Widok Przejdź Zakładki Narzędzia Pomoc€&
O Login Zimbra - Mozilla Firefox Pik Edycja Widok Historia Zakładki Narzędzia Pornos’ O X aj
zadanie13 O Mozilla Firefox Plik Edycja Widok Historia Zakładki Nć < jao-lab6.pdf... . j file:/
zadanie14 O Mozilla Firefox Plik Edycja Widok Historia Zakładki Nć jao-lab6.pdf... file:/...h.xml *
zadanie15 O Mozilla Firefox Plik Edycja Widok Historia Zakładki Nć jao-lab6.pdf... file:/...h.xml *
sim sin1 I® cwiczenie_1.pdf (Obiekt application/pdf) - Mozilla Firefox Plik Edycja Widok Historia Za
instalacjac ^ oryginalinstal.pdf (Obiekt application/pdf) - Mozilla Firefox Plik Edycja Widok Histor
więcej podobnych podstron